
General Awareness · SSC CGL Notes
Economic awareness — SSC CGL General Awareness Notes
Free SSC CGL notes with rules, shortcuts, worked examples and practice questions for every topic. 60 topics.
Open in the interactive reader: bookmarks, progress tracking and read-aloud.
Basic economic concepts and indicators
Separate stock from flow, nominal from real values, and price change from quantity change.
Concepts and method
GDP measures the value of final goods and services produced within a territory over a period. Inflation is a sustained rise in the general price level; unemployment concerns people willing and able to work who lack work. Fiscal policy uses government revenue and expenditure, while monetary policy is associated with money and credit conditions.
Example 1
A rise in the price of the same basket can increase nominal value without proving that real output increased.
Example 2
A budget deficit is a flow measured over a period; public debt is a stock accumulated at a point in time.
Example 3
If prices rise while output is unchanged, nominal GDP may rise even though real GDP does not.
Common errors
Do not treat GDP as a measure of welfare alone, or confuse inflation with a one-time rise in one item’s price.
Revision
For each indicator write its unit, time reference, and what it does not measure.
Indian economic institutions and development
Match institutions with their mandates and distinguish growth, distribution, stabilisation and financial regulation.
Concepts and method
The Reserve Bank of India conducts monetary policy and regulates banking functions. The Finance Commission recommends tax devolution between the Union and States. NITI Aayog is a policy think tank, while the Union Budget presents the government’s annual financial statement and proposals.
Example 1
A change in policy interest rates belongs to the monetary-policy channel; a change in government taxation is fiscal policy.
Example 2
Tax devolution is a Union–State fiscal relationship, whereas a bank’s liquidity regulation is a central banking function.
Example 3
Economic growth can coexist with unequal distribution; development questions require more than one indicator.
Common errors
Do not assign the Finance Commission’s devolution role to RBI, or treat NITI Aayog as a constitutional finance-distribution body.
Revision
Create an institution–instrument–level–objective table before answering matching questions.
Introduction to Economics
Economics is derived from the Greek term ‘Oikonomikos’ meaning household management. It studies how goods and services are produced, distributed, and consumed, and the role of the state in regulating and supporting the economy.
Meaning of Economics
The word 'Economics' comes from the Greek words ‘Oikos’ (meaning household) and ‘Nomos’ (meaning management or rules).
At its core, Economics originally meant household management, but in modern times it refers to the study of how societies manage scarce resources to satisfy unlimited human wants.
Economics studies three main aspects: production (how goods and services are created), distribution (how income and resources are shared), and consumption (how goods and services are used to fulfill needs).
Example: A farmer producing wheat (production), selling it in the market to earn income (distribution), and households buying bread made from that wheat (consumption).
Significance of Economics
Economics helps us understand how institutions (like banks, companies, or governments) and technology (like computers, AI, or machines) influence prices and the allocation of resources.
It studies financial markets: how interest rates affect borrowing and investment, and how stock prices reflect company performance.
It examines the distribution of income—who earns more, who earns less—and suggests ways to reduce inequality.
It analyses trade between nations, the benefits of free trade, and the negative impacts of trade barriers like tariffs or quotas.
Example: When a government imposes import duties on foreign cars, domestic car manufacturers may benefit, but consumers face higher prices.
Economic Activities
Production: The process of adding value to raw materials by using factors of production such as land, labour, capital, and entrepreneurship. Example: Turning cotton into cloth.
Distribution: The process by which the income generated in production is shared among landowners (rent), workers (wages), capital providers (interest), and entrepreneurs (profit). Example: A company distributing its earnings as salaries and dividends.
Consumption: The use of goods and services to satisfy human needs and wants. Example: A household buying milk for daily use.
Role of State in Economy
Regulator: The government makes laws and policies to regulate the economy (e.g., fixing minimum wages, regulating banks).
Producer/Supplier of private goods: The state may directly produce goods like steel, electricity, or transport services.
Producer/Supplier of public goods: Public or social goods like roads, defense, education, and healthcare are supplied by the state as they benefit society as a whole and cannot be left only to private producers.
Definitions of Economics
Adam Smith (Wealth Definition): In his book ‘The Wealth of Nations’ (1776), he defined economics as the science of wealth—focusing on how nations accumulate and grow wealth. Criticism: It considers wealth as the ultimate goal, ignoring human welfare.
Alfred Marshall (Welfare Definition): In his book ‘Principles of Economics’ (1890), he said economics is the study of mankind in the ordinary business of life, focusing on human welfare. Criticism: It emphasizes only material goods, neglecting immaterial services like teaching or healthcare.
Lionel Robbins (Scarcity Definition): In his book ‘Nature and Significance of Economic Science’ (1932), he defined economics as the science of human behaviour as a relationship between ends (unlimited wants) and scarce means (limited resources) with alternative uses. Criticism: This definition ignores economic growth and development issues.
| Economist | Definition | Criticism |
|---|---|---|
| Adam Smith | Science of wealth; focus on national wealth. | Wealth treated as an end. |
| Alfred Marshall | Study of mankind in ordinary business of life. | Ignores immaterial services. |
| Lionel Robbins | Study of human behaviour as relationship between ends and scarce means. | Excludes growth and development. |
Prelims tips
- Economics = Oikonomikos (Greek).
- Adam Smith = Wealth definition (1776).
- Alfred Marshall = Welfare definition.
- Lionel Robbins = Scarcity definition.
- Economic activities : Production, Distribution, Consumption.
Mains points
- Economics studies production, distribution, and consumption of resources.
- Helps analyse markets, income distribution, and trade patterns.
- State plays role as regulator, producer, and supplier of goods.
- Different definitions (Wealth, Welfare, Scarcity) show evolution of the subject.
- Understanding limitations of each definition is essential for economic analysis.
Basic Concepts in Economics
Economics studies goods, services, and utility. Goods and services satisfy human wants, and utility refers to the want-satisfying power of a commodity. Goods are classified into free, economic, public, private, consumer, and capital goods.

Goods and Services
Goods and services are the basic objects of economic study because they satisfy human wants and needs.
In Economics, the term 'goods' is used in a broader sense and it includes not only physical products (like food, clothes, cars) but also 'services' (like teaching, medical treatment, transport).
Example: When you buy a mobile phone, it is a good . When you pay for internet services, it is a service . Both together help in fulfilling different types of human wants.
Types of Goods and Services
Free Goods: These are naturally available in abundance and people do not need to spend money to use them. Example: Air, sunlight, rainwater in open fields.
Economic Goods: These are limited in supply, not freely available, and require payment to be obtained. Example: Cars, refrigerators, smartphones.
Public Goods: Goods that are available for everyone to consume, regardless of whether they pay or not. They are non-excludable (cannot stop anyone from using) and non-rival (one person’s use does not reduce another’s). Example: National defence, law and order, street lighting.
Private Goods: Goods that are consumed individually by people or households. If one person consumes them, others cannot. Example: Food, clothes, furniture.
Consumer Goods: Goods that are purchased for direct consumption and not used further for production. Example: Bread, milk, shoes, washing machine (durable goods last long; non-durable like milk are consumed quickly).
Capital Goods: Goods used in producing other goods and services. They are not for direct consumption but for production purposes. Example: Factory machines, tools, tractors used in farming.
Concept of Utility
Utility means the capacity of a good or service to satisfy human wants. It is the satisfaction or benefit derived from consuming a product.
Example: A glass of water gives utility to a thirsty person but may not give the same utility to someone who is not thirsty.
Characteristics of Utility
Psychological: Utility depends on individual preference and mindset. What is useful for one person may not be for another. Example: A vegetarian derives no utility from chicken, but a non-vegetarian does.
Not the same as Usefulness: A product may give satisfaction even if it is harmful. Example: A cigarette gives utility to a smoker, though it is harmful for health.
Not the same as Pleasure: Utility is about want-satisfaction, not necessarily happiness. Example: Drinking bitter medicine may not give pleasure but gives utility as it cures illness.
Diminishing Utility: As a person consumes more units of a commodity, the extra satisfaction from each additional unit decreases. Example: The first slice of pizza gives high satisfaction, but the fifth or sixth gives less.
Subjective Concept: Utility cannot be measured in numbers, as it varies from person to person. Example: The satisfaction a smoker gets from a cigarette cannot be exactly measured or compared with another person.
| Type | Description | Example |
|---|---|---|
| Free Goods | Abundant, no cost to use | Air, Sunshine |
| Economic Goods | Scarce, require payment | Cars, Refrigerators |
| Public Goods | Available for all, irrespective of payment | National defence, Law enforcement |
| Private Goods | Consumed by individuals/households | Food, Drinks |
| Consumer Goods | Used for final consumption | Durable, Non-durable goods |
| Capital Goods | Used in production of consumer goods | Machinery in factories |
Prelims tips
- Free goods are abundant, no cost (e.g., air).
- Economic goods are scarce, need money (e.g., cars).
- Public goods : non-excludable, non-rivalrous (e.g., defence).
- Utility is subjective and psychological.
- Law of diminishing marginal utility : utility decreases as consumption increases.
Mains points
- Goods and services form the basis of economic study.
- Classification of goods helps in policy-making (public vs private, consumer vs capital).
- Utility explains consumer behaviour and demand theory.
- Utility is subjective, not measurable, and influenced by psychological factors.
- Law of diminishing utility plays a central role in consumer equilibrium.
Production Possibility Frontier (PPF) and Opportunity Cost
The Production Possibility Frontier (PPF) is a curve that illustrates the trade-offs facing an economy that produces only two goods. It demonstrates the fundamental economic problem of scarcity, choice, and opportunity cost. Any point on the PPF represents maximum efficiency and full employment of resources.
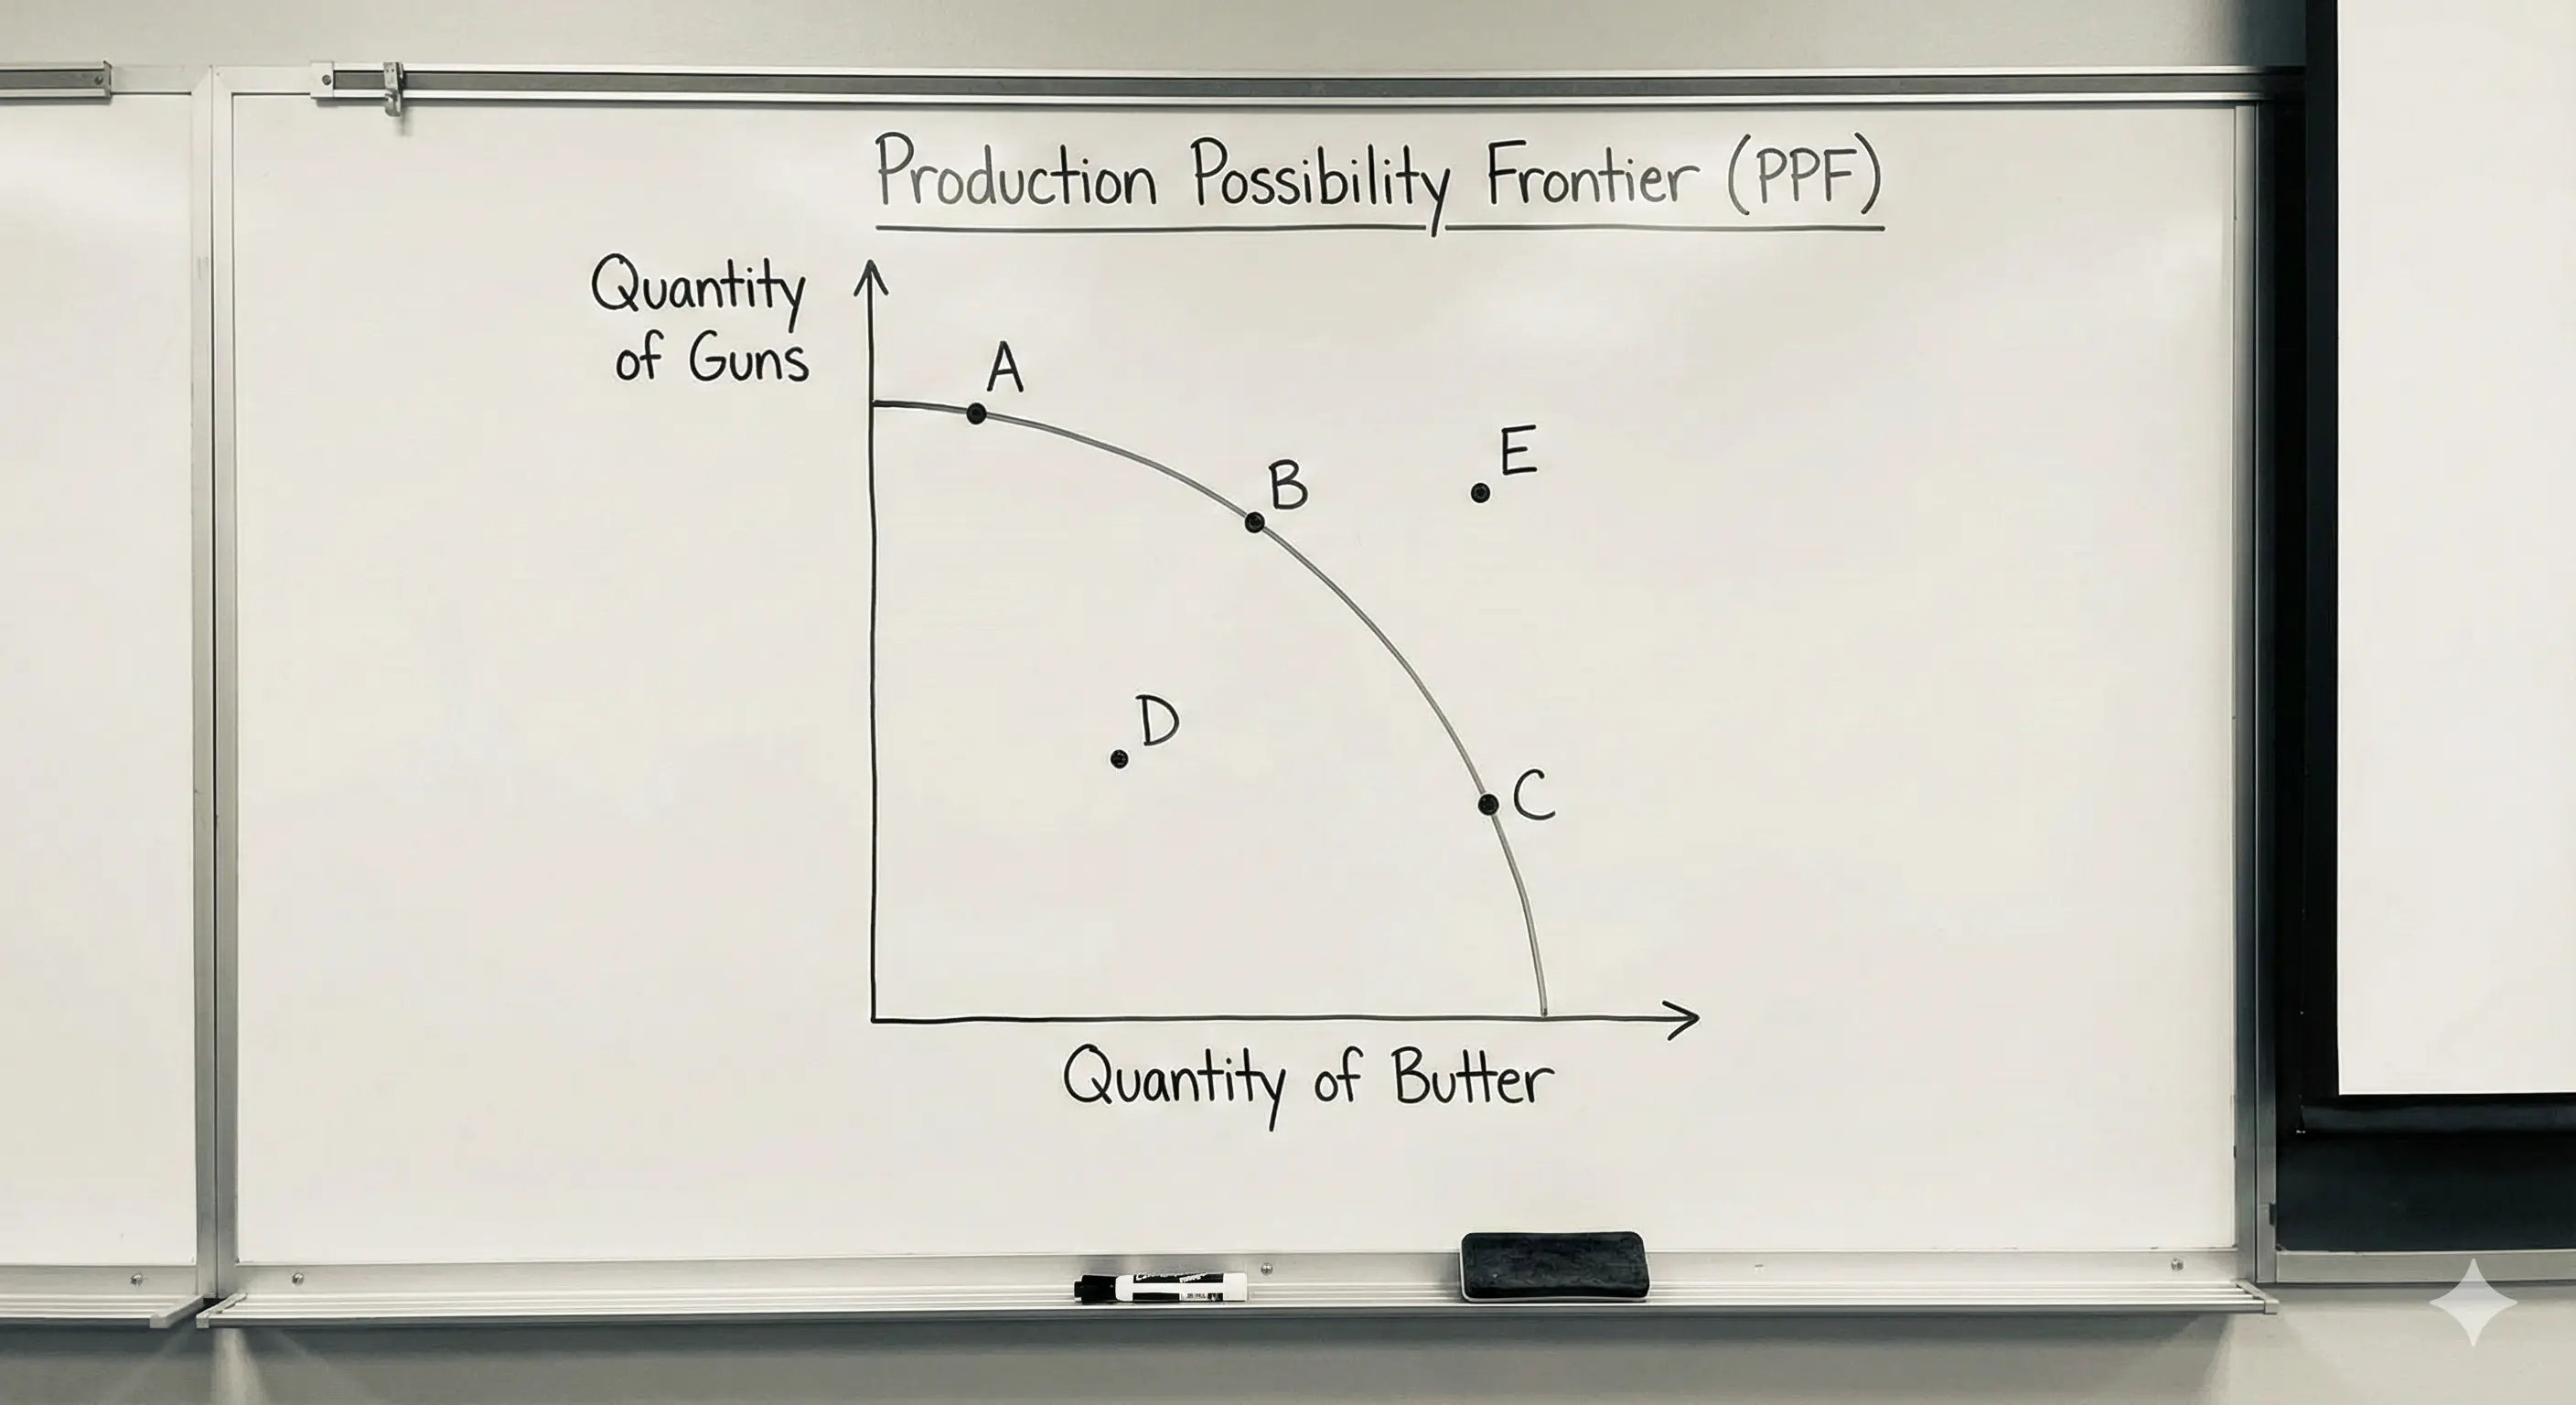
Concept of Production Possibility Frontier (PPF)
Definition: The PPF, also known as the Production Possibility Curve (PPC), shows the maximum amount of a pair of goods or services that can be produced with limited resources and given technology, assuming full employment of resources.
It graphically illustrates the core economic problems: scarcity (the boundary of the curve), choice (selecting a point on the curve), and trade-off (giving up one good for another).
Assumptions of PPF
The economy produces only two goods (e.g., Guns and Butter).
The amount of production resources (land, labour, capital, entrepreneurship) is fixed.
The technology remains constant.
Resources are fully and efficiently utilized.
Points on the PPF Curve
Points on the curve (A, B): Represent attainable combinations where resources are being utilized efficiently (full employment).
Points inside the curve (C): Represent attainable combinations where resources are being utilized inefficiently (underemployment or unemployment).
Points outside the curve (D): Represent unattainable combinations with current resources and technology (beyond the production capacity).
PPF and Opportunity Cost
The downward slope of the PPF demonstrates that in an economy of scarcity, producing more of one good requires reducing the production of another. This sacrifice is the Opportunity Cost .
Marginal Opportunity Cost (MOC): The amount of one good that must be given up to produce one additional unit of another good. It is measured by the slope of the PPF.
Most PPF curves are concave (bowed outwards) because MOC generally increases as more of one good is produced. This is due to the Law of Increasing Opportunity Cost, as resources are not perfectly substitutable.
Shift in PPF
Outward Shift: Indicates Economic Growth or an increase in the economy’s potential. This happens due to an increase in resources (e.g., new land discovery, population growth) or technological advancement.
Inward Shift: Indicates a decline in the economy’s potential, usually due to a decrease in resources (e.g., war, natural disaster) or technological regression.
| Location on Graph | Interpretation | Economic State |
|---|---|---|
| On the PPF curve | Efficient utilization of resources | Full employment |
| Inside the PPF curve | Inefficient utilization of resources | Unemployment/Underemployment |
| Outside the PPF curve | Unattainable combination | Beyond current potential |
Prelims tips
- PPF shows scarcity, choice, and opportunity cost.
- Points on PPF = Efficient/Full Employment.
- Concave PPF is due to increasing Marginal Opportunity Cost (MOC).
- Outward shift of PPF = Economic Growth (due to T-advancement or resource increase).
Mains points
- PPF is a simple model to explain the fundamental problem of choice under scarcity.
- The slope of the PPF measures the opportunity cost of producing one more unit of a good.
- It shows the trade-off between goods like 'Guns and Butter' (defence vs. welfare goods).
- PPF shifts are crucial to analyzing economic growth potential.
- Points inside the PPF highlight issues of unemployment and inefficient resource use.
Economic Systems
Economic system refers to the way individuals and institutions are linked to perform economic activities. The three main types are: Capitalist (private ownership and freedom), Socialist (public ownership and central planning), and Mixed (coexistence of private and public sectors).
Capitalist Economy
Private Ownership of Property: In a capitalist economy, resources such as land, factories, machines, and mines are owned by private individuals or companies. This encourages innovation and efficiency since owners aim to maximize profits.
Freedom of Choice and Enterprise: People are free to choose any occupation, trade, or business. Producers decide what to produce, how much to produce, and at what price to sell.
Profit Motive: Profit is the main driving force behind all economic activities. Producers focus on making goods and services that generate maximum returns.
Free Competition: Many buyers and sellers participate in the market. The government generally does not interfere, allowing prices to be determined by demand and supply.
Example: The United States is often considered a capitalist economy where private businesses dominate industries like technology, automobiles, and retail.
Socialist Economy
Public Ownership of Property: All factors of production (land, factories, natural resources) are owned by the state or community as a whole. This ensures that resources are used for social welfare, not private profit.
Central Planning: A central authority (like a planning commission) makes all major economic decisions, including what to produce, how much to produce, and how resources should be distributed.
Maximum Social Benefit: The goal is to ensure equitable development of society. Investments are planned so that everyone benefits rather than just a few individuals.
Equality of Opportunity: Free health, education, and training are provided by the state to ensure equal chances for all citizens.
Classless Society: There is no division between rich and poor, as economic resources are shared equally.
Example: The former Soviet Union and present-day Cuba are examples of socialist economies.
Mixed Economy
Ownership by Public and Private: In a mixed economy, resources and means of production are owned by both the government and private individuals. This allows the benefits of both systems.
Coexistence of Public & Private Sectors: The private sector runs businesses for profit, while the public sector focuses on welfare-oriented services like healthcare, education, and infrastructure.
Economic Planning: The central authority prepares plans and policies to guide overall economic development, but private businesses also play a big role in production.
Freedom with Control: Individuals and firms enjoy freedom to produce and trade, but government regulations ensure that activities are in the interest of society.
Example: India is a mixed economy where both private enterprises (like Reliance, Tata) and public enterprises (like Indian Railways, ONGC) operate together.
| Aspect | Capitalist Economy | Socialist Economy | Mixed Economy |
|---|---|---|---|
| Ownership of Property | Private ownership | Public ownership | Both public and private ownership |
| Decision Making | Decentralized, market-driven | Central authority plans | Combination of planning and market |
| Motive | Profit | Social welfare | Profit + Social welfare |
| Competition | Free competition | No competition (state monopoly) | Controlled competition |
| Equality | High inequality | Greater equality | Moderate equality |
Prelims tips
- Capitalism = private ownership + profit motive.
- Socialism = public ownership + central planning.
- Mixed economy = coexistence of public and private sectors.
- India follows a mixed economy model.
- Socialism aims at equality and classless society.
Mains points
- Economic system defines how resources are owned, allocated, and managed.
- Capitalism promotes innovation and competition but increases inequality.
- Socialism ensures welfare and equality but may reduce efficiency.
- Mixed economy balances profit motive with social justice.
- India’s economy is a practical example of a mixed system.
Sectors in an Economy
An economy is divided into sectors based on the nature of activities: Primary (extraction), Secondary (manufacturing), Tertiary (services), Quaternary (knowledge), and Quinary (decision-making).
Primary Sector
The primary sector involves the extraction, harvesting, and use of natural resources directly from the earth. It is also known as the agricultural and allied sector.
Activities in this sector are the foundation of all other sectors since raw materials come from here.
Examples: Agriculture (growing crops like rice and wheat), dairy farming (milk production), fishing (catching fish from rivers and seas), forestry (wood, bamboo collection), and mining (coal, iron ore).
Secondary / Manufacturing Sector
This sector involves transforming natural products into finished or semi-finished goods through industrial processes.
It is also known as the industrial sector , and it adds value to raw materials.
Examples: Manufacturing cars using aluminium and steel, construction of houses, production of cement, textile industry converting cotton into clothes, food processing like making bread from wheat.
Tertiary Sector
Also called the service sector , this sector provides intangible goods and services that support consumers and businesses.
It does not produce physical goods but facilitates production and consumption by offering essential services.
Examples: Retail trade (shops, supermarkets), entertainment (movies, sports), transport (railways, airlines), tourism, healthcare, IT services, financial services (banks, insurance, stock exchanges).
Quaternary / Knowledge Sector
This sector focuses on intellectual activities , research, innovation, and knowledge-driven services.
It contributes to economic growth through advanced technology, expertise, and decision-support systems.
Examples: Research and development (R&D) in pharmaceuticals, IT consulting, data analysis, education (schools, universities), scientific innovation, knowledge economy based on skills and information.
Quinary Sector
This sector is concerned with high-level decision-making , leadership, and policy-making in society and economy.
It includes top executives, government leaders, and people involved in making important policies that influence all sectors.
Examples: Government creating legislation, Prime Ministers or Presidents taking economic decisions, CEOs and top management in multinational companies, think-tank leaders and policy advisors.
| Sector | Description | Examples |
|---|---|---|
| Primary | Extraction and harvesting of natural resources | Agriculture, fishing, forestry |
| Secondary | Transformation of raw materials into goods | Car manufacturing, construction |
| Tertiary | Service provision (intangible) | Retail, entertainment, finance |
| Quaternary | Knowledge-based activities | Education, R&D, consulting |
| Quinary | Decision-making at top level | Government, corporate executives |
Prelims tips
- Primary = extraction, Secondary = manufacturing, Tertiary = services.
- Quaternary = knowledge sector (R&D, education).
- Quinary = top-level decision-making (government, executives).
- India’s largest employment : Primary sector; largest GDP contributor : Tertiary sector.
Mains points
- Sectors classification shows how economies evolve from agriculture to services.
- Primary sector forms the base but contributes less to GDP in developed economies.
- Secondary sector boosts industrialization and employment.
- Tertiary sector drives modern economies through services and trade.
- Quaternary and Quinary sectors represent advanced economies based on knowledge and governance.
Classification of Economics: Microeconomics and Macroeconomics
Economics is classified into Microeconomics (study of individuals and firms) and Macroeconomics (study of the economy as a whole). Micro focuses on demand-supply, pricing, and efficiency at small scale, while Macro addresses national income, employment, inflation, growth, and stability.

Microeconomics
Focus: Studies the economic behavior of individual units such as households, firms, or a single market. It looks at the small picture of the economy.
Concerned with how scarce resources are allocated among competing uses at a micro level.
Main Areas of Study:
Theory of Demand & Supply: How consumer choices affect demand, elasticity of demand, and equilibrium prices.
Theory of Production & Costs: How producers decide the optimal quantity of output; includes the Production Laws, Law of Variable Proportions and Returns to Scale.
Factor Pricing: Determination of wages (labour), rent (land), interest (capital), and profit (entrepreneurship).
Market Structures: Analysis of how prices and output are decided in different markets – perfect competition, monopoly, monopolistic competition, and oligopoly.
Welfare Economics: Examines efficiency in the allocation of resources and how to maximize social welfare.
Example: How the price of petrol fluctuates when demand increases or decreases, or when supply is disrupted by global events.
Macroeconomics
Focus: Studies the economy as a whole by analyzing aggregates rather than individual units.
Deals with broad measures such as national income, overall output, employment, savings, and investments.
Main Areas of Study:
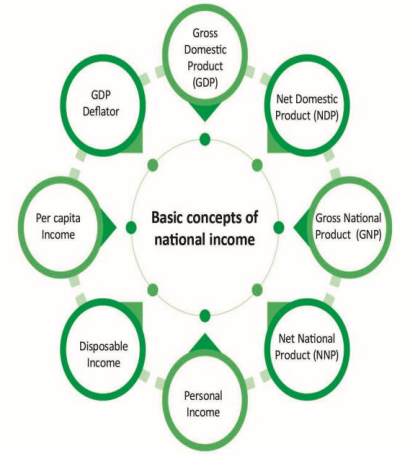
National Income Accounting: Measurement of economic performance using GDP, GNP, NNP, and NDP.
Theory of Income, Output & Employment: Includes Keynesian consumption and investment functions.
Monetary Theory: Studies money supply, interest rates, inflation, deflation, stagflation, and reflation.
Fiscal Policy: Use of taxation and government expenditure to regulate the economy.
Theory of Economic Growth & Development: Models like Harrod-Domar and Solow to explain long-run growth (Growth vs Development).
Balance of Payments & International Trade: Studies imports, exports, foreign exchange reserves, and trade imbalances.
Example: India’s GDP growth rate in a financial year, the Consumer Price Index (CPI) measuring inflation, or unemployment rates.
Interdependence of Micro & Macro
Micro decisions (like consumer demand or a firm’s production) collectively impact macroeconomic variables such as GDP, inflation, and employment.
Macroeconomic policies (such as tax cuts, interest rate changes, or subsidies) influence microeconomic choices of households and firms.
Together, both fields are essential for understanding the complete picture of an economy, as one cannot function effectively without the other.
| Basis | Microeconomics | Macroeconomics |
|---|---|---|
| Domain | Individual units: households, firms, markets | Economy as a whole: aggregates |
| Concerned with | Demand, supply, factor pricing, production, consumption | National income, employment, inflation, growth |
| Approach | Bottom-up (individual decisions form whole) | Top-down (policies impacting entire system) |
| Market Structures | Perfect competition, monopoly, oligopoly | General equilibrium, aggregate demand & supply |
| Applications | Price determination, cost optimization, wage setting | Policy-making, inflation control, unemployment reduction |
| Significance | Known as price theory; micro efficiency | Stability, growth and macro equilibrium |
Prelims tips
- Microeconomics = Price theory, unit level analysis.
- Macroeconomics = Income & employment theory, aggregate level analysis.
- Elasticity of demand = Micro concept; Inflation = Macro concept.
- Key economists: Alfred Marshall (Micro), Keynes (Macro).
Mains points
- Microeconomics helps understand consumer and producer decisions.
- Macroeconomics is essential for policy design to stabilize and grow the economy.
- Micro provides efficiency and pricing mechanisms; Macro ensures stability and full employment.
- Both are interdependent: micro forms the base, macro provides the structure.
- Modern economics integrates micro and macro approaches (e.g., microfoundations of macroeconomics).
Theory of Demand and Consumer Behaviour
Demand is the quantity of a commodity a consumer is willing and able to buy at various prices. The Law of Demand states that price and quantity demanded are inversely related (ceteris paribus). Consumer behaviour studies how individuals make choices to maximize utility given their budget constraints.
Concept of Demand
Demand is not just a desire but a desire backed by the ability to pay and the willingness to spend .
Demand is always expressed with reference to a specific price and time period (e.g., demand for X commodity at ₹10 per unit in January).
Individual Demand: Demand by a single consumer for a commodity.
Market Demand: Total demand by all consumers for a commodity in the market.
Law of Demand
The Law of Demand states that, other things remaining constant (ceteris paribus), the quantity demanded of a commodity increases when its price falls, and decreases when its price rises.
It shows an inverse relationship between the price of a commodity and the quantity demanded, leading to a downward sloping demand curve.
Reasons for Downward Sloping Demand Curve:
Law of Diminishing Marginal Utility: As a consumer consumes more units, the marginal utility (satisfaction from an additional unit) decreases, so they will only buy more if the price falls.
Income Effect: A fall in price increases the real income or purchasing power of the consumer, enabling them to buy more.
Substitution Effect: When the price of a good falls, it becomes relatively cheaper compared to its substitutes, leading consumers to buy more of it.
Elasticity of Demand
Elasticity of Demand measures the degree of responsiveness of the quantity demanded to a change in price, income, or the price of related goods.
This topic is detailed further in the next object on Elasticity.
Consumer Behaviour (Utility Analysis)
The theory of consumer behaviour explains how a rational consumer maximizes their satisfaction (utility) from the purchase of various goods and services, given their limited income and market prices.
Consumer Equilibrium:
A consumer achieves equilibrium when they allocate their limited income in such a way that the total satisfaction (utility) from the goods purchased is maximum.
Law of Equi-Marginal Utility: A consumer gets maximum satisfaction when the ratio of the marginal utility of a commodity to its price is equal for all commodities consumed. (MU_A/P_A = MU_B/P_B)
| Concept | Cause | Result |
|---|---|---|
| Movement along the Demand Curve (Expansion/Contraction of Demand) | Change in the own price of the commodity. | Changes the quantity demanded (point moves along the same curve). |
| Shift of the Demand Curve (Increase/Decrease in Demand) | Change in non-price factors (income, taste, price of related goods). | Changes the demand curve entirely (curve shifts right or left). |
Prelims tips
- Law of Demand : Inverse relation between Price and Quantity Demanded.
- Demand curve slopes downwards .
- Movement along the curve is due to Price; Shift is due to Non-Price factors.
- Consumer equilibrium relies on Equi-Marginal Utility .
Mains points
- Demand theory is the foundation of Microeconomics and market analysis.
- The Law of Demand is crucial for understanding market dynamics and pricing strategies.
- Exceptions to the Law (Giffen goods, Veblen goods) are important for advanced analysis.
- Consumer behaviour theories explain the rationality and constraints behind individual purchasing decisions.
- Understanding the difference between movement and shift is key for policy analysis.
Supply, Law of Supply and Market Equilibrium
Supply refers to the quantity a seller is willing and able to offer at a given price. The Law of Supply shows a direct relationship between price and quantity supplied. Market Equilibrium is the state where quantity demanded equals quantity supplied, leading to a stable price.

Supply and Law of Supply
Supply is the quantity of a product that a seller is both willing and able to offer in the market at a specific price and within a given period of time.
It reflects the producer’s profit motive: higher prices mean higher potential profit, encouraging higher production.
Law of Supply: Keeping all other factors constant (ceteris paribus), when the price of a good rises, the quantity supplied also rises; and when the price falls, the quantity supplied also decreases.
This shows a direct relationship between price and quantity supplied, resulting in an upward sloping supply curve .
Determinants of Supply (Factors causing a Shift in Supply Curve):
Price of Factors of Production (e.g., raw materials, wages).
Technology (Better technology increases supply).
Government Policies (Taxes reduce supply, Subsidies increase supply).
Price of Related Goods.
Market Equilibrium
Market Equilibrium is a situation where opposing market forces (Demand and Supply) balance each other. It occurs when: Quantity Demanded = Quantity Supplied .
Equilibrium Price: The price at which demand and supply curves intersect. It is the 'market-clearing price' as there is no surplus or shortage.
Equilibrium Quantity: The amount of goods/services bought and sold at the equilibrium price.
Market Adjustment (Restoring Equilibrium)
If price is above Equilibrium (Surplus): Supply > Demand (Excess Supply). Sellers lower prices to clear unsold stock. Lower prices increase demand and reduce supply until equilibrium is restored.
If price is below Equilibrium (Shortage): Demand > Supply (Excess Demand). Buyers compete and bid prices up. Higher prices encourage producers to increase supply, reducing shortage until equilibrium is reached.
The price mechanism acts as the automatic regulator, pushing the market back to equilibrium.
| Situation | Condition | Effect on Price | Adjustment |
|---|---|---|---|
| Equilibrium | Demand = Supply | Stable | No adjustment needed |
| Surplus (Excess Supply) | Supply > Demand | Falls | Price ↓ → Demand ↑ Supply ↓ |
| Shortage (Excess Demand) | Demand > Supply | Rises | Price ↑ → Demand ↓ Supply ↑ |
Prelims tips
- Law of Supply = Direct relation (Price ↑, Supply ↑).
- Supply curve slopes upwards .
- Equilibrium occurs when Demand = Supply.
- Surplus (S > D) forces price down ; Shortage (D > S) forces price up .
- Determinants of Supply (e.g., Technology, Taxes) cause the curve to shift.
Mains points
- The interaction of supply and demand is fundamental to determining prices and resource allocation in competitive markets.
- Market equilibrium ensures stability by aligning buyer and seller plans, maximizing social welfare.
- Understanding the effects of shifts in either demand or supply is critical for predicting market outcomes (e.g., impact of climate change on food prices).
- Government intervention (like price floors or ceilings) often creates artificial surplus or shortage, hindering the natural equilibrium mechanism.
Capital and Human Capital
Capital represents wealth used to create more wealth, typically classified as physical, financial, and human. Human Capital, in particular, refers to the skills, knowledge, and health embodied in a nation's labour force, which drives economic growth and development.
Types of Capital
Capital is the stock of assets that can be used to create wealth.
1. Physical Capital: Tangible, man-made assets used in production. Example: Machinery, factory buildings, infrastructure.
2. Financial Capital: Funds used to acquire physical and human capital (money, stocks, bonds). It is merely a paper claim to wealth.
3. Social Capital: The network of relationships, shared values, and trust that enables participants to work effectively together (E.g., community networks, civil society organizations).
Concept of Human Capital
Human Capital refers to the stock of skills, knowledge, abilities, health, and experience accumulated by people, which has economic value.
It is developed through investment in education, training, and healthcare.
Difference between Human Capital and Human Development:
Human Capital views humans as a means to increase productivity and economic growth (Focus on utility).
Human Development views humans as an end in themselves; it focuses on welfare, freedoms, and expanding choices (Focus on welfare).
Human Capital Formation (HCF): The process of adding to the stock of human capital over time. Sources of HCF include:
Investment in Education: Increases productivity and efficiency of labour.
Investment in Health: Improves life expectancy and vitality, ensuring a more productive workforce.
On-the-Job Training: Increases skill levels specific to the work environment.
Expenditure on Migration: Facilitates better utilization of skills in suitable job markets.
Expenditure on Information: Helps in making decisions regarding job opportunities and resource allocation.
| Aspect | Human Capital | Physical Capital |
|---|---|---|
| Tangibility | Intangible (in mind and body) | Tangible (can be seen and touched) |
| Separability | Cannot be separated from the owner | Can be bought and sold in the market |
| Mobility | Highly mobile across countries (via migration) | Less mobile (difficult to move factories) |
| Depreciation | Depreciates with age, but skills appreciate with use | Depreciates with use |
Prelims tips
- Physical Capital = Tangible assets (Machinery).
- Human Capital = Intangible assets (Skills, Health).
- HCF is achieved through investment in Education, Health, and Training.
- Human Development is the end; Human Capital is the means.
Mains points
- Human Capital Formation is key to sustainable and inclusive economic growth.
- The state's role in investing in social sectors (education/health) is justified by the public good nature of human capital.
- Social Capital complements human and physical capital, boosting productivity and reducing transaction costs.
- Developing nations face challenges in converting financial capital into human capital due to weak institutions and corruption.
Economic Growth vs. Economic Development
Economic Growth refers to a quantitative increase in a country's output (measured by GDP). Economic Development is a qualitative and multi-dimensional process that includes growth alongside improvements in living standards, education, health, and reduction in inequality.
Economic Growth (Quantitative)
Definition: It is the increase in the real output of goods and services produced by an economy over a period of time.
Nature: Quantitative, narrow, and uni-dimensional.
Measurement: Measured by increase in Gross Domestic Product (GDP), Gross National Product (GNP), or per capita income.
Scope: Primarily related to developed nations, as they mainly focus on increasing output.
Outcome: Higher productivity and increased national income.
Sustainability: Growth can be temporary (e.g., due to a temporary boom) and may not be sustainable if resources are overexploited.
Example: If India’s GDP rises from 3.5 trillion to 3.8 trillion in a year, it is economic growth.
Economic Development (Qualitative)
Definition: It is a broader concept that includes economic growth plus changes in non-economic factors like institutional, social, and cultural structures.
Nature: Qualitative, comprehensive, and multi-dimensional.
Measurement: Measured using indices like the Human Development Index (HDI), Physical Quality of Life Index (PQLI), and Gender Inequality Index (GII).
Scope: Primarily related to developing nations, focusing on improving overall quality of life.
Outcome: Structural changes, poverty reduction, better education, improved public health, and greater equality.
Sustainability: Development is generally a sustainable process aimed at long-term welfare.
Example: If along with GDP growth, infant mortality rates fall, literacy rates rise, and income inequality decreases, it is economic development.
Inclusive Growth
Inclusive Growth is defined as economic growth that is distributed fairly across society and creates opportunity for all, regardless of where they live or who they are.
The focus is not just on the rate of growth but on the distribution of its benefits to ensure sustained progress in poverty reduction and social equity.
This concept bridges the gap between the narrowness of economic growth and the broadness of economic development.
| Basis | Economic Growth (E.G.) | Economic Development (E.D.) |
|---|---|---|
| Concept | Narrow, Quantitative | Broad, Qualitative |
| Scope | Increase in GDP/Per Capita Income | E.G. + Welfare, Poverty Reduction, Equality |
| Measure | GDP, GNP | HDI, PQLI, GII |
| Relevance | More relevant for Developed Countries | More relevant for Developing Countries |
Prelims tips
- Growth is quantitative (GDP); Development is qualitative (HDI).
- Growth is necessary but not sufficient for Development .
- HDI components: Health (life expectancy), Education, and Income (GNI per capita).
- Inclusive Growth aims for equity and shared benefits.
Mains points
- India's economic strategy must prioritize development (qualitative change) over mere growth (quantitative increase) to reduce socio-economic disparities.
- High economic growth without development leads to 'jobless growth' and increased inequality.
- Human Development Indices offer a more holistic measure of national progress than GDP alone.
- Achieving inclusive growth is the core challenge for a country like India.
National Income
National Income is the total monetary value of all final goods and services produced by a country in one year. It reflects the overall economic activity, purchasing power, and standard of living, and is a key tool for economic planning and policy-making.
Introduction
National Income provides a comprehensive measure of the economic activities of a nation.
It indicates the purchasing power of the country and acts as an instrument of economic planning.
Used to evaluate growth, development, and performance of government policies.
Meaning of National Income
National Income = Total money value of all final goods and services produced in a country in one year.
It includes income earned by residents from production both within and outside the country.
Residents = individuals or institutions whose main economic interest lies within the country.
Example: If an Indian engineer works abroad and sends income back to India, it is included in India’s National Income.
Significance of National Income Accounting
Provides a complete measure of the nation’s economic activity.
Helps calculate per capita income, an indicator of economic welfare and living standards.
Provides statistical data for economic analysis and policy-making.
Tracks structural changes (e.g., from agriculture to industry and services).
Evaluates performance of government policies based on income growth.
Example: A rising national income signals economic growth, while a fall indicates slowdown.
Gross Domestic Product (GDP)
GDP = Total market value of all final goods and services produced within a country’s boundaries in one year.
It includes production within the country regardless of nationality of the producer.
Example: A Chinese company producing toys in India adds to India’s GDP. But if an Indian company produces toys in the US, it counts towards US GDP, not India’s.
Concept of Factor Cost and Market Price
Factor Cost (FC)
Factor cost refers to the total cost of production borne by a producer.
Includes: rent, wages, salaries, cost of capital, raw materials, entrepreneur’s profit.
Excludes: indirect taxes (since they do not contribute directly to production).
Includes: subsidies (since they reduce production cost).
Example: A factory producing textiles includes wages, raw material costs, and rent in factor cost.
Market Price (MP)
Market price = Price at which consumers buy goods in the market.
MP is derived from factor cost after adding indirect taxes (like GST) and subtracting subsidies.
Formula: MP = FC + Indirect Taxes – Subsidies.
Example: If factor cost of a good is ₹100, indirect tax is ₹20, and subsidy is ₹10 → MP = 100 + 20 – 10 = ₹110.
| Concept | Explanation |
|---|---|
| National Income | Money value of all final goods and services produced by residents in one year. |
| GDP | Market value of final goods/services produced within country, regardless of nationality. |
| Factor Cost | Total cost of production (wages, rent, interest, profit, subsidies). |
| Market Price | Price consumers pay; FC + Indirect Taxes – Subsidies. |
Prelims tips
- National Income includes only final goods and services, not intermediate goods (to avoid double counting).
- GDP is location-based, GNP is nationality-based.
- Factor cost excludes taxes, includes subsidies; Market price adds taxes, subtracts subsidies.
- Per capita income = National Income / Population; indicator of economic welfare.
Mains points
- National Income is a key tool for economic planning, measuring growth, and comparing development across nations.
- GDP measures production within geographical boundaries, while GNP includes nationality of producers.
- Factor Cost vs Market Price distinction is important for policy-making and inflation analysis.
- Helps evaluate structural shifts in economy (e.g., from agriculture to services).
- Used to assess success/failure of government policies and overall welfare of citizens.
Elements of GDP Calculation
GDP measures the total market value of all final goods and services produced within a country’s domestic territory in a given period. To calculate GDP correctly, one must include only final goods and services, define domestic territory, identify residents, and exclude transfer payments.
Final Goods and Services
Only final goods and services (purchased for consumption or final use) are counted in GDP.
Intermediate goods (used in producing final goods) are not counted separately to avoid double counting.
Example: If a burger is considered as a final product, then buns used inside the burger are not counted separately, as they are intermediate goods included in the burger’s value.
Domestic Territory
Refers to the geographical territory under the administration of a government where persons, goods, services, and capital can freely move.
Includes:
Political frontiers including territorial waters and airspace.
Indian embassies and consulates abroad (considered Indian territory).
Military bases located abroad under Indian control.
Ships and aircrafts owned and operated by Indian residents between two or more countries.
Fishing vessels, oil rigs, and natural gas rigs operated by residents in international waters with exclusive rights.
Example: An Air India aircraft flying from New York to London is part of India’s domestic territory, but a British Airways aircraft flying within India is not.
Residents
A resident is a person or institution that normally resides in a country for at least one year, with their main economic interest in that country.
Includes:
Indians working in Indian embassies abroad.
Foreign citizens living in India for more than one year (for work/business).
Excludes:
Foreigners working in Indian embassies abroad.
Officials working in international organizations like WHO, IMF in India.
Foreigners who come to India for medical treatment, study, or travel, even if they stay for more than one year.
Example: An American working in WHO’s India office is not considered an Indian resident for GDP purposes.
Transfer Payments
Transfer payments are payments received without rendering any productive service or economic activity.
They are not included in national income because they do not reflect production of goods or services.
Generally made by governments or welfare agencies to support individuals in need.
Examples: Unemployment allowances, social security benefits, pensions, scholarships, public health services.
Note: Factor incomes (like wages, rent, interest, profit) are included in GDP, but transfer payments are excluded.
| Element | Explanation |
|---|---|
| Final Goods & Services | Only final goods are counted, intermediate goods excluded to avoid double counting. |
| Domestic Territory | Geographical area + embassies + military bases + ships/aircraft operated by residents. |
| Residents | Persons/institutions with economic interest in country for ≥ 1 year. |
| Transfer Payments | Excluded from GDP since no goods/services are produced. |
Prelims tips
- GDP includes only final goods, not intermediate goods.
- Domestic territory includes embassies and military bases abroad but excludes foreign embassies in India.
- Residents = economic interest in country for at least one year; not all foreigners living in India qualify.
- Transfer payments like pensions and scholarships are excluded from GDP.
Mains points
- Final goods principle avoids double counting in GDP calculations.
- Domestic territory concept clarifies which areas and institutions are included in GDP.
- Resident definition ensures correct inclusion of incomes earned by nationals vs foreigners.
- Transfer payments are excluded as they do not reflect productive economic activity.
- These elements together ensure accuracy and comparability of GDP data across nations.
Types of GDP and Methods of Calculation
GDP (Gross Domestic Product) measures the monetary value of all final goods and services produced within a country’s domestic territory in a year. It can be measured at current prices (Nominal GDP) or constant prices (Real GDP). National income can be calculated using three approaches: production (value added), income, and expenditure methods.
Types of GDP
Nominal GDP (GDP at Current Prices)
Nominal GDP is the total monetary value of goods and services produced in a country during a financial year at market prices of that year.
It does not adjust for inflation, meaning if prices increase, GDP may look higher even if actual production has not changed.
Example: If in 2022 India produced 1000 goods at ₹10 each = ₹10,000. In 2023, the same 1000 goods are sold at ₹12 each, then GDP = ₹12,000. The rise is due to price increase, not more production.
Real GDP (GDP at Constant Prices)
Real GDP is the value of goods and services produced in a country, calculated at constant prices (base year prices).
It is adjusted for inflation to reflect actual changes in production/output.
Real GDP is considered more accurate for measuring economic growth.
Example: If 2015 is the base year, GDP of 2023 is calculated using 2015 prices to remove the effect of inflation.
Methods of GDP Calculation
National income can be measured by three approaches: Output, Income, and Expenditure.
These three methods are interlinked (Output = Income = Expenditure) because the process is circular in nature.
1. Production or Value Added Method
This method calculates GDP by summing the value added by all producers in the economy at each stage of production.
Formula: Value Added = Value of Output – Intermediate Consumption.
Example: Shyam produces orange juice for ₹100 using oranges and sugar worth ₹50. Value added = 100 – 50 = ₹50.
GDP at Current Market Price (MP) = Σ Gross Value Added (GVA) of all goods/services + Taxes – Subsidies.
GDP at Constant MP (Real GDP) = GDP at Current MP adjusted to base year prices.
2. Income Method
GDP is calculated as the sum of all factor incomes earned in production.
Includes wages and salaries, rent, interest, and profits.
Example: If a company produces ₹1,00,000 worth of goods, this value is distributed as wages to workers, rent to landowners, interest to capital providers, and profits to entrepreneurs.
3. Expenditure Method
GDP is calculated as the sum of all expenditures made on final goods and services within the country.
Components: Consumption expenditure (C) + Investment expenditure (I) + Government spending (G) + Net Exports (Exports – Imports).
Example: If households spend ₹50,000, firms invest ₹30,000, government spends ₹20,000, and net exports are ₹10,000 → GDP = 50,000 + 30,000 + 20,000 + 10,000 = ₹1,10,000.
| Type/Method | Explanation |
|---|---|
| Nominal GDP | GDP at current year prices, not adjusted for inflation. |
| Real GDP | GDP at base year prices, adjusted for inflation. |
| Production Method | GDP = Value Added (Output – Intermediate consumption). |
| Income Method | GDP = Wages + Rent + Interest + Profits. |
| Expenditure Method | GDP = Consumption + Investment + Govt. spending + Net Exports (C+I+G+(X–M)). |
Prelims tips
- Nominal GDP shows inflated value due to price rise; Real GDP is used for economic growth comparisons.
- GDP can be measured by Output, Income, and Expenditure methods – all should ideally give the same result.
- Value Added Method prevents double counting by excluding intermediate goods.
- Expenditure method formula: GDP = C + I + G + (X–M).
Mains points
- Nominal vs Real GDP distinction is crucial for analyzing inflation vs real growth.
- Production method highlights contribution of each sector to GDP.
- Income method shows how GDP is distributed among factors of production.
- Expenditure method explains demand-side components driving GDP.
- Cross-checking three methods ensures accuracy and reliability of GDP statistics.
GDP by Value Added and Income Method
In the Value Added Method, GDP is calculated by summing value added at each stage of production, but only final goods/services are included. In the Income Method, GDP is calculated as the sum of all factor incomes earned in production (wages, rent, interest, profits, and mixed income).
Goods and Services in Value Added Method
Only certain goods and services are included while calculating GDP to avoid double counting.
Included Items:
Goods and services sold in the market.
Services provided by agents (e.g., brokers, commission agents).
Imputed rent or imputed interest (when a property is self-owned and no rent is paid, estimated rent is counted).
Not Included Items:
Buying and selling of second-hand goods (since they were already counted in GDP earlier).
Transfer payments (scholarships, pensions, unemployment benefits) as they are not payments for production of goods/services.
Example: A house owner living in his own house is not paying rent to himself, but the imputed rent is included in GDP since it reflects the value of housing services.
Income Method of GDP
GDP is calculated by adding all incomes generated in the production process.
This gives GDP at Factor Cost since it considers payments to factors of production.
Factors of Production and Corresponding Incomes:
Land → Rent.
Labour → Wages & Salaries.
Capital → Interest.
Entrepreneurship → Profits.
Factor Incomes are classified into three categories:
1. Compensation to Employees: Includes wages, salaries, employer’s contribution to social security, allowances, etc.
2. Operating Surplus: Includes rent, interest, royalty, and profits (corporate tax, dividends, retained earnings).
3. Mixed Income of Self-Employed: Income of farmers, doctors, lawyers, small traders etc. who combine labour and capital.
Formula:
1. GDP at Factor Cost = Rent + Wages + Interest + Profits.
2. GDP at Factor Cost + (Indirect Taxes – Subsidies) = GDP at Market Price.
3. Adjust GDP at Market Price with base year prices to get Real GDP (GDP at Constant MP).
| Goods/Services | Included in GDP? |
|---|---|
| Goods & services sold in market | Included |
| Services by agents | Included |
| Imputed rent/interest | Included |
| Second-hand goods | Not Included |
| Transfer payments (pension, scholarships) | Not Included |
| Factor of Production | Type of Income |
|---|---|
| Land | Rent |
| Labour | Wages and Salaries |
| Capital | Interest |
| Entrepreneurship | Profits (corporate tax, dividends, retained earnings) |
| Self-employed | Mixed income (farmers, doctors, traders) |
Prelims tips
- Value Added Method excludes second-hand goods and transfer payments to avoid double counting.
- Imputed rent of self-occupied houses is included in GDP.
- Income Method formula: GDP at Factor Cost = Rent + Wages + Interest + Profits.
- Adjustment with taxes and subsidies converts Factor Cost to Market Price.
Mains points
- Value Added Method ensures GDP is calculated without duplication by considering only final goods and services.
- Income Method highlights distribution of GDP among factors of production (land, labour, capital, entrepreneurship).
- Inclusion of imputed rent ensures housing services are represented in GDP statistics.
- Exclusion of transfer payments prevents overestimation of economic activity.
- Both methods complement each other and validate GDP figures when cross-checked.
GDP by Expenditure Method
Expenditure Method calculates GDP by summing all expenditures made on final goods and services within the domestic territory in a given year. It assumes that at equilibrium, total spending (demand) = total production (supply). Formula: GDP at Market Price = C + I + G + (X – M).
Concept
Expenditure Method measures the total expenditure incurred on final goods and services produced within the country in a year.
Also called the 'Consumption and Investment Method' or 'Income Disposal Method'.
While the Value Added Method measures GDP from the producer’s side (sales), the Expenditure Method measures from the consumer’s side (purchases).
At equilibrium: Total Expenditure = Total Production.
Components of Expenditure Method
1. Consumption Expenditure (C)
Spending by individuals, households, and private firms on final goods and services.
Includes: Food, clothing, transportation, TVs, cars, medicines, etc.
Excludes: Purchase of second-hand goods, since they were already counted earlier.
Note: Construction of new houses is counted under 'Investment', not consumption.
2. Investment Expenditure (I)
Expenditure on investment goods (capital formation).
Includes: Purchase of machinery, construction of highways, dams, factories, residential property, raw materials, wages to workers, unsold inventory.
Excludes: Savings in banks, shares, and bonds, since they are only financial instruments. They are counted only when invested into capital goods.
3. Government Expenditure (G)
Spending by the government on final goods and services.
Includes: Administrative expenses, defence, law and order, salaries of government employees, infrastructure projects.
Excludes: Transfer payments like subsidies, pensions, and scholarships since they do not correspond to production. Instead, they are counted under the consumption of the beneficiary.
4. Net Exports (NX)
Net Exports = Exports (X) – Imports (M).
Exports are included as they are produced domestically for foreign consumers.
Imports are excluded since they are not produced domestically.
Example: If India exports goods worth ₹500 crore and imports worth ₹300 crore → NX = 500 – 300 = ₹200 crore.
Formula
GDP at Market Price = C + I + G + (X – M).
Current GDP is measured at market prices. To get Real GDP, it is adjusted with base year prices.
| Component | Description | Included/Excluded |
|---|---|---|
| Consumption (C) | Household spending on final goods/services | New TV, food, transport (Included); Second-hand goods (Excluded) |
| Investment (I) | Spending on capital goods | Machinery, construction (Included); Bank savings/bonds (Excluded) |
| Government (G) | Spending by govt. on goods/services | Defence, admin costs (Included); Pensions, subsidies (Excluded) |
| Net Exports (NX) | Exports – Imports | Exports (Included); Imports (Excluded) |
Prelims tips
- Formula: GDP = C + I + G + (X – M).
- Construction of new houses is counted in Investment, not Consumption.
- Transfer payments (pensions, subsidies) are excluded since they do not reflect production.
- Exports are added, imports are subtracted to avoid counting foreign production.
Mains points
- Expenditure method shows GDP from the demand side, complementing supply-side estimates.
- It highlights the relative contribution of consumption, investment, government, and trade in GDP.
- Helps policymakers identify demand-side imbalances (e.g., low investment, high imports).
- Provides insights for designing fiscal policy (govt. spending) and trade policy (exports vs imports).
- Key for understanding the structure of aggregate demand in the economy.
Other Measures of National Income
Beyond GDP, national income is measured through Net Domestic Product (NDP), Depreciation, and Gross National Product (GNP). These measures refine GDP by accounting for wear and tear of assets and by distinguishing between production within borders vs by citizens worldwide.
Net Domestic Product (NDP)
NDP is the net market value of all final goods and services produced within a country’s domestic territory in a financial year after deducting depreciation from GDP.
GDP measures gross availability of goods/services, NDP shows net availability (after accounting for wear and tear).
Formula: NDP = GDP – Depreciation.
Example: If India produces 5 cars worth ₹1,00,000 each → GDP = ₹5,00,000. If depreciation = ₹50,000, then NDP = ₹4,50,000.
Conclusion: GDP is always greater than NDP, since depreciation is always positive.
Depreciation
Depreciation = fall in value of fixed assets due to normal wear and tear, aging, or obsolescence.
Also called: Consumption of Fixed Capital, Capital Consumption Allowance, Replacement Cost.
Example: A machine worth ₹10,00,000 reduces in value by ₹1,00,000 every year due to usage. That reduction is depreciation.
Gross National Product (GNP)
GNP = total value of final goods and services produced by citizens of a country in a financial year, irrespective of where they are located.
GDP focuses on where production takes place; GNP focuses on who produces it.
Income of foreign nationals/companies in India is excluded from India’s GNP. Income of Indian citizens/companies abroad is included in India’s GNP.
Example: Google (US company) producing in India adds to India’s GDP, not India’s GNP. Wipro (Indian company) producing in the US adds to India’s GNP, not India’s GDP.
Formula: GNP = GDP + NFIA.
NFIA (Net Factor Income from Abroad) = Income earned by domestic factors abroad – Income earned by foreign factors in domestic economy.
In India, GNP is usually lower than GDP since NFIA is negative (India pays more to foreign investors than it receives).
| Measure | Definition | Formula |
|---|---|---|
| GDP | Value of goods/services produced within domestic territory. | GDP = C + I + G + (X – M) |
| NDP | GDP adjusted for depreciation (wear and tear). | NDP = GDP – Depreciation |
| GNP | Value of goods/services produced by citizens, irrespective of location. | GNP = GDP + NFIA |
Prelims tips
- GDP is always greater than NDP since depreciation is deducted in NDP.
- GDP = location-based, GNP = nationality-based.
- NFIA = Income earned by domestic residents abroad – Income earned by foreigners in domestic territory.
- In India, NFIA is negative, so GNP < GDP.
Mains points
- NDP refines GDP by accounting for depreciation, showing true net output available.
- Depreciation reflects the cost of maintaining capital stock for future production.
- GNP shifts focus from domestic territory to nationality of producers, making it useful for globalized economies.
- For developing countries like India, GNP < GDP due to large foreign investment outflows.
- These measures together provide a complete picture of economic activity and welfare.
Net National Product (NNP) & National Income
NNP is the total value of final goods and services produced by nationals of a country after deducting depreciation from GNP. When expressed at Factor Cost, NNP is also called National Income. It adjusts for indirect taxes and subsidies, giving a true measure of income available to citizens.
Net National Product (NNP)
NNP measures the value of output produced by nationals of a country, irrespective of geographical boundaries, after accounting for depreciation.
Formula: NNP = GNP – Depreciation.
Example: If GNP = ₹1000 crore and depreciation = ₹100 crore, then NNP = ₹900 crore.
NNP can be expressed at Market Price or Factor Cost:
NNP at Market Price = Value at prevailing market prices.
NNP at Factor Cost = NNP (Market Price) – Indirect Taxes + Subsidies.
NNP at Factor Cost = National Income.
National Income
National Income is the NNP at Factor Cost.
It is the best indicator of the total income earned by residents of a country.
Formula: National Income = NNP (MP) – Indirect Taxes + Subsidies.
It reflects the real income received by citizens after government interventions.
Relationship between GDP, GNP, NDP, and NNP
GNP = GDP + NFIA.
Also = NDP + Depreciation + NFIA.
NNP = GNP – Depreciation.
Also = GDP + NFIA – Depreciation.
Thus:
GDP focuses on domestic production.
GNP focuses on citizens’ production worldwide.
NDP adjusts GDP for depreciation.
NNP adjusts GNP for depreciation, giving a net measure.
Which is Better?
NDP: Useful for analyzing depreciation impact on sectors, but not for global comparison (since depreciation rates differ country to country).
NNP: Also not suitable for global comparison for the same reason.
GDP: Preferred for international comparison since it reflects total domestic production without varying depreciation adjustments.
| Measure | Definition | Formula |
|---|---|---|
| GDP | Value of goods/services within domestic territory. | GDP = C + I + G + (X – M) |
| NDP | GDP adjusted for depreciation. | NDP = GDP – Depreciation |
| GNP | Goods/services by nationals worldwide. | GNP = GDP + NFIA |
| NNP | GNP adjusted for depreciation (National Income at FC). | NNP = GNP – Depreciation |
Prelims tips
- NNP at Factor Cost = National Income.
- National Income = NNP (MP) – Indirect Taxes + Subsidies.
- GDP > NDP (since depreciation > 0).
- In India, GNP < GDP because NFIA is negative.
- For international comparison, GDP is preferred, not NDP/NNP.
Mains points
- NNP provides a refined measure of economic output by accounting for depreciation.
- National Income (NNP at Factor Cost) is the truest measure of income received by residents.
- NDP and NNP are less suitable for global comparisons due to different depreciation policies across countries.
- GDP is globally standardized and thus used for international ranking and comparisons.
- Together, these indicators help in understanding production, income distribution, and depreciation impact on economy.
GDP and Welfare
GDP measures the value of goods and services produced, but welfare (well-being) depends on both economic and non-economic factors. Hence, GDP growth does not always mean higher welfare.
Meaning of Welfare
Welfare = Sense of well-being and quality of life.
Influenced by economic factors (income, consumption) and non-economic factors (law & order, environment, social peace).
GDP as Welfare Indicator
GDP = Total value of goods and services produced within a country in a year.
Distributed among people as incomes (except retained earnings).
Higher GDP → more goods & services → improved material well-being.
But GDP alone cannot fully measure welfare due to several limitations.
Limitations of GDP as Welfare Indicator
1. Distribution of GDP
If GDP growth benefits only a few, overall welfare may not rise.
Example: GDP rises but income inequality worsens → most citizens see no improvement.
2. Non-Monetary Exchanges
Many productive activities (e.g., household work by women, voluntary services) are not included in GDP.
This underestimates actual well-being.
3. Externalities
Negative externalities: Oil refinery polluting rivers increases GDP but reduces welfare.
Positive externalities: Education improves society’s welfare but is undercounted in GDP.
4. Unequal Contribution of Goods
Some goods (food, clothing, housing) directly improve welfare more than others (military, police services).
Thus, type of goods produced matters, not just quantity.
5. Negative Contribution
GDP counts harmful goods (like liquor, tobacco) same as beneficial goods.
Such products may reduce long-term welfare despite contributing to GDP.
| Aspect | GDP | Welfare |
|---|---|---|
| Definition | Value of goods & services produced in economy. | Sense of well-being (economic + non-economic). |
| Measurement | Monetary terms (market prices). | Monetary + non-monetary factors (income, health, environment). |
| Scope | Focus on production & income. | Focus on quality of life. |
| Limitation | Ignores inequality, externalities, harmful goods. | Broader measure including distribution & sustainability. |
Prelims tips
- GDP growth ≠ Welfare growth.
- Welfare depends on income distribution, externalities, type of goods, and non-monetary factors.
- GDP includes liquor, cigarettes, etc., which may reduce welfare despite contributing to GDP.
Mains points
- GDP is an important but incomplete measure of welfare.
- Rising GDP may coexist with rising inequality → welfare not improved.
- Externalities (pollution, education) distort GDP’s link with welfare.
- Human Development Index (HDI), Green GDP, and Sustainable Development Goals (SDGs) are more holistic welfare measures.
- Conclusion: GDP should be used with complementary indicators to measure welfare accurately.
Stock vs Flow, Investment, and GFCF
Think of Stock like a snapshot photo 📸 – it measures something at a specific moment (e.g., your bank balance today). Flow is like a video 🎥 – it measures something over a period of time (e.g., your salary per month). Investment is a key 'flow' that builds up the 'stock' of capital (machines, buildings). Gross Fixed Capital Formation (GFCF) is how we mainly measure this investment flow in an economy.
Concept of Stock and Flow
Stock Variable:
Measured at a specific point in time.
Like asking: How much water is in the bucket right now?
Examples: A country's total debt on March 31st, the number of machines in a factory today, your total savings as of this morning.
Flow Variable:
Measured over a period of time (per hour, day, month, year).
Like asking: How much water is flowing from the tap per minute?
Examples: Your income per month, GDP (total production in a year), Investment (spending on new machines during the year), Depreciation (value lost by machines each year).
Investment
Investment means spending money to create or buy new capital goods. Capital goods are things used to produce other goods/services (factories, machines, computers, software, roads).
Since investment happens over time (e.g., a company invests ₹10 crore this year), it's a flow .
This flow adds to the total amount of capital goods available, which is a stock .
Gross Investment: The total amount spent on new capital goods in a period.
Net Investment: Gross Investment minus Depreciation. Depreciation is the value lost by old capital goods due to wear and tear or becoming outdated. Net investment shows the actual increase in the capital stock.
Example: A taxi company buys 5 new cars (Gross Investment). But 1 old car breaks down and is scrapped (Depreciation). The net addition to their fleet (Net Investment) is 4 cars.
Gross Fixed Capital Formation (GFCF)
GFCF is the main way economists measure investment in fixed assets.
It's part of the GDP calculation using the Expenditure Method (GDP = C + I + G + NX), where 'I' largely represents GFCF.
What GFCF includes:
Spending on new fixed assets like:
Machines, equipment, vehicles used for production.
Buildings (factories, offices, houses).
Infrastructure (roads, bridges, power plants).
Intangible assets like software, R&D.
What GFCF usually EXCLUDES:
'Change in Stocks/Inventories': Goods produced but not yet sold are also a form of investment, but counted separately from GFCF.
Purchase of land: Because land isn't 'produced', buying it just transfers ownership.
Spending on repairs/maintenance (usually considered intermediate consumption).
Why GFCF is Important:
It shows how much an economy is investing in its future productive capacity.
A high GFCF (as a percentage of GDP) generally suggests confidence in the economy and potential for future growth. Think of it as planting seeds 🌱 for future harvest.
| Concept | Stock (at a point in time) | Flow (over a period of time) |
|---|---|---|
| Water | Water in a lake 🌊 | Water in a river 🏞️ |
| Money | Wealth / Savings (on Jan 1st) 💰 | Income / Expenditure (per month) 💸 |
| Capital | Total machines in a factory 🏭 | Investment (new machines bought per year) 🏗️ |
Prelims tips
- Stock = Snapshot at a point in time (Wealth, Capital).
- Flow = Measured over a period (Income, GDP, Investment).
- Investment is the flow that builds the stock of capital.
- GFCF measures investment in fixed assets (machines, buildings, infra), excluding inventories and land.
- Net Investment = Gross Investment – Depreciation (wear & tear).
Mains points
- Understanding stock vs. flow is crucial. For instance, focusing only on GDP (flow) might miss underlying issues with a nation's wealth or capital stock.
- GFCF is a vital indicator of economic health. A sustained increase in GFCF is needed for long-term growth and job creation in India.
- Government policies often aim to boost GFCF, both through public investment (e.g., infrastructure projects) and by creating an environment conducive to private investment.
- A falling GFCF rate can signal economic slowdown and lack of business confidence.
Inflation
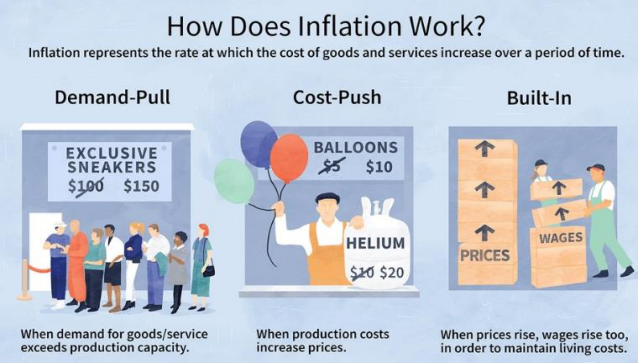
Inflation is a sustained rise in the general price level of goods and services over time. It reduces the purchasing power of money and affects economic stability.
Definition
Inflation refers to a persistent increase in the general level of prices of goods and services over a period of time.
It results in a decline in the purchasing power of money, meaning the same amount of money buys fewer goods and services.
Measurement of Inflation
Inflation is expressed as a percentage rate showing how fast prices are rising in the economy.
Formula: (Price level in current year – Price level in previous year) ÷ Price level in previous year × 100.
Example: Price of 1 litre milk = ₹50 in 2021 → ₹60 in 2022. Inflation rate = (60-50)/50 × 100 = 20%.
Measured on a ‘point-to-point’ basis (same reference dates).
Year-on-Year (YoY): Comparison with same month/year in previous year.
Sequential: Comparison with previous quarter/month.
Causes of Inflation
1. Money Supply
Increase in money supply → Higher demand → Inflationary pressure.
When central bank prints more money or reduces interest rates, people have more to spend.
If supply does not increase in the same proportion, excess demand leads to higher prices.
Example: Suppose economy has ₹100 worth of goods and ₹100 in circulation → price = ₹1 per unit.
If money supply rises to ₹150 but supply of goods remains the same, more money chases the same goods.
Businesses raise prices (say by 50%). Price per unit rises → Inflation.
2. Demand-Pull Inflation
Occurs when demand for goods and services exceeds supply capacity.
Example: During festive season, demand for gold rises sharply → Prices surge.
3. Cost-Push Inflation
Occurs when production costs rise (e.g., wages, raw materials, fuel).
Producers transfer higher costs to consumers in form of higher prices.
Example: Increase in crude oil prices → Higher transport costs → Increase in commodity prices.
4. Structural Factors
Supply-side bottlenecks in agriculture, poor storage, lack of logistics cause inflation.
Example: Onion shortage due to crop failure → Spike in onion prices.
5. Imported Inflation
Rise in prices of imported goods (e.g., crude oil, gold) raises overall domestic inflation.
6. Inflationary Expectations
If people expect prices to rise in future, they buy more now.
This excess demand itself pushes prices upward (self-fulfilling prophecy).
| Type | Explanation | Example |
|---|---|---|
| Demand-Pull Inflation | When demand > supply, prices rise. | Festive demand for gold raises prices. |
| Cost-Push Inflation | When production costs increase, prices rise. | Rise in crude oil increases transport cost. |
| Imported Inflation | Due to rising prices of imports. | Global crude oil price rise impacts India. |
| Structural Inflation | Supply bottlenecks and inefficiencies. | Crop failure causes food inflation. |
| Inflationary Expectations | Future price rise expectations push current demand. | Consumers hoard goods expecting price hike. |
Prelims tips
- Inflation reduces purchasing power of money.
- Measured by CPI (Consumer Price Index) and WPI (Wholesale Price Index) in India.
- Demand-pull vs Cost-push inflation is a key prelims concept.
- Inflationary expectations can be self-fulfilling.
Mains points
- Inflation impacts growth, employment, savings, and investments.
- Persistent inflation reduces standard of living, especially for poor households.
- High inflation discourages savings and affects financial stability.
- Moderate inflation can encourage investment and production, but uncontrolled inflation destabilizes economy.
- Policy measures: monetary tightening (RBI), fiscal discipline (government), supply-side reforms.
Demand-side Causes of Inflation
Inflation can arise when aggregate demand exceeds aggregate supply in an economy. Factors like higher disposable income, government expenditure, cheap credit, deficit financing, rising exports, and repayment of debt increase demand, pushing prices upward.
1. Disposable Income
Higher disposable income (due to higher national income, tax cuts, or lower savings) increases demand for goods and services.
Demand-pull effect occurs if supply cannot match rising demand, leading to inflation.
Example: Tax cuts → Households spend more on goods, but supply lags → Prices rise.
Example 2: Higher disposable income increases housing demand → Limited supply pushes house/rent prices up.
2. Public Expenditure
Government spending on infrastructure, social welfare, and development raises aggregate demand.
If economy is near full capacity, extra demand leads to price hikes.
Example: Govt builds highways → Demand for cement, steel, labor rises → Inflationary pressure.
Financing govt spending through borrowing can also increase money supply, fueling inflation.
3. Cheap Money Policy (Credit Expansion)
When central bank reduces interest rates → borrowing becomes cheaper → households and firms borrow more.
More borrowing = Higher investment + consumption → Higher demand → Inflation.
Example: Businesses expand production, but higher input demand (raw materials, labor) raises costs, which are passed to consumers.
Cheap credit can also fuel cost-push inflation (e.g., speculative rise in commodity prices).
4. Deficit Financing
Govt spends more than revenue, financed by borrowing or printing money.
Extra money supply → Higher aggregate demand → Prices rise.
Example: Govt borrows from RBI to fund projects → Money supply expands → Inflationary demand.
5. Increase in Exports
Export growth reduces domestic supply, raising domestic prices.
Exporters earn higher incomes, boosting their domestic demand, which further raises prices.
Example: Higher oil exports → Oil producers earn more → Spend more domestically → Inflation.
6. Repayment of Public Debt
Govt repays past loans → Public has more money in hand → Aggregate demand rises.
More demand without corresponding supply → Inflationary pressure.
| Factor | Impact on Demand | Inflation Effect |
|---|---|---|
| Disposable Income | More household spending | Higher prices due to demand-pull effect |
| Public Expenditure | Govt projects increase demand | Higher input and service prices |
| Cheap Money Policy | More borrowing & investment | Demand-pull + Cost-push inflation |
| Deficit Financing | Govt borrows/prints money | Excess money supply = inflation |
| Increase in Exports | Domestic supply falls, exporters earn more | Domestic price rise |
| Repayment of Debt | Public gets more cash | Higher aggregate demand |
Prelims tips
- Demand-pull inflation is caused when AD > AS.
- Tax cuts → Higher disposable income → Inflationary pressure.
- Deficit financing = borrowing + printing money = more demand.
- Cheap money policy = Lower interest rates = more inflation risk.
Mains points
- Demand-side factors highlight how fiscal and monetary policies can trigger inflation.
- In India, deficit financing and public expenditure are major causes of inflation.
- Cheap credit policies can fuel both demand-pull and cost-push inflation.
- Export growth may boost forex but creates domestic inflationary pressure.
- Balancing growth with inflation control is key policy challenge.
Types of Inflation (Based on Rate/Speed of Price Rise)
Inflation can be classified based on the speed of rise in prices—from mild creeping inflation to dangerous hyperinflation. The rate determines its impact on the economy, ranging from positive demand stimulation to complete economic collapse.
1. Creeping Inflation (Mild Inflation)
Slow and steady rise in prices, usually up to 2% annually (as per US Fed Reserve).
Single-digit growth, predictable, long-term trend.
Seen as favourable for economy since it boosts demand—consumers buy early to avoid future price hikes.
Example: Developed economies often maintain 2% inflation as a healthy target.
2. Walking/Trotting Inflation
Moderate rise in prices, higher than creeping but still single-digit growth (say, 3–9%).
Creates expectation of higher prices → People hoard goods → Demand increases further.
Supply often fails to keep up, leading to more inflation.
Example: If onion prices steadily rise every month, households buy in bulk, causing further price spikes.
3. Galloping Inflation
Very high inflation, usually double-digit or triple-digit (20%, 100%, 200% per year).
Money loses value quickly, wages and business incomes fail to keep up.
Foreign investors avoid economy, leading to capital flight and instability.
Example: Latin American economies in 1970s–80s (Argentina, Brazil, Chile) faced 50–700% inflation.
4. Hyperinflation (Runaway Inflation)
Extreme, uncontrolled inflation; prices rise by thousands or millions % annually.
Prices increase daily or hourly; currency loses all credibility.
Caused by reckless fiscal policy (excessive money printing, especially during wars).
Examples:
Germany after WWI: Currency became worthless, people burned banknotes for fuel.
Zimbabwe 2008: Inflation rate reached 79,600,000,000% in Nov 2008; prices doubled daily; barter system replaced money economy.
| Type | Rate of Price Rise | Impact |
|---|---|---|
| Creeping | Up to 2% annually | Boosts demand, favourable |
| Walking/Trotting | 3–9% annually | Hoarding tendency, demand rises |
| Galloping | 20–200% annually | Unstable economy, capital flight |
| Hyperinflation | Thousands–millions % annually | Collapse of currency, barter system returns |
Prelims tips
- Creeping inflation (up to 2%) is considered healthy.
- Galloping inflation (double/triple digit) causes instability.
- Hyperinflation examples: Germany (1920s), Zimbabwe (2008).
- Walking inflation leads to hoarding and speculation.
Mains points
- Creeping inflation is beneficial as it encourages spending and investment.
- Walking inflation starts creating inefficiencies due to hoarding.
- Galloping inflation destabilises currency and economy; reduces investor confidence.
- Hyperinflation completely erodes trust in money and shifts economy to barter/foreign currency.
- Policy response differs: creeping tolerated, hyperinflation requires drastic reforms.
Money – Meaning and Functions
Money is anything that is generally accepted as a medium of exchange, a measure of value, a store of wealth, and a standard for deferred payments. It makes trade and economic activity easier by eliminating the limitations of barter system.
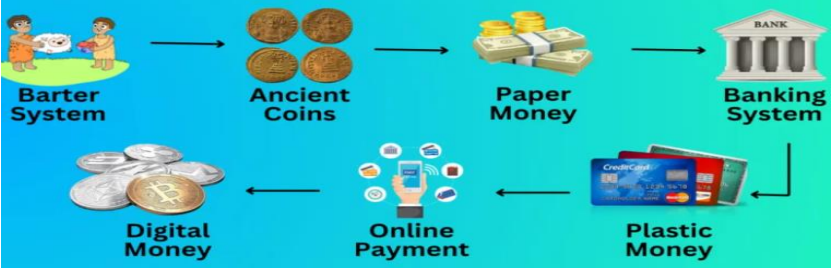
Introduction
Money is generally accepted as payment for goods and services, as well as repayment of debts.
It acts as a medium of exchange, replacing the barter system where goods were exchanged directly.
Without money, transactions would be complex as people would have to find someone who wanted exactly what they had to offer (double coincidence of wants).
Primary Functions of Money
1. Medium of Exchange
Money facilitates exchange of goods and services in an economy.
It is the most liquid asset (can be quickly and easily used without loss of value).
Example: You can buy food with currency notes rather than exchanging goods like rice for clothes.
2. Measure of Value (Unit of Account)
Money provides a common measure for valuing goods and services.
All goods and services can be expressed in terms of money units (like Rupees, Dollars, etc.).
Example: A book costs ₹200 and a shirt costs ₹400. Money makes it possible to compare values easily.
Secondary Functions of Money
1. Store of Value
Money can be saved and used in the future to purchase goods and services.
Unlike perishable goods (milk, fruits), money can be stored with very low cost.
However, it is not a perfect store of value because inflation reduces purchasing power over time.
Example: ₹100 today buys less goods after 10 years if prices keep rising.
2. Standard of Deferred Payments
Deferred payments mean payments promised for the future (like loans, EMIs).
Money is used for such payments because it retains value and is accepted widely.
Example: A loan of ₹10,000 today will be repaid in the future in money terms.
3. Transfer of Value
Money allows transfer of purchasing power from one person to another or from one place to another.
Example: Sending ₹5,000 online to a friend in another city transfers value instantly.
Other Functions of Money
1. Distribution of National Income
National income is measured and distributed in monetary terms using the income method.
Wages, rent, interest, and profits are all paid in money, making accounting and distribution easy.
2. Liquidity
Money is highly liquid (easily usable).
It can be divided into smaller units (₹1, ₹2 coins or ₹10, ₹100, ₹500 notes) to suit convenience.
3. Uniformity of Value
Money gives a uniform value measure for goods and services that cannot be compared physically.
Example: Comparing value of 1 kg of rice and 1 litre of petrol is possible only in money terms.
| Type | Function | Example |
|---|---|---|
| Primary | Medium of Exchange | Buying groceries with ₹500 note |
| Primary | Measure of Value | A pen costs ₹20, a shirt costs ₹500 |
| Secondary | Store of Value | Saving ₹1000 in wallet for future use |
| Secondary | Deferred Payments | Paying back a loan in instalments |
| Secondary | Transfer of Value | Sending money online to another city |
| Other | Distribution of National Income | Wages, rent, interest paid in money |
| Other | Liquidity | Breaking ₹500 note into smaller denominations |
| Other | Uniformity of Value | Comparing value of rice and petrol using ₹ |
Prelims tips
- Money overcomes the problem of double coincidence of wants in barter system.
- Primary functions: Medium of exchange & Measure of value.
- Secondary functions: Store of value, Deferred payments, Transfer of value.
- Other functions: Liquidity, uniformity, national income distribution.
Commodity Money and Barter System
Before the invention of modern currency, trade was carried out using commodity money and barter system. Commodity money had intrinsic value, while barter involved direct exchange of goods and services.
Commodity Money
Commodity money is a physical item that is interchangeable with another item of the same type.
It has intrinsic value, meaning it is valuable in itself (unlike paper notes that have only assigned value).
Examples: Iron nails, bear pelts, cocoa beans, whale teeth, gold nuggets, silver coins.
Challenges of Commodity Money
Perishability: Many items (like food grains, animal skins) spoil over time and lose value.
Bulky to transport: Carrying heavy or large commodities is difficult compared to paper currency.
Hyperinflation Risk: Sudden increase in commodity supply can collapse its value (e.g., gold rush).
Does not promote division of labour: Everyone must directly exchange, limiting specialization.
Limited in international trade: Hard to agree on a universal commodity standard globally.
Barter System
Direct exchange of goods and services without using money.
Oldest trade mechanism, used before the invention of coins or paper money.
Commonly exchanged goods: furs, skins, salt, rice, wheat, utensils, weapons, etc.
Types of Barter
1. Barter among Individuals – Example: Farmer exchanges wheat with carpenter for tools.
2. Barter among Companies – Example: Company offers products in exchange for advertisement services (B2B).
3. Barter among Countries – Example: Oil exchanged for food between nations.
| Aspect | Commodity Money | Barter System |
|---|---|---|
| Definition | Physical item with intrinsic value used as money | Direct exchange of goods/services without money |
| Value | Has intrinsic value (e.g., gold, cocoa beans) | Depends on mutual agreement |
| Challenges | Perishable, bulky, limited trade | Double coincidence of wants problem |
| Use in History | Used in early civilizations | Dominant before invention of money |
| Modern Relevance | Rare, replaced by currency | Still used in B2B & international trade |
Prelims tips
- Commodity money has intrinsic value (gold, silver).
- Barter suffers from 'Double Coincidence of Wants'.
- Barter still used in modern B2B and between nations.
Mains points
- Commodity money was a natural stage in evolution of money but limited due to perishability, bulkiness, and lack of uniformity.
- Barter system enabled trade but suffered from 'double coincidence of wants' – both parties must want what the other offers.
- Neither commodity money nor barter could support large-scale economies, industrialization, or globalization.
- The limitations of barter and commodity money created need for standardized, universally accepted money (coins, paper currency, and later digital money).
- Understanding these systems shows why monetary institutions like RBI and global currency systems are crucial today.
Demerits of Barter System & Evolution to Metallic Money
Barter system, though historically important, faced multiple limitations such as lack of common measurement, double coincidence of wants, and storage issues. To overcome these, societies gradually shifted to metallic standards (gold/silver) and coinage systems.
Demerits of Barter System
Search Cost: Finding a trading partner with desired goods/services was time-consuming.
Lack of Double Coincidence of Wants: Exchange possible only if both parties wanted what the other offered. Very unrealistic in large economies.
Lack of Divisibility: Some goods (like buffalo, house) cannot be divided into smaller parts to match value of smaller goods.
Lack of Common Unit of Measurement: No standard to compare value of wheat vs tools vs cattle.
Loss of Value: Many goods (food, skins, grains) lost value/quality over time when stored.
Metallic Standard
Shift from barter to use of metals as money.
Gold Standard: Value of currency linked directly to fixed weight of gold.
Silver Standard: Value of currency linked to fixed weight of silver. Example: Silver Tanka, Sher Shah Suri’s Rupiya (silver coin).
Ensured wider acceptability, durability, and standardization.
Full Bodied Coins
Intrinsic value of coin = or > face value (market price).
Example: 1 Rupee silver coin (worth its weight in silver).
Token Coins
Intrinsic value < face value.
Example: ₹1 stainless steel coin.
Metals like cupronickel used to discourage melting.
Coinage Act 2011 prohibits melting of coins.
Challenges of Metallic Coins
Hoarding: If metal value > coin value, people hoard coins instead of using them.
Melting: High intrinsic value coins are melted into bullion for profit.
Debasement: Reducing metal content in coins when treasury weakens → inflation.
Demonetization: Both full-bodied and token coins can be demonetized (withdrawn from circulation).
| Aspect | Barter System | Metallic Money |
|---|---|---|
| Unit of Value | No common unit | Gold/Silver weight as standard |
| Divisibility | Difficult to divide goods | Coins easily divisible |
| Storage | Perishable goods lose value | Metals durable and storable |
| Trade | Limited to small/local trades | Facilitates large-scale trade |
| International Trade | Not feasible | Universally acceptable metals |
Prelims tips
- Barter failed due to 'double coincidence of wants'.
- Sher Shah Suri introduced the silver Rupiya under silver standard.
- Full-bodied coins = intrinsic value ≥ face value; Token coins = intrinsic value < face value.
Mains points
- Barter system’s inefficiencies like lack of measurement and coincidence of wants highlighted the need for money.
- Metallic standards brought durability, acceptability, and universal trade feasibility.
- Full-bodied coins ensured trust but created risks of hoarding and melting when metal value rose.
- Token coins allowed expansion of money supply but required state regulation (like Coinage Act 2011).
- Shift from barter → metallic money → token coins reflects evolution towards efficiency, stability, and state-backed monetary systems.
Paper Currency Standard & Legal Tender
Under the Paper Currency Standard, the central bank issues currency notes and coins as legal tender. Modern money is mostly Fiat Money – it has no intrinsic value and is valid because the government declares it so.
Paper Currency Standard
Under this system, a country’s central bank issues paper notes and coins as the official legal tender.
Paper money is also called Fiat Money, meaning it has value only because the government declares it so.
In India, the Reserve Bank of India (RBI) issues currency notes on behalf of the Central Government.
Conditions of Fiat Money:
Must exist in physical form (notes/coins) or digital form (virtual coin, CBDC, crypto coin).
Must be issued by the order of the Government or the Central Bank.
Must not be backed by tangible assets like gold or silver (no intrinsic value).
Since the end of the Gold Standard in 1971, almost all currencies worldwide are fiat currencies.
Legal Tender
Legal Tender refers to currency (coins or notes) that must be accepted for repayment of debt or settlement of transactions.
Called legal tender because no citizen can refuse it for settling payments.
Cheques, drafts, promissory notes are not legal tender – they can be refused by the payee.
Conditions of Legal Tender:
It must be Fiat Money.
It must be legally valid for all debts and transactions within the country.
Types of Legal Tender
1. Limited Legal Tender
Coins are considered limited legal tender.
Recipients can refuse payment beyond a certain limit.
It can settle only a limited amount of debt.
Issued by the Government under the Coinage Act.
2. Unlimited Legal Tender
Currency Notes are unlimited legal tender.
They can settle any amount of debt (with some government restrictions).
Example: Finance Act, 2017 imposed restriction on cash transactions above ₹2 lakh.
Notes are issued by the RBI, except the one-rupee note which is issued by the Government of India and signed by the Finance Secretary.
| Aspect | Limited Legal Tender | Unlimited Legal Tender |
|---|---|---|
| Form | Coins | Currency Notes |
| Acceptance | Can be refused beyond a limit | Cannot be refused for any debt |
| Debt Settlement | Only for limited amount | Any amount of debt |
| Issuer | Government (under Coinage Act) | RBI (except ₹1 note by Govt.) |
| Restriction Example | Not beyond certain value | Finance Act 2017 – Cash > ₹2 lakh restricted |
Prelims tips
- All modern currencies are Fiat Money (not backed by gold/silver).
- In India, RBI issues currency notes, except ₹1 note which is issued by Govt. of India.
- Coins = Limited Legal Tender; Notes = Unlimited Legal Tender.
Mains points
- Paper Currency Standard shows the transition from commodity-backed money to state-backed fiat money.
- Fiat money provides flexibility to governments in monetary policy but also creates risks of inflation if misused.
- Legal tender ensures standardization of transactions and prevents disputes in debt settlement.
- Restrictions (like Finance Act 2017) reflect attempts to curb black money and regulate cash economy.
- Evolution from gold/silver backing to fiat currency highlights growing trust in state institutions and central banks.
Poverty – Concept, Dimensions and Facts
Poverty means a condition where a person or family does not have enough resources to meet basic needs like food, clothing, shelter, healthcare, and education. It is not just about lack of money, but also about lack of opportunities, security, and dignity. Eradicating poverty is a global human right and one of the Sustainable Development Goals (SDGs).
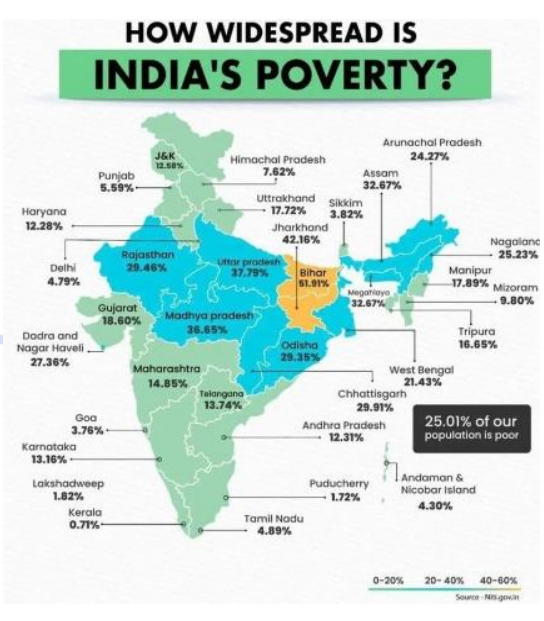
Introduction
Poverty is not just about low income but about deprivation of choices and opportunities to live a decent life.
According to the Human Development Report (1997), poverty is the denial of choices and opportunities to enjoy a basic standard of living.
Eliminating poverty is both a moral responsibility and a human right.
What is Poverty?
A social condition where a section of society cannot meet its survival needs.
UN Human Rights Council: Poverty = persistent deprivation of resources, choices, security, and power needed for adequate living and rights.
Poverty is multidimensional – includes lack of education, healthcare, and social inclusion, not just income.
Global Standard
The UN aims to end extreme poverty everywhere by 2030 (SDG Goal 1).
World Bank defines extreme poverty as living on less than 2.15 per day (International Poverty Line).
Multidimensional Poverty in India
NITI Aayog Report (2023): Poverty in India reduced from 29.17% (2013-14) to 11.28% (2022-23).
Nearly 24.82 crore people moved out of poverty in 9 years.
Largest improvements seen in Uttar Pradesh, Bihar, and Madhya Pradesh.
Global Poverty Facts
At 2.15/day line, 8.5% of the world’s population (659 million people) still live in poverty.
Poverty reduction is uneven across regions – South Asia and Sub-Saharan Africa remain most affected.
| Aspect | Details |
|---|---|
| Definition | Lack of resources to meet basic needs and dignity of life |
| UN Definition | Persistent deprivation of resources, opportunities, and rights |
| Global Standard | Extreme poverty = <2.15 per day (World Bank) |
| India’s Progress | 29.17% poor in 2013-14 → 11.28% poor in 2022-23 |
| Global Situation | 659 million poor (8.5% of world population) |
Prelims tips
- Extreme poverty = living under 2.15/day (World Bank IPL).
- SDG Goal 1 = End poverty in all forms everywhere by 2030.
- India: 24.82 crore people came out of multidimensional poverty (2013–2023).
- States with maximum poverty reduction: UP, Bihar, MP.
Mains points
- Poverty is multidimensional – not just income but access to education, health, and dignity.
- India has made significant progress in reducing poverty (NITI Aayog data).
- Global poverty is still concentrated in South Asia and Africa.
- Poverty eradication is linked to achieving SDGs, especially Goal 1 (No Poverty).
- Addressing poverty requires inclusive growth, social security, and human development investments.
Types of Poverty and Categorisation of the Poor
Poverty can be understood in different forms such as absolute, relative, environmental, and collective poverty. Beyond income, it includes lack of capabilities, resources, and access to essentials. Poverty is also classified into groups like chronic poor, churning poor, and occasionally poor, based on duration and intensity.
Types of Poverty
Absolute Poverty: When people cannot meet basic needs like food, shelter, clothing. Defined by UN as severe deprivation of essentials such as food, water, sanitation, health, education. World Bank sets absolute poverty line at 2.15/day (PPP, 2017).
Relative Poverty: Poverty measured in comparison with society’s standard of living. A person may not be poor in one country but poor in another due to different living standards.
Environmental Poverty: Lack of access to environmental resources like clean water, fertile land, clean air, and healthy ecosystems. Example: Rajasthan’s Barmer district, where families fetch contaminated water from far distances.
Collective Poverty: When entire groups or communities remain poor due to systemic or historical factors. Example: Gond and Santhal tribes facing poverty due to social exclusion.
Human Poverty: Lack of basic human capabilities like literacy, nutrition, and healthcare.
Income Poverty: Lack of sufficient income to meet minimum consumption needs.
Extreme Poverty: Defined by World Bank as living on less than 1.90 per day.
Categorisation of Poor
Chronic Poor: People who are persistently poor (e.g., casual laborers).
Churning Poor: People who frequently move in and out of poverty (e.g., small farmers, seasonal workers).
Occasionally Poor: People who are usually well-off but sometimes fall into poverty (e.g., during illness, crop failure, or job loss).
| Aspect | Absolute Poverty | Relative Poverty |
|---|---|---|
| Definition | Lack of fixed basic necessities for survival | Income/resource inadequacy compared to societal standards |
| Measurement | Specific income threshold (e.g., 2.15/day, World Bank) | Comparative to average/median income in society |
| Focus | Survival and basic needs (food, shelter, clothing) | Disparities and inequality within society |
| Policy Implications | Provide basic services like food, shelter, health | Reduce inequality, improve overall living conditions |
| Long-term Trends | Stable unless poverty line is redefined | Changes with growth, policies, and income distribution |
Prelims tips
- Absolute poverty line (World Bank): 2.15/day (2017 PPP).
- Extreme poverty (World Bank): 1.90/day.
- Relative poverty is context-based – differs across countries.
- Environmental and collective poverty highlight resource and community-level deprivation.
- Types of poor: chronic, churning, occasionally poor.
Mains points
- Poverty is multidimensional – absolute, relative, environmental, and collective forms highlight different aspects.
- Absolute poverty focuses on survival, relative poverty on inequality.
- Environmental poverty shows link between environment and poverty (water, air, land).
- Collective poverty highlights systemic and historical exclusion.
- Categorisation of poor (chronic, churning, occasional) helps in policy targeting and designing welfare schemes.
Banking and Functions of Banks
Banks are financial institutions authorised by the government to accept deposits and provide loans. They act as intermediaries between people who have surplus money and those who need funds. They perform both primary and secondary functions, contributing to economic growth.

What are Banks?
Banks are authorised financial institutions that accept deposits and provide loans.
They channelise surplus funds from depositors to borrowers and businesses.
Their primary motive is profit but they also support development of trade, industry and services.
Primary Functions of Banks
Accepting Deposits:
Current Account Deposits: Payable on demand; mainly used by businesses; no interest.
Savings Account Deposits: Aimed at individuals to encourage savings; small interest rate.
Fixed Deposits (Time Deposits): Locked for a fixed period; earn higher interest but cannot be withdrawn before maturity.
Granting Loans and Advances:
Banks keep a fraction of deposits as reserve and lend the rest.
Cash Credit: Short-term loan against security; borrower can withdraw up to sanctioned limit.
Short-term Loans: Given for working capital or personal needs, repayable in one or more instalments.
Secondary Functions of Banks
Discounting Bills of Exchange: Bank buys a bill before maturity at a discount and collects full value later. The difference is bank’s profit.
Credit Creation: By giving loans, banks increase money supply in the economy.
Financing Foreign Trade: Accept and collect foreign bills, deal in foreign currencies, support exporters/importers.
Agency Functions: Banks act as agents for customers – collecting cheques, paying taxes, buying/selling securities, transferring funds etc.
General Utility Services: Providing lockers, issuing traveller’s cheques, gift cheques, credit/debit cards, internet banking etc.
| Type | Description | Interest |
|---|---|---|
| Current Account | Payable on demand; mainly used by businesses | No interest |
| Savings Account | For individuals to save; flexible withdrawals | Low fixed rate |
| Fixed Deposits | Locked for fixed period; cannot be withdrawn early | Higher interest |
Prelims tips
- Primary functions: Accepting deposits + Granting loans.
- Secondary functions: Discounting bills, credit creation, financing foreign trade.
- Current Account = no interest, Savings Account = low interest, Fixed Deposit = higher interest.
Mains points
- Banks are crucial intermediaries in the financial system.
- They perform both deposit-taking and lending functions, which are essential for economic growth.
- Their secondary functions like credit creation and foreign trade financing support business expansion.
- Banks also provide agency and utility services, improving convenience for customers.
- Strong banking systems promote financial inclusion and overall stability in the economy.
History of Banking Structure in India
The history of banking in India can be divided into two phases: Pre-Independence (till 1947), dominated by private banks and presidency banks, and Post-Independence (after 1947), marked by nationalisation, establishment of RBI as central authority, creation of RRBs and specialised banks.
Pre-Independence Phase (Till 1947)
Banking was dominated by private banks organised as joint-stock companies.
First joint-stock type bank: Bank of Bombay (1720).
Other early banks: Bank of Hindustan (1770, Calcutta) and General Bank of India (1786).
Presidency Banks: Bank of Calcutta (1806), Bank of Bombay (1840), Bank of Madras (1843). Merged in 1921 to form Imperial Bank of India.
First Indian-owned bank: Allahabad Bank (1865). Later Punjab National Bank (1895, Lahore) and Bank of India (1906, Mumbai).
Swadeshi Movement (1906) encouraged Indian-owned commercial banks such as Central Bank of India, Bank of Baroda, Canara Bank, Indian Bank, Bank of Mysore (1906–1913).
Reserve Bank of India (RBI) was established in 1935 based on Hilton Young Commission recommendations.
Post-Independence Phase – I (1947–1991)
At independence, all banks including RBI were in private sector.
Severe crisis in 1948 – more than 637 banks failed due to weak prudential practices.
RBI was nationalised in 1949; Banking Companies Act, 1949 gave RBI supervisory powers.
By 1967, banking sector consolidated due to RBI’s policy of amalgamation and mergers.
Nationalisation milestones:
Imperial Bank of India nationalised in 1955 → became State Bank of India (SBI).
14 major commercial banks nationalised in 1969.
6 more commercial banks nationalised in 1980.
Regional Rural Banks (RRBs) established in 1975 to strengthen rural credit.
Specialised Banks set up:
Export-Import Bank (EXIM), 1982.
National Housing Bank (NHB), 1988.
Small Industries Development Bank of India (SIDBI), 1990.
| Year | Event |
|---|---|
| 1770 | Bank of Hindustan established in Calcutta (first bank in India) |
| 1806 | Bank of Calcutta established |
| 1840 | Bank of Bombay established |
| 1843 | Bank of Madras established |
| 1921 | Three Presidency Banks merged to form Imperial Bank of India |
| 1935 | Reserve Bank of India established |
| 1955 | Imperial Bank nationalised as State Bank of India |
| 1969 | 14 major commercial banks nationalised |
| 1975 | Regional Rural Banks established |
| 1982 | Export-Import Bank (EXIM) established |
| 1988 | National Housing Bank (NHB) established |
| 1990 | Small Industries Development Bank of India (SIDBI) established |
Prelims tips
- First Indian-owned bank: Allahabad Bank (1865).
- Imperial Bank → SBI in 1955.
- 14 banks nationalised in 1969, 6 in 1980.
- RBI was established in 1935 on Hilton Young Commission recommendations.
Mains points
- Pre-independence banking was dominated by presidency banks and private joint-stock banks.
- Swadeshi movement boosted Indian ownership in banking sector.
- Post-independence reforms included RBI nationalisation (1949) and commercial banks nationalisation (1969, 1980).
- SBI and its associates expanded banking to rural and semi-urban areas.
- Establishment of RRBs and specialised banks like EXIM, NHB, SIDBI targeted sector-specific needs.
- These steps laid the foundation of financial inclusion and stronger regulatory oversight.
History of Banking Structure in India – Post-Independence Phase II (1991 onwards)
After 1991, with LPG reforms (Liberalisation, Privatisation, Globalisation), Indian banking entered a modern phase with private banks, foreign banks, financial sector reforms, technology-driven banking, digitalisation and stronger regulations.
Post-Independence Phase II (1991 onwards)
Economic reforms of 1991 changed the financial sector landscape in India.
Narasimham Committee (1991, 1998) recommended major banking reforms including financial liberalisation, reducing NPAs, and strengthening supervision.
Entry of private and foreign banks allowed – ICICI Bank, HDFC Bank, Axis Bank, Kotak Mahindra Bank emerged as new-generation private banks.
Emphasis on prudential norms: Capital Adequacy Ratio (CAR), asset classification, income recognition norms introduced.
RBI adopted modern regulatory framework aligned with Basel norms (Basel I, II, III).
Financial inclusion became priority with schemes like Jan Dhan Yojana, RBI's push for rural banking.
Key Developments since 1991
Liberalisation: Private and foreign banks allowed greater participation.
Technological changes: Introduction of ATMs, Core Banking Solutions (CBS), internet banking, mobile banking.
Payment innovations: NEFT, RTGS, IMPS, UPI (2016), Bharat Bill Payment System, RuPay.
Banking consolidation: Merger of public sector banks to improve efficiency and capital strength (e.g., SBI with associates in 2017, Bank mergers 2019–2020).
Focus on NPAs: Insolvency and Bankruptcy Code (2016) introduced for faster resolution of bad loans.
Financial inclusion: Pradhan Mantri Jan Dhan Yojana (2014) gave crores of people first-time access to bank accounts.
Digitalisation: Digital India initiative, UPI and Aadhaar-enabled payments pushed India towards a cashless economy.
Current Trends
Rise of fintechs and digital payment apps (PhonePe, Paytm, Google Pay).
Expansion of credit facilities like Mudra loans for MSMEs.
Central Bank Digital Currency (CBDC) pilot by RBI.
Ongoing consolidation of banks and emphasis on global competitiveness.
| Year | Reform/Development |
|---|---|
| 1991 | Narasimham Committee I – Banking reforms roadmap |
| 1998 | Narasimham Committee II – Strengthening banking sector |
| 2001 | Introduction of Core Banking Solutions |
| 2005 | NEFT system introduced by RBI |
| 2010 | Mobile banking and digital wallets expanded |
| 2016 | UPI launched, IBC enacted for NPAs |
| 2017 | SBI merged with its associate banks |
| 2019–20 | Major PSU bank mergers (e.g., PNB + OBC + United Bank) |
| 2022 | Pilot launch of RBI's Digital Rupee (CBDC) |
Prelims tips
- Narasimham Committees (1991 & 1998) recommended reforms in banking.
- 14 banks nationalised in 1969, 6 in 1980; post-1991 focus shifted to privatisation & consolidation.
- UPI launched in 2016 by NPCI, revolutionised digital payments.
- IBC 2016 crucial for NPA resolution.
- CBDC (Digital Rupee) pilot started by RBI in 2022.
Mains points
- Post-1991 reforms modernised the Indian banking system with private banks, foreign banks and stronger prudential norms.
- Technology adoption (ATMs, internet banking, UPI) revolutionised banking services.
- Consolidation of PSU banks aimed at creating globally competitive banks.
- NPA crisis addressed through IBC 2016, improving credit culture.
- Financial inclusion became central with Jan Dhan Yojana, Aadhaar-enabled payments.
- Digitalisation and fintechs transformed banking into customer-centric, efficient and cashless system.
Monetary Policy
Monetary policy is the use of tools by a country’s central bank (in India, the RBI) to regulate money supply, control inflation, promote growth, and ensure economic stability. It works alongside fiscal policy, but is independent in nature.
Introduction
Monetary policy = actions by RBI to manage money supply, inflation, credit, and growth.
Fiscal policy = actions by Government through taxation, spending, and borrowing.
Both affect the money supply but in different ways.
Goals of Monetary Policy
1. Controlling Inflation
Inflation = rise in general price level.
RBI uses contractionary monetary policy to control high inflation by reducing money supply.
Example: RBI increases repo rate (rate at which RBI lends to banks) → borrowing becomes costlier → less demand → inflation falls.
2. Promoting Economic Growth
RBI ensures stable conditions for investment, productivity, and employment.
Example: During slowdown, RBI reduces interest rates → loans cheaper → businesses invest more → jobs increase → demand rises.
3. Reducing Unemployment
Expansionary monetary policy increases money supply.
Lower interest rates encourage borrowing → more business activity → more jobs → unemployment decreases.
4. Managing Exchange Rates
RBI intervenes in forex market to stabilize rupee value.
Example: RBI sells dollars → dollar supply in market rises → rupee strengthens (as demand for rupee increases).
| Goal | Explanation | Example |
|---|---|---|
| Control Inflation | Reduce money supply when prices rise | Raise repo rate to reduce borrowing |
| Economic Growth | Stimulate demand and investment | Lower repo rate during slowdown |
| Reduce Unemployment | More jobs via expansionary credit policies | Cheaper loans encourage hiring |
| Exchange Rate Stability | RBI intervenes in forex market | Selling dollars to strengthen rupee |
Prelims tips
- Repo rate = RBI lending rate to commercial banks.
- Contractionary monetary policy → controls inflation.
- Expansionary monetary policy → reduces unemployment and boosts growth.
- RBI intervenes in forex market to stabilize rupee.
Mains points
- Monetary policy balances inflation control with growth promotion.
- RBI uses repo, reverse repo, CRR, SLR, OMOs as tools.
- Acts as stabilizer against unemployment and external shocks.
- Helps in maintaining currency stability in forex markets.
- Needs coordination with fiscal policy for maximum impact.
Types of Monetary Policy
There are two main types of monetary policy: Expansionary and Contractionary. Expansionary policy increases money supply to boost growth during slowdowns, while Contractionary policy reduces money supply to control inflation during overheating of the economy.
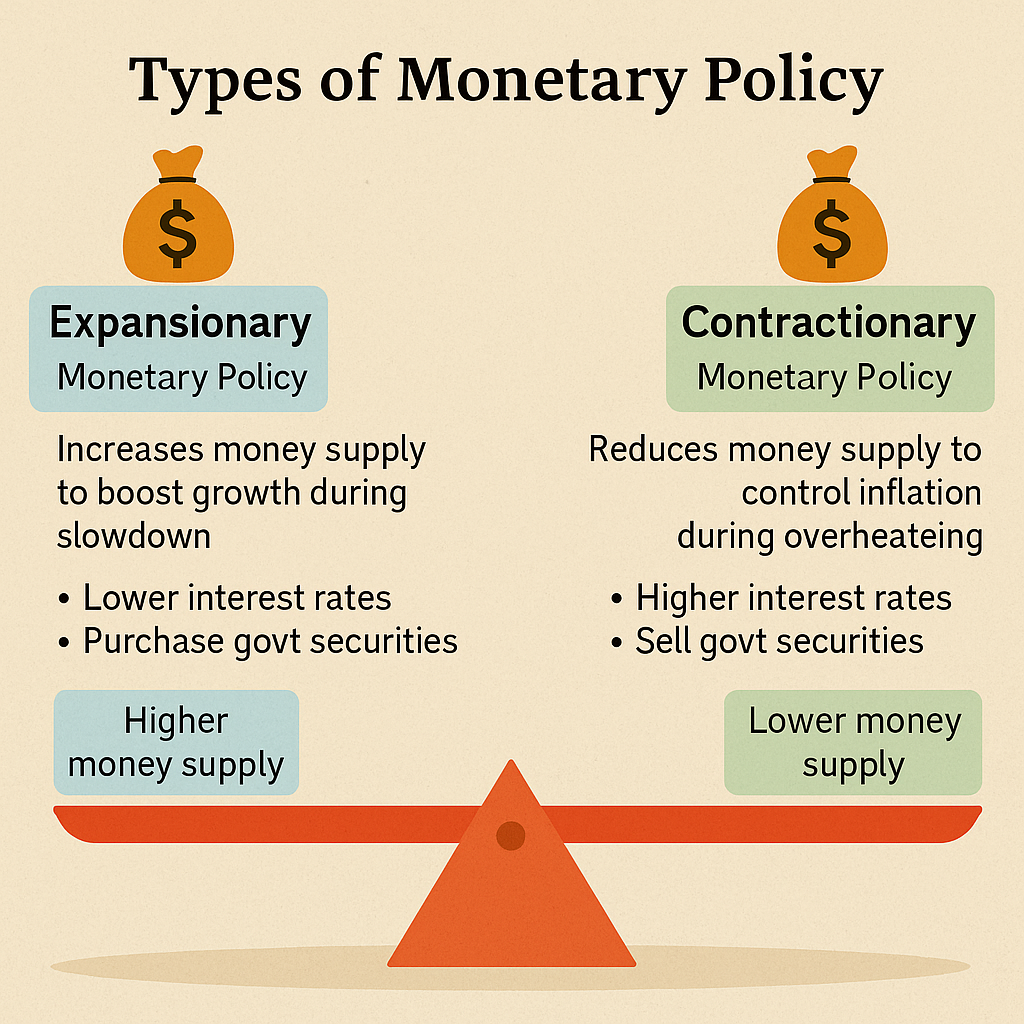
Expansionary Monetary Policy
Meaning: Injecting more money into the economy to encourage growth.
Objective: To fight recession, depression, or periods of low economic growth.
Tools used: Lowering interest rates, reducing reserve requirements, and purchasing government securities.
How it Works
1. Lowering Interest Rates: Makes loans cheaper → more borrowing and spending → boosts investment and demand.
2. Purchasing Govt Securities (Quantitative Easing): RBI buys securities in open market → injects money into the system → increases liquidity → stimulates growth.
3. Lowering Reserve Requirements: Banks hold less in reserve (lower CRR/SLR) → more money available to lend → higher spending and demand.
Contractionary Monetary Policy
Meaning: Reducing money supply in the economy to curb spending and inflation.
Objective: To fight high inflation or hyperinflation.
Tools used: Raising interest rates, increasing reserve requirements, and selling government securities.
How it Works
1. Raising Interest Rates: Loans become costlier → borrowing reduces → less spending and investment → controls inflation.
2. Selling Govt Securities: RBI sells securities → money absorbed from market → reduces liquidity → slows demand.
3. Increasing Reserve Requirements: Higher CRR/SLR → banks must hold more reserves → less lending to public → reduced money supply.
| Aspect | Expansionary Policy | Contractionary Policy |
|---|---|---|
| Purpose | Boost growth during slowdown | Control inflation during overheating |
| Money Supply | Increases | Decreases |
| Interest Rates | Lowered | Raised |
| Reserve Requirements | Reduced (Lower CRR/SLR) | Increased (Higher CRR/SLR) |
| Govt Securities | Purchased (injects money) | Sold (absorbs money) |
Prelims tips
- Expansionary = more money supply, lower interest rates.
- Contractionary = less money supply, higher interest rates.
- Quantitative Easing = RBI buying govt securities.
- OMOs (Open Market Operations) = buying/selling govt securities.
Mains points
- Expansionary policy helps fight unemployment and low growth but may risk higher inflation.
- Contractionary policy controls inflation but may slow growth and increase unemployment.
- RBI balances both policies depending on economic conditions.
- Both use tools like repo, reverse repo, CRR, SLR, and OMOs.
- Choice depends on macroeconomic goals – stability vs. growth.
Monetary Policy Framework in India
The Monetary Policy Framework is the system through which the Reserve Bank of India (RBI) manages money supply, credit, and inflation in the economy. Its main goal is to keep inflation under control while also ensuring enough money is available for economic growth. Since 2016, India follows a Flexible Inflation Targeting (FIT) framework where the inflation target is set for 5 years.
Broad Objectives of Monetary Policy (as explained by former RBI Governor C. Rangarajan)
To regulate the amount of money in the economy so that prices do not rise too quickly (price stability).
To make sure there is enough credit (loans from banks) available for businesses and people to support growth in jobs and income.
Evolution of Framework
Earlier system: RBI tried to balance inflation (rise in prices) and growth, but there was no fixed or legal target for inflation.
Problem: Without a clear target, inflation sometimes went too high or too low, creating uncertainty.
Solution in 2016: The RBI Act was amended to introduce a new system called the Flexible Inflation Targeting (FIT) framework.
Under this, the Government of India, in consultation with RBI, sets an official inflation target once every 5 years.
Present Monetary Policy Framework
Inflation in India is measured using the Consumer Price Index (CPI), which shows the average price change of goods and services consumed by households.
In August 2016, the Govt fixed the inflation target at 4% CPI with an upper tolerance of 6% and a lower tolerance of 2%.
This means inflation should ideally stay close to 4%. But if it stays between 2% and 6%, it is still acceptable.
First 5-year period: Aug 2016 – March 2021.
Second 5-year period: April 2021 – March 2026 (target retained at 4% ± 2%).
RBI uses this target to decide monetary tools like repo rate, reverse repo, Cash Reserve Ratio (CRR), Statutory Liquidity Ratio (SLR), and Open Market Operations (OMO).
Importance: This framework makes RBI more accountable and helps people and businesses trust that inflation will stay under control.
| Period | Target Inflation | Tolerance Band | Remarks |
|---|---|---|---|
| 2016–2021 | 4% CPI | ±2% (2-6%) | First official inflation target under FIT framework |
| 2021–2026 | 4% CPI | ±2% (2-6%) | Target retained for next 5 years |
Prelims tips
- 2016 amendment to RBI Act introduced Flexible Inflation Targeting (FIT).
- Inflation target = 4% CPI with 2–6% tolerance band.
- Target is set once every 5 years by Govt in consultation with RBI.
- Current validity: April 2021 – March 2026.
Mains points
- Monetary Policy Framework creates balance between price stability and growth.
- Flexible Inflation Targeting makes RBI more accountable and transparent.
- Helps in anchoring inflation expectations among people and businesses.
- Ensures inflation measured through CPI remains central to policy decisions.
- Challenges remain: supply-side factors like fuel and food prices are beyond RBI’s control.
Monetary Policy Committee (MPC)
The Monetary Policy Committee (MPC) is a six-member body formed under Section 45ZB of the amended RBI Act, 1934. It was first set up in September 2016. The MPC decides the policy repo rate needed to achieve the inflation target (currently 4% CPI within 2-6% band). It meets at least 4 times a year, usually once every two months.
About MPC
Established under RBI Act amendment, 2016 to give collective decision-making power in monetary policy.
Ensures transparency, accountability, and reduces sole dependency on RBI Governor.
Decides the repo rate to achieve inflation target under Flexible Inflation Targeting framework.
Composition of MPC
Total Members: 6.
3 from RBI:
RBI Governor (Chairperson, ex-officio).
RBI Deputy Governor (ex-officio).
One member nominated by RBI Central Board.
3 nominated by Central Government:
Selected by a Search-cum-Selection Committee headed by Cabinet Secretary (RBI Governor is also part of this committee).
Hold office for 4 years.
Not eligible for reappointment.
Working of MPC
Quorum: Minimum 4 members required for a meeting.
Voting: Each member has one vote. In case of tie, RBI Governor has casting vote.
Frequency: Meets at least 4 times a year, usually every 2 months.
RBI publishes a Monetary Policy Report (every 6 months) covering:
Past 6 months’ inflation trends.
Inflation and growth projections.
Economic assessment and risks.
Failure to Maintain Inflation Target
Section 45ZN of RBI Act: If inflation stays outside 2-6% band for 3 consecutive quarters (9 months), RBI must:
Call a special MPC meeting.
Submit report to Central Govt explaining reasons for failure.
Suggest corrective actions.
Provide timeline for bringing inflation back within target.
Example: In November 2022, RBI had to submit such a report as inflation stayed above 6% for 3 consecutive quarters.
| Member | Nominated By | Details |
|---|---|---|
| RBI Governor | RBI | Chairperson, ex-officio |
| RBI Deputy Governor | RBI | Ex-officio member |
| One member from RBI Central Board | RBI | Nominated by RBI Board |
| Three external members | Central Govt | Selected for 4 years, no reappointment |
Prelims tips
- MPC established under Section 45ZB of RBI Act, 1934 (amended in 2016).
- Total 6 members: 3 RBI + 3 Govt nominated.
- Repo rate is decided by MPC to achieve inflation target (4% ± 2%).
- Governor has casting vote in case of tie.
- Special report required if inflation outside 2–6% for 3 consecutive quarters (Sec 45ZN).
Mains points
- MPC institutionalizes monetary policy decisions, ensuring collective wisdom instead of one-person discretion.
- Brings transparency, accountability, and predictability in RBI’s decisions.
- Supports the inflation targeting regime (FIT) by setting repo rate accordingly.
- Failure clause ensures RBI explains its actions, increasing credibility.
- November 2022 was first instance RBI submitted a report after failing inflation target.
Instruments of Monetary Policy – Quantitative Tools
Quantitative tools of monetary policy are used by the RBI to control the overall supply of money and credit in the economy. The most important among them are Repo Rate, Reverse Repo Rate, Bank Rate, Cash Reserve Ratio (CRR), Statutory Liquidity Ratio (SLR), and Open Market Operations (OMO).
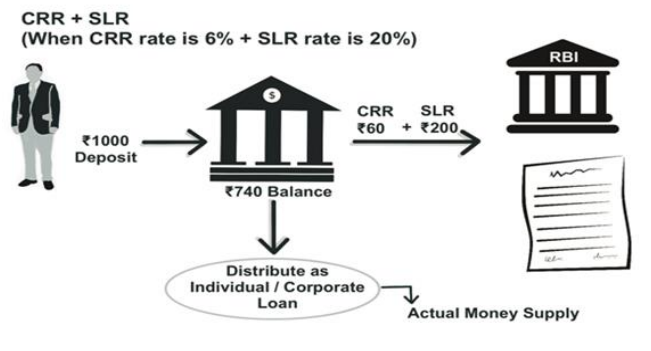
Quantitative Tools
These tools regulate the total volume of money and credit in the economy, without focusing on any specific sector.
Examples: Repo rate, Reverse repo rate, Bank rate, CRR, SLR, OMO.
Cash Reserve Ratio (CRR)
CRR is the percentage of a commercial bank’s Net Demand and Time Liabilities (NDTL) that must be kept in cash with RBI.
This money cannot be used by banks for lending or investment and RBI does not pay any interest on it.
Applies only to scheduled commercial banks (not RRBs or NBFCs).
Example: If CRR = 4% and a bank has deposits worth ₹100 crore, it must keep ₹4 crore with RBI.
Recent Changes: During COVID (2020) it was reduced to 3%. In 2022, increased to 4.5%.
Statutory Liquidity Ratio (SLR)
SLR is the percentage of a commercial bank’s NDTL that must be kept in the form of liquid assets like cash, gold, or approved government securities.
Unlike CRR, SLR is not kept with RBI but maintained by the banks themselves.
It acts as a safety net against excessive withdrawals and maintains public confidence in banks.
Example: If SLR = 18% and a bank has ₹100 crore in deposits, it must keep ₹18 crore in liquid assets.
As per Banking Regulation Act, 1949, maximum SLR can be up to 40% (presently 18%).
CRR vs. SLR
Both are statutory reserve ratios that reduce lending capacity of banks, but differ in form and purpose.
| Aspect | CRR | SLR |
|---|---|---|
| Definition | Minimum cash % of deposits kept with RBI | Minimum % of deposits in cash, gold, or approved securities kept by banks themselves |
| Legal Basis | RBI Act, 1934 | Banking Regulation Act, 1949 |
| Where Held | With RBI | With Banks themselves |
| Interest | No interest paid by RBI | Banks can earn some interest on securities |
| Current Rate | 4.5% of NDTL | 18% of NDTL |
| Limit | No fixed maximum, but not 100% | Cannot exceed 40% |
Prelims tips
- CRR is maintained with RBI in cash form; SLR is maintained with banks themselves in cash/gold/securities.
- CRR = 4.5% (2022), SLR = 18%.
- CRR governed by RBI Act, 1934; SLR governed by Banking Regulation Act, 1949.
- Both CRR and SLR reduce lending capacity of banks.
Mains points
- CRR and SLR are key tools to control inflation and liquidity in the economy.
- Higher CRR/SLR = less money for lending = contractionary effect.
- Lower CRR/SLR = more money for lending = expansionary effect.
- They ensure financial discipline and protect depositors’ money.
- CRR directly affects bank liquidity; SLR provides a buffer for financial stability.
CRR, SLR, SDF and LAF in Monetary Policy
CRR and SLR are statutory reserve requirements that directly affect money supply, interest rates, and economic activity. RBI also uses new tools like the Standing Deposit Facility (SDF) and Liquidity Adjustment Facility (LAF) to manage liquidity, inflation, and stability in the financial system.
Impact of Increasing or Decreasing CRR/SLR
When CRR/SLR increases:
Banks must keep more money with RBI (CRR) or in liquid assets (SLR).
Less loanable money remains with banks → they raise interest rates.
Borrowing decreases → investments and consumption reduce.
This reduces demand → lowers inflation (but may slow down growth).
When CRR/SLR decreases:
Banks have more loanable funds available.
They reduce lending rates → more borrowing.
Investments and consumption rise → boosts production and growth.
But excessive credit can cause inflation.
Recent CRR Changes
2019: CRR was 4%.
2020: Reduced to 3% after lockdown to support economy during GDP contraction.
2021: Raised back to 4% due to inflation from supply chain disruptions (COVID).
May 2022: Increased from 4% to 4.5% (absorbed ₹87,000 crore liquidity) due to inflation from post-pandemic effects and Russia-Ukraine war.
Standing Deposit Facility (SDF)
Introduced by RBI in April 2022.
Replaced fixed Reverse Repo Rate as floor of Liquidity Adjustment Facility (LAF) corridor.
Proposed by Urjit Patel Committee (2014), enabled by RBI Act amendment (2018).
Difference from Reverse Repo: Banks park excess funds with RBI without RBI giving collateral (no need for RBI to provide G-Secs).
Reverse Repo Rate remains in toolkit, used as per RBI discretion.
Currently: SDF is 25 basis points (0.25%) below Repo Rate.
Significance:
Helps RBI absorb large liquidity during extraordinary times (e.g., post-2008 financial crisis, 2016 demonetisation).
Banks can voluntarily park excess liquidity with RBI under SDF.
Liquidity Adjustment Facility (LAF)
Introduced in 2000 (Narasimham Committee, 1998).
Facility for scheduled commercial banks (except RRBs) and Primary Dealers.
Purpose: Manage day-to-day liquidity.
Mechanism:
Repo Rate → Banks borrow from RBI against G-Secs (adds liquidity).
Reverse Repo Rate → Banks lend to RBI by parking funds (absorbs liquidity).
Benefits:
Helps control inflation by adjusting liquidity.
Provides short-term liquidity support to banks during shocks or instability.
| Condition | Impact on Banks | Impact on Economy |
|---|---|---|
| CRR/SLR Increases | Less money to lend, higher interest rates | Reduced borrowing, demand falls, inflation decreases |
| CRR/SLR Decreases | More money to lend, lower interest rates | More borrowing, demand rises, growth increases (but risk of inflation) |
| Aspect | SDF | Reverse Repo | LAF |
|---|---|---|---|
| Introduced | 2022 | 2000 (LAF toolkit) | 2000 |
| Collateral | No collateral required | RBI provides collateral (G-Secs) | G-Secs required |
| Position | Floor of LAF corridor | Part of LAF toolkit | Umbrella facility |
| Purpose | Absorb large liquidity quickly | Absorb day-to-day liquidity | Daily liquidity adjustment |
Prelims tips
- CRR ↑ = contractionary, inflation ↓. CRR ↓ = expansionary, growth ↑.
- SLR maintained in cash/gold/securities with banks, CRR in cash with RBI.
- SDF introduced in April 2022, no collateral required.
- LAF = Repo + Reverse Repo, introduced in 2000 (Narasimham Committee).
Mains points
- Changes in CRR/SLR directly impact liquidity, inflation, and growth trade-offs.
- SDF strengthens RBI’s ability to absorb liquidity without collateral.
- LAF provides a flexible mechanism to handle daily liquidity needs of banks.
- These tools together enhance RBI’s effectiveness in monetary management.
- Global events (like COVID, Ukraine war) show why CRR, SLR, SDF, and LAF must be dynamic.
Reverse Repo Rate, MSF and Open Market Operations (OMO)
Reverse Repo, MSF, and OMO are important instruments of RBI’s monetary policy to control liquidity and inflation. They influence how much money is available in the market, thereby affecting inflation, growth, and stability of the financial system.
Mechanism of Reverse Repo Rate
When RBI increases Reverse Repo Rate:
Banks get higher interest from RBI.
Banks prefer lending to RBI instead of public/businesses.
Market money supply reduces → controls inflation.
When RBI decreases Reverse Repo Rate:
Parking money with RBI becomes unattractive.
Banks lend more to public and businesses.
Increases liquidity → boosts growth.
COVID-19 Example (Reverse Repo)
During COVID slowdown, loan demand decreased.
By March 2020: Banks parked ~₹3 lakh crore with RBI via Reverse Repo.
RBI reduced Reverse Repo to 3.35% to discourage parking and force banks to lend.
Example: If SBI gives 5.9% FD interest to depositors but earns only 3.35% from RBI, it makes losses. Hence, SBI would prefer lending to customers.
Marginal Standing Facility (MSF)
Introduced in 2011.
Penal interest rate at which banks borrow overnight from RBI by pledging G-Secs (up to 2% of SLR quota).
Acts as safety valve when interbank liquidity dries up.
Last resort borrowing option after LAF and other sources are exhausted.
MSF = Upper bound of LAF corridor (25 bps above Repo Rate).
Purpose: Provides emergency liquidity support to banking system.
Open Market Operations (OMO)
OMO = RBI buys and sells Government Securities (G-Secs) in the open market.
RBI buys G-Secs → injects money → increases liquidity → boosts growth (used in slowdown).
RBI sells G-Secs → absorbs money → reduces liquidity → controls inflation (used in high inflation periods).
OMO is a flexible tool used frequently along with Repo/Reverse Repo.
| Instrument | Meaning | Purpose | Position in LAF Corridor |
|---|---|---|---|
| Reverse Repo | Rate RBI pays to banks when they park funds | Absorb excess liquidity, control inflation | Floor (lower bound) |
| MSF | Penal overnight borrowing from RBI against G-Secs (up to 2%) | Emergency liquidity support | Ceiling (upper bound) |
| OMO | Buying & selling of Govt. Securities in open market | Inject or absorb liquidity as per need | Not part of corridor but used flexibly |
Prelims tips
- Reverse Repo = floor of LAF corridor, MSF = ceiling of LAF corridor.
- MSF introduced in 2011, last resort borrowing option.
- OMO = RBI buys (injects liquidity) / sells (absorbs liquidity) G-Secs.
- During COVID (2020), RBI reduced reverse repo to 3.35% to discourage banks from parking funds.
Mains points
- Reverse Repo influences banks’ preference between lending to RBI vs public, thus controlling liquidity.
- MSF acts as an emergency support tool to prevent liquidity shocks in the banking system.
- OMO provides RBI with flexibility to adjust liquidity depending on inflation or slowdown.
- Together, these instruments ensure stability of financial markets and effective inflation control.
- Examples: COVID slowdown (reverse repo reduction), inflationary periods (OMO selling).
Taxation
Taxation is the system by which governments collect money from individuals, businesses, and organizations in the form of taxes to fund public services and development. Taxes are compulsory payments used not only for revenue but also as tools of fiscal policy to control inflation, promote growth, and ensure social welfare.
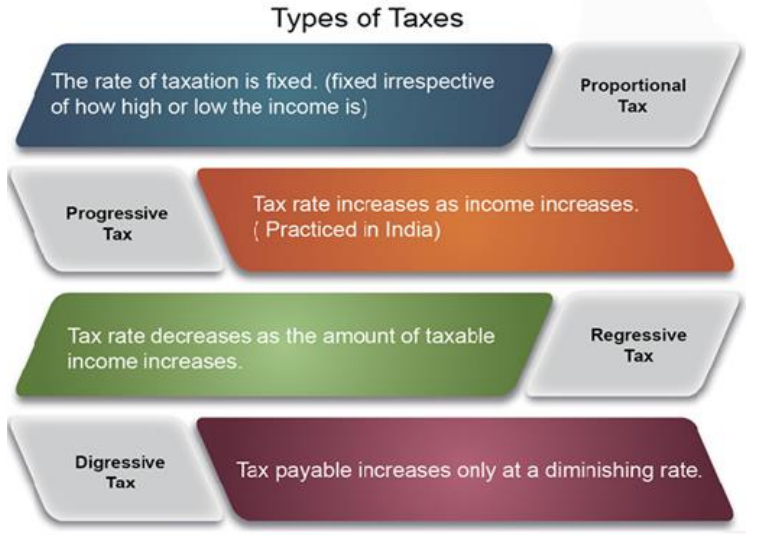
Introduction
Taxes are levies imposed by governments to collect resources for spending on public services.
Governments use these resources for defence, education, healthcare, infrastructure, and welfare programs.
Beyond raising revenue, taxes can be used as tools of fiscal policy – for example, to control inflation or promote industrial growth.
What is Tax?
Taxes are compulsory payments imposed by law on individuals and organizations.
They are the government’s main source of income.
The money collected through taxes funds services such as defence, roads, schools, hospitals, and subsidies.
Classification of Taxes (Based on Fairness)
Progressive Taxation
Tax rate increases as income increases.
Considered fair because wealthier individuals contribute more.
Example: Income Tax where higher income groups pay at higher rates (ranging from 0% to ~45%).
Regressive Taxation
Taxes where poor people end up paying more in relative terms than the rich.
Example: Indirect taxes on essential items can hurt the poor more since they spend a larger share of their income on consumption.
Economists debate this: some argue it motivates productivity, while modern economists highlight social justice concerns.
Proportional Taxation (Flat Tax)
Same tax rate for all income groups, regardless of income level.
Example: GST – both rich and poor pay the same rate on a product.
Classification of Taxes (Based on Who Pays)
Direct Taxes
Paid directly by the person/entity on whom they are imposed.
Non-transferable: the burden cannot be shifted.
Examples: Income Tax, Corporate Tax, Wealth Tax.
Indirect Taxes
Taxes applied on goods/services, collected by businesses but paid by consumers.
Transferable: seller collects and passes to government.
Examples: GST, Excise Duty, Customs Duty.
| Parameter | Direct Tax | Indirect Tax |
|---|---|---|
| Meaning | Tax on income/wealth paid directly to govt. | Tax on goods/services, collected indirectly |
| Incidence & Impact | Falls on same person | Falls on different persons (consumer pays, seller deposits) |
| Tax Base | Income, profits, wealth | Consumption, sales, production |
| Evasion | Possible | Hardly possible |
| Effect on Inflation | Helps in controlling inflation | Can push prices up (inflationary) |
| Burden | Cannot be shifted | Can be shifted |
Prelims tips
- Progressive tax = higher income, higher tax rate.
- GST is an example of proportional tax.
- Direct tax burden cannot be shifted; indirect tax burden is shifted to consumers.
- Direct taxes help control inflation, indirect taxes can increase inflation.
Mains points
- Taxation is not only a revenue tool but also an instrument of fiscal policy.
- Progressive taxation ensures equity, while regressive taxes may worsen inequality.
- Direct taxes are better for redistributive justice, while indirect taxes ensure easier collection.
- India relies on a mix of both to balance efficiency and equity.
- Challenges: tax evasion, compliance burden, balancing fairness with growth.
Taxation in India
In India, taxes are levied at three levels – by the Central Government, the State Governments, and local authorities (like Panchayats and Municipalities). The Constitution of India provides the framework for taxation through specific Articles and Schedules.
Overview
Taxes are compulsory payments to fund government expenditure at central, state, and local levels.
Constitution ensures taxes can only be imposed by law, not arbitrarily.
Constitutional Provisions
Article 265
No tax can be levied or collected except by authority of law.
This means every tax must be backed by a law passed by Parliament or State Legislature.
Article 246 (Schedule VII)
Defines division of legislative powers, including taxation powers.
Schedule VII provides three lists:
List I (Union List): Only Parliament can make laws (e.g., Income Tax, Customs).
List II (State List): Only States can legislate (e.g., Land Revenue, Stamp Duty).
List III (Concurrent List): Both Parliament and States can legislate (e.g., Education, Environment).
73rd & 74th Constitutional Amendments
Empower Panchayats and Municipalities to levy certain local taxes (like property tax, market fees, tolls).
Direct Taxes in India
Direct taxes are paid directly by individuals or organizations to the government.
Union Government Direct Taxes
On Income: Corporation Tax, Personal Income Tax, Minimum Alternate Tax (MAT), Capital Gains Tax.
On Expenditure: (earlier) Fringe Benefit Tax (abolished), Gift Tax (abolished).
On Assets: Securities Transaction Tax, Wealth Tax (abolished), Banking Cash Transaction Tax (abolished).
State Government Direct Taxes
On Income: Agriculture Tax, Professional Tax.
On Expenditure: Road Tax (collected in some cases by seller on vehicles).
On Assets: Land Revenue, Stamp Duty, Property Tax in urban areas.
Cess and Surcharge
Cess
A tax on tax, imposed for a specific purpose.
Example: Education Cess (for schools), Health & Education Cess, Road & Infrastructure Cess.
Collected in Consolidated Fund of India (CFI), then used for schemes.
Not shared with States by Finance Commission; usage depends on Union discretion.
Surcharge
An additional tax on existing tax rates (e.g., 10% surcharge on 30% tax = 33% effective tax).
Not earmarked for a specific purpose – can be used for general expenditure.
Not shared with States via Finance Commission formula.
| Category | Union Government | State Government |
|---|---|---|
| On Income | Corporate Tax, Personal Income Tax, MAT, Capital Gains Tax | Agriculture Tax, Professional Tax |
| On Expenditure | Fringe Benefit Tax (abolished), Gift Tax (abolished) | Road Tax |
| On Assets | Securities Transaction Tax, Wealth Tax (abolished) | Land Revenue, Stamp Duty, Property Tax |
Prelims tips
- Article 265: No tax without authority of law.
- Article 246 + Schedule VII: Division of taxation powers.
- 73rd & 74th Amendments: Panchayats and Municipalities can levy taxes.
- Cess = tax on tax for specific purpose, not shared with States.
- Surcharge = extra tax, not earmarked, also not shared with States.
Mains points
- Indian taxation system operates at three levels: Centre, States, and Local bodies.
- The Constitution ensures taxes must have legal backing (Article 265).
- Division of taxation powers is clearly defined under Schedule VII.
- Direct taxes are imposed differently by Centre and States, ensuring balanced revenue.
- Cess and surcharge are tools for additional revenue but create fiscal imbalance as they are not shared with States.
Budgeting and Fiscal Policy
The Budget is the government’s annual financial statement, presented under Article 112 of the Constitution. It contains estimates of income (receipts) and expenditure (spending) for the coming financial year. It guides resource allocation, reflects government priorities, and requires approval of Parliament. The Union Budget is a legal tool for efficient use of scarce resources.
Overview of Budget
The Budget is a detailed financial plan of the government for one year.
It estimates revenue (money earned by government) and expenditure (money spent by government).
Article 112 of the Constitution calls it the ‘Annual Financial Statement’.
It is not just numbers, but also shows government policies, taxation plans, and developmental goals.
Budget is prepared by the Budget Division of the Department of Economic Affairs, Ministry of Finance.
Elements of the Budget
Estimates of revenue receipts (tax and non-tax income).
Estimates of capital receipts (borrowings, loans, recoveries).
Expenditure estimates (on welfare, infrastructure, defense, etc.).
Ways and means to raise revenue (taxation proposals).
Review of last year’s income and spending, with explanation of surplus or deficit.
Financial and economic policies for the coming year.
Evolution of Budget in India
Until 2017, India had two budgets: Railway Budget and General Budget.
In 2017, both were merged into a single Union Budget for simplification.
Constitutional Provisions on Budget
Article 112 – Annual Financial Statement
The President lays before both Houses of Parliament the government’s estimated receipts and expenditures.
Expenditures are divided into:
Charged on Consolidated Fund of India (like President’s salary, judges, CAG, etc.) – not subject to voting.
Other expenditures from the Consolidated Fund – subject to Parliament’s approval.
Article 113 – Demands for Grants
Expenditures not charged on Consolidated Fund are presented as Demands for Grants to Lok Sabha.
Lok Sabha can accept, reduce, or reject demands.
No demand can be made without the President’s recommendation.
Article 114 – Appropriation Bill
After grants are voted, an Appropriation Bill is introduced.
It allows withdrawal of money from the Consolidated Fund of India for approved purposes.
No amendment can be made in Parliament to change the bill.
Article 265 – Taxes only by authority of law
No tax can be levied or collected without parliamentary approval.
Finance Bill, part of the Budget, is passed to change tax laws and raise revenue.
Article 266 – Consolidated Fund and Public Account of India
All government revenues, loans, and repayments form the Consolidated Fund of India.
All other public money (like provident fund, small savings) go to the Public Account of India.
No money can be withdrawn from the Consolidated Fund without Parliament’s approval.
| Aspect | Details |
|---|---|
| Definition | Annual Financial Statement (Article 112) – estimates of receipts and expenditure |
| Prepared by | Budget Division, Department of Economic Affairs, Ministry of Finance |
| Evolution | Earlier two budgets (Railway + General), merged in 2017 into one Union Budget |
| Approval Process | Demands for Grants → Appropriation Bill → Finance Bill |
| Funds | Consolidated Fund of India and Public Account of India |
Prelims tips
- Article 112 – Budget is called Annual Financial Statement.
- Article 265 – No tax without Parliament’s approval.
- Union Budget merged with Railway Budget in 2017.
- Finance Bill is a Money Bill, part of Budget process.
Mains points
- Budget reflects the government’s revenue and expenditure priorities for a financial year.
- It ensures optimal allocation of scarce resources in line with socio-economic objectives.
- Budgetary process strengthens accountability of the executive to the legislature.
- Articles 112–114, 265–266 of Constitution define the framework of budgeting.
- Union Budget after 2017 is a consolidated single budget covering all sectors.
Objective and Types of Budget
The Budget is not only a financial statement but also a tool for planning, allocation of resources, and ensuring legislative control over government spending. It can be of different types – balanced, surplus, deficit, zero-based, and performance-based – depending on how revenue and expenditure are managed.
Objectives of Budget
Ensures planned and efficient allocation of limited government resources.
Provides parliamentary control over the executive through debates, discussions, cut motions, and passing of Appropriation and Finance Bills.
Article 114(3) of the Constitution: 'No amount can be withdrawn from the Consolidated Fund of India without approval of law by Parliament.'
Promotes transparency and accountability in government spending.
Types of Budget
1. Balanced Budget
When estimated expenditure equals estimated revenue in a financial year.
Considered ideal by traditional economists as it shows the government is 'living within its means'.
2. Surplus Budget
Revenues (taxes, non-tax income) are more than expenditure.
Indicates strong financial health of the government.
Useful in times of high inflation:
Government increases taxes and reduces expenditure.
Withdraws money from the economy, reduces demand, and helps control inflation.
3. Deficit Budget
Expenditure is greater than revenue.
Shows that taxes and receipts are not sufficient to cover government expenses.
Economists have two views:
Traditional view: Deficit is risky, shows overspending, weakens financial health.
Modern view: Deficit, if spent on infrastructure and development, can promote economic growth and job creation.
4. Zero-Based Budgeting (ZBB)
Concept given by Edward Hilton Young in 1924.
Every new budget starts from a 'zero base' – no past allocations are assumed.
Every expense must be justified afresh for the new period.
Focus is on evaluating needs and costs of every project or department.
Introduced in India in 1983 in the Department of Science and Technology.
5. Performance Budgeting
Introduced in India in 1969 on recommendation of the Administrative Reforms Commission.
Links expenditure with outcomes (what results were achieved from money spent).
Focuses on functions, programmes, activities and projects with clear targets.
Example: If Ministry of Health reports that ₹1000 crore under Janani Suraksha Yojana reduced Maternal Mortality Ratio (MMR) from 212 to 190, it shows spending achieved measurable outcomes.
Helps government improve expenditure priorities and increase efficiency.
| Type of Budget | Description | Usefulness |
|---|---|---|
| Balanced Budget | Expenditure = Revenue | Shows financial discipline |
| Surplus Budget | Revenue > Expenditure | Useful in controlling inflation |
| Deficit Budget | Expenditure > Revenue | Can promote growth if spent on development |
| Zero-Based Budget | Starts from scratch, every expense justified | Improves efficiency, avoids waste |
| Performance Budget | Links spending with outcomes | Improves accountability and prioritization |
Prelims tips
- Balanced, Surplus, and Deficit are the three traditional budget types.
- Zero-Based Budgeting introduced in India in 1983 (Dept. of Science and Technology).
- Performance Budgeting introduced in India in 1969 (Administrative Reforms Commission).
- Surplus budget helps control inflation; deficit budget can stimulate growth.
Mains points
- Budget types reflect different fiscal strategies: discipline, control of inflation, or economic stimulus.
- Zero-Based Budgeting forces rationalization of expenditure and avoids waste.
- Performance Budgeting improves accountability by linking money spent with actual outcomes.
- Choice of budget type depends on macroeconomic conditions like inflation, recession, or resource constraints.
Components of a Budget
The Government Budget is broadly divided into two accounts – Revenue Account and Capital Account. Revenue Account deals with one-way transactions such as taxes and salaries, while Capital Account deals with two-way transactions such as borrowings and asset creation. Budget receipts are further classified into Capital Receipts (which create liabilities or reduce assets) and Revenue Receipts.
Overview
The Union Budget is the financial plan of the Government for a financial year (April–March).
It contains estimates of receipts (income) and expenditures (spending).
Broadly divided into two accounts: Revenue Account and Capital Account.
Revenue Account
Shows income and spending of the government during the current year.
These are one-way transactions (no repayment obligation).
Example: Government collecting taxes, government paying salaries.
Capital Account
Shows changes in government’s assets and liabilities.
These are two-way transactions – government either creates assets or incurs liabilities.
Example: Government borrows money (liability) or spends on infrastructure (asset creation).
Budget Receipts
Broadly classified as Revenue Receipts and Capital Receipts.
Capital Receipts are not regular in nature and either create liability or reduce assets.
Capital Receipts – Types
Debt Capital Receipts
Borrowed money which creates liability for the government.
Includes both internal borrowings and external borrowings.
Needs to be repaid in the future (by government or future generations).
If used only for regular expenditure, it can disturb fiscal stability and may lead to inflation.
Internal Borrowings (within India):
Loans raised from the public (through government securities).
Borrowings from the Reserve Bank of India (RBI).
Loans from financial institutions via Treasury Bills.
Money mobilized from small savings schemes (like Post-Office Savings, Kisan Vikas Patra, etc).
Funds from Provident Funds (EPFO, PPF, etc).
External Borrowings (from abroad):
Loans and aid from international financial institutions such as IMF, World Bank, BRICS Bank, etc.
These are foreign debts and have to be repaid with interest in foreign currency.
Non-Debt Capital Receipts
Do not create future repayment obligations.
Examples: Disinvestment proceeds (selling government stake in public enterprises), recovery of loans given by government.
| Account | Nature | Examples |
|---|---|---|
| Revenue Account | One-way transactions (no repayment) | Taxes collected, Salaries paid |
| Capital Account | Two-way transactions (liability or asset creation) | Borrowings, Infrastructure investment |
| Type | Nature | Examples |
|---|---|---|
| Debt Capital Receipts | Creates liability; must be repaid | Internal borrowings (RBI, public, savings), External borrowings (IMF, World Bank) |
| Non-Debt Capital Receipts | No liability; no repayment needed | Disinvestment proceeds, Loan recovery |
Prelims tips
- Revenue Account = one-way transactions (no repayment).
- Capital Account = two-way transactions (assets/liabilities).
- Capital Receipts divided into Debt (borrowing) and Non-Debt (disinvestment, loan recovery).
- Internal borrowing sources: RBI, Treasury bills, small savings, provident funds.
Mains points
- Revenue Account ensures smooth running of government through taxes and other current receipts.
- Capital Account focuses on long-term asset creation and managing liabilities.
- Debt Capital Receipts, if used unwisely for routine expenditure, can harm fiscal health.
- Non-Debt Capital Receipts like disinvestment reduce government ownership but avoid debt burden.
- Understanding these distinctions is crucial for analyzing fiscal policy and budget priorities.
Budget Receipts and Expenditure
Government receipts are broadly classified into Capital Receipts (Debt and Non-Debt) and Revenue Receipts (Tax and Non-Tax). Government expenditure is divided into Capital and Revenue Expenditure. This classification helps in understanding how the government earns and spends money, and whether it is for asset creation or routine administration.
Non-Debt Capital Receipts
Capital Receipts which do not create liabilities (government does not need to repay them).
Includes money raised through sale of government-owned assets and recovery of past loans.
Components of Non-Debt Capital Receipts:
Disinvestment proceeds: Money earned by selling government shares/stakes in Public Sector Enterprises (PSEs).
Recovery of Loans and Advances: Money repaid to the Government of India by state governments, public enterprises, or foreign countries who had earlier taken loans.
Revenue Receipts
Receipts which are regular in nature and do not create liability or reduce assets.
Further divided into Tax Revenue and Non-Tax Revenue.
Tax Revenue Receipts:
Money earned by government through taxes on individuals and businesses.
Subdivided into:
Direct Taxes: Paid directly by individuals/companies (e.g., Income Tax, Corporate Tax).
Indirect Taxes: Collected indirectly on goods/services (e.g., GST, Excise Duty, Customs Duty).
Non-Tax Revenue Receipts:
Income of government from sources other than taxes.
Includes:
Fines and penalties
Dividends and profits from Public Sector Enterprises (PSEs)
Interest on loans given by government (to states, PSEs, etc.)
Petroleum license fees
Power supply and electricity charges
Communication and broadcasting service fees
Road and bridge usage charges
Examination fees, police service fees
Sale of stationery, gazettes, defence services receipts
Budget Expenditure
Refers to all money spent by the Government of India to perform its functions.
Earlier divided into Plan and Non-Plan Expenditure, but since 2018-19, classified only as Revenue Expenditure and Capital Expenditure (as per C. Rangarajan Committee recommendation).
Revenue Expenditure:
Routine expenses for day-to-day functioning of government.
Do not create assets, recurring in nature.
Examples:
Payment of interest on loans
Salaries and pensions
Subsidies and grants
Health and education spending
Defence services
Capital Expenditure (explained earlier):
Leads to creation of assets or reduction of liabilities (e.g., infrastructure projects, loan repayments).
| Type | Nature | Examples |
|---|---|---|
| Debt Capital Receipts | Liability; must be repaid | Borrowings from RBI, public, IMF, World Bank |
| Non-Debt Capital Receipts | No repayment liability | Disinvestment, recovery of loans |
| Tax Revenue Receipts | Collected through taxes | Income Tax, Corporate Tax, GST |
| Non-Tax Revenue Receipts | Non-tax income sources | Dividends, fees, fines, interest on loans |
| Type | Nature | Examples |
|---|---|---|
| Revenue Expenditure | Recurring expenses; no asset creation | Salaries, pensions, subsidies, interest payments |
| Capital Expenditure | Asset creation or liability reduction | Infrastructure projects, loan repayments |
Prelims tips
- Non-Debt Capital Receipts = Disinvestment + Recovery of Loans.
- Revenue Receipts = Tax (direct + indirect) + Non-Tax (fees, fines, dividends).
- Revenue Expenditure = No asset creation (salaries, subsidies, pensions).
- Capital Expenditure = Asset creation or liability reduction (infrastructure, loan repayments).
Mains points
- Revenue Receipts help fund routine government functions, while Capital Receipts are used for long-term investments or liability management.
- Non-Debt Capital Receipts reduce government ownership but avoid future repayment burden.
- Revenue Expenditure reflects government’s commitment to welfare schemes and administration.
- Capital Expenditure is linked to development projects, asset creation, and long-term growth.
- Balanced use of Revenue and Capital Expenditure is crucial for fiscal stability and sustainable development.
Capital Expenditure
Capital expenditure refers to government spending that creates assets or reduces liabilities. It includes infrastructure building, purchase of assets, loans to states, and repayment of loans. Unlike revenue expenditure, capital expenditure brings long-term benefits such as improved productivity, private investment attraction, and sustainable growth.
What is Capital Expenditure?
Capital expenditure includes all government spending which leads to asset creation or liability reduction.
It is long-term in nature and contributes to sustainable growth and infrastructure development.
Examples of Capital Expenditure:
Construction of roads, bridges, and government buildings.
Purchase of land, machinery, and equipment.
Investment in shares and equity.
Loans given to state governments or foreign governments.
Repayment of loans taken by government in past.
Significance of Capital Expenditure
Long-term Benefits: Provides infrastructure, equipment, and facilities that can be used for years, improving quality of life and boosting economy.
Increased Productivity: Modern tools and facilities improve efficiency of government departments and save costs in the long run.
Attracts Private Investment: Better infrastructure encourages companies to set up industries, boosting employment and growth.
Enhances Government Revenue: Growth and private investment increase tax revenues, reducing need for borrowing.
Reduces Operating Costs: Investment in energy-efficient infrastructure saves long-term costs for both government and citizens.
Capital Expenditure in Union Budget 2023–24
Capital expenditure continues to be a key focus of the government.
Centre allocated ₹1.3 lakh crore as fifty-year interest-free loan to states for capital projects.
Capital investment outlay increased by 33% to ₹10 lakh crore (3.3% of GDP).
‘Effective Capital Expenditure’ estimated at ₹13.7 lakh crore (4.5% of GDP).
Indian Railways received ₹2.40 lakh crore – highest ever outlay, nine times higher than 2013–14 allocation.
New infrastructure projects:
50 additional airports, heliports, water aerodromes, and advanced landing grounds to improve regional connectivity.
Urban Infrastructure Development Fund (UIDF) created using priority sector lending shortfall, to support urban infrastructure.
| Type of Spending | Examples |
|---|---|
| Infrastructure | Roads, bridges, airports, railways |
| Assets | Land, machinery, government buildings |
| Investments | Shares, equity in companies |
| Loans | Loans to states and foreign governments |
| Repayment | Repaying government borrowings |
Prelims tips
- Capital expenditure = Asset creation or liability reduction.
- Unlike revenue expenditure, it has long-term developmental impact.
- Budget 2023–24 gave record outlay to Indian Railways (₹2.40 lakh crore).
- Effective Capital Expenditure = Direct outlay + loans to states (₹13.7 lakh crore, 4.5% of GDP).
Mains points
- Capital expenditure is essential for infrastructure development and long-term growth.
- It helps attract private investment and enhances productivity across sectors.
- Union Budget 2023–24 focused heavily on capital spending, highlighting infrastructure revival and connectivity projects.
- Increased capital expenditure can improve government revenues indirectly through economic growth.
- Balanced approach between capital and revenue expenditure ensures both short-term welfare and long-term development.
Budget Deficit and its Types
A budget deficit occurs when the government’s total expenditure exceeds its total receipts. It indicates that the government is spending more than it earns. There are different types of budget deficits such as Revenue Deficit, Effective Revenue Deficit, and Fiscal Deficit. Each type highlights different aspects of imbalance between government income and expenditure.
What is Budget Deficit?
A situation where government’s expenditure is greater than its receipts.
Shows mismatch between resources collected (like taxes, fees, non-tax revenues) and money spent.
Indicates financial pressure on government and need to borrow or adjust its policies.
Types of Budget Deficits
1. Revenue Deficit
Refers to excess of revenue expenditure over revenue receipts.
Formula: Revenue Deficit (RD) = Total Revenue Expenditure (RE) – Total Revenue Receipts (RR).
Implies that government is unable to cover its routine expenses from its regular income.
Key Concerns:
Leads to more borrowing and increases debt burden.
Reduces government’s capacity to spend on social programs (education, health, welfare).
Can create inflationary pressure if financed by printing money.
Negatively impacts economic growth due to reduced spending on infrastructure.
Can result in poor international credit rating, making borrowing costlier.
Solutions: Reduce expenditure, increase revenue receipts through taxes and non-tax sources.
2. Effective Revenue Deficit
Difference between revenue deficit and grants used for creation of capital assets.
Formula: Effective Revenue Deficit = Revenue Deficit – Grants for creation of capital assets.
Introduced in Union Budget 2011–12 on recommendation of Rangarajan Committee.
Purpose: Grants to states used for building assets should not be treated as wastage; hence deducted to get 'true' revenue deficit.
3. Fiscal Deficit
Represents overall shortfall in government finances.
Formula: Fiscal Deficit = Total Expenditure – (Revenue Receipts + Non-debt Capital Receipts).
Excludes borrowings from receipts because deficit itself has to be financed through borrowings.
Implications:
Creates Debt Trap: Continuous borrowing increases interest payments, which further increase deficits.
Leads to Inflation: Borrowings from RBI often mean printing new currency, which increases money supply.
Creates Foreign Dependency: Borrowing from international agencies makes country dependent on other economies.
Ways to Manage: Borrow from domestic sources (like banks, institutions) or external sources (like IMF, World Bank).
| Type | Definition | Formula | Key Implication |
|---|---|---|---|
| Revenue Deficit | Excess of revenue expenditure over revenue receipts | RE – RR | Indicates dissaving, borrowing needed for consumption |
| Effective Revenue Deficit | Revenue deficit minus grants used for capital assets | RD – Grants for capital assets | Shows 'true' deficit after excluding productive grants |
| Fiscal Deficit | Total expenditure minus total receipts (excluding borrowings) | TE – (RR + Non-debt CR) | Indicates overall borrowing needs and debt trap risk |
Prelims tips
- Revenue Deficit shows mismatch in day-to-day income and expenses.
- Effective Revenue Deficit concept introduced in Union Budget 2011–12.
- Fiscal Deficit is key indicator of overall financial health of government.
- High fiscal deficit often leads to inflation and debt trap.
Mains points
- Budget deficits highlight structural imbalances in government finance.
- Revenue Deficit reflects shortfall in meeting day-to-day obligations.
- Effective Revenue Deficit helps in identifying real wasteful expenditure by excluding productive grants.
- Fiscal Deficit is critical as it directly shows borrowing needs and overall debt sustainability.
- Reducing deficit requires balanced approach of cutting expenditure and boosting revenue.
Primary Deficit, Monetised Deficit and FRBM Act, 2003
Primary Deficit measures the excess of current year’s expenditure over receipts excluding past interest payments, Monetised Deficit shows how much of deficit is financed by RBI’s money printing, and the FRBM Act, 2003 aims to control fiscal deficit and ensure financial discipline in India.
Primary Deficit
Definition: The difference between fiscal deficit and interest payments on previous loans.
Formula: Primary Deficit = Fiscal Deficit – Interest Payments.
Meaning: It shows how much of the current year’s borrowing is being used for fresh expenses (not for paying old interest).
If primary deficit is low or zero: It means most of the government borrowing is only to pay interest on old loans, not for development or new projects.
Importance: Helps in understanding present year’s fiscal imbalance.
Monetised Deficit
Definition: The part of fiscal deficit financed directly by RBI, either by printing new money or using government’s account balance with RBI.
Formula: Monetised Deficit = Borrowings from RBI + Withdrawal from government’s cash balance with RBI.
Meaning: Simply put, it represents expansion of money supply by RBI to meet government’s deficit.
Concern: Monetisation can cause inflation as it increases money in circulation.
Fiscal Responsibility and Budget Management Act (FRBM), 2003
Objective: To ensure financial discipline, reduce fiscal deficit, and maintain macroeconomic stability in India.
Targets (as amended):
Reduce fiscal deficit to 3% of GDP by March 31, 2021.
Ensure Central Government debt does not exceed 40% of GDP by 2024-25.
Combined (Centre + States) debt should not exceed 60% of GDP.
Key Rule: No money can be borrowed or spent beyond the limits set by law, ensuring Parliament’s control.
Escape Clause: Allows temporary relaxation of deficit targets by 0.5% of GDP under emergencies like:
National security or war.
Agricultural collapse or natural disasters.
Structural economic reforms.
Sudden fall in economic growth.
Counter-cyclical Fiscal Policy: If economy slows down, government can borrow more to stimulate growth. If economy grows fast, government should reduce deficit.
Authority: Recommended by N.K. Singh Committee; ensures balanced use of fiscal flexibility.
| Concept | Definition | Formula / Rule | Key Implication |
|---|---|---|---|
| Primary Deficit | Excess of current expenditure over receipts (excluding past interest payments) | Fiscal Deficit – Interest Payments | Shows how much borrowing is for fresh spending, not past interest |
| Monetised Deficit | Part of deficit financed directly by RBI | Borrowings from RBI + Govt. balance drawdown | Represents money printing; can cause inflation |
| FRBM Act, 2003 | Law for fiscal discipline and deficit control | Limit FD to 3% of GDP; Debt: Centre 40%, Total 60% | Ensures sustainable borrowing with flexibility during crises |
Prelims tips
- Primary Deficit = Fiscal Deficit – Interest Payments.
- Monetised Deficit means RBI directly finances deficit (printing money).
- FRBM Act (2003) aims at limiting fiscal deficit to 3% of GDP.
- Escape Clause allows flexibility in emergencies like war, disasters, or reforms.
Mains points
- Primary Deficit is important for assessing fresh fiscal imbalance beyond old interest liabilities.
- Monetised Deficit highlights the risk of inflation when RBI prints money to cover government’s shortfall.
- FRBM Act brings legal framework for fiscal discipline, deficit targets, and sustainable debt management.
- Escape Clause ensures flexibility for government during economic shocks or emergencies.
- Together, these concepts are vital to understand India’s fiscal health and macroeconomic stability.
Fiscal Policy
Fiscal policy refers to the use of government spending, taxation, and borrowing to influence the economy. It is a key tool for managing economic growth, controlling inflation, reducing inequalities, and stabilising the balance of payments. In India, fiscal policy has been shaped by both developmental goals and the need for macroeconomic stability.
Introduction
Fiscal policy involves government decisions related to taxation (how much tax is collected), public expenditure (where and how money is spent), and public debt (how much government borrows).
It is based on the Keynesian principle that government actions can influence demand, production, and employment in the economy.
By changing tax rates or government spending, fiscal policy can stimulate growth during recessions or slow down inflation during booms.
Objectives of Fiscal Policy in India
Promoting Economic Growth: The government invests in infrastructure and industries such as steel, fertilizers, and machine tools. These industries lay the foundation for long-term industrial and agricultural development.
Reducing Income and Wealth Inequalities: Progressive taxation ensures the rich pay higher taxes, while the government spends more on welfare schemes like subsidies, healthcare, and education for the poor.
Ensuring Price Stability: Inflation (rise in prices) or deflation (fall in prices) can destabilise the economy. The government manages food supply through ration shops and fair price shops, ensuring stable prices of essentials like wheat and rice.
Correcting Balance of Payments Deficit: When imports exceed exports, foreign payments rise. The government responds by increasing tariffs on imports, promoting Make in India initiatives, and giving subsidies for exports.
Fiscal Policy vs Monetary Policy
Fiscal Policy: Managed by the Government of India (Ministry of Finance). Uses taxation, public spending, and borrowing as tools. Focus is on overall demand and long-term development.
Monetary Policy: Managed by the Reserve Bank of India (RBI). Uses interest rates, CRR (Cash Reserve Ratio), SLR (Statutory Liquidity Ratio), and repo rate as tools. Focus is on controlling inflation, ensuring credit flow, and maintaining currency stability.
In simple terms: Fiscal policy = Government budget decisions; Monetary policy = Central Bank’s control over money supply.
| Aspect | Fiscal Policy | Monetary Policy |
|---|---|---|
| Authority | Government of India (Ministry of Finance) | Reserve Bank of India (RBI) |
| Main Tools | Taxes, Government spending, Borrowings | Repo rate, CRR, SLR, Open Market Operations |
| Focus | Growth, inequality reduction, fiscal balance | Inflation control, money supply, credit stability |
| Time Frame | Medium to long-term impact | Short to medium-term impact |
| Nature | Political decisions through budget | Technical/economic decisions by RBI |
Prelims tips
- Fiscal Policy = Government’s budgetary decisions on spending, taxes, and borrowing.
- Monetary Policy = RBI’s decisions on interest rates and money supply.
- Fiscal Policy is political; Monetary Policy is technical.
- Fiscal tools: taxation, subsidies, capital expenditure. Monetary tools: repo rate, CRR, SLR.
Mains points
- Fiscal policy plays a key role in India’s economic planning and social welfare.
- It is essential for balancing growth with equity, ensuring price stability, and correcting external imbalances.
- Monetary policy alone cannot ensure development; it must work in coordination with fiscal policy.
- Challenges include fiscal deficit, populist spending, and balancing short-term needs with long-term sustainability.
- An effective mix of fiscal and monetary policy ensures inclusive and stable economic growth.
Finance Commission
The Finance Commission is a constitutional body (Article 280) set up every five years by the President of India. Its primary role is to recommend the distribution of tax revenues between the Union and the States (vertical devolution) and among the States themselves (horizontal devolution). It plays a crucial role in shaping India's fiscal federalism.
Constitutional Basis
Article 280: Mandates the President to constitute a Finance Commission every fifth year, or earlier if necessary.
Article 281: Requires the President to lay the Commission's recommendations, along with an explanatory memorandum, before each House of Parliament.
Composition
Consists of a Chairman and four other members appointed by the President.
Parliament determines their qualifications (Finance Commission Act, 1951):
Chairman: Person with experience in public affairs.
Members (should have expertise in):
Finance and accounts of the government.
Financial matters and administration.
Economics.
Judge of a High Court (or qualified to be one).
Key Functions (Terms of Reference - ToR)
The Commission makes recommendations on:
1. Vertical Devolution: The distribution of the net proceeds of taxes between the Union and the States (how much % of central taxes goes to states).
2. Horizontal Devolution: The allocation of the states' share among the different states (based on criteria like population, area, income distance, forest cover, demographic performance, tax effort).
3. Grants-in-Aid: The principles governing grants-in-aid to the States out of the Consolidated Fund of India (Article 275 - statutory grants, especially revenue deficit grants).
4. Augmenting State Funds for Local Bodies: Measures needed to increase the Consolidated Fund of a State to supplement resources for Panchayats and Municipalities (based on State Finance Commission recommendations).
5. Other Matters: Any other matter referred by the President in the interest of sound finance (e.g., reviewing disaster management financing - 15th FC).
Nature of Recommendations
The recommendations are advisory in nature and not legally binding on the government.
However, conventionally, the central government largely accepts the core recommendations regarding tax devolution.
Recent Finance Commissions
14th Finance Commission (Chairman: Y.V. Reddy): Award Period 2015-20. Major recommendation: Increased states' share in central taxes from 32% to 42%.
15th Finance Commission (Chairman: N.K. Singh): Award Period 2021-26 (extended due to pandemic). Recommendation: Maintained states' share at 41% (1% adjusted for newly formed UTs of J&K and Ladakh). Introduced criteria like 'Demographic Performance' and 'Tax Effort'. Recommended various grants (Revenue Deficit, Sector-Specific, State-Specific, Local Body, Disaster Management).
Importance in Fiscal Federalism
Acts as a balancing wheel of fiscal federalism, ensuring equitable distribution of resources.
Addresses vertical fiscal imbalances (Centre collects more taxes, States have more expenditure needs) and horizontal imbalances (differences among states).
Promotes fiscal discipline and provides predictability in resource transfers.
Prelims tips
- Finance Commission: Constitutional body (Art 280), set up every 5 years.
- Recommends vertical (Centre-State) and horizontal (among States) tax devolution.
- Recommendations are advisory, not binding.
- 14th FC (YV Reddy) raised state share to 42%.
- 15th FC (NK Singh) recommended 41% state share (2021-26).
- Composition: Chairman + 4 members.
Mains points
- The Finance Commission is vital for maintaining fiscal balance in India's federal structure.
- It uses objective criteria for horizontal devolution to ensure equity among states with varying capacities.
- Grants-in-aid recommended by FC help address specific needs of states (e.g., revenue deficit, local bodies).
- The acceptance of FC recommendations, though advisory, reflects the spirit of cooperative federalism.
- Evolution of criteria (like adding demographic performance by 15th FC) shows its dynamic nature in addressing contemporary challenges.
Financial Market
A financial market is a platform where people with extra money (savers/investors) provide funds to those who need money (borrowers/businesses). It enables creation, trading, and exchange of financial assets like shares, bonds, and debentures. It acts as a bridge between savers and users of funds.
Overview
Financial market acts as a link between investors and borrowers.
It includes individual investors, financial institutions, banks, stock exchanges, and intermediaries.
Any place or platform where financial transactions happen is considered a financial market.
It may involve issuing new financial assets (like IPO of shares or bonds) or trading existing ones.
Functions of Financial Market
Mobilisation of Savings: Helps channel savings into productive investments, giving savers multiple investment options.
Facilitating Price Discovery: Demand (by businesses) and supply (from households) determine asset prices.
Providing Liquidity: Makes it easy to buy or sell financial assets, ensuring they can be converted into cash when needed.
Reducing Transaction Costs: Provides a central platform with information, saving time, money, and effort for both buyers and sellers.
Types of Financial Market
Money Market: Provides short-term funds (up to 364 days). Examples: Treasury Bills, Commercial Papers, Certificates of Deposit.
Capital Market: Provides medium to long-term funds (more than 1 year). Examples: Equity shares, Debentures, Bonds.
Both markets serve different financial needs of businesses and individuals.
| Aspect | Money Market | Capital Market |
|---|---|---|
| Nature of Funds | Short-term (up to 364 days) | Medium & long-term (more than 1 year) |
| Examples | T-Bills, Commercial Papers, Certificate of Deposit | Equity Shares, Preference Shares, Bonds, Debentures |
| Purpose | Short-term needs like working capital, cash flow | Long-term needs like business expansion, infrastructure |
| Risk | Lower risk due to short duration | Higher risk due to longer maturity |
| Major Regulator | RBI | SEBI |
| Main Players | RBI, Commercial Banks, Financial Institutions, Mutual Funds | Stock Exchanges, Investors, Brokers, Underwriters |
Prelims tips
- Money Market = short-term funds; Capital Market = long-term funds.
- Money Market is mainly regulated by RBI; Capital Market is mainly regulated by SEBI.
- Money Market instruments are less risky; Capital Market instruments involve higher risk but higher return.
- Examples of Money Market: T-Bills, CP, CDs; Capital Market: Shares, Bonds, Debentures.
Mains points
- Financial market acts as the backbone of the economy by channelising funds.
- It improves savings mobilisation, investment, and overall economic growth.
- Money Market provides liquidity and stability; Capital Market supports long-term growth.
- Helps in price discovery, transparency, and financial inclusion.
- Efficient regulation by RBI and SEBI ensures stability and investor protection.
Money Market
The money market is the part of the financial market where short-term funds (up to one year) are borrowed and lent. It provides liquidity, helps in interest rate determination, and acts as an avenue for the government, banks, and companies to manage short-term financial needs.
Overview
The money market deals with short-term funds, ranging from overnight to 1 year.
In India, it includes Reserve Bank of India (RBI), commercial banks, cooperative banks, financial institutions, and certain NBFCs.
RBI is the leader of the Indian money market, managing liquidity and interest rates.
Other participants include LIC, GIC, and financial institutions that provide and absorb funds.
Functions of Money Market
Facilitating Short-term Borrowing & Lending: Provides a platform for banks and corporates to borrow and lend funds for short durations (like 7–14 days). Example: Certificates of Deposit (CDs).
Providing Liquidity: Ensures that banks, companies, and financial institutions can access short-term funds to meet immediate cash requirements.
Determining Short-term Interest Rates: Supply and demand in the money market influence borrowing and lending rates. Example: RBI issues Treasury Bills (T-Bills) of 91, 182, 364 days to set a benchmark.
Offering Investment Opportunities: Provides safe and liquid investment instruments such as T-Bills, Commercial Papers (CPs), CDs, and repo transactions. Example: Companies issue CPs to investors for short-term funding.
Helping Government Finances: The Government of India issues T-Bills to raise short-term funds to meet expenses or temporary cash shortages.
Enabling Monetary Policy Transmission: RBI uses the money market to influence liquidity and short-term interest rates through policy tools like Repo and Reverse Repo rates.
Managing Liquidity in Banking System: RBI ensures stability through open market operations (OMO), Liquidity Adjustment Facility (LAF), and repo operations.
| Instrument | Description | Example |
|---|---|---|
| Treasury Bills (T-Bills) | Short-term government securities, risk-free | Issued by RBI for 91, 182, 364 days |
| Commercial Papers (CPs) | Unsecured short-term debt by companies | Issued by corporates to raise funds |
| Certificates of Deposit (CDs) | Short-term instruments issued by banks | Banks raise funds from investors |
| Repo Transactions | Short-term borrowing with securities as collateral | Banks borrow using government securities |
| Call Money Market | Overnight borrowing and lending among banks | Banks manage daily liquidity needs |
Prelims tips
- Money market deals with short-term funds (up to 1 year).
- RBI is the leader and regulator of Indian money market.
- T-Bills are risk-free, issued by RBI on behalf of Government of India.
- CPs and CDs are widely used by corporates and banks respectively.
- Call money market = overnight funds among banks.
Mains points
- Money market ensures liquidity and stability in the financial system.
- It plays a crucial role in implementing RBI’s monetary policy.
- Provides safe and flexible short-term investment options.
- Acts as a channel for government to raise short-term funds.
- Improves efficiency of financial system by balancing surplus and deficit of funds.
External Sector and Balance of Payments (BOP)
The external sector of an economy deals with a country’s interactions with the rest of the world through exports, imports, capital flows, and dealings with global financial institutions. The Balance of Payments (BOP) records all international transactions of a country, showing whether it is in surplus or deficit. Understanding this helps assess economic health and currency stability.
Overview of External Sector
External sector refers to a country’s interaction with other countries via trade (exports and imports) and capital flows (investment, borrowing, lending).
Countries can use these interactions to accelerate economic growth.
Example: Export-led growth in countries like Japan, South Korea, China, Vietnam, and Taiwan boosted industrialization and income levels.
Key features of the external sector include Foreign Trade Policy, Balance of Payments, Currency Convertibility, Foreign Exchange Rate, Export Promotion Policies, and Foreign Investment (FDI and FII).
Balance of Payments (BOP)
BOP is the systematic record of all economic transactions of a country with the rest of the world in a given year.
Transactions include trade in goods, services, and movement of financial assets.
Functions like double-entry bookkeeping, where every inflow has a corresponding outflow entry.
Ideally, BOP balances to zero (inflows = outflows), but in practice, deficits or surpluses occur.
Example: If India exports 100 cars to the US, India records this as a credit (money inflow), while the US records imports as a debit (money outflow).
Formula: Current Account + Capital Account + Financial Account + Balancing Item = 0.
Importance of BOP
Indicates a country’s financial and economic status.
Helps assess currency appreciation or depreciation trends.
Useful for policy makers to frame trade, investment, and foreign exchange strategies.
Provides insights into global competitiveness of the economy.
Components of BOP
Current Account: Records trade in goods, services, investment incomes, and transfers.
Capital Account: Records capital transfers and acquisition/disposal of non-produced, non-financial assets.
Financial Account: Records investments like FDI, FII, loans, and reserves.
Balancing Item: Statistical adjustments to ensure BOP adds up to zero.
| Aspect | Details |
|---|---|
| Definition | Record of a country’s economic transactions with rest of the world over a year |
| Nature | Double-entry system; inflows = credit, outflows = debit |
| Formula | Current Account + Capital Account + Financial Account + Balancing Item = 0 |
| Status | Indicates surplus (exports > imports) or deficit (imports > exports) |
| Importance | Shows economic health, currency trends, and policy needs |
Prelims tips
- BOP records transactions in goods, services, and capital flows with rest of the world.
- Always balances mathematically due to double-entry system.
- Deficit = imports > exports; Surplus = exports > imports.
- Two main parts: Current Account and Capital Account.
Mains points
- BOP provides a comprehensive picture of a country’s external economic relations.
- Persistent BOP deficit can indicate structural issues in trade and currency value.
- Helps in formulating monetary, fiscal, and trade policies.
- Reflects a country’s integration with global economy.
- Acts as an early warning system for economic imbalances.
Current Account of Balance of Payments (BOP)
The Current Account of BOP records trade in goods, services, income, and unilateral transfers. It shows how much a country earns or spends in its day-to-day transactions with the rest of the world. A surplus means exports and inflows are greater than imports and outflows, while a deficit means the opposite.
What is Current Account?
Current Account is part of Balance of Payments that records trade in goods, services, income, and transfers between a country and the rest of the world.
It reflects day-to-day economic dealings such as buying/selling goods, availing services, earning income from investments abroad, or receiving remittances.
Components: Visible Trade, Invisible Trade, Unilateral Transfers, and Investment Income.
Visible Trade (Merchandise Trade)
Refers to inflow (exports) and outflow (imports) of physical goods.
Goods include: general merchandise, goods used in further processing, and non-monetary gold.
Imports are shown as debit (negative), exports are shown as credit (positive).
Balance of exports and imports of goods = Balance of Trade (BOT).
Invisible Trade (Services Trade)
Refers to inflow and outflow of services instead of goods.
Examples: banking services, shipping, insurance, IT services, consultancy, tourism, medical tourism, etc.
Includes payments like interest on foreign loans or income from foreign investments.
Growing importance in globalized economies where services exports are high (e.g., India’s IT sector).
Unilateral Transfers
One-sided transfers where money flows without any return service or product.
Examples: gifts, donations, foreign aid, personal remittances from relatives abroad, salaries sent by workers (migrant remittances).
These are major inflows for many developing countries, supporting foreign exchange reserves.
Income Receipts and Payments (Investment Income)
Income from assets or investments held abroad.
Examples: profits from subsidiaries in foreign countries, dividends from foreign shares, interest from foreign loans, and reinvested earnings.
Payments include income paid to foreign investors on their assets in the home country.
| Component | Description | Examples |
|---|---|---|
| Visible Trade | Trade in physical goods | Exports of cars, imports of oil, gold |
| Invisible Trade | Trade in services | Banking, shipping, IT, tourism, medical tourism |
| Unilateral Transfers | One-way transfers with no return | Remittances, gifts, foreign aid, donations |
| Investment Income | Earnings from assets and investments abroad | Profits, dividends, interest |
Prelims tips
- Current Account includes goods, services, income, and unilateral transfers.
- Balance of Trade (BOT) is only part of Current Account (goods only).
- India often runs a Current Account Deficit (CAD) due to high oil imports.
- Remittances form a large inflow in India’s current account.
Mains points
- Current Account reflects everyday transactions with the world economy.
- Surplus indicates competitiveness in exports; deficit shows dependence on imports.
- India’s invisible trade (services exports) and remittances are key for reducing CAD.
- Current Account sustainability is crucial for currency stability.
- CAD financed through capital inflows (FDI/FII), but persistent deficit may cause vulnerability.
Planning in India – Meaning, Process & Pre-Independence Blueprints
Economic planning means thinking ahead and organizing resources to meet clear goals for growth and welfare within a set time. In India, planning combines goal-setting (what), strategy (how), resource use (with what), and implementation/monitoring (by whom, when). Before independence, several influential blueprints—Visvesvaraya Plan, Congress/NPC Plan, Bombay Plan, Gandhian Plan, People’s Plan, and Sarvodaya Plan—shaped India’s later Five-Year Plans.
What is Planning? (Simple)
Planning = deciding goals, choosing actions, arranging resources (money, people, materials), and tracking results within a time limit.
It is a process, not a one-time event; plans can change when needs or conditions change.
Good planning needs well-defined goals, clear priorities, and optimum (best possible) use of available resources.
Economic Plan – Basic Idea
An economic plan is a set of specific economic targets (e.g., growth, jobs, inflation control, poverty reduction) to be achieved in a given period with a stated strategy.
Comprehensive plan: covers most or all sectors (agriculture, industry, services, infrastructure, social sectors).
Partial plan: focuses on a part/sector (e.g., only agriculture or only industry or only public sector).
Two Approaches to Planning
Sectoral planning: Government programmes for each sector—agriculture, irrigation, manufacturing, power, construction, transport, communication, social infrastructure (health, education), and services.
Regional planning: Reducing regional imbalances by targeting backward districts/states, improving connectivity, and placing industries where jobs are needed.
Steps in the Planning Process (Government View)
1) Choose social objectives (equity, employment, growth, price stability).
2) Set measurable targets (e.g., 7% growth, X million jobs, Y% poverty reduction).
3) Design strategy & programs (policies, schemes, budgets, timelines).
4) Allocate resources (funds, land, human resources; centre–state sharing).
5) Implement, coordinate & monitor (ministries, states, local bodies; dashboards/MIS).
6) Evaluate & course-correct (mid-term reviews; learnings feed next plan).
Why Plan at All? (Beginner Logic)
Markets alone may not provide public goods (roads, basic health/education).
To correct inequalities and ensure balanced regional development.
To use scarce resources efficiently and avoid duplication/wastage.
To align day-to-day spending with long-term national goals.
| Plan / Year | Who / Source | Core Idea | Focus Areas | Why It Mattered |
|---|---|---|---|---|
| Visvesvaraya Plan (1934) | M. Visvesvaraya, 'Planned Economy of India' | Democratic capitalism; rapid industrialisation; double national income in ~10 years | Heavy industry, productivity, modern management | First systematic blueprint; stressed efficiency & industry-led growth |
| Congress / NPC Plan (1938; reports 1948-49) | National Planning Committee chaired by J. L. Nehru | Comprehensive national plan; state guidance with social objectives | All major sectors; long-term development | Placed planning at centre of nation-building discourse |
| Bombay Plan (1944-45) | 8 leading industrialists: JRD Tata, GD Birla, et al. | Growth needs strong state intervention & regulation; big public investment | Infrastructure, heavy industry, social services | Remarkable: business leaders asking for state-led planning & welfare |
| Gandhian Plan (1944) | Sriman Narayan Agarwal (Gandhian thought) | Decentralised, village-centric economy; small & cottage industries | Agriculture, khadi, rural crafts; self-reliant villages | Counter-vision to heavy-industry bias; emphasised sustainability & dignity of labour |
| People’s Plan (1945) | M. N. Roy | Marxist socialist approach; guarantee basic necessities to all | Employment, food, health, housing | Inspired later common minimum programmes (UF 1990s; UPA 2004) |
| Sarvodaya Plan (1950) | Jayaprakash Narayan; inspired by Gandhi & Vinoba | Sarvodaya (welfare of all), trusteeship, community action | Agri & agri-based small industries, land reforms, minimal foreign dependence | Reinforced decentralised, participatory planning and rural self-reliance |
Prelims tips
- Planning = process + goals + resource optimisation + monitoring.
- Comprehensive vs Partial plans: coverage of sectors is the key difference.
- Sectoral vs Regional planning: sector programmes vs reducing regional imbalance.
- Dadabhai Naoroji (1878) advocated economic planning ideas in 'Poverty in India'.
- Match the plan & proposer: Visvesvaraya (1934), NPC/Nehru (1938), Bombay Plan (1944-45), Gandhian Plan (1944), People’s Plan (1945), Sarvodaya Plan (1950).
Mains points
- Indian planning blends growth with equity: pre-independence blueprints offered competing visions—state-led heavy industry vs decentralised village economy.
- Bombay Plan’s call for strong state role shows elite consensus for public investment in early development.
- Gandhian/Sarvodaya strands emphasised sustainability, local self-reliance, and labour-intensive livelihoods—relevant for inclusive, green growth today.
- Effective planning requires robust centre–state–local coordination, realistic targets, credible data, and mid-course corrections.
- Modern planning (post-Planning Commission) relies on outcome-based monitoring (NITI Aayog), cooperative federalism, and SDG alignment.
Major Objectives and Types of Economic Planning in India
Economic planning in India was designed to address socio-economic challenges like poverty, unemployment, inequality, and underdevelopment. It aims at achieving growth, modernisation, self-reliance, and social justice. Over time, planning evolved into different models—democratic vs totalitarian, centralised vs decentralised, directive vs indicative, financial vs physical, functional vs structural, comprehensive vs partial—each reflecting different approaches to organising and managing resources.
Major Objectives of Economic Planning
Economic Growth: Sustained rise in production, national income, and per capita income. Every Five-Year Plan set clear growth targets.
Poverty Alleviation: Numerous schemes (IRDP, MGNREGA, PMGKY, etc.) aimed to reduce poverty, as India historically had the largest number of poor in the world.
Employment Generation: Linked directly to poverty reduction. Plans encouraged labour-intensive industries, rural works, and self-employment programmes.
Controlling Inequality: Planning tried to narrow the gap between rich and poor, urban and rural, through redistribution policies, land reforms, subsidies, and progressive taxation.
Self-Reliance: Not isolation, but avoiding dependence. India encouraged domestic industry and agriculture while engaging in trade on equal footing.
Modernisation: Transforming agriculture with modern inputs (HYV seeds, irrigation, mechanisation) and adopting new technologies in industries.
Social Justice & Equality: Ensuring fair distribution of prosperity without caste, gender, or class discrimination.
Reducing Regional Disparities: Backward area programmes and special focus on underdeveloped states/regions to reduce imbalances.
Types of Economic Planning – Comparative Models
Democratic vs Totalitarian
Democratic Planning: Consultative; people, states, and private sector participate. Parliament can approve or modify plans. Example: India.
Totalitarian Planning: Entirely state-controlled; production, distribution, consumption dictated. Example: Soviet Union model.
Centralised vs Decentralised
Centralised: Single national authority designs and controls plan ('planning from above').
Decentralised: Local bodies frame plans according to local needs, without excessive central interference ('planning from below').
Planning by Direction vs Inducement
By Direction: State authority orders targets and execution (command model).
By Inducement: State uses fiscal/monetary tools (tax breaks, subsidies, incentives) to influence private choices.
Indicative vs Imperative
Indicative: Seen in mixed economies; state sets broad goals but leaves freedom to private sector (France, India after liberalisation).
Imperative: Binding targets with compulsory implementation; no consumer sovereignty. Example: China under Mao.
Financial vs Physical Planning
Financial Planning: Resources allocated in money terms (budgets, investments).
Physical Planning: Focus on real goods/resources like steel, machines, labour.
Functional vs Structural Planning
Functional: Solve immediate economic difficulties without changing system (short-term relief).
Structural: Involves deep socio-economic changes like land reforms, industrial restructuring.
Comprehensive vs Partial
Comprehensive: Covers all sectors, coordinates entire economy (India’s Five-Year Plans).
Partial: Limited to specific sectors, e.g., agricultural plans, industrial policies.
| Type | Description | Example |
|---|---|---|
| Democratic | Participatory, consultative; parliament oversight | India |
| Totalitarian | Central authority controls all activities | Soviet Union |
| Centralised | Controlled by a national planning authority | India’s early 5YPs |
| Decentralised | Local bodies plan for local needs | Kerala People’s Plan |
| By Direction | Targets ordered by state authority | USSR model |
| By Inducement | Use of subsidies, fiscal tools | Indian mixed economy |
| Indicative | Broad goals, private freedom | France, India post-1991 |
| Imperative | Rigid, compulsory targets | China (pre-reforms) |
| Financial | Resource allocation in money terms | Budgets |
| Physical | Resource allocation in real goods | Steel, coal, manpower plans |
| Functional | Solves short-term economic difficulties | Crisis-management plans |
| Structural | Deep changes in socio-economic structure | Land reforms |
| Comprehensive | All sectors covered | Five-Year Plans |
| Partial | Only some sectors covered | Agriculture-focused plans |
Prelims tips
- Objectives of planning: Growth, poverty reduction, employment, equity, self-reliance, modernisation, regional balance.
- Differentiate between centralised vs decentralised, directive vs inducement, indicative vs imperative.
- First mention of planning: Visvesvaraya (1934), Nehru’s NPC (1938).
- India’s planning is democratic, mixed, and mostly indicative after 1991.
Mains points
- Economic planning in India aimed to combine growth with social justice, unlike purely capitalist or socialist models.
- Focus was on removing poverty, unemployment, inequality, and regional imbalances.
- Planning models show a spectrum: from centralised to decentralised, directive to inducement, indicative to imperative.
- Shift after 1991: from centralised directive to more indicative and participatory planning with market alignment.
- Challenges: ensuring efficiency, inclusion, realistic targets, and reducing bureaucratic rigidities.
Central Planning in India – Central Plans & Early Five-Year Plans
Central Plans are nationwide plans formulated and funded by the Union Government. India used three major central plan instruments: Five-Year Plans, the Twenty-Point Programme, and MPLAD. Among these, Five-Year Plans were the backbone of India’s development strategy—setting goals, choosing sectors to prioritise, allocating resources, and tracking outcomes.
What are Central Plans?
Meaning: Union (Central) Government designs, funds, and implements plans for the whole country.
Major Instruments: (1) Five-Year Plans (core development blueprints), (2) Twenty-Point Programme (anti-poverty & welfare thrust), (3) MPLAD (local area works via MPs).
Five-Year Plans – Quick Primer
Why: To rebuild the economy, raise growth, reduce poverty/unemployment/inequality, modernise agriculture & industry, and ensure balanced regional development.
Who designed: Planning Commission of India (till 2014).
How: Set targets → choose strategy & sectors → allocate money → implement → monitor → review.
First Five-Year Plan (1951–56)
Vision: Rebuild a newly independent nation; stabilise the economy.
Focus: Agriculture, irrigation, power (to curb foodgrain inflation after large imports).
Model base: Harrod–Domar (savings → investment → growth), with Indian adaptations.
Notable institutions/outcomes: Start of IITs (five IITs planned/established as apex technical institutes); UGC set up; Department of Agriculture expanded research, model farms, and extension.
Growth achieved: ~3.6% (above target in a difficult starting phase).
Second Five-Year Plan (1956–61)
Focus: Rapid industrialisation—heavy industries & capital goods (machines that make machines).
Model base: Mahalanobis model (P. C. Mahalanobis) prioritising capital goods to build long-run capacity.
Challenges: Closed-economy constraints ⇒ food & capital shortages, foreign exchange crisis.
Major outcomes: Large steel plants at Bhilai, Durgapur, Rourkela; big hydro-power; TIFR & Atomic Energy Commission strengthened; higher coal output; new rail lines in the North-East.
Targets vs results: Growth ~4.27%; national income target was +25% but achieved ~20%; per-capita income up ~8%.
Third Five-Year Plan (1961–66) – ‘Gadgil Yojana’
Focus: Agriculture (especially wheat) + industry to move towards food self-sufficiency.
Strategic thinking: Influenced by ideas of John Sandy & Sukhamoy Chakravarty; Deputy Chairman D. R. Gadgil (hence ‘Gadgil Yojana’).
Shocks & setbacks: 1962 Indo–China war, 1965 Indo–Pakistan war, severe drought/famine (1965–66).
Impact: Resources diverted to defence; plan missed targets.
Growth achieved: ~2.84%.
Plan Holidays / Three Annual Plans (1966–69)
Why ‘annual plans’: Weak finances, low morale after 1962–65 conflicts, and agriculture crisis.
Emphasis: Agriculture with a new strategy (high-yielding varieties, inputs)—the Green Revolution begins to take shape.
External step: First-time borrowing from IMF; rupee devaluation (1966) to support exports.
Fourth Five-Year Plan (1969–74)
Strategy: Gadgil strategy—growth with stability and self-reliance.
Context & features: Rising double-digit inflation; high fiscal deficit; non-plan subsidies ballooned; policy tilt to nationalisation and tighter controls (e.g., 14 banks nationalised in 1969); Green Revolution picked up.
Growth achieved: ~3.33%.
Fifth Five-Year Plan (1974–79)
Prepared by: D. D. Dhar.
Focus: Poverty removal (Garibi Hatao), employment, self-reliance; tame inflation.
Key initiatives: Minimum Needs Programme, National Highway System (launch year); Twenty-Point Programme (1975); RBI given a stronger role in inflation control; wage–price policy to protect workers.
Growth achieved: ~4.8%.
Criticisms: Rising regional & socio-economic disparities; evidence of governance decay (politician–bureaucrat–criminal nexus).
Termination: Ended one year early (1978) by the Janata Party government (which replaced the Congress that launched it).
| Plan (Years) | Primary Focus | Model/Strategy | Key Institutions/Outcomes | Growth |
|---|---|---|---|---|
| I (1951–56) | Agriculture, irrigation, power | Harrod–Domar | IITs start, UGC set up, agri research & extension | ~3.6% |
| II (1956–61) | Heavy industry, capital goods | Mahalanobis | Bhilai/Durgapur/Rourkela steel, hydro, TIFR, AEC, coal & NE rail | ~4.27% |
| III (1961–66) | Food self-sufficiency + industry | Gadgil orientation; Sandy–Chakravarty ideas | Agriculture push (wheat), but wars & drought hit targets | ~2.84% |
| Annual Plans (1966–69) | Agriculture rescue; exports | Crisis mgmt; Green Revolution start | IMF borrowing; 1966 rupee devaluation | — |
| IV (1969–74) | Growth + stability + self-reliance | Gadgil strategy | 14 banks nationalised; Green Revolution deepens | ~3.33% |
| V (1974–79) | Garibi Hatao, jobs, self-reliance | D. D. Dhar framework | MNP, NH system, 20-Point (1975), RBI inflation role | ~4.8% (ended early) |
Prelims tips
- Central Plans = Five-Year Plans + 20-Point Programme + MPLAD.
- 1st Plan: agriculture focus; Harrod–Domar; ~3.6% growth; IITs/UGC.
- 2nd Plan: Mahalanobis; heavy industry; 3 steel plants; ~4.27%.
- 3rd Plan: agriculture + industry; wars (1962, 1965) + drought; ~2.84%.
- Plan Holidays (1966–69): IMF borrowing; 1966 rupee devaluation; Green Revolution starts.
- 4th Plan: bank nationalisation (1969); inflation/fiscal stress; ~3.33%.
- 5th Plan: Garibi Hatao, 20-Point (1975), MNP; ~4.8%; ended early in 1978.
Mains points
- Five-Year Plans moved from agriculture stabilisation (I) to heavy industry build-up (II), then back to food security under shocks (III, Annual Plans), and to self-reliance plus welfare (IV–V).
- Mahalanobis emphasis on capital goods created long-term industrial capacity but short-run consumer goods shortages and FX stress.
- Green Revolution’s genesis lies between the Annual Plans and IV Plan; it stabilised foodgrain output but raised regional disparities.
- Bank nationalisation (1969) reoriented credit toward priority sectors; inflation management and fiscal prudence remained persistent challenges.
- Early planning built core institutions (IITs, UGC, TIFR) alongside large basic-industry projects—laying foundations for later growth.
Unemployment in India
Unemployment refers to the situation where people who are willing and able to work cannot find jobs. In India, unemployment is measured by the National Statistical Office (NSO) using surveys like the Periodic Labour Force Survey (PLFS). It is a critical socio-economic issue as it affects income, development, and overall standard of living.
Concept of Unemployment
Economists consider a person unemployed if they cannot get work even for one hour in half a day.
NSO defines unemployment as: People who are not working due to lack of work but are actively seeking jobs or showing willingness to work under existing conditions.
Unemployment rate is measured as: (Unemployed Workers / Total Labour Force) × 100.
Census of India Reports
Census is the process of systematically collecting and recording information about population.
Started in 1872 under British Viceroy Lord Mayo; first complete census was held in 1881.
Conducted every 10 years; as of 2011, 15 censuses have been conducted.
Post-1949, conducted by Registrar General and Census Commissioner under Ministry of Home Affairs.
Legal basis: Census of India Act, 1948.
The 2021 Census was postponed due to COVID-19 pandemic.
Limitation: Since Census happens every 10 years, unemployment data becomes outdated quickly.
Employment and Unemployment Surveys by NSO
Reliable estimates of employment-unemployment are given by NSO (under MoSPI).
Earlier: Quinquennial (every 5 years) Employment-Unemployment Surveys by NSSO (till 2011–12).
Since 2017: Periodic Labour Force Survey (PLFS) launched for more frequent and up-to-date data.
PLFS gives both quarterly (urban areas) and annual (rural + urban) estimates.
Provides data on workforce participation, types of employment (self-employed, regular, casual labour), and unemployment rates.
| Source | Frequency | Key Points |
|---|---|---|
| Census of India | Every 10 years | Comprehensive data, but outdated due to long gap |
| NSSO Quinquennial Surveys | Every 5 years (till 2011–12) | Provided employment-unemployment data |
| Periodic Labour Force Survey (PLFS) | Annual + Quarterly (since 2017) | Gives frequent, reliable estimates of unemployment and labour participation |
Prelims tips
- Unemployment rate formula: (Unemployed / Labour Force) × 100.
- Census of India: every 10 years, first complete in 1881, latest in 2011.
- PLFS started in 2017 to replace NSSO’s 5-year surveys.
- Registrar General & Census Commissioner conducts Census under MHA.
Mains points
- Discuss how unemployment affects economic growth and poverty reduction in India.
- Analyse the limitations of Census data for employment analysis due to long gaps.
- Evaluate the role of PLFS in providing real-time labour market data.
- Suggest policy measures to tackle unemployment with focus on skill development and entrepreneurship.
Periodic Labour Force Survey (PLFS) & Measurement of Unemployment in India
PLFS is India’s key survey by the National Statistical Office (NSO) to measure employment and unemployment trends. It provides short-term (quarterly for urban areas) and long-term (annual for rural + urban) data on indicators like Labour Force Participation Rate (LFPR), Worker Population Ratio (WPR), and Unemployment Rate (UR). To measure unemployment, NSO uses three approaches: Daily Status, Weekly Status, and Usual Status.
Objective of PLFS
To provide estimates of employment-unemployment indicators in urban areas every 3 months using Current Weekly Status (CWS).
To provide annual estimates for both rural and urban areas using both Usual Status (PS+SS) and Current Weekly Status (CWS).
Key Indicators of PLFS
Labour Force Participation Rate (LFPR): % of persons in labour force (working, seeking, or available for work) out of total population.
Worker Population Ratio (WPR): % of employed persons in the total population.
Unemployment Rate (UR): % of unemployed persons among labour force.
Current Weekly Status (CWS): Based on work status in the last 7 days before the survey.
Measurement Approaches of Unemployment
1. Daily Status Approach (CDS)
Records employment/unemployment status for each day of the reference week.
Unit: Half-day (4 hours).
Full-day employed: If worked ≥ 4 hours; Half-day employed: 1–4 hours; Unemployed: < 1 hour.
Captures short spells of unemployment common in farming/non-farming households.
Most inclusive approach; shows highest unemployment estimates.
2. Weekly Status Approach (CWS)
Records activity status during the 7 days preceding the survey.
If a person worked for at least 1 hour on at least 1 day → considered employed.
If actively looking but did not work → considered unemployed.
Captures short-term fluctuations in employment.
3. Usual Status Approach (UPS/PS+SS)
Captures long-term unemployment.
Uses majority time criterion over the last 365 days.
Principal usual activity status: Longer time spent in one activity (work/unemployed).
Records only those as unemployed who did not get gainful work for the major part of the year and were seeking work.
Provides lowest unemployment estimates.
Employment Exchange Data
Directorate General of Employment (DGE) under Ministry of Labour manages National Employment Services.
Operated via Employment Exchanges across India.
Provides registrations of job-seekers but does not always reflect actual employment status.
Note
PLFS + Census + Employment Exchanges together give different but complementary estimates.
While PLFS captures real-time dynamics, Employment Exchanges show demand-supply mismatch, and Census gives broad population trends.
| Approach | Time Frame | Features | Estimate Level |
|---|---|---|---|
| Daily Status (CDS) | Each day of last 7 days | Half-day as unit, captures short spells of unemployment | Highest |
| Weekly Status (CWS) | Last 7 days | Employed if worked ≥1 hour on ≥1 day | Medium |
| Usual Status (UPS/PS+SS) | Last 365 days | Long-term unemployment, major part of year without work | Lowest |
Prelims tips
- PLFS started in 2017 by NSO under MoSPI.
- Key indicators: LFPR, WPR, UR, and CWS.
- Daily Status gives highest unemployment, Usual Status lowest.
- Employment Exchanges provide job-seeker registration data but not actual employment.
Mains points
- Explain the objectives of PLFS and its role in measuring real-time labour market trends.
- Compare Daily, Weekly, and Usual Status approaches with examples.
- Discuss challenges of unemployment measurement in informal sectors and agriculture.
- Evaluate policy implications of PLFS data for employment generation programmes.