
CSAT (Prelims Paper II) · UPSC Notes
Data Interpretation — UPSC CSAT Notes
Free, exam-focused notes for UPSC Prelims and Mains, with Prelims tips and Mains points for every topic. 6 topics.
Open in the interactive reader: bookmarks, progress tracking and read-aloud.
Tables
In short
Tabular data interpretation gives numbers arranged in rows and columns and asks you to total, compare, average or find percentage changes. CSAT papers usually carry a few DI-type questions, and many of them are built on a table or on a passage that is really a table in words. Three habits unlock almost all of them: read the title and units first, add a Total row or column before you start, and separate absolute change from percentage change. The arithmetic is simple; the marks are lost in misreading.
In simple words
A table is just a neat list of numbers. Each row is one thing (a state, a student, a company) and each column is one feature of it (a year, a subject, a product). Where a row and a column meet you find one number, called a cell.
Everyday example: your electricity bills for 3 months were ₹800, ₹1,000 and ₹1,200. Put in a table, you can see at once that the bill rose by ₹200 every month, and that the total for the 3 months was ₹3,000.
Before doing any sum, look at the title and the units. '120' in a table of 'lakh tonnes' means 120 lakh tonnes. If you skip the units you may pick an option that is 100 times too big or too small.
The one question to always ask is: 'Is the question asking for an amount or a percentage?' A rise from 400 to 446 is a bigger amount than a rise from 100 to 120, but the second one is the bigger percentage rise (20% against 11.5%).
Two habits solve most questions: (1) add the totals of rows or columns first, because many questions need them; (2) round the numbers before dividing, and calculate exactly only when two options are close.
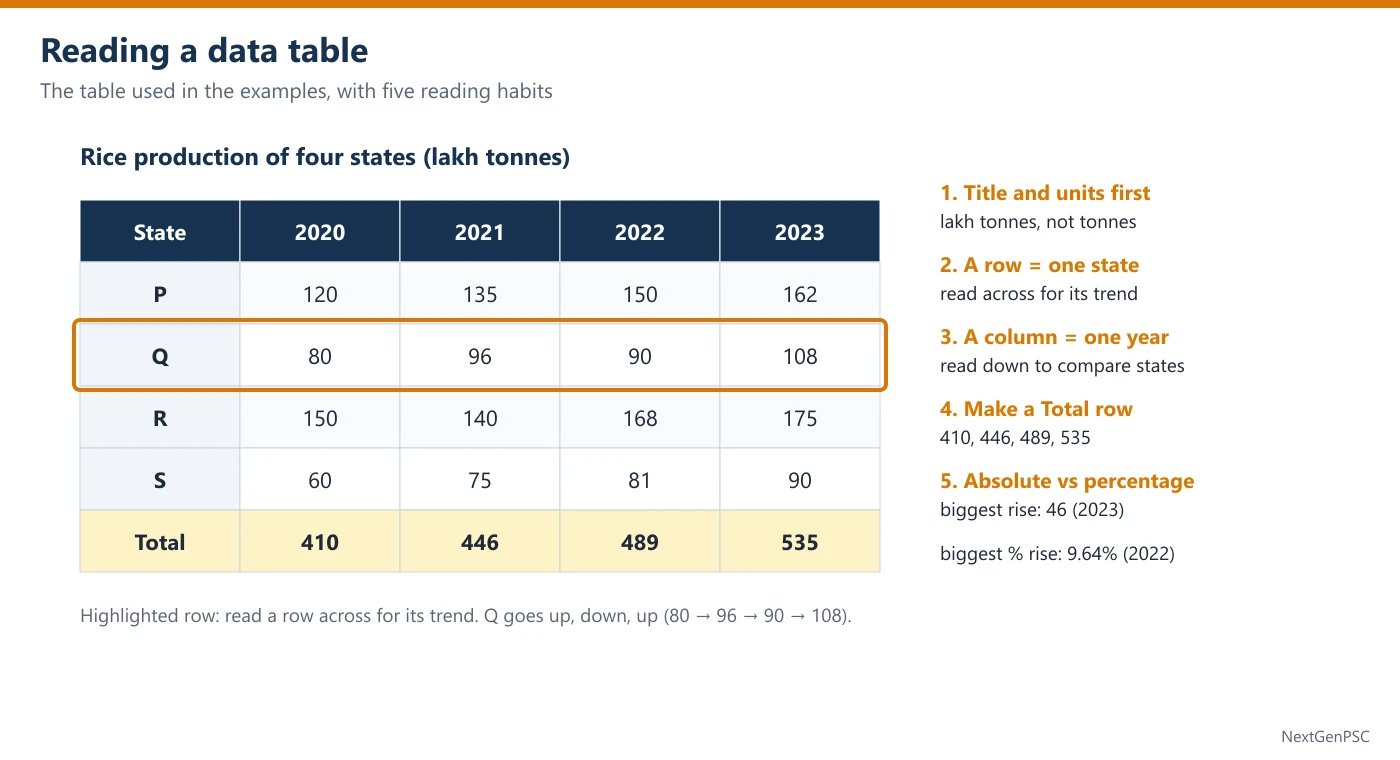
1. What a DI Table Question Tests
A data-interpretation (DI) question gives a small set of figures and asks you to draw a correct numerical conclusion from them. It does not test outside knowledge: even if the table is about rice, rainfall or exports, every answer must come from the table alone.
A table has a title (what is measured), units (lakh tonnes, ₹ crore, thousands, %), row labels (states, students, firms), column labels (years, subjects, products) and sometimes footnotes ("figures are provisional", "NA = not available").
CSAT DI questions are usually of four kinds: (1) direct reading and totals; (2) percentage change and growth; (3) share, ratio and average; (4) counting or statement questions such as 'in how many years did…' or 'which of the statements is/are correct?'.
2. Read the Table Before the Question
Step 1: title and units. Note what one number means. If production is in lakh tonnes, 120 means 1.2 crore tonnes; if a column says '% of total', its entries already are percentages and must not be divided again.
Step 2: shape of the data. Read one row across (the trend of one item over time) and one column down (comparison of all items in one year). This takes 15 seconds and shows the big picture: who is largest, who falls, who is steady.
Step 3: add a Total row. Many questions ask for the total, a share of the total or the change in the total. For the rice table used below, the totals are 410, 446, 489 and 535 for 2020 to 2023. Write them once and reuse them.
Step 4: read the question twice. Underline the exact years, the items and the word that decides the formula: 'increase' or 'percentage increase', 'share' or 'amount', 'average annual' or 'total'.
Step 5: look at the options before calculating. If the options are far apart, a rough estimate is enough. If two options are close, calculate those two exactly and ignore the rest.
3. The Six Calculations You Will Need
Total and difference: add across a row or down a column. Difference = larger − smaller; always keep the units.
Average: sum of the values ÷ number of values. Average of 80, 96, 90 and 108 = 374 ÷ 4 = 93.5. Quick check: the average must lie between the smallest and the largest value.
Percentage change: (new − old)/old × 100. The base is always the earlier (old) value. 120 → 162 is a rise of 42 on 120, i.e. 35%.
Share (percentage of total): part ÷ total × 100. R's share in 2022 = 168/489 × 100 ≈ 34.4%. The total must be of the same year as the part.
Ratio: divide both terms by their highest common factor. 162 : 90 = 9 : 5 (both divided by 18). A ratio has no units.
'How many times': 'A is how many times B' = A/B. 'A is how many times more than B' is used loosely in many papers; in CSAT read it as A/B unless the options make it clear that (A − B)/B is meant.
4. Safe Approximation
Round in the same direction carefully. To compare 43/446 and 46/489, note 43/446 ≈ 9.6% and 46/489 ≈ 9.4%. Both are close, so here you calculate one more digit; when the gap is large (for example 8% against 12%) one digit is enough.
Use 1% and 10% blocks. 10% of 446 = 44.6 and 1% = 4.46. A rise of 43 is just under 10% (44.6), so it is about 9.6%.
Cross-multiplication for comparing fractions: a/b > c/d exactly when a × d > c × b (all positive). 96/446 against 108/535: 96 × 535 = 51,360 and 108 × 446 = 48,168, so 96/446 is larger.
Why: multiplying both fractions by the positive number b × d does not change which one is bigger, and it removes the division.
Benchmarks: 1/3 = 33.3%, 1/6 = 16.7%, 1/7 = 14.3%, 1/8 = 12.5%, 1/9 = 11.1%, 1/12 = 8.3%. A share of 168/489 is a little more than 1/3 because 3 × 168 = 504 > 489.
5. Absolute Change versus Percentage Change
The year with the largest increase and the year with the largest percentage increase are often different, and UPSC options are built on that difference.
In the rice table the total rises by 36, 43 and 46. The largest absolute rise is in 2023 (46). The percentage rises are 36/410 ≈ 8.8%, 43/446 ≈ 9.6% and 46/489 ≈ 9.4%, so the largest percentage rise is in 2022.
Why: a percentage divides the rise by the base. In 2023 the base (489) is larger, so even a slightly bigger rise gives a smaller percentage.
Rule of thumb: if one rise is bigger and its base is smaller, it is certainly the bigger percentage; only when the bigger rise also has the bigger base do you need to divide.
6. Counting and Statement Questions
'In how many years / for how many items…' questions are pure checking. Make a tick list: for each row write ✓ or ✗ and count. Do not stop at the first few rows, because the options usually differ by one.
'Increased every year' means each value is larger than the one before it: 120 < 135 < 150 < 162 qualifies; 80, 96, 90, 108 does not (one fall).
Statement questions ("Which of the statements given above is/are correct?") need each statement judged on its own. Settle the easier statement first; if it is false, half the options disappear.
Cannot be determined: choose it only when the table truly lacks the needed figure (for example, profit when only sales are given). If the figure can be built from the table, 'cannot be determined' is a trap.
7. Traps UPSC Builds Into Tables
Wrong base: dividing the rise by the new value. 120 → 162: 42/162 ≈ 25.9% is wrong; 42/120 = 35% is right.
Wrong year's total: computing a 2022 share with the 2023 total.
Mixing units: a table in thousands and options in lakhs (1 lakh = 100 thousand).
Highest single value versus highest total: the student with the top mark in one subject need not have the top total.
Percentage points: a share going from 18.4% to 20.2% has risen by about 1.8 percentage points, not by 1.8%.
Example 1: Highest total from a marks table
- Question
- The table gives the marks of four students in three subjects.
Who has the highest total? (a) Asha (b) Babu (c) Chitra (d) DevStudent Maths Science English Asha 72 65 80 Babu 85 70 60 Chitra 68 88 75 Dev 90 62 70 - Solution
Normal method. Add each row: Asha 72 + 65 + 80 = 217; Babu 85 + 70 + 60 = 215; Chitra 68 + 88 + 75 = 231; Dev 90 + 62 + 70 = 222.
The largest total is 231, Chitra's.
Shortcut. Compare each student with a base of 70 per subject (210): Asha +7, Babu +5, Chitra +21, Dev +12. Chitra is clearly ahead.
Check. Chitra's average = 231 ÷ 3 = 77, the only average above 75.
Trap. Option (d) catches students who see the single highest mark (90 in Maths) and stop there.
- Answer
(c) Chitra
Example 2: Percentage change in one row
- Question
- The table shows the rice production (in lakh tonnes) of four states P, Q, R and S.
By what percent did the production of P increase from 2020 to 2023? (a) 30% (b) 35% (c) 25.9% (d) 42%State 2020 2021 2022 2023 P 120 135 150 162 Q 80 96 90 108 R 150 140 168 175 S 60 75 81 90 - Solution
Normal method. Rise = 162 − 120 = 42 lakh tonnes. Base = the 2020 value, 120.
Percentage increase = 42/120 × 100 = 35%.
Shortcut. 10% of 120 = 12, so 42 = 3.5 × 12 = 35%.
Trap. Option (c) divides by the new value (42/162 ≈ 25.9%); option (d) gives the rise in lakh tonnes, not in percent.
- Answer
(b) 35%
Example 3: Counting steady growth (UPSC-style)
- Question
- The table shows the rice production (in lakh tonnes) of four states P, Q, R and S.
For how many of the states did production increase in every year from 2020 to 2023? (a) 1 (b) 2 (c) 3 (d) 4State 2020 2021 2022 2023 P 120 135 150 162 Q 80 96 90 108 R 150 140 168 175 S 60 75 81 90 - Solution
Normal method. Check each row year by year.
P: 120 < 135 < 150 < 162 ✓. Q: 96 → 90 is a fall ✗. R: 150 → 140 is a fall ✗. S: 60 < 75 < 81 < 90 ✓.
Two states, P and S, rose every year.
Shortcut. Scan only for a fall: any row with a smaller number to the right of a bigger one is out. Q and R drop out at once.
Trap. Option (d) comes from comparing only 2020 with 2023 (all four states ended higher than they began).
- Answer
(b) 2
Example 4: Highest percentage growth
- Question
- The table shows the rice production (in lakh tonnes) of four states P, Q, R and S.
Which state recorded the highest percentage growth in production from 2020 to 2023? (a) P (b) Q (c) R (d) SState 2020 2021 2022 2023 P 120 135 150 162 Q 80 96 90 108 R 150 140 168 175 S 60 75 81 90 - Solution
Normal method. Growth = (2023 − 2020)/2020 × 100.
P: 42/120 = 35%. Q: 28/80 = 35%. R: 25/150 ≈ 16.7%. S: 30/60 = 50%.
S has the highest percentage growth.
Shortcut. S's rise (30) is half its base (60), i.e. 50%. No other row comes close to half: P and Q rise by about a third, R by a sixth.
Trap. Option (a) is the largest absolute rise (42 lakh tonnes), not the largest percentage rise.
- Answer
(d) S
Example 5: Absolute versus percentage rise in the total (UPSC-style)
- Question
- The table shows the rice production (in lakh tonnes) of four states P, Q, R and S.
In which year was the percentage increase in the total production of the four states over the previous year the highest? (a) 2021 (b) 2022 (c) 2023 (d) 2021 and 2023 equallyState 2020 2021 2022 2023 P 120 135 150 162 Q 80 96 90 108 R 150 140 168 175 S 60 75 81 90 - Solution
Normal method. Totals: 2020 = 410, 2021 = 446, 2022 = 489, 2023 = 535.
Rises: 36, 43, 46. Percentages: 36/410 ≈ 8.78%, 43/446 ≈ 9.64%, 46/489 ≈ 9.41%.
The highest percentage increase is in 2022.
Shortcut. 2023 has the bigger rise (46 against 43) but also the bigger base (489 against 446). Compare 43/446 and 46/489 by cross-multiplying: 43 × 489 = 21,027 and 46 × 446 = 20,516, so 2022 wins.
Trap. Option (c) is the year of the largest absolute rise. Percentages need the base.
- Answer
(b) 2022
Example 6: Two statements on share and average (UPSC-style)
- Question
- The table shows the rice production (in lakh tonnes) of four states P, Q, R and S.
Consider the following statements: 1. In 2022, R produced more than one-third of the total production of the four states. 2. The average annual production of Q over the four years was more than 95 lakh tonnes. Which of the statements given above is/are correct? (a) 1 only (b) 2 only (c) Both 1 and 2 (d) Neither 1 nor 2State 2020 2021 2022 2023 P 120 135 150 162 Q 80 96 90 108 R 150 140 168 175 S 60 75 81 90 - Solution
Normal method. Statement 1: total in 2022 = 489; one-third of 489 = 163. R produced 168 > 163, so statement 1 is correct (share ≈ 34.4%).
Statement 2: Q's total = 80 + 96 + 90 + 108 = 374; average = 374 ÷ 4 = 93.5, which is not more than 95. Statement 2 is wrong.
Shortcut. For statement 1 test 3 × 168 = 504 > 489. For statement 2, 95 × 4 = 380 and Q's total 374 is below it, so no division is needed.
Trap. Option (c) comes from looking only at Q's last two values (90 and 108, average 99).
- Answer
(a) 1 only
Practice Questions
Q1. Using the rice-production table above, what is the ratio of P's production to S's production in 2023? (a) 9 : 5 (b) 5 : 9 (c) 3 : 2 (d) 8 : 5
Q2. Using the same table, what is the total production of the four states over the four years taken together? (a) 1,860 lakh tonnes (b) 1,880 lakh tonnes (c) 1,890 lakh tonnes (d) 1,940 lakh tonnes
Q3. Using the same table, in which year was Q's share of the total production the highest? (a) 2020 (b) 2021 (c) 2022 (d) 2023
Q4. Using the same table, by what percent did R's production fall from 2020 to 2021? (a) 6 2/3% (b) 7 1/7% (c) 10% (d) 6%
Q5. Using the same table, by what percent was P's production in 2022 more than R's production in 2021? (a) 6 2/3% (b) 7 1/7% (c) 10% (d) 7%
Q6. Using the same table, in how many of the four years was R's production more than the combined production of Q and S? (a) 0 (b) 1 (c) 2 (d) 3
Answers
Show answers
Q1. (a) 9 : 5. 162 : 90; divide both by 18.
Q2. (b) 1,880 lakh tonnes. Year totals 410 + 446 + 489 + 535 = 1,880.
Q3. (b) 2021. Shares: 80/410 ≈ 19.5%, 96/446 ≈ 21.5%, 90/489 ≈ 18.4%, 108/535 ≈ 20.2%.
Q4. (a) 6 2/3%. Fall 10 on the base 150: 10/150 = 1/15 = 6 2/3%. Option (b) divides by 140.
Q5. (b) 7 1/7%. 150 − 140 = 10 on the base 140 (the 'than' quantity): 10/140 = 1/14 = 7 1/7%.
Q6. (b) 1. Q + S = 140, 171, 171, 198; R = 150, 140, 168, 175. Only in 2020 (150 > 140).
| Asked | Formula / method | Example from the table |
|---|---|---|
| Percentage change | (new − old)/old × 100 | P: 120 → 162 = 42/120 = 35% |
| Share of total | part ÷ total of the same year × 100 | R in 2022: 168/489 ≈ 34.4% |
| Average | sum ÷ count | Q: 374 ÷ 4 = 93.5 |
| Ratio | divide by the HCF | P : S in 2023 = 162 : 90 = 9 : 5 |
| Compare two fractions | a/b > c/d if a × d > c × b | 43/446 vs 46/489: 21,027 > 20,516 |
| More than one-third? | 3 × part > total | 3 × 168 = 504 > 489 |
| Rose every year | no value smaller than the one before | P and S qualify; Q and R do not |
| Word in the question | What to calculate | Common mistake |
|---|---|---|
| increase / rise | new − old (in units) | giving a percentage |
| percentage increase / growth | (new − old)/old × 100 | dividing by the new value |
| share / proportion of total | part ÷ total × 100 | using another year's total |
| average annual | total ÷ number of years | averaging only the end years |
| percentage points | difference of two percentages | calling it a % change |
| approximately | round, then pick the nearest option | spending time on exact division |
Prelims tips
- Title and units before anything else. UPSC options often differ by a factor of 10 or 100 (thousand against lakh, ₹ crore against ₹ lakh). 10 seconds on the units saves a wrong answer that looks perfectly calculated.
- Build the Total row once. Shares, totals and growth of the total all need it. Writing 410, 446, 489, 535 at the start turns three questions on the same table into quick reads.
- Absolute rise is not percentage rise. The trap option is usually the year or item with the biggest rise in units. If the bigger rise also has the bigger base, compare by cross-multiplication, not by eye.
- Count with a tick list. For 'in how many years/states' questions, mark ✓ or ✗ against every row. The options differ by one, so stopping early or skipping a row is exactly the mistake they reward.
- Turn 'more than' statements into multiplication. 'More than one-third' becomes 3 × part > total; 'average above 95' becomes total > 4 × 95. Multiplying is faster and safer than dividing.
- Choose 'cannot be determined' only for missing data. If the figure can be built from the table (totals, differences, shares), that option is a trap. If the question asks for profit, rate or per-person values that the table does not contain, it may be right.
Bar Graphs
In short
A bar graph shows values as the lengths of bars against a scale. CSAT uses simple, grouped (two or more bars per year) and stacked bars, and the questions ask you to read values, compare companies or years, and find growth. Three ideas unlock them: read the scale and the unit before the bars, turn the bars into a small table of numbers before calculating, and remember that the tallest jump is not always the fastest growth.
In simple words
A bar graph is a picture of numbers. Each bar stands for one value: the taller (or longer) the bar, the bigger the value. The numbers on the side, called the scale, tell you how tall each bar really is.
Everyday example: a shop sold 40 ice-creams on Monday, 55 on Tuesday and 50 on Wednesday. Draw three bars of heights 40, 55 and 50 and you see at once that Tuesday was the best day and that Wednesday was a little lower.
When two bars stand side by side for the same year (one for company X, one for company Y), it is a grouped bar graph. When one bar is cut into coloured pieces (two-wheelers, cars, buses), it is a stacked bar: each piece is the top of that piece minus its bottom.
The one question to always ask is: 'What does one step of the scale mean?' If the gridlines go 0, 10, 20 … and the unit is ₹ crore, a bar touching the 50 line means ₹50 crore.
Two habits solve most questions: (1) first write the value of every bar in a small table; (2) for growth, divide the jump by the earlier bar, because the same jump on a shorter bar is a bigger percentage.
1. Kinds of Bar Graphs
Simple bar graph: one bar per category (one bar per year, per state or per crop). It answers 'which is largest?' and 'how did it change?'.
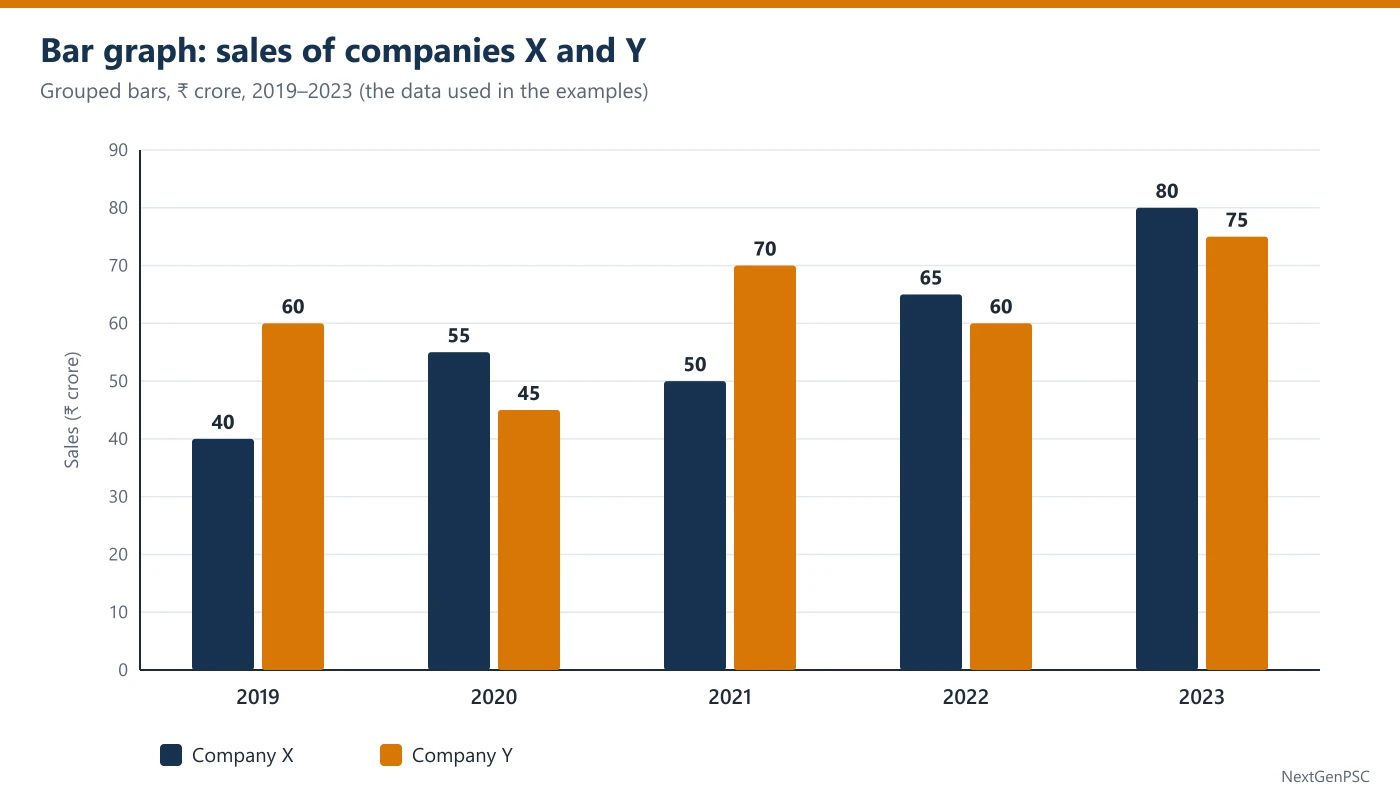
Grouped (multiple) bar graph: two or more bars side by side for each category, usually in different colours, such as sales of company X and company Y for each year. The diagram for this topic is of this kind.
Stacked (component) bar graph: one bar per category, cut into coloured parts. The full height is the total; each part is its upper edge minus its lower edge. A 100% stacked bar shows shares instead of amounts, and every bar has the same height.
Horizontal bar graph: the same idea turned sideways, used when the labels are long (names of states or schemes). Read the length along the horizontal scale.
2. Reading the Scale Correctly
Find the unit and the step. The axis title gives the unit (₹ crore, thousand tonnes, %). The gridlines give the step (every 10, every 25, every 5). A bar halfway between the 50 and 60 lines is about 55.
Values printed on the bars win. If the exact value is written on top of a bar, use it and do not estimate from the gridlines. In CSAT the data labels are usually given, as in the diagram here.
Check where the axis starts. If the vertical axis starts at 0, the heights of the bars are proportional to the values. If it starts higher (say at 30), a bar that looks twice as tall may be only a little bigger in value. Calculate, never judge ratios by eye on a cut axis.
Write a quick table. For the diagram: X = 40, 55, 50, 65, 80 and Y = 60, 45, 70, 60, 75 for 2019 to 2023. Every later step uses these ten numbers, so copying them once is time well spent.
3. Comparing Bars
Within one year: compare the two bars of the group. In 2021, Y (70) is 20 more than X (50). In 2020, X is ahead (55 against 45).
Across years for one company: follow one colour from left to right. X rises in every year except 2021 (55 → 50); Y falls in 2020 (60 → 45) and in 2022 (70 → 60).
Combined value: add the bars of a group. Combined sales: 100, 100, 120, 125, 155. Notice that 2019 and 2020 are equal: a rise in X (+15) was cancelled by a fall in Y (−15).
Who leads more often: count the groups in which one colour is taller. X is taller in 2020, 2022 and 2023, i.e. in 3 of the 5 years.
4. Growth from Bars
Percentage growth = (this year − last year)/last year × 100. X: 2020 = 15/40 = 37.5%; 2022 = 15/50 = 30%; 2023 = 15/65 ≈ 23.1%.
Why: the jump is the same (15) in three years, but it sits on bars of 40, 50 and 65. The shorter the earlier bar, the larger the percentage. So 'the biggest jump' and 'the fastest growth' can be different years.
Growth over several years: compare the last bar with the first. X: 40 → 80 is a 100% rise (the bar doubled), not 200%. A value that triples has risen by 200%.
Average: X's average = (40 + 55 + 50 + 65 + 80)/5 = 290/5 = 58. Y's average = 310/5 = 62. A quick visual check: the average line must cut through the middle of the bars.
5. Stacked Bars
In a stacked bar each segment must be found by subtraction. If a bar for a city shows two-wheelers from 0 to 45, cars from 45 to 70 and buses from 70 to 80 (thousand vehicles), then two-wheelers = 45, cars = 70 − 45 = 25 and buses = 80 − 70 = 10; the total is 80.
Trap: reading the top edge of a middle segment (70) as its value. Only the bottom segment can be read directly from the scale.
In a 100% stacked bar the segments are shares. A larger share in one year does not mean a larger amount if the totals differ; you need the totals to compare amounts.
6. Traps UPSC Builds Into Bar Graphs
Same jump, different growth (Section 4): the option with the biggest jump is often the trap in 'highest percentage growth' questions.
Combined versus individual: 'sales rose every year' may be true for X but false for X + Y together, as in 2019 → 2020.
Doubling: doubling is a 100% rise; 'increased by 200%' means it became three times as large.
Ratio order: 'ratio of X to Y' means X first. Total X : total Y = 290 : 310 = 29 : 31, not 31 : 29.
Cut axis: on a graph whose axis does not start at zero, bar heights exaggerate differences. Use the numbers.
Example 1: Reading two bars of one year
- Question
- The bar graph (see the diagram) shows the sales (₹ crore) of two companies X and Y. The bar heights are:
By how much did Y's sales exceed X's sales in 2021? (a) ₹15 crore (b) ₹20 crore (c) ₹25 crore (d) ₹120 croreYear 2019 2020 2021 2022 2023 X 40 55 50 65 80 Y 60 45 70 60 75 - Solution
Normal method. In 2021, X = 50 and Y = 70.
Difference = 70 − 50 = ₹20 crore.
Shortcut. Count gridlines: Y's bar ends 2 lines (2 × 10) above X's.
Trap. Option (d) adds the two bars (50 + 70) instead of subtracting.
- Answer
(b) ₹20 crore
Example 2: Average of one company
- Question
- The bar graph (see the diagram) shows the sales (₹ crore) of two companies X and Y. The bar heights are:
What were the average annual sales of X over the five years? (a) ₹55 crore (b) ₹58 crore (c) ₹60 crore (d) ₹62 croreYear 2019 2020 2021 2022 2023 X 40 55 50 65 80 Y 60 45 70 60 75 - Solution
Normal method. Sum = 40 + 55 + 50 + 65 + 80 = 290.
Average = 290 ÷ 5 = ₹58 crore.
Shortcut. Take 60 as a guess; deviations: −20, −5, −10, +5, +20 = −10. Average = 60 − 10/5 = 58.
Trap. Option (d) is Y's average (310 ÷ 5 = 62); option (a) is the median (55, the middle value after sorting), not the average.
- Answer
(b) ₹58 crore
Example 3: Counting the years one company leads (UPSC-style)
- Question
- The bar graph (see the diagram) shows the sales (₹ crore) of two companies X and Y. The bar heights are:
In how many of the five years were the sales of X more than the sales of Y? (a) 2 (b) 3 (c) 4 (d) 5Year 2019 2020 2021 2022 2023 X 40 55 50 65 80 Y 60 45 70 60 75 - Solution
Normal method. Compare year by year: 2019 40 < 60 ✗; 2020 55 > 45 ✓; 2021 50 < 70 ✗; 2022 65 > 60 ✓; 2023 80 > 75 ✓.
X was ahead in 3 years.
Shortcut. On the graph, count the groups in which the dark (X) bar is taller: 2020, 2022, 2023.
Trap. Option (a) misses 2023, where the bars are close (80 and 75); look at the numbers, not just the colours.
- Answer
(b) 3
Example 4: Same jump, different growth
- Question
- The bar graph (see the diagram) shows the sales (₹ crore) of two companies X and Y. The bar heights are:
In which year did X record the highest percentage increase in sales over the previous year? (a) 2020 (b) 2022 (c) 2023 (d) 2020, 2022 and 2023 equallyYear 2019 2020 2021 2022 2023 X 40 55 50 65 80 Y 60 45 70 60 75 - Solution
Normal method. X rose by 15 in 2020 (40 → 55), 2022 (50 → 65) and 2023 (65 → 80); it fell in 2021.
Percentages: 15/40 = 37.5%; 15/50 = 30%; 15/65 ≈ 23.1%.
The highest percentage increase is in 2020.
Shortcut. Equal jumps: the smallest earlier bar gives the biggest percentage. The smallest base among 40, 50, 65 is 40, so 2020.
Trap. Option (d) treats equal jumps as equal growth; option (c) picks the tallest bar.
- Answer
(a) 2020
Example 5: Ratio of totals (UPSC-style)
- Question
- The bar graph (see the diagram) shows the sales (₹ crore) of two companies X and Y. The bar heights are:
What is the ratio of the total sales of X to the total sales of Y over the five years? (a) 29 : 31 (b) 31 : 29 (c) 9 : 10 (d) 7 : 8Year 2019 2020 2021 2022 2023 X 40 55 50 65 80 Y 60 45 70 60 75 - Solution
Normal method. Total X = 40 + 55 + 50 + 65 + 80 = 290. Total Y = 60 + 45 + 70 + 60 + 75 = 310.
Ratio = 290 : 310 = 29 : 31 (divide by 10).
Shortcut. Year-wise differences X − Y: −20, +10, −20, +5, +5 = −20. So Y's total is 20 more than X's; with X = 290, Y = 310.
Check. 29 + 31 = 60 parts = 600 crore = combined sales 100 + 100 + 120 + 125 + 155.
Trap. Option (b) reverses the order: 'X to Y' puts X first.
- Answer
(a) 29 : 31
Example 6: Two statements on trends (UPSC-style)
- Question
- The bar graph (see the diagram) shows the sales (₹ crore) of two companies X and Y. The bar heights are:
Consider the following statements: 1. Compared with the previous year, Y's sales fell in exactly two years. 2. The combined sales of X and Y rose every year from 2019 to 2023. Which of the statements given above is/are correct? (a) 1 only (b) 2 only (c) Both 1 and 2 (d) Neither 1 nor 2Year 2019 2020 2021 2022 2023 X 40 55 50 65 80 Y 60 45 70 60 75 - Solution
Normal method. Statement 1: Y: 60 → 45 (fall, 2020), 45 → 70 (rise), 70 → 60 (fall, 2022), 60 → 75 (rise). Exactly two falls, so statement 1 is correct.
Statement 2: combined = 100, 100, 120, 125, 155. From 2019 to 2020 there is no rise, so statement 2 is wrong.
Shortcut. For statement 2 check only the year in which one company fell: in 2020 X rose by 15 and Y fell by 15, so the total stayed at 100.
Trap. Option (c) comes from looking at the general upward trend of the combined sales and missing the flat year.
- Answer
(a) 1 only
Practice Questions
Q1. Using the sales data of X and Y above, what were the average annual sales of Y over the five years? (a) ₹58 crore (b) ₹60 crore (c) ₹62 crore (d) ₹64 crore
Q2. In which year was X's share of the combined sales of X and Y the highest? (a) 2019 (b) 2020 (c) 2022 (d) 2023
Q3. By what percent did X's sales increase from 2019 to 2023? (a) 40% (b) 50% (c) 100% (d) 200%
Q4. In how many of the five years were the combined sales of X and Y more than ₹110 crore? (a) 2 (b) 3 (c) 4 (d) 5
Q5. By how much did Y's average annual sales exceed X's average annual sales over the five years? (a) ₹2 crore (b) ₹4 crore (c) ₹10 crore (d) ₹20 crore
Q6. A stacked bar for a city shows two-wheelers from 0 to 45, cars from 45 to 70 and buses from 70 to 80 (thousand vehicles). How many cars are there? (a) 25 thousand (b) 35 thousand (c) 45 thousand (d) 70 thousand
Answers
Show answers
Q1. (c) ₹62 crore. Total Y = 310; 310 ÷ 5 = 62.
Q2. (b) 2020. Shares: 40/100 = 40%, 55/100 = 55%, 50/120 ≈ 41.7%, 65/125 = 52%, 80/155 ≈ 51.6%.
Q3. (c) 100%. 40 → 80: the bar doubled, a rise of 40 on 40.
Q4. (b) 3. Combined: 100, 100, 120, 125, 155; above 110 in 2021, 2022 and 2023.
Q5. (b) ₹4 crore. 62 − 58 = 4 (or total gap 20 ÷ 5).
Q6. (a) 25 thousand. Middle segment = 70 − 45 = 25; 70 is only its top edge.
| Asked | Method | Example (X and Y sales) |
|---|---|---|
| Gap in one year | taller bar − shorter bar | 2021: 70 − 50 = 20 |
| Average of one company | sum of its bars ÷ number of bars | X: 290 ÷ 5 = 58 |
| Growth over last year | (this − last)/last × 100 | X 2020: 15/40 = 37.5% |
| Equal jumps | smallest earlier bar = fastest growth | 15 on 40 beats 15 on 65 |
| Ratio of totals | add each colour, then simplify | 290 : 310 = 29 : 31 |
| Stacked segment | upper edge − lower edge | cars: 70 − 45 = 25 |
| Share in a group | one bar ÷ sum of the group × 100 | X 2022: 65/125 = 52% |
Prelims tips
- Copy the bars into numbers first. The 10 seconds spent writing X = 40, 55, 50, 65, 80 and Y = 60, 45, 70, 60, 75 saves re-reading the graph for every question in the set and prevents reading the wrong colour.
- Equal jumps are not equal growth. When the same rise appears in several years, the year with the smallest earlier bar has the highest percentage growth. 'All equally' and 'the tallest bar' are the usual traps.
- Check the axis before comparing heights. If the axis starts above zero, a bar that looks twice as tall need not be twice the value. Use the printed values or the gridlines, never the picture alone.
- Stacked bars need subtraction. Only the bottom segment can be read straight off the scale. For any other segment take upper edge − lower edge; the options usually include the upper edge as a trap.
- Combined and individual trends differ. A rise in one company can be cancelled by a fall in the other. For 'combined sales rose every year', add the group for each year and check every step.
- Doubled means +100%. 'Increased by 200%' means three times. Read the options for this pair; UPSC often places both 100% and 200% among them.
Pie Charts
In short
A pie chart splits one whole (a budget, a population, total sales) into sectors. The whole circle is 100% or 360°, so 1% = 3.6°. CSAT pie-chart questions ask you to turn shares into amounts or angles, compare sectors, and compare two pies of different years. Three ideas unlock them: amount = share × total, within one pie, the ratio of shares is the ratio of amounts, and a bigger share in a different pie is not a bigger amount unless the totals are known.
In simple words
A pie chart is a round cake cut into slices. The whole cake is everything (the whole income, all the students), and each slice is one part of it. A bigger slice means a bigger part.
The whole cake is 100%, and a circle has 360°. So 1% of the cake is a slice of 3.6°. A quarter of the cake is 25% = 90°, and half is 50% = 180°.
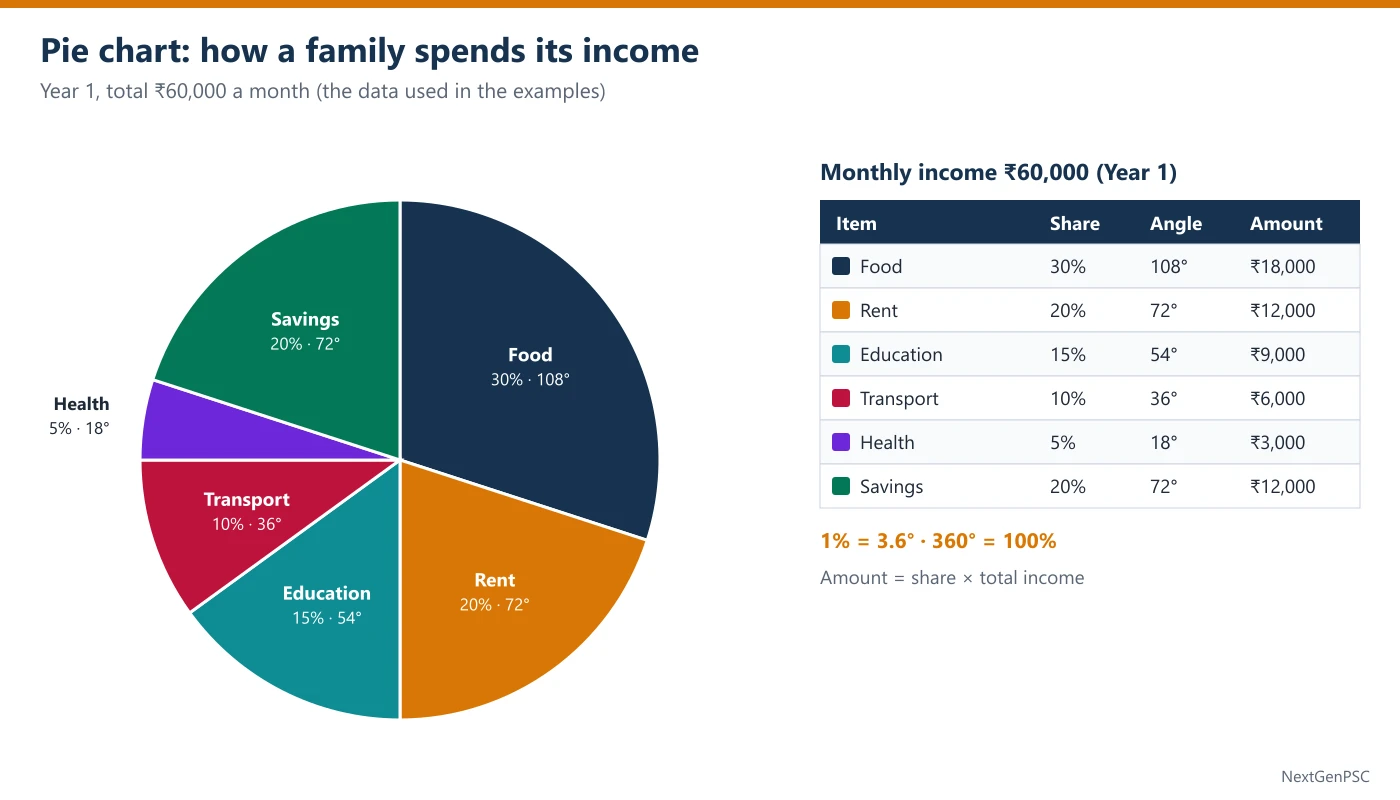
Everyday example: a family earns ₹60,000 a month and spends 30% on food. Food = 30% of 60,000 = ₹18,000, and its slice has an angle of 30 × 3.6 = 108°.
The one question to always ask is: 'Percent of which total?' If next year the income rises to ₹72,000 and food falls to 25%, food spending is 25% of 72,000 = ₹18,000: the slice is smaller, but the amount is the same.
Two habits solve most questions: (1) inside one pie, compare slices by their percentages directly (30% is twice 15%, so food is twice education); (2) when two pies are compared, first change every slice into rupees.
1. What a Pie Chart Shows
A pie chart shows how one total is divided. All the sectors together make the whole: their percentages add up to 100 and their central angles add up to 360°.
It is good for shares (what part of the budget goes to food) and poor for trends (how food spending changed over years). For trends, UPSC gives two pies or a pie with a table.
Sectors may be labelled in percentages, in degrees or in actual amounts. Check which before calculating: a label of '72' could mean 72% (impossible here), 72° (= 20%) or ₹72 crore.
2. The Four Conversions
Share → amount: amount = share% × total ÷ 100. Education = 15% of ₹60,000 = ₹9,000.
Share → angle: angle = share% × 3.6. Food = 30 × 3.6 = 108°; Health = 5 × 3.6 = 18°.
Angle → share: share% = angle ÷ 3.6. A sector of 54° is 54 ÷ 3.6 = 15%.
Amount → angle: angle = amount ÷ total × 360. ₹10,800 out of ₹60,000 = 0.18 × 360 = 64.8°.
Why 3.6: 360° stands for 100%, so 1% stands for 360 ÷ 100 = 3.6°. Memorise the common ones: 5% = 18°, 10% = 36°, 20% = 72°, 25% = 90°, 30% = 108°, 50% = 180°.
3. Comparing Sectors Within One Pie
Within one pie every sector is a share of the same total, so you can compare the percentages directly without finding amounts.
Food (30%) is 2 times Education (15%), so food spending is twice education spending. Rent and Transport together (30%) are 150% of Savings (20%): 30 ÷ 20 = 1.5.
Difference of two sectors in rupees = (difference of shares) × total ÷ 100. Food − Rent = (30 − 20)% of 60,000 = ₹6,000.
Ratio of two sectors = ratio of their shares = ratio of their angles. Food : Education = 30 : 15 = 108° : 54° = 2 : 1.
4. Two Pies with Different Totals
When two pies show different years (or two states), each percentage belongs to its own total. Never compare 30% of one pie with 25% of the other as if they were amounts.
Year 1: income ₹60,000, food 30% = ₹18,000. Year 2: income ₹72,000, food 25% = ₹18,000. The food share fell by 5 percentage points, yet food spending did not change.
Why: a smaller share of a bigger total can be equal to, or even more than, a bigger share of a smaller total. Amount = share × total, so both parts of the product matter.
If the totals of the two pies are not given, questions about amounts usually have 'cannot be determined' as the right answer. Questions about shares can still be answered.
Growth of a sector: (new amount − old amount)/old amount × 100. Health: 5% of 60,000 = ₹3,000 → 10% of 72,000 = ₹7,200, a rise of 140% (more than double).
Quick factor method: new amount ÷ old amount = (new share ÷ old share) × (new total ÷ old total). Health: (10 ÷ 5) × (72,000 ÷ 60,000) = 2 × 1.2 = 2.4 times.
5. Missing Sectors, Pie within a Pie, Unlabelled Pies
Missing sector: if every sector but one is labelled, the missing share = 100 − (sum of the others), or 360° − (sum of the other angles). In the Year 1 pie, if Savings were unlabelled: 100 − (30 + 20 + 15 + 10 + 5) = 20%.
Pie within a pie: a second chart may split one sector further, for example Education into school fees (60%) and books (40%). Then books = 40% of 15% of ₹60,000 = 0.4 × 9,000 = ₹3,600. Multiply the shares along the chain.
Pie with a table: the pie gives each part's share of the total, and a table gives a further split of each part (such as the percentage paid digitally). The amount you need = total × pie share × table percentage. This is the core of the Mixed Data Sets topic.
Unlabelled pie: estimate with right angles. A quarter circle is 25%; a sector a little wider than a right angle is a little more than 25%; half a right angle is 12.5%. Use estimates only when the options are far apart.
6. Traps UPSC Builds Into Pie Charts
Share fell, so amount fell: false when the total grew (Section 4).
Degrees read as percentages: a 72° sector is 20%, not 72%. Check the label.
Percentage points against percent: food's share fell from 30% to 25%, a fall of 5 percentage points; it is a fall of 5/30 ≈ 16.7% in the share itself.
Missing total: without the total you can give ratios and shares but not rupees.
Adding angles and percentages together: keep one unit through the whole calculation.
Example 1: Share to amount
- Question
- The pie chart (see the diagram) shows how a family spends its monthly income of ₹60,000. The shares are:
How much does the family spend on Education every month? (a) ₹6,000 (b) ₹9,000 (c) ₹12,000 (d) ₹15,000Item Food Rent Education Transport Health Savings Share (%) 30 20 15 10 5 20 - Solution
Normal method. Education = 15% of ₹60,000 = 15 × 600 = ₹9,000.
(1% of ₹60,000 = ₹600.)
Shortcut. 10% = 6,000 and 5% = 3,000, so 15% = ₹9,000.
Trap. Option (d) reads the share '15' as ₹15 thousand; option (a) is Transport (10%).
- Answer
(b) ₹9,000
Example 2: Share to angle
- Question
- The pie chart (see the diagram) shows how a family spends its monthly income of ₹60,000. The shares are:
What is the central angle of the Food sector? (a) 30° (b) 90° (c) 108° (d) 120°Item Food Rent Education Transport Health Savings Share (%) 30 20 15 10 5 20 - Solution
Normal method. Angle = 30% of 360° = 0.30 × 360 = 108°.
Shortcut. 1% = 3.6°, so 30% = 30 × 3.6 = 108°.
Check. All the angles add to 360: 108 + 72 + 54 + 36 + 18 + 72 = 360.
Trap. Option (a) copies the percentage as degrees; option (b) is a quarter (25%).
- Answer
(c) 108°
Example 3: Comparing sectors without amounts (UPSC-style)
- Question
- The pie chart (see the diagram) shows how a family spends its monthly income of ₹60,000. The shares are:
The family's spending on Rent and Transport together is what percent of its Savings? (a) 30% (b) 50% (c) 66 2/3% (d) 150%Item Food Rent Education Transport Health Savings Share (%) 30 20 15 10 5 20 - Solution
Normal method. Rent + Transport = 12,000 + 6,000 = ₹18,000; Savings = ₹12,000.
18,000 ÷ 12,000 × 100 = 150%.
Shortcut. Same pie, so use the shares: (20 + 10) ÷ 20 × 100 = 150%. The total is not needed.
Trap. Option (c) inverts the ratio (20 ÷ 30); option (a) gives the combined share of income, not a percentage of Savings.
- Answer
(d) 150%
Example 4: Smaller share of a bigger total (UPSC-style)
- Question
- The family's monthly income was ₹60,000 in Year 1 and ₹72,000 in Year 2. Its spending shares were:
Compared with Year 1, the family's spending on Food in Year 2: (a) fell by 5% (b) fell by ₹3,000 (c) remained the same (d) rose by ₹1,200Item Food Rent Education Transport Health Savings Year 1 (%) 30 20 15 10 5 20 Year 2 (%) 25 20 15 10 10 20 - Solution
Normal method. Year 1 food = 30% of 60,000 = ₹18,000. Year 2 food = 25% of 72,000 = ₹18,000.
The amount is unchanged.
Shortcut. Factor method: (25 ÷ 30) × (72,000 ÷ 60,000) = 5/6 × 6/5 = 1. No change.
Trap. Option (a) treats the fall of 5 percentage points in the share as a fall in spending; option (b) takes 5% of 60,000 as the fall.
- Answer
(c) remained the same
Example 5: Amount to angle
- Question
- The pie chart (see the diagram) shows how a family spends its monthly income of ₹60,000. The shares are:
If the family decides to show a new item costing ₹10,800 a month on a pie chart of the same income, what would its central angle be? (a) 18° (b) 54° (c) 64.8° (d) 72°Item Food Rent Education Transport Health Savings Share (%) 30 20 15 10 5 20 - Solution
Normal method. Share = 10,800 ÷ 60,000 = 0.18 = 18%.
Angle = 18 × 3.6 = 64.8°.
Shortcut. Angle = amount ÷ total × 360 = 10,800 × 360 ÷ 60,000 = 10,800 × 0.006 = 64.8°.
Trap. Option (a) stops at the share (18) and calls it degrees.
- Answer
(c) 64.8°
Example 6: Two pies, two statements (UPSC-style)
- Question
- The family's monthly income was ₹60,000 in Year 1 and ₹72,000 in Year 2. Its spending shares were:
Consider the following statements: 1. The family's spending on Health in Year 2 was more than double its spending in Year 1. 2. The family's spending on Education rose by 20% from Year 1 to Year 2. Which of the statements given above is/are correct? (a) 1 only (b) 2 only (c) Both 1 and 2 (d) Neither 1 nor 2Item Food Rent Education Transport Health Savings Year 1 (%) 30 20 15 10 5 20 Year 2 (%) 25 20 15 10 10 20 - Solution
Normal method. Health: 5% of 60,000 = ₹3,000 → 10% of 72,000 = ₹7,200. 7,200 is 2.4 times 3,000, so statement 1 is correct.
Education: 15% of 60,000 = ₹9,000 → 15% of 72,000 = ₹10,800. Rise = 1,800/9,000 = 20%, so statement 2 is correct.
Shortcut. Factor method: Health (10 ÷ 5) × 1.2 = 2.4 times; Education (15 ÷ 15) × 1.2 = 1.2 times, a 20% rise. An unchanged share grows exactly as fast as the total.
Trap. Option (b) comes from thinking that a doubled share means exactly double spending (it is more, because the total also grew); option (a) from thinking that an unchanged share means unchanged spending.
- Answer
(c) Both 1 and 2
Practice Questions
Q1. Using the Year 1 pie chart (income ₹60,000), what is the central angle of the Savings sector? (a) 20° (b) 60° (c) 72° (d) 80°
Q2. In Year 1, by how much does the spending on Food exceed the spending on Rent? (a) ₹3,600 (b) ₹6,000 (c) ₹7,200 (d) ₹10,000
Q3. In Year 1, which two items together take exactly one-fourth of the income? (a) Rent and Transport (b) Education and Transport (c) Food and Health (d) Savings and Transport
Q4. In Year 2 (income ₹72,000, Health 10%), how much did the family spend on Health? (a) ₹3,600 (b) ₹6,000 (c) ₹7,200 (d) ₹10,800
Q5. In Year 1, what is the ratio of spending on Food to spending on Education? (a) 2 : 1 (b) 1 : 2 (c) 3 : 2 (d) 5 : 3
Q6. In Year 2 (Food 25%), what is the central angle of the Food sector? (a) 72° (b) 90° (c) 100° (d) 108°
Answers
Show answers
Q1. (c) 72°. 20 × 3.6 = 72.
Q2. (b) ₹6,000. (30 − 20)% of 60,000.
Q3. (b) Education and Transport. 15 + 10 = 25% = one-fourth; the other pairs give 30, 35 and 30.
Q4. (c) ₹7,200. 10% of 72,000; option (a) is 5% of 72,000.
Q5. (a) 2 : 1. 30 : 15; within one pie the shares give the ratio.
Q6. (b) 90°. 25 × 3.6 = 90; option (d) is the Year 1 angle.
| From → to | Formula | Quick example (income ₹60,000) |
|---|---|---|
| Share → amount | share% × total ÷ 100 | 15% → ₹9,000 |
| Share → angle | share% × 3.6 | 30% → 108° |
| Angle → share | angle ÷ 3.6 | 54° → 15% |
| Amount → angle | amount ÷ total × 360 | ₹10,800 → 64.8° |
| Sector A as % of sector B | share A ÷ share B × 100 | (20 + 10) ÷ 20 = 150% |
| Same item, two pies | (new share ÷ old share) × (new total ÷ old total) | Food: 25/30 × 72/60 = 1 |
| Share | Angle | Share | Angle |
|---|---|---|---|
| 5% | 18° | 30% | 108° |
| 10% | 36° | 33 1/3% | 120° |
| 12.5% | 45° | 40% | 144° |
| 15% | 54° | 50% | 180° |
| 20% | 72° | 60% | 216° |
| 25% | 90° | 75% | 270° |
Prelims tips
- Within one pie, work in percentages. Ratios, 'what percent of' and differences between sectors of the same pie need no total. Skip the rupee conversion and save a step each time.
- Across two pies, work in amounts. A share can fall while the amount stays the same or rises, because the total changed. The trap option almost always treats a lower share as lower spending.
- Use the factor method for two pies. New ÷ old = (share ratio) × (total ratio). Food: 25/30 × 72,000/60,000 = 1. One line replaces four multiplications.
- Check whether labels are degrees or percentages. 72° is 20%. If the labels are degrees, divide by 3.6 before anything else, and make sure all sectors add to 360.
- No total, no rupees. If a question asks for an amount and the total is not given anywhere, 'cannot be determined' is likely right. If only shares or ratios are asked, it is a trap.
- Learn the degree table. 5% = 18°, 12.5% = 45°, 25% = 90°, 33 1/3% = 120°. Most angle questions then take one step.
Line Graphs
In short
A line graph joins values over time with straight lines, so it shows trends: rises, falls, peaks and the years in which one series overtakes another. CSAT line-graph questions ask for the largest change, the fastest growth, the number of rises or falls, gaps between two lines, and values built from a growth-rate line. Three ideas unlock them: the steepest segment is the biggest absolute change, not the fastest growth, a crossing means the lead has changed, and a falling growth rate still means the value is rising as long as the rate is positive.
In simple words
A line graph is a set of dots joined by lines. Each dot is the value in one year; the line between two dots shows how it changed. A line going up means a rise, going down means a fall, and a flat line means no change.
Everyday example: your weight was 60 kg, then 62 kg, then 61 kg, then 64 kg. Plot four dots and join them: you see a rise, a small dip and a bigger rise, all in one look.
A steeper line means a bigger change in amount. But growth in percent also depends on where you started: going from 30 to 35 (+5) is a 16.7% rise, while going from 40 to 50 (+10) is a 25% rise.
The one question to always ask is: 'What is plotted: the value itself, or its growth rate?' If the line shows growth rates (10%, 20%, −10%), a line that goes down from 20% to 10% still means the value went up, just more slowly.
Two habits solve most questions: (1) write the plotted numbers in a small table before calculating; (2) when two lines cross, note the year: before it one is ahead, after it the other is.
1. What a Line Graph Shows
The horizontal axis is usually time (years, months); the vertical axis is the measured value with its unit. Each point is one observation, and the segment joining two neighbouring points shows the change between them.
Line graphs are best for trends: whether a value rose or fell, how fast, where it peaked, and when one series overtook another. For shares of a whole, a pie chart is used instead.
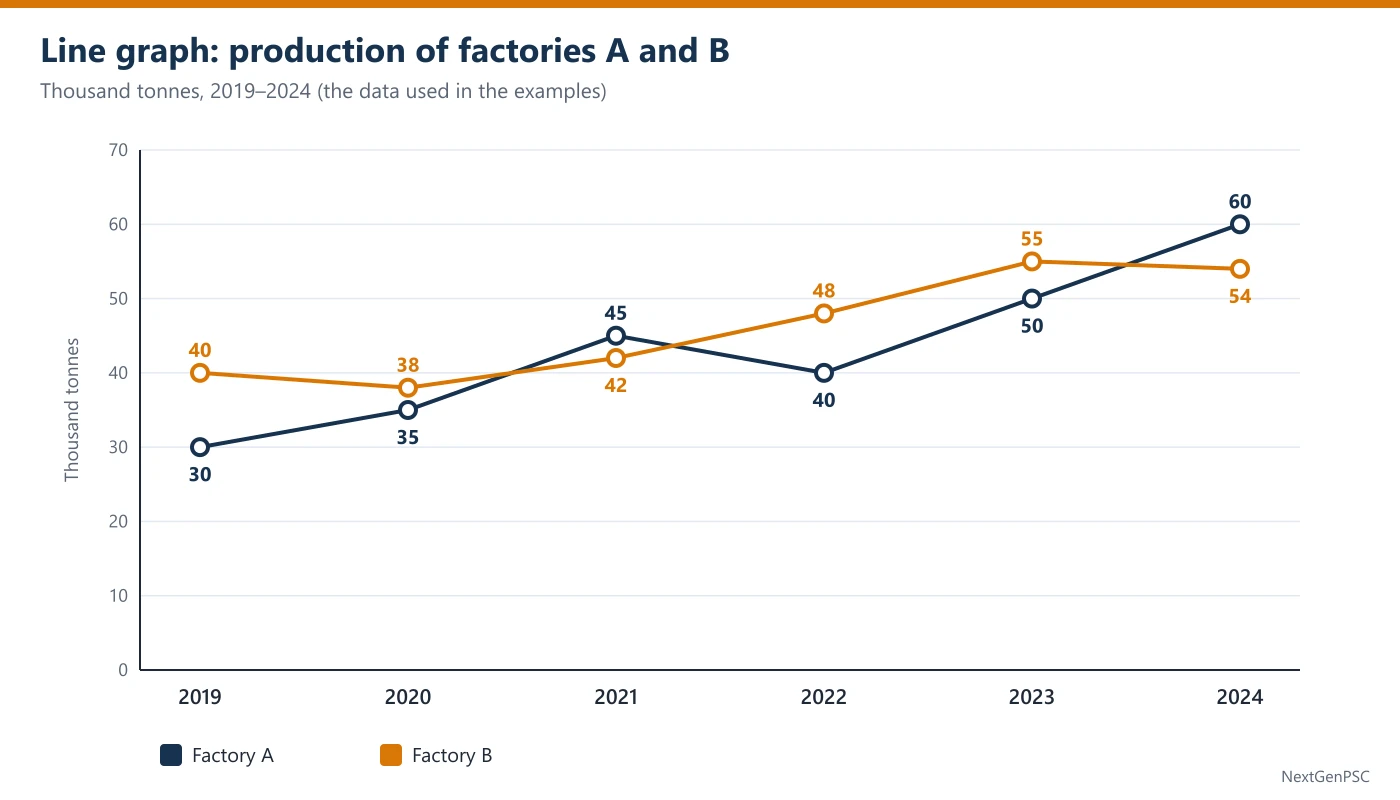
With two or more lines (factory A and factory B in the diagram), the graph also shows the gap between them in each year and the crossings where the lead changes.
2. Slope: Absolute Change
The steepness (slope) of a segment shows the absolute change in one period. A: +5 (2019 → 2020), +10, −5, +10, +10. Three segments are equally steep (+10).
Rising, falling, flat: count the segments going down to answer 'in how many years did the value fall'. B goes down twice: 40 → 38 (2020) and 55 → 54 (2024). A goes down once: 45 → 40 (2022).
Maximum and minimum: the highest point is the peak (A: 60 in 2024; B: 55 in 2023). B's peak is not in the last year, which is a common statement trap.
3. Percentage Growth from a Line
Percentage growth = change ÷ previous value × 100. A: 2020 = 5/30 ≈ 16.7%; 2021 = 10/35 ≈ 28.6%; 2023 = 10/40 = 25%; 2024 = 10/50 = 20%.
Why: the three +10 segments sit on bases 35, 40 and 50. The lowest base gives the highest percentage, so 2021 is the fastest growth even though it is no steeper than 2023 or 2024.
Close calls: B grows 6/42 ≈ 14.29% in 2022 and 7/48 ≈ 14.58% in 2023. When two candidates are this close, cross-multiply: 7 × 42 = 294 > 6 × 48 = 288, so 2023 is faster.
Over the whole period: A: 30 → 60 is +100% (it doubled). 'More than doubled' would need more than 60.
4. Two Lines: Gaps and Crossings
Gap in a year = vertical distance between the two points. A − B: −10, −3, +3, −8, −5, +6. The biggest gap is 10 (2019, B ahead).
Crossing: where the lines cross, the lead changes. A is ahead of B in 2021 (45 > 42) and in 2024 (60 > 54) only; B is ahead in the other four years.
Combined value: add the two points of each year. A + B: 70, 73, 87, 88, 105, 114. The combined value can rise even in a year when one line falls (2022: A fell by 5 but B rose by 6).
Averages: A's total = 260, average ≈ 43.3; B's total = 277, average ≈ 46.2. To test 'average more than 45' multiply instead: 45 × 6 = 270 < 277, so B's average is above 45.
5. Growth-Rate Line Graphs
Sometimes the line shows the growth rate (percentage change over the previous year), not the value. Then the rules change:
A positive growth rate means the value rose, however low the rate. A fall in the line from +20% to +10% means the value still rose, only more slowly. Only a negative rate means the value fell.
To find a value, chain the factors: if sales were ₹500 crore and grew +10%, +20%, −10% in the next three years, the value is 500 × 1.1 × 1.2 × 0.9 = ₹594 crore. Never add the rates (10 + 20 − 10 = 20% would give 600).
Without a starting value, a growth-rate graph cannot give amounts; it can still tell you whether the value rose or fell, and in which year it was highest (the year after which all rates are negative, or the last year if all rates are positive).
6. Traps UPSC Builds Into Line Graphs
Steepest = fastest: false when the bases differ (Section 3).
Falling growth rate = falling value: false while the rate is above zero (Section 5).
Doubling: 30 → 60 is exactly double; 'more than doubled' is false.
Peak year: a series can peak before the last year (B: 55 in 2023, 54 in 2024).
Reading the wrong line: in two-line graphs, use the legend and the printed labels; colours are easy to swap.
Example 1: Largest gap between two lines
- Question
- The line graph (see the diagram) shows the production (thousand tonnes) of two factories A and B. The plotted values are:
In which year was the difference between the production of A and B the largest? (a) 2019 (b) 2022 (c) 2023 (d) 2024Year 2019 2020 2021 2022 2023 2024 A 30 35 45 40 50 60 B 40 38 42 48 55 54 - Solution
Normal method. Gaps: 2019: 40 − 30 = 10; 2022: 48 − 40 = 8; 2023: 55 − 50 = 5; 2024: 60 − 54 = 6.
The largest gap is 10, in 2019.
Shortcut. On the graph, the two lines are farthest apart at the far left (2019); only 2022 comes close, and 8 < 10.
Trap. Option (d) is the year in which A is farthest ahead; the question asks for the difference whichever factory leads.
- Answer
(a) 2019
Example 2: Equal slopes, different growth
- Question
- The line graph (see the diagram) shows the production (thousand tonnes) of two factories A and B. The plotted values are:
In which year did A record the highest percentage growth in production over the previous year? (a) 2021 (b) 2023 (c) 2024 (d) 2021, 2023 and 2024 equallyYear 2019 2020 2021 2022 2023 2024 A 30 35 45 40 50 60 B 40 38 42 48 55 54 - Solution
Normal method. A rose by 10 in 2021 (35 → 45), 2023 (40 → 50) and 2024 (50 → 60); by 5 in 2020; it fell in 2022.
Growth: 2021 = 10/35 ≈ 28.6%; 2023 = 10/40 = 25%; 2024 = 10/50 = 20%; 2020 = 5/30 ≈ 16.7%.
The highest is 2021.
Shortcut. Same rise of 10, so the smallest base wins: 35 < 40 < 50.
Trap. Option (d) reads equal steepness as equal growth; option (c) picks the year with the highest point.
- Answer
(a) 2021
Example 3: Counting falls (UPSC-style)
- Question
- The line graph (see the diagram) shows the production (thousand tonnes) of two factories A and B. The plotted values are:
In how many years did the production of B fall compared with the previous year? (a) 1 (b) 2 (c) 3 (d) 4Year 2019 2020 2021 2022 2023 2024 A 30 35 45 40 50 60 B 40 38 42 48 55 54 - Solution
Normal method. B: 40 → 38 (fall), 38 → 42 (rise), 42 → 48 (rise), 48 → 55 (rise), 55 → 54 (fall).
B fell in 2 years: 2020 and 2024.
Shortcut. Count the downward segments of B's line: one at the start and one small dip at the end.
Trap. Option (a) misses the small fall from 55 to 54, which looks almost flat on the graph; the labels settle it.
- Answer
(b) 2
Example 4: Who leads, and when
- Question
- The line graph (see the diagram) shows the production (thousand tonnes) of two factories A and B. The plotted values are:
In how many of the six years was A's production more than B's? (a) 1 (b) 2 (c) 3 (d) 4Year 2019 2020 2021 2022 2023 2024 A 30 35 45 40 50 60 B 40 38 42 48 55 54 - Solution
Normal method. A > B in 2021 (45 > 42) and in 2024 (60 > 54). In 2019, 2020, 2022 and 2023 B is ahead.
So A led in 2 years.
Shortcut. Look for the crossings: the lines cross between 2020 and 2021 (A goes ahead), between 2021 and 2022 (B goes ahead again) and between 2023 and 2024 (A goes ahead). A is on top only in 2021 and 2024.
Trap. Option (d) assumes that once A crosses above B in 2021 it stays ahead (2021 to 2024 = 4 years), missing the second crossing.
- Answer
(b) 2
Example 5: Values from a growth-rate line (UPSC-style)
- Question
- A firm's sales were ₹500 crore in 2020. A line graph shows the growth of its sales over the previous year:
What were the firm's sales in 2023? (a) ₹550 crore (b) ₹594 crore (c) ₹600 crore (d) ₹610 croreYear 2021 2022 2023 Growth over previous year +10% +20% −10% - Solution
Normal method. 2021: 500 × 1.10 = 550. 2022: 550 × 1.20 = 660. 2023: 660 × 0.90 = 594.
Sales in 2023 = ₹594 crore.
Shortcut. One product: 500 × 1.1 × 1.2 × 0.9 = 500 × 1.188 = 594.
Trap. Option (c) adds the rates (10 + 20 − 10 = 20%, so 600). Option (a) stops after the first year.
- Answer
(b) ₹594 crore
Example 6: Two statements on the trend (UPSC-style)
- Question
- The line graph (see the diagram) shows the production (thousand tonnes) of two factories A and B. The plotted values are:
Consider the following statements: 1. A's production more than doubled between 2019 and 2024. 2. B's average annual production over the six years was more than 45 thousand tonnes. Which of the statements given above is/are correct? (a) 1 only (b) 2 only (c) Both 1 and 2 (d) Neither 1 nor 2Year 2019 2020 2021 2022 2023 2024 A 30 35 45 40 50 60 B 40 38 42 48 55 54 - Solution
Normal method. Statement 1: A went from 30 to 60, exactly double, not more than double. Statement 1 is wrong.
Statement 2: B's total = 40 + 38 + 42 + 48 + 55 + 54 = 277; average = 277 ÷ 6 ≈ 46.2 > 45. Statement 2 is correct.
Shortcut. For statement 2 compare totals: 45 × 6 = 270 < 277. No division needed.
Trap. Option (c) accepts 'more than doubled' for an exact doubling; option (d) comes from guessing that B's dip to 38 pulls its average below 45, without adding up.
- Answer
(b) 2 only
Practice Questions
Q1. Using the production data of A and B above, what was B's total production over the six years? (a) 260 thousand tonnes (b) 277 thousand tonnes (c) 280 thousand tonnes (d) 287 thousand tonnes
Q2. In which year was the combined production of A and B the highest? (a) 2021 (b) 2022 (c) 2023 (d) 2024
Q3. By what percent did A's production fall in 2022 compared with 2021? (a) 5% (b) 10% (c) 11 1/9% (d) 12.5%
Q4. What was the ratio of A's production to B's production in 2021? (a) 15 : 14 (b) 14 : 15 (c) 5 : 4 (d) 9 : 8
Q5. A line graph shows that a company's sales grew by 15% in 2021 and by 10% in 2022 over the previous year. Compared with 2021, the company's sales in 2022 were: (a) lower (b) higher (c) the same (d) impossible to compare
Q6. In which year did B record its highest percentage growth over the previous year? (a) 2021 (b) 2022 (c) 2023 (d) 2024
Answers
Show answers
Q1. (b) 277 thousand tonnes. 40 + 38 + 42 + 48 + 55 + 54 = 277; option (a) is A's total.
Q2. (d) 2024. Combined: 70, 73, 87, 88, 105, 114.
Q3. (c) 11 1/9%. Fall of 5 on the base 45: 5/45 = 1/9. Option (d) divides by 40.
Q4. (a) 15 : 14. 45 : 42; divide by 3.
Q5. (b) higher. A positive growth rate (10%) means sales still rose; only the speed of growth fell.
Q6. (c) 2023. Growth of B: 2021 = 4/38 ≈ 10.5%, 2022 = 6/42 ≈ 14.29%, 2023 = 7/48 ≈ 14.58%, 2024 negative; 7 × 42 = 294 > 6 × 48 = 288.
| Question asks | Look at / calculate | Example (A and B) |
|---|---|---|
| Biggest change in amount | steepest segment | A: +10 in 2021, 2023, 2024 |
| Fastest growth | change ÷ previous value | A 2021: 10/35 ≈ 28.6% |
| Number of falls | count downward segments | B: 2 (2020, 2024) |
| Who leads | which line is on top; crossings | A ahead only in 2021 and 2024 |
| Biggest gap | largest vertical distance | 2019: 40 − 30 = 10 |
| Value from growth rates | multiply the factors | 500 × 1.1 × 1.2 × 0.9 = 594 |
| Average above a level | level × number of years vs total | 45 × 6 = 270 < 277 |
Prelims tips
- Steepest is not fastest. Equal slopes mean equal absolute changes; the one starting lowest is the fastest percentage growth. Options like 'all equally' or 'the latest year' are the usual traps.
- Read the axis title: value or growth rate? On a growth-rate graph, a line going down but staying above zero means the value is still rising. Only negative rates mean a fall.
- Chain growth rates; never add them. +10%, +20%, −10% gives × 1.188, not × 1.20. Adding the rates is exactly the error the trap option is built on.
- Mark the crossings. Before answering 'in how many years was A ahead', note every crossing. A can lead, fall behind and lead again; counting only the first crossing gives a wrong answer.
- Use labels for close values. A small dip (55 → 54) looks flat on a graph. Count falls and rises from the printed values, not from the shape.
- Test averages by multiplying. 'Average above 45 over 6 years' means 'total above 270'. One addition and one multiplication are faster and safer than a division.
Mixed Data Sets
In short
In mixed data interpretation two sources are given together, such as a pie chart and a bar chart, or a table and a line graph, and no question can be answered from one source alone. CSAT sets of this kind usually have a few questions on the same data. Three ideas unlock them: find the link between the two sources (a common total or common categories), build one master table of actual numbers before answering, and always ask 'percentage of which group?', because the same 40% can be of a division or of the whole company.
In simple words
In mixed DI you get two pictures about the same thing. One picture tells you how many people are in each group; the other tells you something about each group, such as how many of them are women.
Everyday example: a school has 1,000 students, and 30% of them are in Class 10. A second chart says 40% of Class 10 students are girls. Girls in Class 10 = 40% of 30% of 1,000 = 40% of 300 = 120.
So you multiply along a chain: total → share of the group → share inside the group. Each percentage applies to the number before it, not to the grand total.
The one question to always ask is: 'Percentage of which group?' 60% women in a small division can be fewer women than 40% in a big division. Here 60% of 240 = 144, but 40% of 600 = 240.
Two habits solve most questions: (1) before answering, make one table with the real numbers for every group (employees, women, men); (2) never add or average percentages that belong to different groups.
1. What Makes a Data Set 'Mixed'
A mixed set gives two (sometimes three) sources that describe the same population or the same years: a pie chart with a bar chart, a table with a line graph, or a chart with a short paragraph of extra facts.
The sources are tied together by a link: a common total (2,400 employees), common categories (the four divisions) or common years. Every question needs both sources, so the first job is to see how they connect.
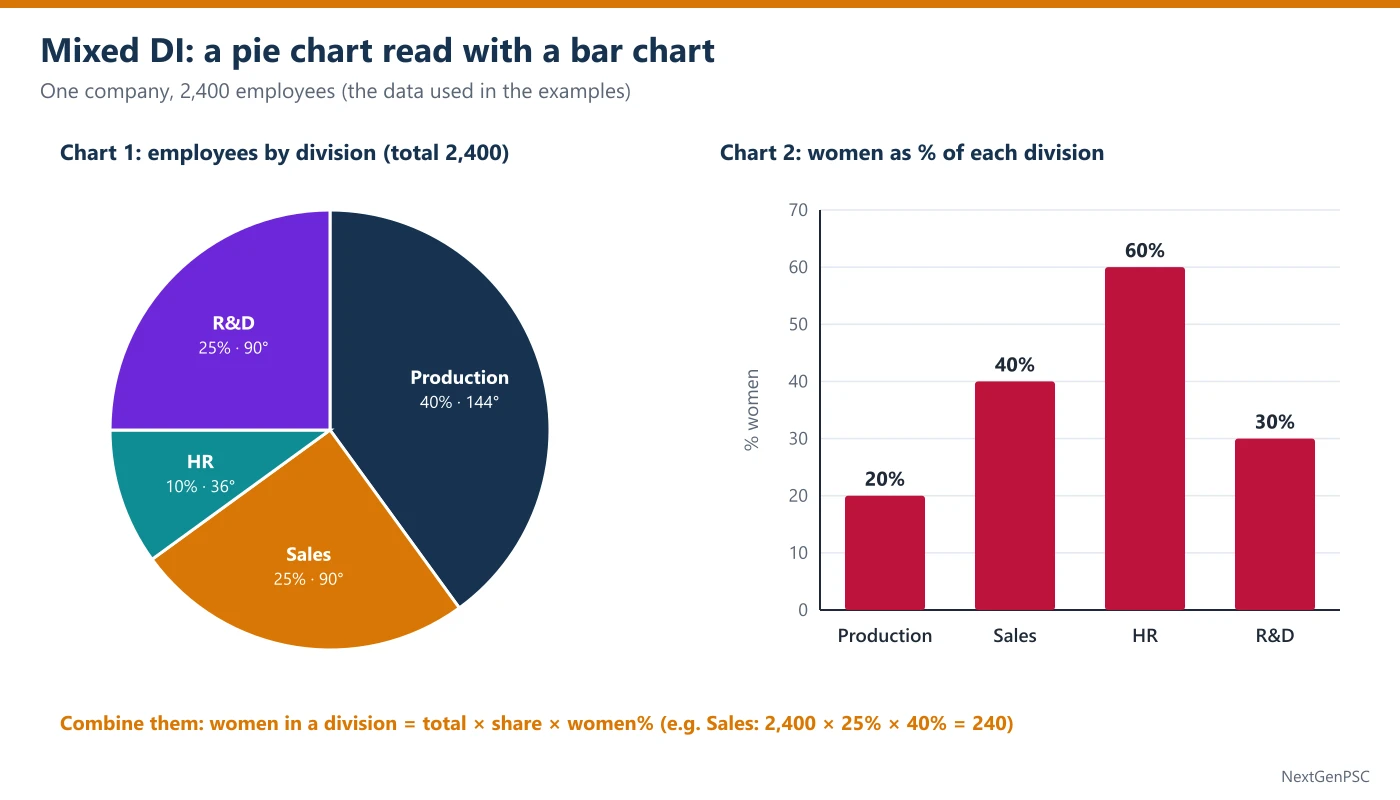
In the data for this topic, the pie gives each division's share of the 2,400 employees, and the bar chart gives the percentage of women within each division. The bar percentages are not shares of the whole company.
2. Build the Master Table First
Turn the two charts into one table of real numbers. Employees = 2,400 × pie share; women = employees × bar percentage; men = employees − women.
Production: 2,400 × 40% = 960 employees; women 20% of 960 = 192; men 768.
Sales: 2,400 × 25% = 600; women 40% of 600 = 240; men 360.
HR: 2,400 × 10% = 240; women 60% of 240 = 144; men 96.
R&D: 2,400 × 25% = 600; women 30% of 600 = 180; men 420.
Totals: employees 2,400; women 192 + 240 + 144 + 180 = 756; men 768 + 360 + 96 + 420 = 1,644. Check: 756 + 1,644 = 2,400.
This table takes about a minute and then answers the whole set: most questions become a single look-up or one division.
3. The Chain Rule of Percentages
When percentages are nested, multiply them: women in Sales as a share of the whole company = 25% × 40% = 10% of 2,400 = 240.
Why: the 40% applies to the Sales employees (600), and those are themselves 25% of the company. Taking 40% of 2,400 (= 960) uses the wrong base.
Percentage of the company that is women is a weighted average of the division percentages, weighted by division size: 40% × 20 + 25% × 40 + 10% × 60 + 25% × 30 = 8 + 10 + 6 + 7.5 = 31.5%.
The simple average (20 + 40 + 60 + 30) ÷ 4 = 37.5% is wrong, because it gives the small HR division as much weight as the big Production division.
4. Common Question Types
Count in one cell: women in R&D = 180. Read it from the master table.
Comparison across divisions: the highest percentage of women is HR (60%), but the largest number of women is in Sales (240). Questions use 'percentage' and 'number' deliberately.
Ratios across the two charts: men in R&D : men in Sales = 420 : 360 = 7 : 6.
What-if changes: if 60 women join HR and nobody leaves, HR becomes 300 people with 204 women, i.e. 68%. Change both the part and the whole.
Share of a combined group: women in Production and Sales together = 192 + 240 = 432, which is 432/756 ≈ 57% of all women.
5. Is the Data Enough?
Some questions ask what cannot be found. With these two charts you can find any count of employees, women or men by division. You cannot find, for example, salaries, ages or how many women joined last year, because neither chart contains them.
If the total (2,400) were not given, you could still compare divisions in percentages (Sales women = 10% of the company, HR women = 6%) but not give numbers. 'Cannot be determined' is right only when the missing link is truly missing.
6. A Two-Minute Plan for a Mixed Set
First 30 seconds: read both titles and units, find the link (here the total of 2,400 and the four divisions), and note what each percentage is a percentage of.
Next 60 seconds: build the master table (employees, women, men for each division) and its totals; check that the parts add up to 2,400.
Then answer in order of ease: look-ups first (one cell), then ratios and comparisons, then what-if questions. Each answer comes from the table, so the set moves quickly.
If time is short: skip the full table and use share × percentage products (Sales 25 × 40 = 1,000, Production 40 × 20 = 800) for comparison questions; they rank the divisions without the total.
7. Traps UPSC Builds Into Mixed Sets
Wrong base: applying the bar percentage to the whole company (40% of 2,400) instead of to the division (40% of 600).
Simple average of percentages: 37.5% instead of the weighted 31.5%.
Highest percentage = highest number: HR has the highest percentage of women but the smallest number of women (144, against 240 in Sales, 192 in Production and 180 in R&D).
Forgetting the whole changes: in what-if questions, adding people changes the denominator too.
Mixing 'women in a division' with 'women's share of all women': 30% of R&D are women, but R&D holds 180/756 ≈ 23.8% of all women.
Example 1: One cell from two charts
- Question
- A company has 2,400 employees. A pie chart shows how they are divided among four divisions, and a bar chart shows the percentage of women in each division (see the diagram):
How many women work in Sales? (a) 150 (b) 240 (c) 360 (d) 600Division Production Sales HR R&D Share of employees (pie, %) 40 25 10 25 Women in the division (bar, %) 20 40 60 30 - Solution
Normal method. Sales employees = 25% of 2,400 = 600.
Women in Sales = 40% of 600 = 240.
Shortcut. Chain: 2,400 × 0.25 × 0.4 = 2,400 × 0.1 = 240.
Trap. Option (c) is the number of men in Sales (600 − 240); option (d) is all Sales employees.
- Answer
(b) 240
Example 2: Weighted, not simple, average
- Question
- A company has 2,400 employees. A pie chart shows how they are divided among four divisions, and a bar chart shows the percentage of women in each division (see the diagram):
What percentage of the company's employees are women? (a) 30% (b) 31.5% (c) 37.5% (d) 42%Division Production Sales HR R&D Share of employees (pie, %) 40 25 10 25 Women in the division (bar, %) 20 40 60 30 - Solution
Normal method. Women = 192 + 240 + 144 + 180 = 756.
756 ÷ 2,400 × 100 = 31.5%.
Shortcut. Weighted average: 0.40 × 20 + 0.25 × 40 + 0.10 × 60 + 0.25 × 30 = 8 + 10 + 6 + 7.5 = 31.5.
Trap. Option (c) is the simple average of the four bar percentages, which ignores division sizes.
- Answer
(b) 31.5%
Example 3: Highest percentage versus highest number (UPSC-style)
- Question
- A company has 2,400 employees. A pie chart shows how they are divided among four divisions, and a bar chart shows the percentage of women in each division (see the diagram):
Which division has the largest number of women? (a) Production (b) Sales (c) HR (d) R&DDivision Production Sales HR R&D Share of employees (pie, %) 40 25 10 25 Women in the division (bar, %) 20 40 60 30 - Solution
Normal method. Women: Production 192, Sales 240, HR 144, R&D 180.
Sales has the most women.
Shortcut. Compare share × percentage without the total: Production 40 × 20 = 800, Sales 25 × 40 = 1,000, HR 10 × 60 = 600, R&D 25 × 30 = 750. Sales is largest.
Trap. Option (c) has the highest percentage of women (60%) but is the smallest division.
- Answer
(b) Sales
Example 4: Ratio across both charts
- Question
- A company has 2,400 employees. A pie chart shows how they are divided among four divisions, and a bar chart shows the percentage of women in each division (see the diagram):
What is the ratio of men in R&D to men in Sales? (a) 3 : 4 (b) 6 : 7 (c) 7 : 6 (d) 7 : 4Division Production Sales HR R&D Share of employees (pie, %) 40 25 10 25 Women in the division (bar, %) 20 40 60 30 - Solution
Normal method. Men in R&D = 600 − 180 = 420. Men in Sales = 600 − 240 = 360.
Ratio = 420 : 360 = 7 : 6 (divide by 60).
Shortcut. Both divisions have 600 employees, so compare the men's percentages: 70% : 60% = 7 : 6.
Trap. Option (a) compares the women's percentages (30 : 40); option (b) reverses the order.
- Answer
(c) 7 : 6
Example 5: What-if change in one division (UPSC-style)
- Question
- A company has 2,400 employees. A pie chart shows how they are divided among four divisions, and a bar chart shows the percentage of women in each division (see the diagram):
If 60 more women join HR and nobody leaves, what will be the percentage of women in HR? (a) 48% (b) 68% (c) 80% (d) 85%Division Production Sales HR R&D Share of employees (pie, %) 40 25 10 25 Women in the division (bar, %) 20 40 60 30 - Solution
Normal method. HR now: 240 employees, 144 women.
After joining: women = 144 + 60 = 204; employees = 240 + 60 = 300.
Percentage = 204 ÷ 300 × 100 = 68%.
Shortcut. 300 people, so each person is 1/3%: 204 ÷ 3 = 68.
Trap. Option (d) keeps the old total (204/240 = 85%); option (a) adds the 60 only to the total (144/300 = 48%); option (c) adds 60/300 = 20 points to the old 60%. Change both the part and the whole.
- Answer
(b) 68%
Example 6: Two statements on the combined data (UPSC-style)
- Question
- A company has 2,400 employees. A pie chart shows how they are divided among four divisions, and a bar chart shows the percentage of women in each division (see the diagram):
Consider the following statements: 1. More women work in R&D than in Production. 2. The number of men in Production is greater than the total number of women in the company. Which of the statements given above is/are correct? (a) 1 only (b) 2 only (c) Both 1 and 2 (d) Neither 1 nor 2Division Production Sales HR R&D Share of employees (pie, %) 40 25 10 25 Women in the division (bar, %) 20 40 60 30 - Solution
Normal method. Statement 1: women in R&D = 180; women in Production = 192. 180 < 192, so statement 1 is wrong.
Statement 2: men in Production = 960 − 192 = 768; total women = 756. 768 > 756, so statement 2 is correct.
Shortcut. Statement 1: 25 × 30 = 750 against 40 × 20 = 800 (shares × percentages), no total needed.
Trap. Option (c) follows the higher percentage of women in R&D (30% against 20%) and forgets that Production is a bigger division.
- Answer
(b) 2 only
Practice Questions
Q1. Using the company data above (2,400 employees), how many men work in HR? (a) 60 (b) 96 (c) 144 (d) 240
Q2. What is the central angle of the HR sector in the pie chart? (a) 10° (b) 36° (c) 60° (d) 90°
Q3. In R&D, by how many does the number of men exceed the number of women? (a) 120 (b) 180 (c) 240 (d) 420
Q4. What is the average number of women per division? (a) 180 (b) 189 (c) 192 (d) 210
Q5. If the Sales division grows by 25% and the percentage of women in it stays the same, how many women will work in Sales? (a) 250 (b) 300 (c) 340 (d) 400
Q6. Men in Production form what percentage of all the company's employees? (a) 20% (b) 32% (c) 40% (d) 80%
Answers
Show answers
Q1. (b) 96. HR = 240 employees; women 144; men 240 − 144 = 96.
Q2. (b) 36°. 10% × 3.6 = 36°.
Q3. (c) 240. Men 420 − women 180 = 240.
Q4. (b) 189. 756 ÷ 4 = 189.
Q5. (b) 300. New Sales = 600 × 1.25 = 750; 40% of 750 = 300.
Q6. (b) 32%. 768 ÷ 2,400 × 100 = 32 (or 40% × 80% = 32%).
| Division | Employees (pie) | Women (bar %) | Women | Men |
|---|---|---|---|---|
| Production | 40% = 960 | 20% | 192 | 768 |
| Sales | 25% = 600 | 40% | 240 | 360 |
| HR | 10% = 240 | 60% | 144 | 96 |
| R&D | 25% = 600 | 30% | 180 | 420 |
| Total | 2,400 | 31.5% (weighted) | 756 | 1,644 |
| Situation | Method | Example |
|---|---|---|
| Percentage inside a group | total × group share × inside share | 2,400 × 25% × 40% = 240 |
| Overall percentage | weighted average by group size | 8 + 10 + 6 + 7.5 = 31.5% |
| Compare groups without the total | group share × inside percentage | Sales 1,000 > Production 800 |
| What-if: people join | change both part and whole | 204/300 = 68% |
| Group's share of all women | women in group ÷ all women | 180/756 ≈ 23.8% |
Prelims tips
- Build the master table before the first question. A mixed set usually carries several questions; one minute spent converting both charts into real numbers (employees, women, men) turns every question into a look-up.
- Apply each percentage to its own base. The bar's 40% belongs to the 600 Sales employees, not to 2,400. Options built on the wrong base (960) are always present.
- Never average percentages of unequal groups. The company-wide figure is a weighted average (31.5%), not the simple average (37.5%). The simple average is a standard trap option.
- Percentage and number are different questions. 'Highest percentage of women' is HR; 'most women' is Sales. Read which one is asked before looking at the bar chart.
- Compare without the total when you can. Group share × inside percentage ranks groups instantly (1,000 for Sales against 800 for Production). Use full numbers only when an amount is asked.
- In what-if questions, move the denominator too. New people join both the part and the whole. (144 + 60)/(240 + 60) = 68%, not (144 + 60)/240.
Percentage and Ratio Calculations in DI
In short
Almost every DI answer is a percentage or a ratio: growth, share, share change, percentage points, the ratio of two items, and which of two fractions is larger. CSAT rewards doing these quickly and without base errors. Three ideas unlock them: a part's share rises only if it grows faster than the total, total growth is the weighted average of the parts' growth, and fractions are compared by cross-multiplication, not by long division.
In simple words
A percentage compares a number with 100; a ratio compares two numbers with each other. '20% growth' means 20 more for every 100; 'ratio 3 : 2' means 3 of one thing for every 2 of the other.
Everyday example: a family's income rose from ₹40,000 to ₹50,000 (+25%), and its rent rose from ₹10,000 to ₹11,000 (+10%). Rent's share of income fell from 25% to 22%, because rent grew more slowly than income.
That is the key idea: a slice's share of the whole goes up only if the slice grows faster than the whole. If it grows more slowly, its share falls even though its amount went up.
The one question to always ask is: 'Percent, or percentage points?' A share going from 50% to 53 1/3% has gone up by 3 1/3 percentage points, which is a 6 2/3% rise of the share itself.
Two habits solve most questions: (1) to compare two fractions, cross-multiply instead of dividing; (2) to find total growth from the parts, weight each part's growth by its size.
1. Percentage Change and Factors
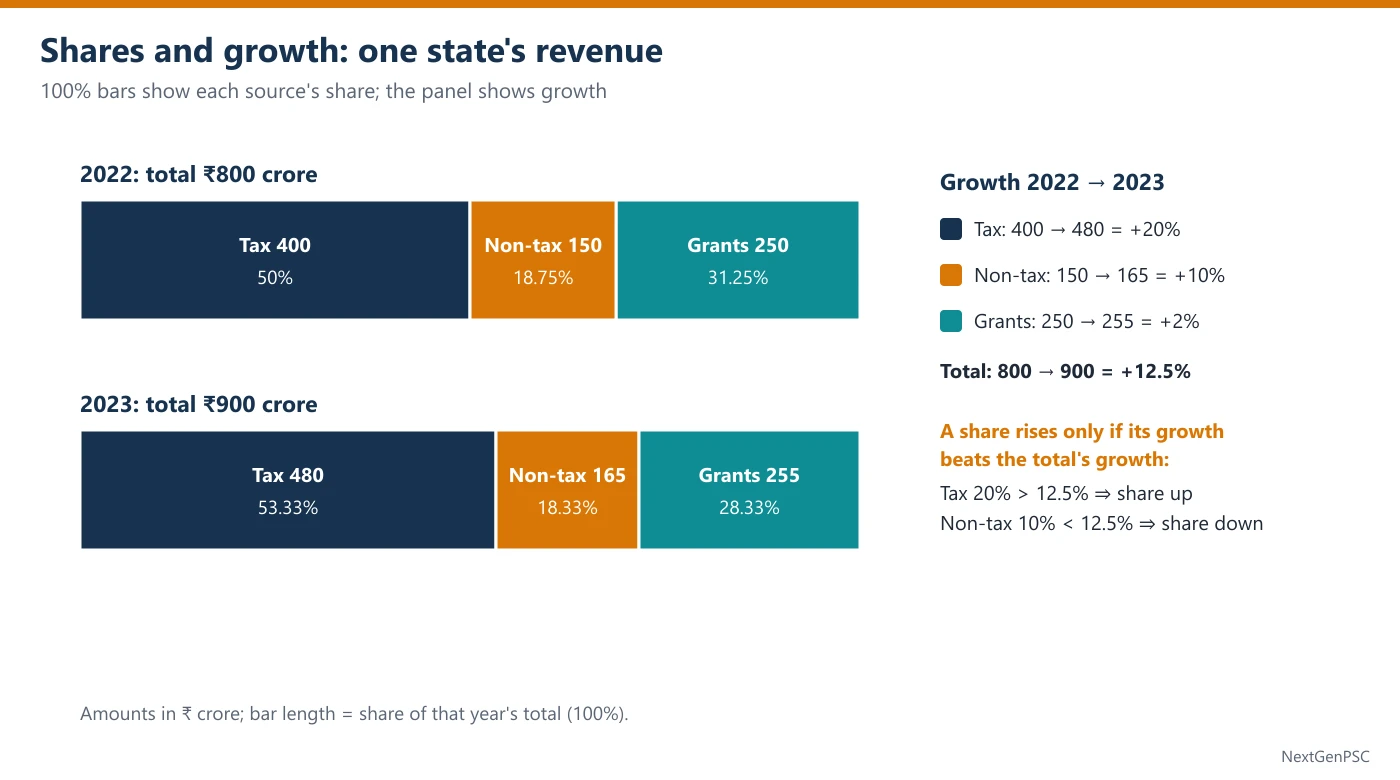
Percentage change = (new − old)/old × 100. Tax: 400 → 480 = 80/400 = 20%. Total: 800 → 900 = 100/800 = 12.5%.
Factor form: a 20% rise means × 1.20; a 2% rise × 1.02; a 10% fall × 0.90. Factors make chains easy: two rises of 10% and 20% give 1.1 × 1.2 = 1.32, a 32% rise.
Reverse percentage (finding the old value): if 480 is the value after a 20% rise, the old value is 480 ÷ 1.2 = 400, not 480 × 0.8 = 384.
Why: the 20% was calculated on the old value; to undo it you divide by the same factor. Subtracting 20% of the new value uses the wrong base.
2. Share of a Total and How It Moves
Share = part ÷ total × 100. 2022: Tax 400/800 = 50%; Non-tax 150/800 = 18.75%; Grants 250/800 = 31.25%. 2023: Tax 480/900 = 53 1/3%; Non-tax 165/900 = 18 1/3%; Grants 255/900 = 28 1/3%.
Share-shift rule: a part's share rises exactly when the part grows faster than the total. Total growth = 12.5%. Tax grew 20% (> 12.5%) so its share rose; Non-tax grew 10% and Grants 2% (< 12.5%) so their shares fell.
Why: new share = old share × (1 + part growth)/(1 + total growth). The share goes up only if the top factor is bigger than the bottom one.
This rule answers 'whose share increased?' without computing a single share, which saves a minute in the exam.
3. Percentage Points versus Percent
A percentage point is a plain difference between two percentages. Tax share: 53 1/3 − 50 = 3 1/3 percentage points.
A percent change of a share divides that difference by the old share: 3 1/3 ÷ 50 × 100 = 6 2/3%.
Grants share: 31.25% → 28 1/3%, a fall of about 2.92 percentage points (31.25 − 28.33), which is less than 3 percentage points.
UPSC statements often say 'rose by x%' when they mean points, or the reverse. Decide which one the statement claims before you check it.
4. Total Growth Is a Weighted Average
Total growth = Σ (part's share of the old total × part's growth). Revenue: 50% × 20 + 18.75% × 10 + 31.25% × 2 = 10 + 1.875 + 0.625 = 12.5%.
So the total's growth always lies between the slowest and the fastest part (here between 2% and 20%), and it sits closer to the growth of the bigger parts.
Two-part shortcut: a firm sells ₹600 crore of product A (grows 10%) and ₹400 crore of B (grows 30%). Total growth = 0.6 × 10 + 0.4 × 30 = 6 + 12 = 18%, not the simple average 20%.
What-if: if one part had not grown, take its growth as 0. If Grants had stayed at 250: total 2023 = 480 + 165 + 250 = 895, growth 95/800 = 11.875%.
5. Ratios: Simplify, Combine, Compare
Simplify: divide by the HCF. Tax : Non-tax in 2023 = 480 : 165 = 32 : 11 (HCF 15). In 2022 it was 400 : 150 = 8 : 3.
Combine: if A : B = 3 : 5 and B : C = 4 : 7, make B the same in both: A : B = 12 : 20 and B : C = 20 : 35, so A : B : C = 12 : 20 : 35.
Compare two fractions: a/b > c/d exactly when a × d > c × b. 17/23 against 13/18: 17 × 18 = 306 and 13 × 23 = 299, so 17/23 is larger.
Ratio and share: if A : B = 3 : 5, A's share of A + B is 3/8 = 37.5%. Ratios turn into shares by dividing each term by the sum of the terms.
6. Fast Approximation
Fraction benchmarks: 1/8 = 12.5%, 1/9 ≈ 11.1%, 1/11 ≈ 9.1%, 1/12 ≈ 8.3%, 1/16 = 6.25%. 100/800 = 1/8 = 12.5% at once.
1% steps: 1% of 165 = 1.65, so 165 → 182 (+17) is a little over 10%.
Round in one direction only when you compare: round both fractions up, or both down, so that the comparison stays fair. When the options are within 1% of each other, calculate exactly.
7. Ratios and 'More Than / Less Than'
A ratio hides two percentages. If A : B = 5 : 4, then A is (5 − 4)/4 = 25% more than B, and B is (5 − 4)/5 = 20% less than A. The base is the quantity after 'than'.
Comparing two ratios over time: Tax : Non-tax was 8 : 3 ≈ 2.67 in 2022 and 32 : 11 ≈ 2.91 in 2023. The ratio rose because Tax grew faster (20%) than Non-tax (10%): 2.67 × 1.20/1.10 ≈ 2.91.
Ratio from growth rates: new ratio = old ratio × (1 + growth of A)/(1 + growth of B). This avoids recomputing both amounts.
Dividing in a ratio: to split 900 in the ratio 32 : 11 : 17, one part = 900 ÷ 60 = 15, giving 480, 165 and 255, exactly the 2023 revenue.
8. Traps UPSC Builds
Amount rose, so share rose: false for Non-tax (amount +10%, share 18.75% → 18 1/3%).
Simple average of growth rates: (20 + 10 + 2)/3 ≈ 10.7% is not total growth; 12.5% is.
Reverse percentage with the wrong base: 480 × 0.8 = 384 instead of 480 ÷ 1.2 = 400.
Points against percent (Section 3), and ratio order: 'A to B' means A first.
Example 1: Growth of the total
- Question
- The table gives a state's revenue (₹ crore) from three sources (see the diagram):
By what percent did the state's total revenue grow from 2022 to 2023? (a) 10% (b) 11.1% (c) 12.5% (d) 32%Source Tax Non-tax Grants 2022 400 150 250 2023 480 165 255 - Solution
Normal method. Total 2022 = 400 + 150 + 250 = 800. Total 2023 = 480 + 165 + 255 = 900.
Growth = 100/800 × 100 = 12.5%.
Shortcut. 100/800 = 1/8 = 12.5% (benchmark).
Trap. Option (b) divides by the new total (100/900); option (d) adds the three growth rates (20 + 10 + 2).
- Answer
(c) 12.5%
Example 2: Ratio in one year
- Question
- The table gives a state's revenue (₹ crore) from three sources (see the diagram):
What is the ratio of Tax revenue to Non-tax revenue in 2023? (a) 3 : 1 (b) 8 : 3 (c) 11 : 32 (d) 32 : 11Source Tax Non-tax Grants 2022 400 150 250 2023 480 165 255 - Solution
Normal method. 480 : 165. HCF of 480 and 165 is 15.
480 ÷ 15 = 32 and 165 ÷ 15 = 11, so the ratio is 32 : 11.
Shortcut. Divide by 5 (96 : 33), then by 3 (32 : 11).
Trap. Option (b) is the 2022 ratio (400 : 150); option (c) reverses the order.
- Answer
(d) 32 : 11
Example 3: Whose share rose? (UPSC-style)
- Question
- The table gives a state's revenue (₹ crore) from three sources (see the diagram):
The share of which source(s) in total revenue was higher in 2023 than in 2022? (a) Tax only (b) Tax and Non-tax (c) Non-tax and Grants (d) All threeSource Tax Non-tax Grants 2022 400 150 250 2023 480 165 255 - Solution
Normal method. Shares 2022: 50%, 18.75%, 31.25%. Shares 2023: 53 1/3%, 18 1/3%, 28 1/3%.
Only Tax's share went up.
Shortcut. Share-shift rule: total grew 12.5%. Tax grew 20% (faster), Non-tax 10% and Grants 2% (slower). Only Tax gains share; no shares need to be computed.
Trap. Option (d) confuses amounts with shares (all three amounts rose); option (b) adds Non-tax because its amount rose by a respectable 10%.
- Answer
(a) Tax only
Example 4: Percentage points
- Question
- The table gives a state's revenue (₹ crore) from three sources (see the diagram):
By how many percentage points did the share of Tax in total revenue rise from 2022 to 2023? (a) 3 percentage points (b) 3 1/3 percentage points (c) 6 2/3 percentage points (d) 20 percentage pointsSource Tax Non-tax Grants 2022 400 150 250 2023 480 165 255 - Solution
Normal method. Share 2022 = 400/800 = 50%. Share 2023 = 480/900 = 53 1/3%.
Rise = 53 1/3 − 50 = 3 1/3 percentage points.
Shortcut. New share = old share × 1.20/1.125 = 50 × 16/15 = 53 1/3.
Trap. Option (c) is the percent rise of the share (3 1/3 ÷ 50); option (d) is the growth of the tax amount.
- Answer
(b) 3 1/3 percentage points
Example 5: Weighted growth of a total (UPSC-style)
- Question
A firm sells two products. Last year product A earned ₹600 crore and product B ₹400 crore. This year A's sales grew by 10% and B's by 30%. By what percent did the firm's total sales grow? (a) 18% (b) 20% (c) 22% (d) 40%
- Solution
Normal method. A: 600 × 1.1 = 660. B: 400 × 1.3 = 520. Total: 1,000 → 1,180.
Growth = 180/1,000 = 18%.
Shortcut. Weighted average: 0.6 × 10 + 0.4 × 30 = 6 + 12 = 18.
Trap. Option (b) is the simple average of 10 and 30; option (d) adds them.
- Answer
(a) 18%
Example 6: Two statements on shares and growth (UPSC-style)
- Question
- The table gives a state's revenue (₹ crore) from three sources (see the diagram):
Consider the following statements: 1. The share of Grants in total revenue fell by more than 3 percentage points from 2022 to 2023. 2. Had Grants stayed at their 2022 level, total revenue would have grown by less than 12%. Which of the statements given above is/are correct? (a) 1 only (b) 2 only (c) Both 1 and 2 (d) Neither 1 nor 2Source Tax Non-tax Grants 2022 400 150 250 2023 480 165 255 - Solution
Normal method. Statement 1: Grants share 250/800 = 31.25% → 255/900 = 28 1/3%. Fall = 31.25 − 28.33 ≈ 2.92 percentage points, which is not more than 3. Statement 1 is wrong.
Statement 2: total 2023 would be 480 + 165 + 250 = 895; growth = 95/800 = 11.875% < 12%. Statement 2 is correct.
Shortcut. Statement 2: 12% of 800 = 96, and the rise would be 95 < 96. No division needed.
Trap. Option (c) rounds 2.92 up to 3 and treats 'about 3' as 'more than 3'; option (a) forgets that removing only ₹5 crore barely changes the total.
- Answer
(b) 2 only
Practice Questions
Q1. Using the revenue table above, what was Tax's share of total revenue in 2023? (a) 48% (b) 50% (c) 53 1/3% (d) 60%
Q2. By what percent did Grants grow from 2022 to 2023? (a) 0.5% (b) 1.96% (c) 2% (d) 5%
Q3. If A : B = 3 : 5 and B : C = 4 : 7, what is A : B : C? (a) 3 : 5 : 7 (b) 3 : 4 : 7 (c) 12 : 15 : 35 (d) 12 : 20 : 35
Q4. A value rises from 64 to 80 and then falls back to 64. The percentage rise and the percentage fall are: (a) 25% and 25% (b) 25% and 20% (c) 20% and 25% (d) 16% and 20%
Q5. Of 1,200 applicants, 35% are women. 60% of the women and 50% of the men pass. What percentage of all applicants pass? (a) 52.5% (b) 53.5% (c) 55% (d) 56.5%
Q6. Which is larger, 17/23 or 13/18? (a) 17/23 (b) 13/18 (c) both are equal (d) cannot be compared without division
Answers
Show answers
Q1. (c) 53 1/3%. 480/900 = 8/15 = 53 1/3%.
Q2. (c) 2%. 5/250 = 2%; option (b) divides by 255.
Q3. (d) 12 : 20 : 35. Make B = 20 in both: 12 : 20 and 20 : 35.
Q4. (b) 25% and 20%. 16/64 = 25% up; 16/80 = 20% down.
Q5. (b) 53.5%. Weighted: 0.35 × 60 + 0.65 × 50 = 21 + 32.5 = 53.5 (642 of 1,200).
Q6. (a) 17/23. 17 × 18 = 306 > 13 × 23 = 299.
| Situation | Rule | Example (revenue table) |
|---|---|---|
| Did a share rise? | yes if part's growth > total's growth | Tax 20% > 12.5%: share up |
| Total growth from parts | weighted average of part growths | 10 + 1.875 + 0.625 = 12.5% |
| Percentage points | new % − old % | 53 1/3 − 50 = 3 1/3 points |
| Percent change of a share | (new % − old %)/old % × 100 | 3 1/3 ÷ 50 = 6 2/3% |
| Old value before an r% rise | new ÷ (1 + r/100) | 480 ÷ 1.2 = 400 |
| Combine A : B and B : C | make B equal in both | 3 : 5, 4 : 7 → 12 : 20 : 35 |
| Compare a/b and c/d | compare a × d and c × b | 17/23: 306 > 299 |
Prelims tips
- Use the share-shift rule. To know whose share rose, compare each part's growth with the total's growth. It answers the most common DI statement without computing any share.
- Weighted, never simple, averages. Total growth, overall pass rate and overall percentage of women are all weighted by group size. The simple average is placed in the options as a trap.
- Points and percent are different claims. 50% → 53 1/3% is 3 1/3 points and a 6 2/3% rise. Underline the word 'points' or 'percent' in each statement before checking it.
- Undo a rise by dividing. The value before a 20% rise is new ÷ 1.2. Subtracting 20% of the new value gives a wrong option that UPSC includes on purpose.
- Cross-multiply to compare fractions. 17 × 18 against 13 × 23 settles 17/23 against 13/18 in seconds; it also settles 'which year had the higher share' questions.
- Convert 'more than' into a product. 'Growth below 12%' on a base of 800 means 'rise below 96'. Compare whole numbers instead of dividing to two decimals.