
Indian Economy · UPSC Notes
Introduction to Economics — UPSC Economy Notes
Free, exam-focused notes for UPSC Prelims and Mains, with Prelims tips and Mains points for every topic. 20 topics.
Open in the interactive reader: bookmarks, progress tracking and read-aloud.
Introduction to Economics
Economics is derived from the Greek term ‘Oikonomikos’ meaning household management. It studies how goods and services are produced, distributed, and consumed, and the role of the state in regulating and supporting the economy.
Meaning of Economics
The word 'Economics' comes from the Greek words ‘Oikos’ (meaning household) and ‘Nomos’ (meaning management or rules).
At its core, Economics originally meant household management, but in modern times it refers to the study of how societies manage scarce resources to satisfy unlimited human wants.
Economics studies three main aspects: production (how goods and services are created), distribution (how income and resources are shared), and consumption (how goods and services are used to fulfill needs).
Example: A farmer producing wheat (production), selling it in the market to earn income (distribution), and households buying bread made from that wheat (consumption).
Significance of Economics
Economics helps us understand how institutions (like banks, companies, or governments) and technology (like computers, AI, or machines) influence prices and the allocation of resources.
It studies financial markets: how interest rates affect borrowing and investment, and how stock prices reflect company performance.
It examines the distribution of income—who earns more, who earns less—and suggests ways to reduce inequality.
It analyses trade between nations, the benefits of free trade, and the negative impacts of trade barriers like tariffs or quotas.
Example: When a government imposes import duties on foreign cars, domestic car manufacturers may benefit, but consumers face higher prices.
Economic Activities
Production: The process of adding value to raw materials by using factors of production such as land, labour, capital, and entrepreneurship. Example: Turning cotton into cloth.
Distribution: The process by which the income generated in production is shared among landowners (rent), workers (wages), capital providers (interest), and entrepreneurs (profit). Example: A company distributing its earnings as salaries and dividends.
Consumption: The use of goods and services to satisfy human needs and wants. Example: A household buying milk for daily use.
Role of State in Economy
Regulator: The government makes laws and policies to regulate the economy (e.g., fixing minimum wages, regulating banks).
Producer/Supplier of private goods: The state may directly produce goods like steel, electricity, or transport services.
Producer/Supplier of public goods: Public or social goods like roads, defense, education, and healthcare are supplied by the state as they benefit society as a whole and cannot be left only to private producers.
Definitions of Economics
Adam Smith (Wealth Definition): In his book ‘The Wealth of Nations’ (1776), he defined economics as the science of wealth—focusing on how nations accumulate and grow wealth. Criticism: It considers wealth as the ultimate goal, ignoring human welfare.
Alfred Marshall (Welfare Definition): In his book ‘Principles of Economics’ (1890), he said economics is the study of mankind in the ordinary business of life, focusing on human welfare. Criticism: It emphasizes only material goods, neglecting immaterial services like teaching or healthcare.
Lionel Robbins (Scarcity Definition): In his book ‘Nature and Significance of Economic Science’ (1932), he defined economics as the science of human behaviour as a relationship between ends (unlimited wants) and scarce means (limited resources) with alternative uses. Criticism: This definition ignores economic growth and development issues.
| Economist | Definition | Criticism |
|---|---|---|
| Adam Smith | Science of wealth; focus on national wealth. | Wealth treated as an end. |
| Alfred Marshall | Study of mankind in ordinary business of life. | Ignores immaterial services. |
| Lionel Robbins | Study of human behaviour as relationship between ends and scarce means. | Excludes growth and development. |
Prelims tips
- Economics = Oikonomikos (Greek).
- Adam Smith = Wealth definition (1776).
- Alfred Marshall = Welfare definition.
- Lionel Robbins = Scarcity definition.
- Economic activities : Production, Distribution, Consumption.
Mains points
- Economics studies production, distribution, and consumption of resources.
- Helps analyse markets, income distribution, and trade patterns.
- State plays role as regulator, producer, and supplier of goods.
- Different definitions (Wealth, Welfare, Scarcity) show evolution of the subject.
- Understanding limitations of each definition is essential for economic analysis.
Basic Concepts in Economics
Economics studies goods, services, and utility. Goods and services satisfy human wants, and utility refers to the want-satisfying power of a commodity. Goods are classified into free, economic, public, private, consumer, and capital goods.
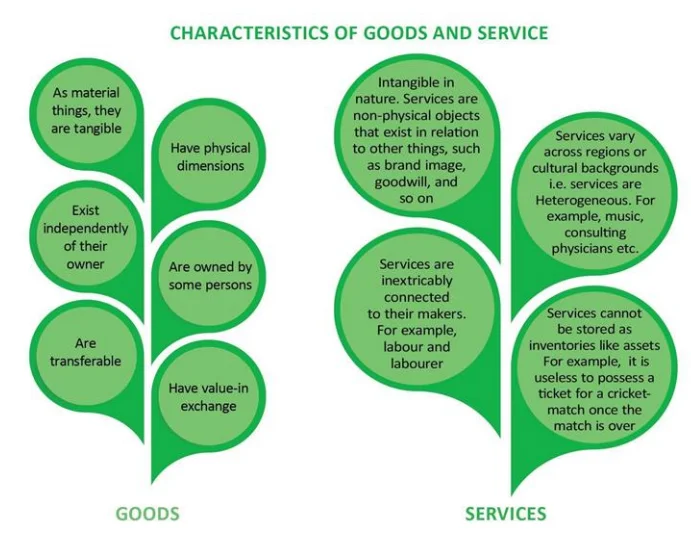
Goods and Services
Goods and services are the basic objects of economic study because they satisfy human wants and needs.
In Economics, the term 'goods' is used in a broader sense and it includes not only physical products (like food, clothes, cars) but also 'services' (like teaching, medical treatment, transport).
Example: When you buy a mobile phone, it is a good . When you pay for internet services, it is a service . Both together help in fulfilling different types of human wants.
Types of Goods and Services
Free Goods: These are naturally available in abundance and people do not need to spend money to use them. Example: Air, sunlight, rainwater in open fields.
Economic Goods: These are limited in supply, not freely available, and require payment to be obtained. Example: Cars, refrigerators, smartphones.
Public Goods: Goods that are available for everyone to consume, regardless of whether they pay or not. They are non-excludable (cannot stop anyone from using) and non-rival (one person’s use does not reduce another’s). Example: National defence, law and order, street lighting.
Private Goods: Goods that are consumed individually by people or households. If one person consumes them, others cannot. Example: Food, clothes, furniture.
Consumer Goods: Goods that are purchased for direct consumption and not used further for production. Example: Bread, milk, shoes, washing machine (durable goods last long; non-durable like milk are consumed quickly).
Capital Goods: Goods used in producing other goods and services. They are not for direct consumption but for production purposes. Example: Factory machines, tools, tractors used in farming.
Concept of Utility
Utility means the capacity of a good or service to satisfy human wants. It is the satisfaction or benefit derived from consuming a product.
Example: A glass of water gives utility to a thirsty person but may not give the same utility to someone who is not thirsty.
Characteristics of Utility
Psychological: Utility depends on individual preference and mindset. What is useful for one person may not be for another. Example: A vegetarian derives no utility from chicken, but a non-vegetarian does.
Not the same as Usefulness: A product may give satisfaction even if it is harmful. Example: A cigarette gives utility to a smoker, though it is harmful for health.
Not the same as Pleasure: Utility is about want-satisfaction, not necessarily happiness. Example: Drinking bitter medicine may not give pleasure but gives utility as it cures illness.
Diminishing Utility: As a person consumes more units of a commodity, the extra satisfaction from each additional unit decreases. Example: The first slice of pizza gives high satisfaction, but the fifth or sixth gives less.
Subjective Concept: Utility cannot be measured in numbers, as it varies from person to person. Example: The satisfaction a smoker gets from a cigarette cannot be exactly measured or compared with another person.
| Type | Description | Example |
|---|---|---|
| Free Goods | Abundant, no cost to use | Air, Sunshine |
| Economic Goods | Scarce, require payment | Cars, Refrigerators |
| Public Goods | Available for all, irrespective of payment | National defence, Law enforcement |
| Private Goods | Consumed by individuals/households | Food, Drinks |
| Consumer Goods | Used for final consumption | Durable, Non-durable goods |
| Capital Goods | Used in production of consumer goods | Machinery in factories |
Prelims tips
- Free goods are abundant, no cost (e.g., air).
- Economic goods are scarce, need money (e.g., cars).
- Public goods : non-excludable, non-rivalrous (e.g., defence).
- Utility is subjective and psychological.
- Law of diminishing marginal utility : utility decreases as consumption increases.
Mains points
- Goods and services form the basis of economic study.
- Classification of goods helps in policy-making (public vs private, consumer vs capital).
- Utility explains consumer behaviour and demand theory.
- Utility is subjective, not measurable, and influenced by psychological factors.
- Law of diminishing utility plays a central role in consumer equilibrium.
Concept of Price, Cost, and Indifference Curve
Price is the monetary value of goods. Cost represents the expenditure incurred in production or acquisition. Costs are classified into money cost, real cost, opportunity cost, explicit cost, implicit cost, economic cost, social cost, fixed cost, and variable cost. An indifference curve shows different combinations of two goods giving the same level of satisfaction.
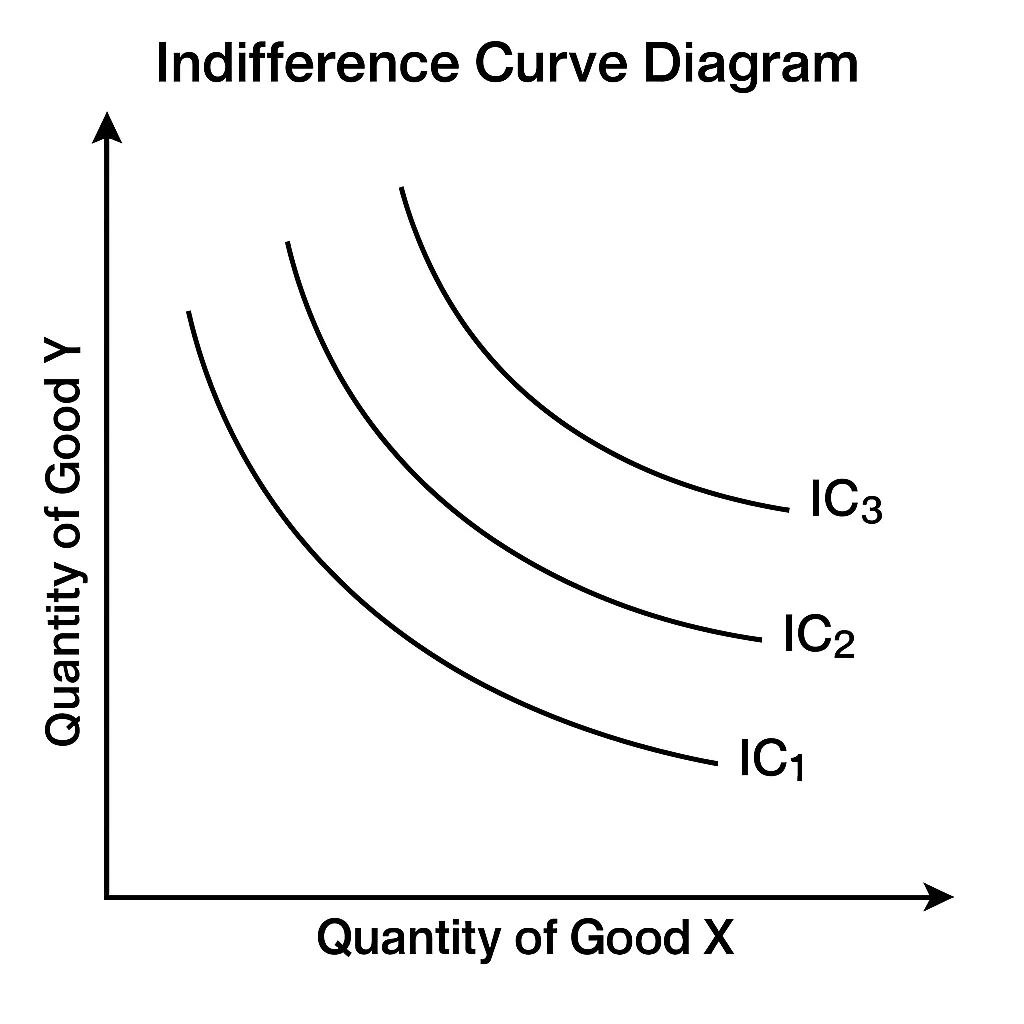
Concept of Price
Price refers to the value of a good or service expressed in terms of money. It is the amount a buyer is willing to pay and a seller is willing to accept in exchange for a commodity.
Price plays a crucial role in regulating demand and supply. High prices usually reduce demand but encourage supply, while low prices increase demand but reduce supply.
Example: The price of petrol directly affects how much consumers buy and how much oil companies supply.
Concept of Cost
Cost is the total expenditure incurred in the production or acquisition of goods and services. It includes all the payments required to bring a commodity to the market.
In economics, cost is not only monetary but also includes sacrifices, efforts, and foregone alternatives.
Types of Cost
Money Cost: The actual monetary expenses incurred by a firm in producing a commodity. Example: raw material cost, wages and salaries, rent for factory, interest on loans, fuel, and transportation costs.
Real Cost: The total efforts, sacrifices, and pain undertaken by factor owners (like labourers, entrepreneurs) to produce goods. Example: the fatigue of workers, or the risk taken by entrepreneurs.
Opportunity Cost: The value of the next best alternative that is sacrificed when a choice is made. Example: If a student spends time studying economics instead of mathematics, the lost opportunity to study mathematics is the opportunity cost.
Explicit Cost: Actual out-of-pocket expenditure incurred by a firm to hire or purchase resources. Example: wages paid to workers, rent for building, interest paid on borrowed capital.
Implicit Cost: The imputed value of self-owned and self-employed resources. Example: if a person uses their own land for farming, the rent they could have earned by leasing it out is the implicit cost.
Economic Cost: The total of explicit and implicit costs. It represents the real sacrifice in ensuring regular supply of resources for production. Formula: Economic Cost = Explicit Cost + Implicit Cost .
Social Cost: The total cost imposed on society due to production. Example: a factory polluting the river causes harm to fishermen and residents, which is borne by society, not just the producer.
Fixed Cost: Costs that do not change with the level of output. These are incurred even when production is zero. Example: rent of factory building, property tax, interest on loans.
Variable Cost: Costs that change directly with the level of output. If production increases, these costs rise; if production falls, they decrease. Example: cost of raw materials, electricity, wages of temporary workers.
Indifference Curve
An indifference curve is a graphical representation of different combinations of two goods that provide the same level of satisfaction or utility to a consumer.
Each point on the curve shows a bundle of two goods between which the consumer is indifferent (they derive equal satisfaction from both).
The curve slopes downward from left to right, showing that if a consumer has less of one good, they must have more of the other to maintain the same level of satisfaction.
Example: A consumer may be equally satisfied with either (2 apples + 3 bananas) or (3 apples + 2 bananas). Both combinations lie on the same indifference curve.
| Type | Description | Example |
|---|---|---|
| Money Cost | Total money expenditure in production | Raw materials, wages, rent |
| Real Cost | Efforts/sacrifices of factor owners | Labour effort, time |
| Opportunity Cost | Value of next best alternative foregone | Choosing factory land over farming |
| Explicit Cost | Actual payment for inputs | Wages, raw material cost |
| Implicit Cost | Imputed cost of own resources | Using own building for business |
| Economic Cost | Explicit + Implicit costs | Total resource payments |
| Social Cost | Cost borne by society | Pollution from factory |
| Fixed Cost | Constant costs irrespective of output | Rent, taxes |
| Variable Cost | Costs varying with production level | Raw material, fuel |
Prelims tips
- Price = value in money terms.
- Opportunity cost = next best alternative forgone.
- Economic Cost = Explicit + Implicit.
- Fixed cost is constant; variable cost changes with output.
- Indifference curve shows equal satisfaction levels.
Mains points
- Price measures the value of goods in money terms.
- Different types of costs help understand firm’s decision-making and production planning.
- Opportunity cost highlights foregone alternatives in resource allocation.
- Explicit and implicit costs distinguish between actual and imputed expenses.
- Indifference curve theory explains consumer choice and demand preferences.
Production Possibility Frontier (PPF) and Opportunity Cost
The Production Possibility Frontier (PPF) is a curve that illustrates the trade-offs facing an economy that produces only two goods. It demonstrates the fundamental economic problem of scarcity, choice, and opportunity cost. Any point on the PPF represents maximum efficiency and full employment of resources.
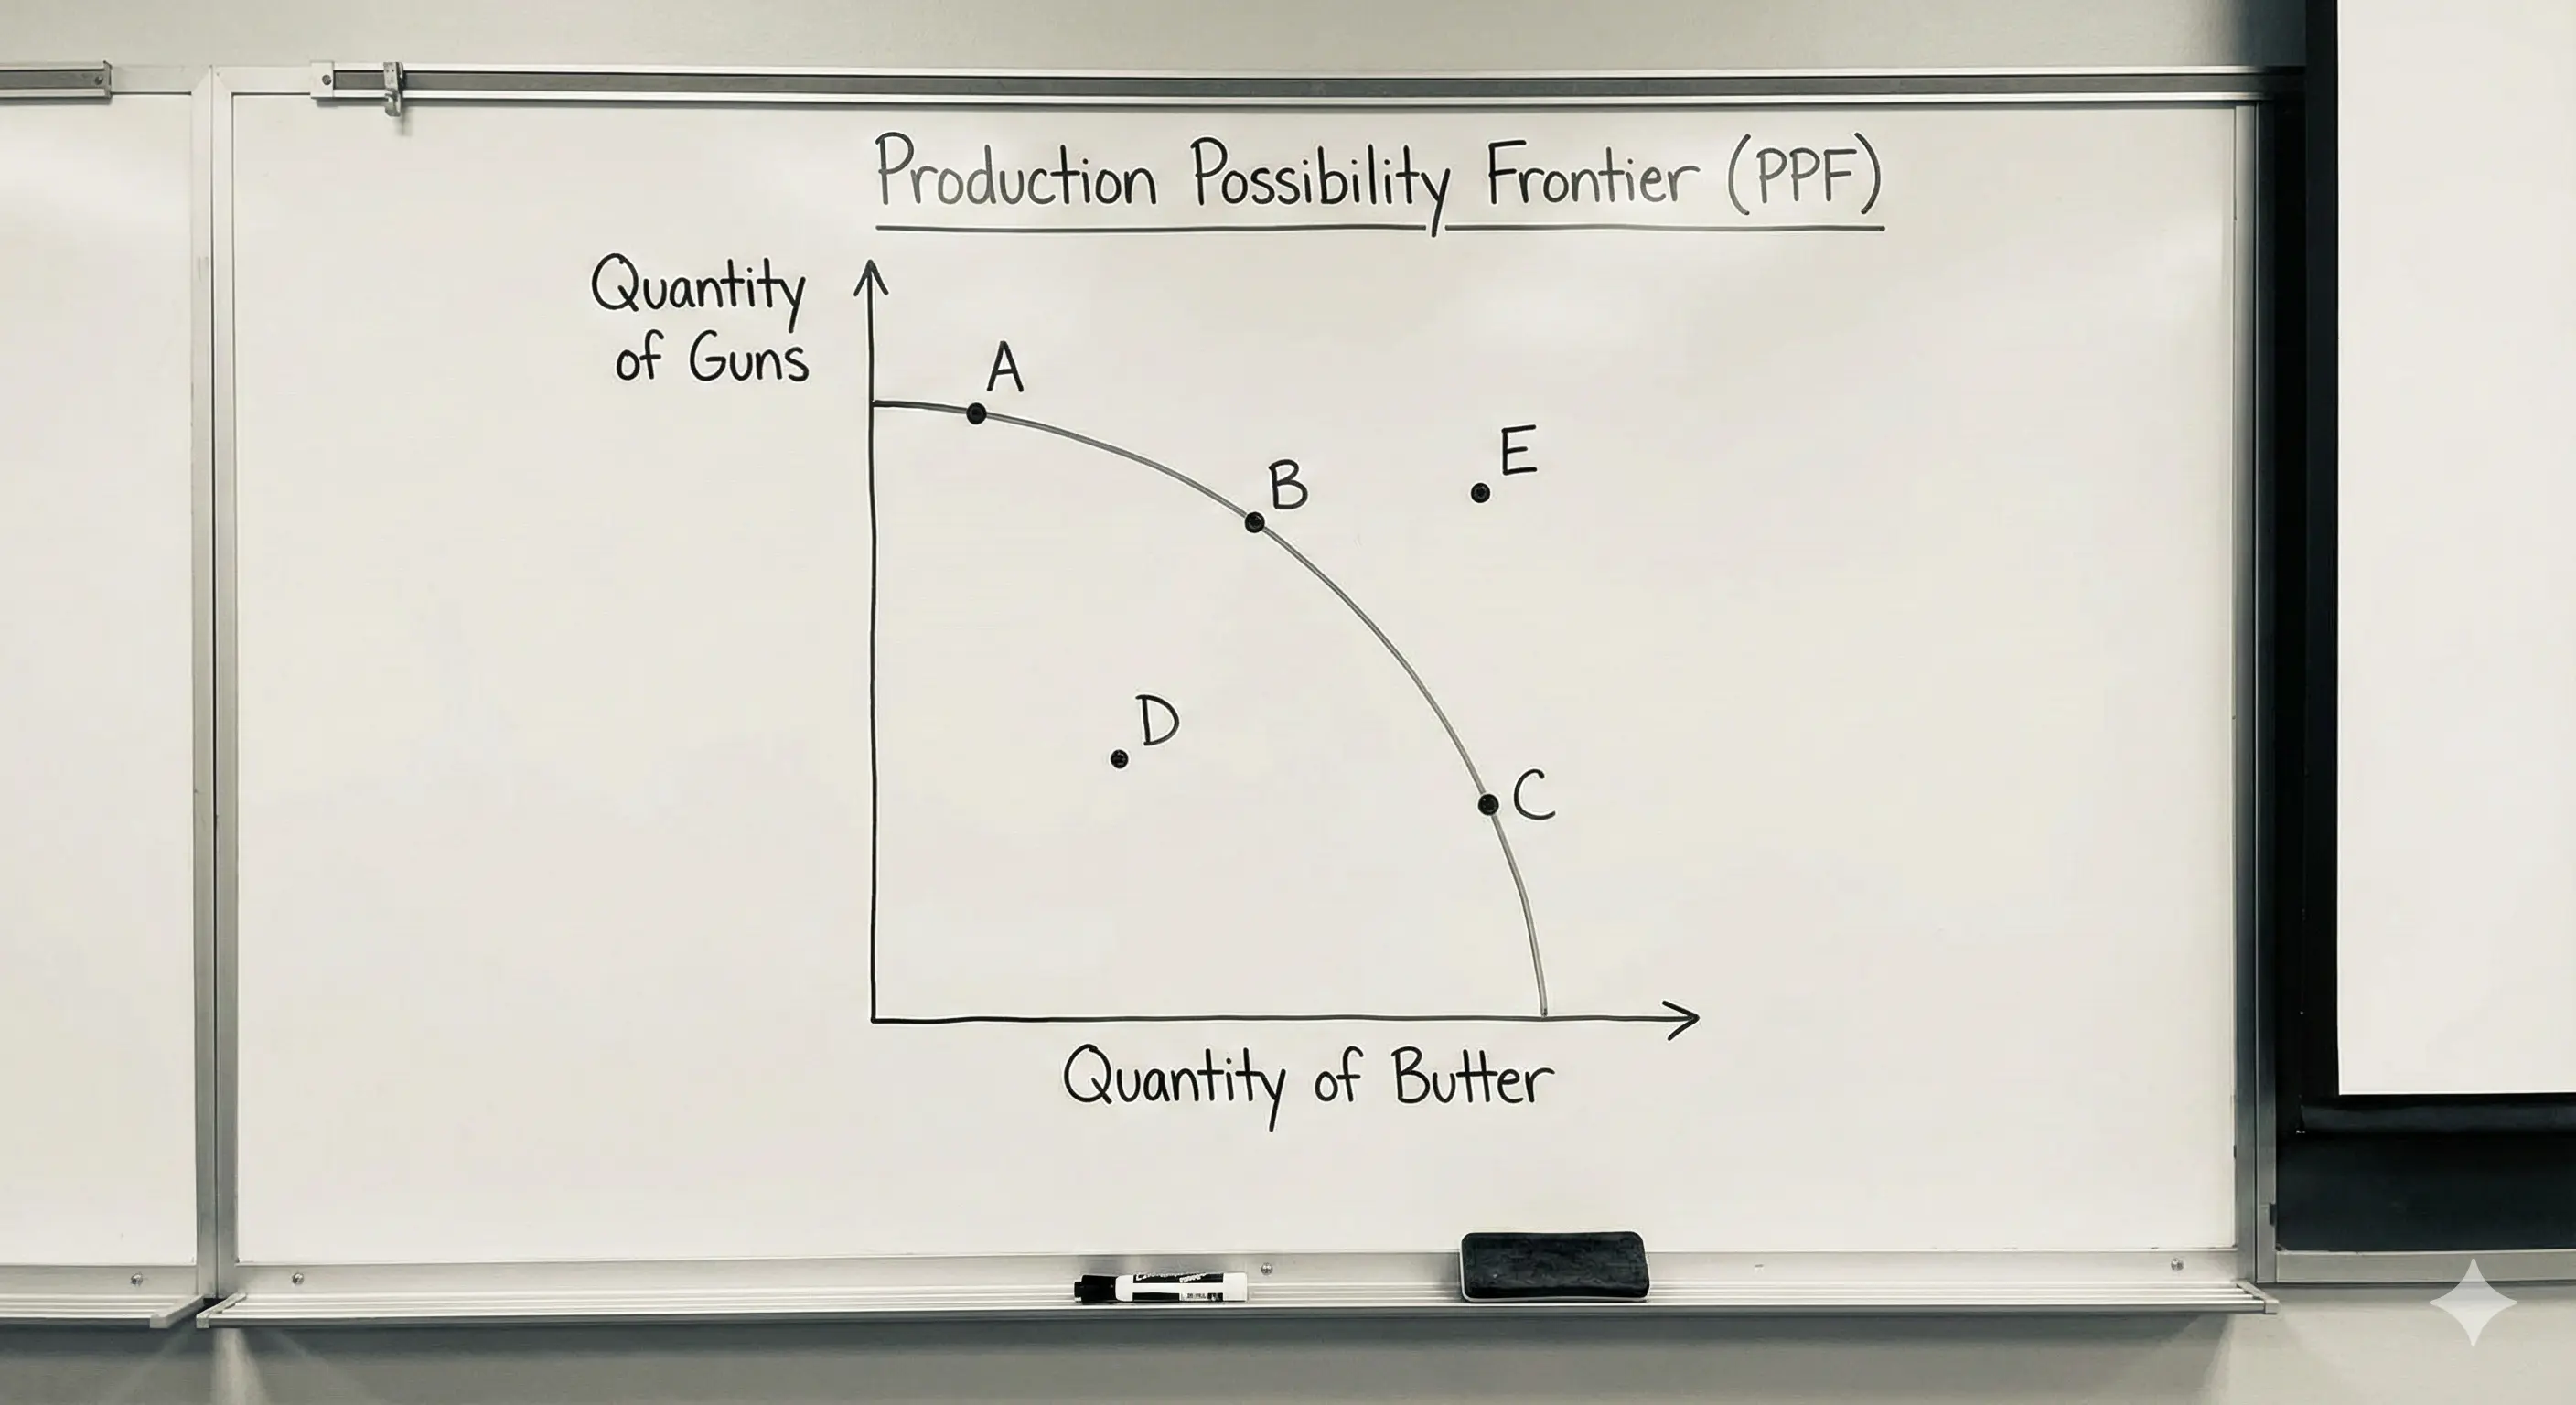
Concept of Production Possibility Frontier (PPF)
Definition: The PPF, also known as the Production Possibility Curve (PPC), shows the maximum amount of a pair of goods or services that can be produced with limited resources and given technology, assuming full employment of resources.
It graphically illustrates the core economic problems: scarcity (the boundary of the curve), choice (selecting a point on the curve), and trade-off (giving up one good for another).
Assumptions of PPF
The economy produces only two goods (e.g., Guns and Butter).
The amount of production resources (land, labour, capital, entrepreneurship) is fixed.
The technology remains constant.
Resources are fully and efficiently utilized.
Points on the PPF Curve
Points on the curve (A, B): Represent attainable combinations where resources are being utilized efficiently (full employment).
Points inside the curve (C): Represent attainable combinations where resources are being utilized inefficiently (underemployment or unemployment).
Points outside the curve (D): Represent unattainable combinations with current resources and technology (beyond the production capacity).
PPF and Opportunity Cost
The downward slope of the PPF demonstrates that in an economy of scarcity, producing more of one good requires reducing the production of another. This sacrifice is the Opportunity Cost .
Marginal Opportunity Cost (MOC): The amount of one good that must be given up to produce one additional unit of another good. It is measured by the slope of the PPF.
Most PPF curves are concave (bowed outwards) because MOC generally increases as more of one good is produced. This is due to the Law of Increasing Opportunity Cost, as resources are not perfectly substitutable.
Shift in PPF
Outward Shift: Indicates Economic Growth or an increase in the economy’s potential. This happens due to an increase in resources (e.g., new land discovery, population growth) or technological advancement.
Inward Shift: Indicates a decline in the economy’s potential, usually due to a decrease in resources (e.g., war, natural disaster) or technological regression.
| Location on Graph | Interpretation | Economic State |
|---|---|---|
| On the PPF curve | Efficient utilization of resources | Full employment |
| Inside the PPF curve | Inefficient utilization of resources | Unemployment/Underemployment |
| Outside the PPF curve | Unattainable combination | Beyond current potential |
Prelims tips
- PPF shows scarcity, choice, and opportunity cost.
- Points on PPF = Efficient/Full Employment.
- Concave PPF is due to increasing Marginal Opportunity Cost (MOC).
- Outward shift of PPF = Economic Growth (due to T-advancement or resource increase).
Mains points
- PPF is a simple model to explain the fundamental problem of choice under scarcity.
- The slope of the PPF measures the opportunity cost of producing one more unit of a good.
- It shows the trade-off between goods like 'Guns and Butter' (defence vs. welfare goods).
- PPF shifts are crucial to analyzing economic growth potential.
- Points inside the PPF highlight issues of unemployment and inefficient resource use.
Economic Systems
Economic system refers to the way individuals and institutions are linked to perform economic activities. The three main types are: Capitalist (private ownership and freedom), Socialist (public ownership and central planning), and Mixed (coexistence of private and public sectors).
Capitalist Economy
Private Ownership of Property: In a capitalist economy, resources such as land, factories, machines, and mines are owned by private individuals or companies. This encourages innovation and efficiency since owners aim to maximize profits.
Freedom of Choice and Enterprise: People are free to choose any occupation, trade, or business. Producers decide what to produce, how much to produce, and at what price to sell.
Profit Motive: Profit is the main driving force behind all economic activities. Producers focus on making goods and services that generate maximum returns.
Free Competition: Many buyers and sellers participate in the market. The government generally does not interfere, allowing prices to be determined by demand and supply.
Example: The United States is often considered a capitalist economy where private businesses dominate industries like technology, automobiles, and retail.
Socialist Economy
Public Ownership of Property: All factors of production (land, factories, natural resources) are owned by the state or community as a whole. This ensures that resources are used for social welfare, not private profit.
Central Planning: A central authority (like a planning commission) makes all major economic decisions, including what to produce, how much to produce, and how resources should be distributed.
Maximum Social Benefit: The goal is to ensure equitable development of society. Investments are planned so that everyone benefits rather than just a few individuals.
Equality of Opportunity: Free health, education, and training are provided by the state to ensure equal chances for all citizens.
Classless Society: There is no division between rich and poor, as economic resources are shared equally.
Example: The former Soviet Union and present-day Cuba are examples of socialist economies.
Mixed Economy
Ownership by Public and Private: In a mixed economy, resources and means of production are owned by both the government and private individuals. This allows the benefits of both systems.
Coexistence of Public & Private Sectors: The private sector runs businesses for profit, while the public sector focuses on welfare-oriented services like healthcare, education, and infrastructure.
Economic Planning: The central authority prepares plans and policies to guide overall economic development, but private businesses also play a big role in production.
Freedom with Control: Individuals and firms enjoy freedom to produce and trade, but government regulations ensure that activities are in the interest of society.
Example: India is a mixed economy where both private enterprises (like Reliance, Tata) and public enterprises (like Indian Railways, ONGC) operate together.
| Aspect | Capitalist Economy | Socialist Economy | Mixed Economy |
|---|---|---|---|
| Ownership of Property | Private ownership | Public ownership | Both public and private ownership |
| Decision Making | Decentralized, market-driven | Central authority plans | Combination of planning and market |
| Motive | Profit | Social welfare | Profit + Social welfare |
| Competition | Free competition | No competition (state monopoly) | Controlled competition |
| Equality | High inequality | Greater equality | Moderate equality |
Prelims tips
- Capitalism = private ownership + profit motive.
- Socialism = public ownership + central planning.
- Mixed economy = coexistence of public and private sectors.
- India follows a mixed economy model.
- Socialism aims at equality and classless society.
Mains points
- Economic system defines how resources are owned, allocated, and managed.
- Capitalism promotes innovation and competition but increases inequality.
- Socialism ensures welfare and equality but may reduce efficiency.
- Mixed economy balances profit motive with social justice.
- India’s economy is a practical example of a mixed system.
Positive vs. Normative Economics & Economic Models
Economic analysis is divided into positive economics (what is, factual statements) and normative economics (what ought to be, value judgments). Economic models are theoretical constructions designed to explain and predict economic phenomena using simplified assumptions.
Positive Economics
Focus: It deals with 'what is' or 'what was'. It describes, explains, and predicts economic phenomena based on facts and evidence.
It is based on objective statements that can be tested, proved, or disproved against verifiable data.
It makes no value judgments. Economists act as scientists to establish cause-and-effect relationships.
Example: “An increase in the interest rate will reduce inflation.” (This can be empirically tested.)
Normative Economics
Focus: It deals with 'what ought to be' or 'what should be'. It involves value judgments, opinions, and ethical considerations to determine the desirability of economic outcomes.
It makes subjective statements that cannot be proved or disproved by facts alone. It reflects policy goals.
It is prescriptive. Economists act as policy advisors suggesting how the economy should operate.
Example: “The government should raise the minimum wage to improve living standards.” (This is a matter of opinion/policy, not purely fact.)
Economic Models
Definition: An economic model is a theoretical construct or framework that represents a complex economic process by a set of variables and logical or quantitative relationships between them.
They are built on simplified assumptions (like 'ceteris paribus'—all other things being equal) to abstract from irrelevant details and focus on essential relationships.
The goal of a model is to predict and explain economic trends and guide policy-making.
Example: Circular Flow Model (shows how money, goods, and services flow through the economy between households and firms), PPF Model (shows opportunity cost and scarcity).
| Basis | Positive Economics | Normative Economics |
|---|---|---|
| Nature | Factual, objective (What is?) | Opinion-based, subjective (What ought to be?) |
| Verification | Can be verified with data | Cannot be verified with data |
| Role of Economist | Scientist (explains cause and effect) | Policy Advisor (gives prescriptions) |
| Example | High taxes reduce consumption. | Taxes should be reduced. |
Prelims tips
- Positive = What is? (Fact-based).
- Normative = What ought to be? (Opinion/Policy-based).
- Economic Models use simplifying assumptions (ceteris paribus).
- PPF is an example of an economic model.
Mains points
- The distinction between positive and normative economics is crucial for separating facts from policy goals.
- Good policy-making requires a solid base of positive analysis before applying normative judgments.
- Economic models simplify reality to isolate key variables for better understanding and prediction.
- Models are tools for analysis and policy design, not perfect replicas of the real world.
Sectors in an Economy
An economy is divided into sectors based on the nature of activities: Primary (extraction), Secondary (manufacturing), Tertiary (services), Quaternary (knowledge), and Quinary (decision-making).
Primary Sector
The primary sector involves the extraction, harvesting, and use of natural resources directly from the earth. It is also known as the agricultural and allied sector.
Activities in this sector are the foundation of all other sectors since raw materials come from here.
Examples: Agriculture (growing crops like rice and wheat), dairy farming (milk production), fishing (catching fish from rivers and seas), forestry (wood, bamboo collection), and mining (coal, iron ore).
Secondary / Manufacturing Sector
This sector involves transforming natural products into finished or semi-finished goods through industrial processes.
It is also known as the industrial sector , and it adds value to raw materials.
Examples: Manufacturing cars using aluminium and steel, construction of houses, production of cement, textile industry converting cotton into clothes, food processing like making bread from wheat.
Tertiary Sector
Also called the service sector , this sector provides intangible goods and services that support consumers and businesses.
It does not produce physical goods but facilitates production and consumption by offering essential services.
Examples: Retail trade (shops, supermarkets), entertainment (movies, sports), transport (railways, airlines), tourism, healthcare, IT services, financial services (banks, insurance, stock exchanges).
Quaternary / Knowledge Sector
This sector focuses on intellectual activities , research, innovation, and knowledge-driven services.
It contributes to economic growth through advanced technology, expertise, and decision-support systems.
Examples: Research and development (R&D) in pharmaceuticals, IT consulting, data analysis, education (schools, universities), scientific innovation, knowledge economy based on skills and information.
Quinary Sector
This sector is concerned with high-level decision-making , leadership, and policy-making in society and economy.
It includes top executives, government leaders, and people involved in making important policies that influence all sectors.
Examples: Government creating legislation, Prime Ministers or Presidents taking economic decisions, CEOs and top management in multinational companies, think-tank leaders and policy advisors.
| Sector | Description | Examples |
|---|---|---|
| Primary | Extraction and harvesting of natural resources | Agriculture, fishing, forestry |
| Secondary | Transformation of raw materials into goods | Car manufacturing, construction |
| Tertiary | Service provision (intangible) | Retail, entertainment, finance |
| Quaternary | Knowledge-based activities | Education, R&D, consulting |
| Quinary | Decision-making at top level | Government, corporate executives |
Prelims tips
- Primary = extraction, Secondary = manufacturing, Tertiary = services.
- Quaternary = knowledge sector (R&D, education).
- Quinary = top-level decision-making (government, executives).
- India’s largest employment : Primary sector; largest GDP contributor : Tertiary sector.
Mains points
- Sectors classification shows how economies evolve from agriculture to services.
- Primary sector forms the base but contributes less to GDP in developed economies.
- Secondary sector boosts industrialization and employment.
- Tertiary sector drives modern economies through services and trade.
- Quaternary and Quinary sectors represent advanced economies based on knowledge and governance.
Classification of Economics: Microeconomics and Macroeconomics
Economics is classified into Microeconomics (study of individuals and firms) and Macroeconomics (study of the economy as a whole). Micro focuses on demand-supply, pricing, and efficiency at small scale, while Macro addresses national income, employment, inflation, growth, and stability.
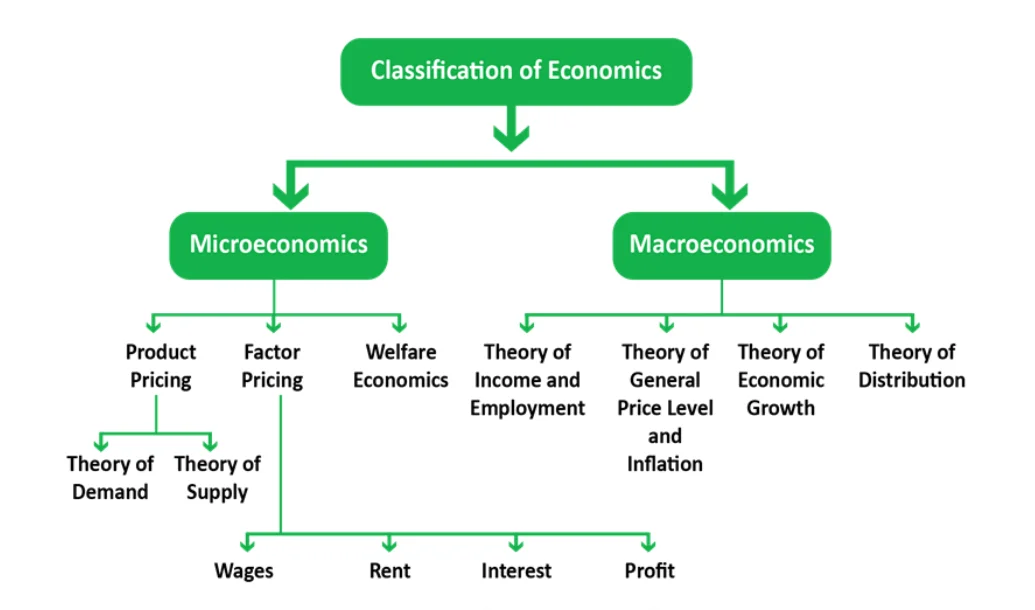
Microeconomics
Focus: Studies the economic behavior of individual units such as households, firms, or a single market. It looks at the small picture of the economy.
Concerned with how scarce resources are allocated among competing uses at a micro level.
Main Areas of Study:
Theory of Demand & Supply: How consumer choices affect demand, elasticity of demand, and equilibrium prices.
Theory of Production & Costs: How producers decide the optimal quantity of output; includes the Production Laws, Law of Variable Proportions and Returns to Scale.
Factor Pricing: Determination of wages (labour), rent (land), interest (capital), and profit (entrepreneurship).
Market Structures: Analysis of how prices and output are decided in different markets – perfect competition, monopoly, monopolistic competition, and oligopoly.
Welfare Economics: Examines efficiency in the allocation of resources and how to maximize social welfare.
Example: How the price of petrol fluctuates when demand increases or decreases, or when supply is disrupted by global events.
Macroeconomics
Focus: Studies the economy as a whole by analyzing aggregates rather than individual units.
Deals with broad measures such as national income, overall output, employment, savings, and investments.
Main Areas of Study:
National Income Accounting: Measurement of economic performance using GDP, GNP, NNP, and NDP.
Theory of Income, Output & Employment: Includes Keynesian consumption and investment functions.
Monetary Theory: Studies money supply, interest rates, inflation, deflation, stagflation, and reflation.
Fiscal Policy: Use of taxation and government expenditure to regulate the economy.
Theory of Economic Growth & Development: Models like Harrod-Domar and Solow to explain long-run growth (Growth vs Development).
Balance of Payments & International Trade: Studies imports, exports, foreign exchange reserves, and trade imbalances.
Example: India’s GDP growth rate in a financial year, the Consumer Price Index (CPI) measuring inflation, or unemployment rates.
Interdependence of Micro & Macro
Micro decisions (like consumer demand or a firm’s production) collectively impact macroeconomic variables such as GDP, inflation, and employment.
Macroeconomic policies (such as tax cuts, interest rate changes, or subsidies) influence microeconomic choices of households and firms.
Together, both fields are essential for understanding the complete picture of an economy, as one cannot function effectively without the other.
| Basis | Microeconomics | Macroeconomics |
|---|---|---|
| Domain | Individual units: households, firms, markets | Economy as a whole: aggregates |
| Concerned with | Demand, supply, factor pricing, production, consumption | National income, employment, inflation, growth |
| Approach | Bottom-up (individual decisions form whole) | Top-down (policies impacting entire system) |
| Market Structures | Perfect competition, monopoly, oligopoly | General equilibrium, aggregate demand & supply |
| Applications | Price determination, cost optimization, wage setting | Policy-making, inflation control, unemployment reduction |
| Significance | Known as price theory; micro efficiency | Stability, growth and macro equilibrium |
Prelims tips
- Microeconomics = Price theory, unit level analysis.
- Macroeconomics = Income & employment theory, aggregate level analysis.
- Elasticity of demand = Micro concept; Inflation = Macro concept.
- Key economists: Alfred Marshall (Micro), Keynes (Macro).
Mains points
- Microeconomics helps understand consumer and producer decisions.
- Macroeconomics is essential for policy design to stabilize and grow the economy.
- Micro provides efficiency and pricing mechanisms; Macro ensures stability and full employment.
- Both are interdependent: micro forms the base, macro provides the structure.
- Modern economics integrates micro and macro approaches (e.g., microfoundations of macroeconomics).
Theory of Demand and Consumer Behaviour
Demand is the quantity of a commodity a consumer is willing and able to buy at various prices. The Law of Demand states that price and quantity demanded are inversely related (ceteris paribus). Consumer behaviour studies how individuals make choices to maximize utility given their budget constraints.
Concept of Demand
Demand is not just a desire but a desire backed by the ability to pay and the willingness to spend .
Demand is always expressed with reference to a specific price and time period (e.g., demand for X commodity at ₹10 per unit in January).
Individual Demand: Demand by a single consumer for a commodity.
Market Demand: Total demand by all consumers for a commodity in the market.
Law of Demand
The Law of Demand states that, other things remaining constant (ceteris paribus), the quantity demanded of a commodity increases when its price falls, and decreases when its price rises.
It shows an inverse relationship between the price of a commodity and the quantity demanded, leading to a downward sloping demand curve.
Reasons for Downward Sloping Demand Curve:
Law of Diminishing Marginal Utility: As a consumer consumes more units, the marginal utility (satisfaction from an additional unit) decreases, so they will only buy more if the price falls.
Income Effect: A fall in price increases the real income or purchasing power of the consumer, enabling them to buy more.
Substitution Effect: When the price of a good falls, it becomes relatively cheaper compared to its substitutes, leading consumers to buy more of it.
Elasticity of Demand
Elasticity of Demand measures the degree of responsiveness of the quantity demanded to a change in price, income, or the price of related goods.
This topic is detailed further in the next object on Elasticity.
Consumer Behaviour (Utility Analysis)
The theory of consumer behaviour explains how a rational consumer maximizes their satisfaction (utility) from the purchase of various goods and services, given their limited income and market prices.
Consumer Equilibrium:
A consumer achieves equilibrium when they allocate their limited income in such a way that the total satisfaction (utility) from the goods purchased is maximum.
Law of Equi-Marginal Utility: A consumer gets maximum satisfaction when the ratio of the marginal utility of a commodity to its price is equal for all commodities consumed. (MU_A/P_A = MU_B/P_B)
| Concept | Cause | Result |
|---|---|---|
| Movement along the Demand Curve (Expansion/Contraction of Demand) | Change in the own price of the commodity. | Changes the quantity demanded (point moves along the same curve). |
| Shift of the Demand Curve (Increase/Decrease in Demand) | Change in non-price factors (income, taste, price of related goods). | Changes the demand curve entirely (curve shifts right or left). |
Prelims tips
- Law of Demand : Inverse relation between Price and Quantity Demanded.
- Demand curve slopes downwards .
- Movement along the curve is due to Price; Shift is due to Non-Price factors.
- Consumer equilibrium relies on Equi-Marginal Utility .
Mains points
- Demand theory is the foundation of Microeconomics and market analysis.
- The Law of Demand is crucial for understanding market dynamics and pricing strategies.
- Exceptions to the Law (Giffen goods, Veblen goods) are important for advanced analysis.
- Consumer behaviour theories explain the rationality and constraints behind individual purchasing decisions.
- Understanding the difference between movement and shift is key for policy analysis.
Elasticity (Price, Income, Cross)
Elasticity measures the sensitivity of quantity demanded or supplied to changes in price, income, or other related factors. It is a critical tool for firms in setting prices and for governments in setting tax policies.
Concept of Elasticity
Elasticity measures the quantitative relationship between the percentage change in one variable and the percentage change in another. It indicates how much a change in price, income, or the price of a substitute will affect the demand for a product.
1. Price Elasticity of Demand (E_d)
It measures the responsiveness of quantity demanded to a change in the price of the commodity.
Formula: E_d = (% Change in Quantity Demanded) / (% Change in Price)
Policy Significance: Governments levy taxes on goods with Inelastic Demand (E < 1, e.g., salt, essential medicines, fuel) because demand won't fall much, guaranteeing revenue. Taxes on goods with Elastic Demand (E > 1, e.g., luxury cars, non-essential items) result in significant fall in demand, defeating revenue goals but effective for controlling consumption.
2. Income Elasticity of Demand (E_y)
It measures how quantity demanded changes in response to a change in consumer income.
Classification:
Positive E (E_y > 0): Normal Goods (demand increases as income increases). E.g., clothing, food.
Negative E (E_y < 0): Inferior Goods (demand decreases as income increases). E.g., cheap grains, second-hand clothing.
Zero E (E_y = 0): Necessities (demand remains constant regardless of income change). E.g., essential medicines, salt.
3. Cross Elasticity of Demand (E_{xy})
It measures how the quantity demanded of a good (X) changes in response to a change in the price of another related good (Y).
Classification:
Positive E (E_{xy} > 0): Substitutes (If the price of Y rises, the demand for X rises). E.g., Tea and Coffee.
Negative E (E_{xy} < 0): Complements (If the price of Y rises, the demand for X falls). E.g., Car and Petrol.
Zero E (E_{xy} = 0): Unrelated Goods (no change in demand for X). E.g., Tea and Furniture.
| Type | Elasticity Value | Responsiveness |
|---|---|---|
| Perfectly Elastic | E_d = infty | Infinite change in quantity demanded for a negligible price change. |
| Elastic | E_d > 1 | Quantity demanded changes proportionally more than price. |
| Unitary Elastic | E_d = 1 | Quantity demanded changes exactly proportionally to price. |
| Inelastic | E_d < 1 | Quantity demanded changes proportionally less than price. |
| Perfectly Inelastic | E_d = 0 | Quantity demanded does not change at all with price change. |
Prelims tips
- Inelastic demand (E_d < 1) : Essential goods (e.g., fuel, salt).
- Elastic demand (E_d > 1) : Luxury or highly substitutable goods.
- Income Elasticity (E_y) is negative for Inferior Goods.
- Cross Elasticity (E_{xy}) is positive for Substitutes (Tea/Coffee) and negative for Complements (Car/Petrol).
Mains points
- Elasticity is a critical concept for price setting by monopolies and oligopolies.
- The government uses elasticity estimates to predict the impact of indirect taxes and subsidies.
- Income elasticity helps in classifying goods (normal vs inferior) and predicting consumption patterns during economic booms/recessions.
- Cross elasticity defines the nature of the relationship between products in a market (competition vs cooperation).
New Branches in Economics and Market
Economics has expanded into new branches like International, Environmental, Developmental, and Health Economics. Market refers to the system of exchange between buyers and sellers, classified on the basis of area and time.
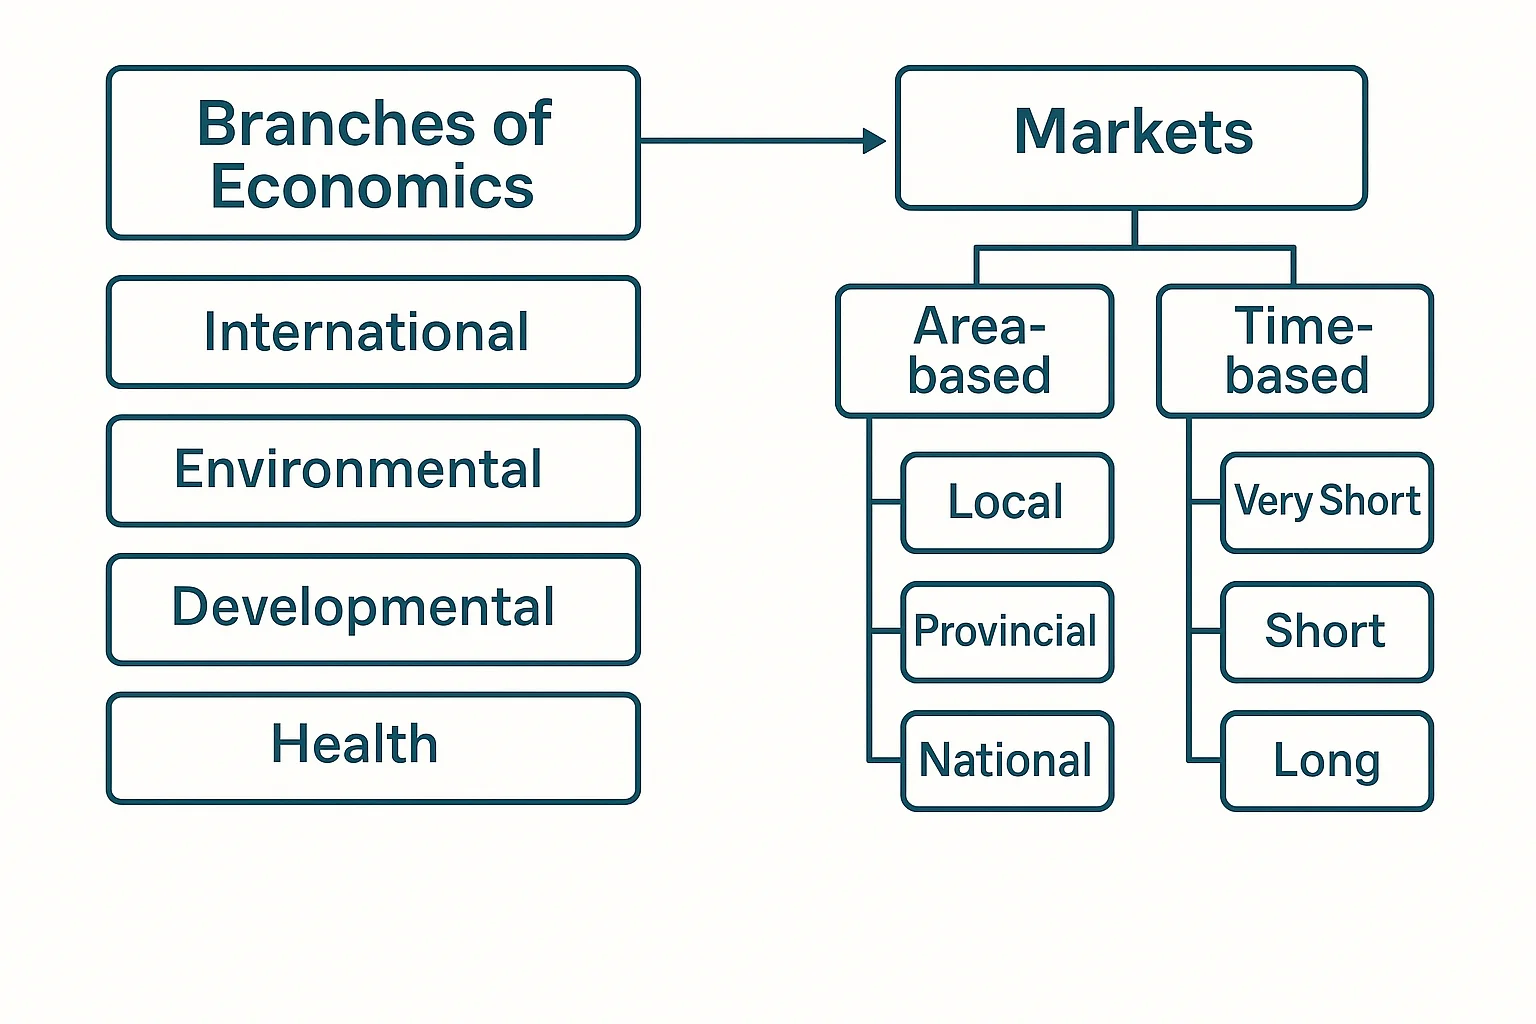
New Branches in Economics
International Economics: Studies interactions between nations, trade policies, exchange rates, balance of payments, globalization impact.
Environmental Economics: Analyses ecological and environmental challenges, using economic tools to solve problems like climate change, pollution, sustainability.
Developmental Economics: Focuses on improving economic and social conditions of developing nations, poverty eradication, inequality reduction, human development .
Health Economics: Deals with healthcare systems, preventive & curative measures, drug pricing, rural health programs, efficiency in health services.
Market
Market = system of exchange between buyers and sellers of goods/services.
Features of Market
Existence of buyers and sellers.
Availability of commodity/service.
Price acceptable to both sides.
Direct or indirect exchange possible.
Types of Market (on the basis of Area)
Local Market: Transactions within the place of production (e.g., fruits, vegetables).
Provincial Market: Restricted to a region or province (e.g., regional newspapers).
National Market: Operates across the country (e.g., tea, cement, coffee).
International Market: Operates globally (e.g., petroleum, gold).
Types of Market (on the basis of Time)
Very Short Period Market: Supply cannot be adjusted quickly (e.g., perishable goods).
Short Period Market: Supply can be moderately adjusted.
Long Period Market: Supply can be fully adjusted with change in production capacity.
| Branch | Focus | Examples |
|---|---|---|
| International Economics | Trade & interactions among nations | Trade policy, exchange rates, globalization |
| Environmental Economics | Ecology & sustainability | Pollution control, climate change policies |
| Developmental Economics | Improvement in underdeveloped economies | Poverty alleviation, HDI improvement |
| Health Economics | Healthcare systems & efficiency | Drug price control, public health schemes |
| Basis | Type | Key Feature |
|---|---|---|
| Area | Local | Transactions in production locality (e.g., perishables) |
| Area | National | Operates across the country (e.g., Cement) |
| Area | International | Operates globally (e.g., Gold, Oil) |
| Time | Very Short Period | Supply is Fixed (Perishable goods) |
| Time | Long Period | Supply is Fully Adjustable (Production capacity can change) |
Prelims tips
- International Economics studies trade & exchange rates.
- Environmental Economics = climate change + pollution solutions.
- Market = system of exchange between buyers & sellers.
- Developmental Economics is key to understanding Growth vs Development debate.
- Time-based market classification relates to the flexibility of Supply .
Mains points
- New branches show interdisciplinary nature of economics (health, environment, global trade).
- Markets are vital for allocation of resources and price discovery.
- Time-based market classification helps analyze supply responsiveness.
- Globalization has increased the importance of international markets.
- Environmental economics has gained importance due to sustainability challenges.
Classification of Markets: Quantity and Competition
Markets are classified based on the quantity of goods sold (wholesale and retail) and the type of competition (perfect and imperfect). Imperfect competition further includes monopoly, monopolistic competition, oligopoly, and monopsony. Each structure has unique features that determine pricing, efficiency, and consumer welfare.
On the Basis of Quantity
Wholesale Market: Goods are bought and sold in bulk quantities . Producers generally sell to retailers, not directly to consumers. This ensures large-scale distribution. Example: Grain mandis, wholesale cloth markets.
Retail Market: Commodities are sold in small quantities directly to the end consumers for personal use. Retailers usually buy from wholesalers. Example: Grocery shops, malls, supermarkets.
On the Basis of Competition
Perfect Competition
A market with a large number of buyers and sellers dealing in homogeneous products . No single entity can influence the price (all are 'price takers'). Prices are determined purely by demand and supply. There is complete freedom of entry and exit for firms, and perfect market knowledge.
Example: Agricultural produce markets where many farmers sell the same crop at the same price.
Imperfect Competition
More common in the real world, sellers deal in heterogeneous (differentiated) products and have some control over prices ('price makers').
Monopoly
Only one seller or producer of a product with no close substitutes. The monopolist has complete control over price and supply. Entry is strictly restricted due to barriers (legal, technical). Example: Railways in India (government monopoly).
Monopolistic Competition
Many sellers competing, but each sells a slightly differentiated product (branding/advertising is key). Since products are not identical, firms can set their own prices. Entry and exit are free. Example: Fast food industry (McDonald's vs KFC) or clothing brands.
Oligopoly
A market dominated by a few large firms . Firms are highly interdependent; one firm's action (like a price cut) directly affects rivals. This often leads to price rigidity or the formation of cartels to fix prices. Example: Automobile industry, telecom industry.
Monopsony
A market with only one buyer but many sellers. The single buyer has complete control over the price and terms of purchase, often seen in specific labour markets or defense procurement.
| Type | Number of Sellers | Product Nature | Price Control |
|---|---|---|---|
| Perfect Competition | Very Large | Homogeneous (Identical) | None (Price Taker) |
| Monopoly | One | Unique, No Close Substitutes | High (Price Maker) |
| Monopolistic Competition | Many | Differentiated | Some |
| Oligopoly | Few | Homogeneous or Differentiated | Interdependent |
| Monopsony | Many (Sellers), One (Buyer) | N/A | Buyer controls price |
Prelims tips
- Perfect competition = Price Takers, Homogeneous Product.
- Monopoly = Single Seller, High Barriers.
- Monopolistic competition = Differentiated products, Branding.
- Oligopoly = Few Firms, Interdependence, Cartels.
- Monopsony = Single Buyer dominates market.
Mains points
- Market structures determine the level of efficiency, consumer surplus, and resource allocation in an economy.
- Monopolies can lead to higher prices and lower output but sometimes encourage innovation (natural monopoly).
- Oligopoly behavior (collusion vs non-collusion) is central to competition policy and regulation.
- Government intervention (via price control, anti-trust laws) is often needed to correct the failures of imperfectly competitive markets.
- Product differentiation is a key characteristic of real-world retail markets (monopolistic competition).
Supply, Law of Supply and Market Equilibrium
Supply refers to the quantity a seller is willing and able to offer at a given price. The Law of Supply shows a direct relationship between price and quantity supplied. Market Equilibrium is the state where quantity demanded equals quantity supplied, leading to a stable price.
Supply and Law of Supply
Supply is the quantity of a product that a seller is both willing and able to offer in the market at a specific price and within a given period of time.
It reflects the producer’s profit motive: higher prices mean higher potential profit, encouraging higher production.
Law of Supply: Keeping all other factors constant (ceteris paribus), when the price of a good rises, the quantity supplied also rises; and when the price falls, the quantity supplied also decreases.
This shows a direct relationship between price and quantity supplied, resulting in an upward sloping supply curve .
Determinants of Supply (Factors causing a Shift in Supply Curve):
Price of Factors of Production (e.g., raw materials, wages).
Technology (Better technology increases supply).
Government Policies (Taxes reduce supply, Subsidies increase supply).
Price of Related Goods.
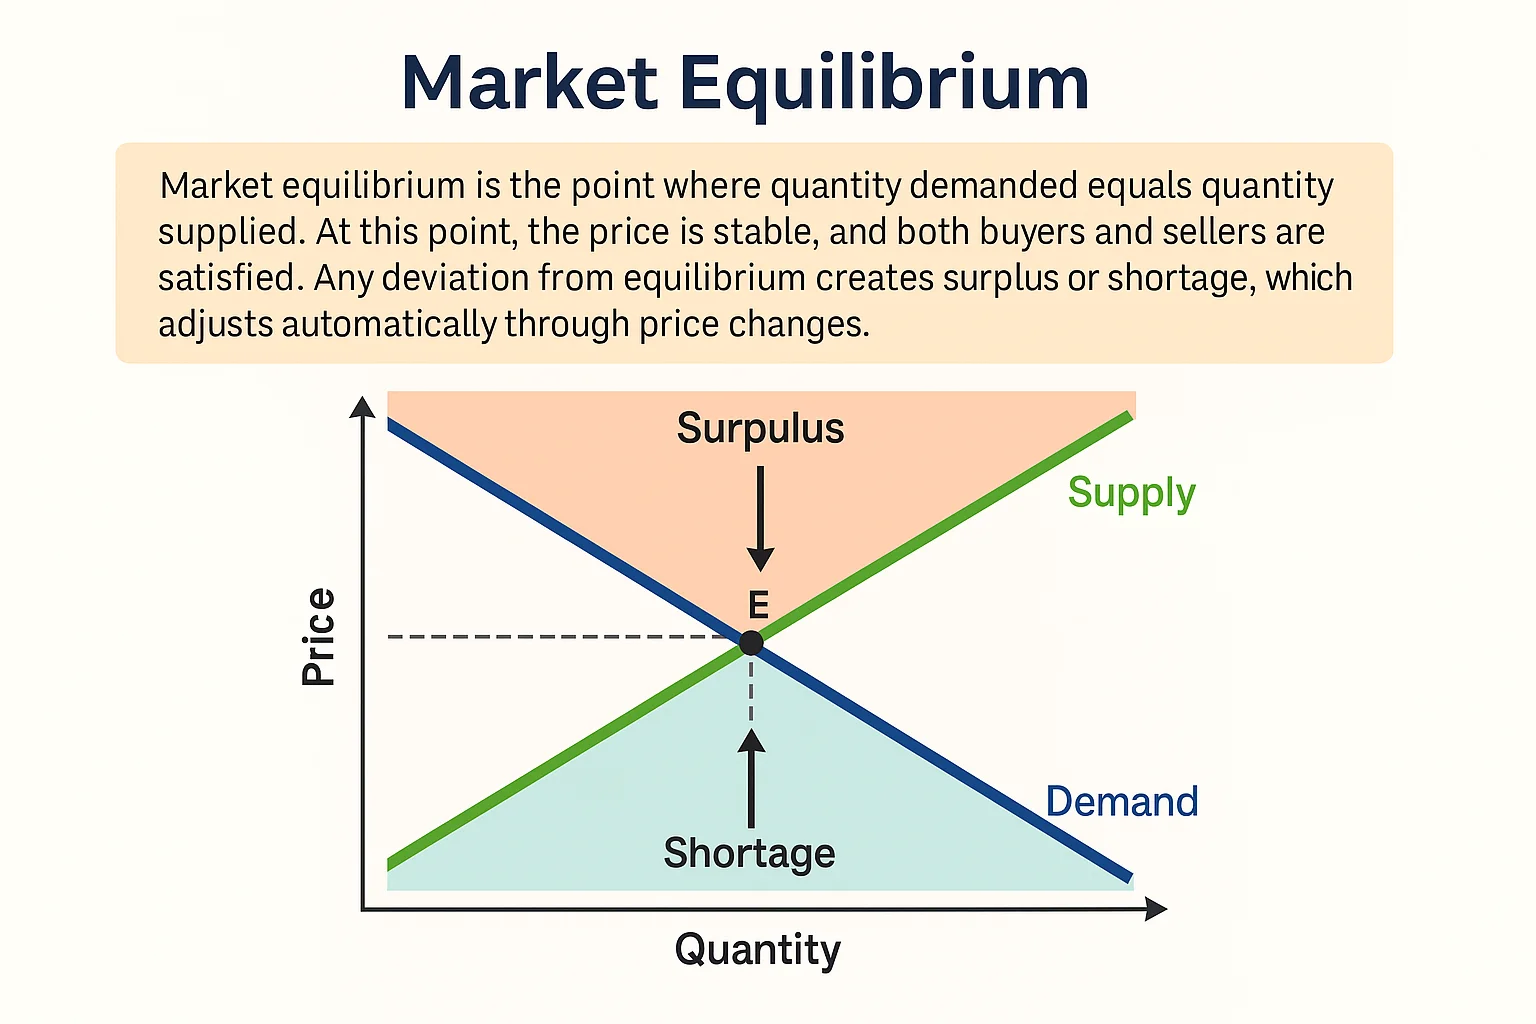
Market Equilibrium
Market Equilibrium is a situation where opposing market forces (Demand and Supply) balance each other. It occurs when: Quantity Demanded = Quantity Supplied .
Equilibrium Price: The price at which demand and supply curves intersect. It is the 'market-clearing price' as there is no surplus or shortage.
Equilibrium Quantity: The amount of goods/services bought and sold at the equilibrium price.
Market Adjustment (Restoring Equilibrium)
If price is above Equilibrium (Surplus): Supply > Demand (Excess Supply). Sellers lower prices to clear unsold stock. Lower prices increase demand and reduce supply until equilibrium is restored.
If price is below Equilibrium (Shortage): Demand > Supply (Excess Demand). Buyers compete and bid prices up. Higher prices encourage producers to increase supply, reducing shortage until equilibrium is reached.
The price mechanism acts as the automatic regulator, pushing the market back to equilibrium.
| Situation | Condition | Effect on Price | Adjustment |
|---|---|---|---|
| Equilibrium | Demand = Supply | Stable | No adjustment needed |
| Surplus (Excess Supply) | Supply > Demand | Falls | Price ↓ → Demand ↑ Supply ↓ |
| Shortage (Excess Demand) | Demand > Supply | Rises | Price ↑ → Demand ↓ Supply ↑ |
Prelims tips
- Law of Supply = Direct relation (Price ↑, Supply ↑).
- Supply curve slopes upwards .
- Equilibrium occurs when Demand = Supply.
- Surplus (S > D) forces price down ; Shortage (D > S) forces price up .
- Determinants of Supply (e.g., Technology, Taxes) cause the curve to shift.
Mains points
- The interaction of supply and demand is fundamental to determining prices and resource allocation in competitive markets.
- Market equilibrium ensures stability by aligning buyer and seller plans, maximizing social welfare.
- Understanding the effects of shifts in either demand or supply is critical for predicting market outcomes (e.g., impact of climate change on food prices).
- Government intervention (like price floors or ceilings) often creates artificial surplus or shortage, hindering the natural equilibrium mechanism.
Laws of Production and Factor Returns
Production is the process of creating utility by transforming inputs (factors of production: Land, Labour, Capital, Enterprise) into outputs. Production laws describe the relationship between input changes and corresponding output changes in the short run (Law of Variable Proportions) and long run (Returns to Scale).
Factors of Production
The resources necessary for production are:
Land: Natural resources supplied by nature (Reward: Rent).
Labour: Physical or mental effort by humans (Reward: Wages/Salary).
Capital: Man-made resources used for further production (Reward: Interest).
Enterprise/Entrepreneurship: The factor that organizes other factors and takes risks (Reward: Profit).
Law of Variable Proportions (Short Run)
This law operates in the short run when one factor of production (usually labour) is variable and all others (like capital) are fixed.
It shows how output changes when more of the variable factor is added to a fixed factor. The law has three stages:
1. Increasing Returns: Output increases at an increasing rate (due to better utilization of fixed factor).
2. Diminishing Returns: Output increases at a decreasing rate (most commonly observed stage, due to optimal combination being passed).
3. Negative Returns: Total output starts falling (due to overcrowding and inefficiency).
Key Concept: Diminishing Marginal Returns implies that adding one more unit of input yields less additional output than the previous unit.
Returns to Scale (Long Run)
This law operates in the long run when all factors of production are varied simultaneously in the same proportion. It shows the relationship between the scale (size) of production and output.
1. Increasing Returns to Scale (IRS): Output increases by a greater proportion than the increase in inputs (e.g., input doubles, output triples). Caused by division of labour and specialization (Economies of Scale).
2. Constant Returns to Scale (CRS): Output increases by the same proportion as the increase in inputs (e.g., input doubles, output doubles).
3. Decreasing Returns to Scale (DRS): Output increases by a smaller proportion than the increase in inputs (e.g., input doubles, output increases by 1.5 times). Caused by managerial inefficiencies or difficulty in coordination (Diseconomies of Scale).
| Law | Time Period | Key Feature | Result |
|---|---|---|---|
| Law of Variable Proportions | Short Run (One factor fixed) | Change in one input only | Stages of Increasing, Diminishing, and Negative returns. |
| Returns to Scale | Long Run (All factors variable) | Change in scale of production | Increasing, Constant, or Decreasing Returns to Scale. |
Prelims tips
- Short Run : At least one factor is fixed.
- Long Run : All factors are variable (Scale can change).
- Law of Variable Proportions applies in Short Run.
- Returns to Scale applies in Long Run.
- Diminishing Returns is the most common stage.
Mains points
- Production laws guide firms in optimal resource utilization and capacity planning.
- Understanding Returns to Scale helps analyze the cost advantages or disadvantages (Economies/Diseconomies) of large-scale production.
- Economies of scale drive industrial concentration and the rise of large multinational corporations.
- Diminishing returns explain why agricultural productivity often hits a limit without technological innovation.
Capital and Human Capital
Capital represents wealth used to create more wealth, typically classified as physical, financial, and human. Human Capital, in particular, refers to the skills, knowledge, and health embodied in a nation's labour force, which drives economic growth and development.
Types of Capital
Capital is the stock of assets that can be used to create wealth.
1. Physical Capital: Tangible, man-made assets used in production. Example: Machinery, factory buildings, infrastructure.
2. Financial Capital: Funds used to acquire physical and human capital (money, stocks, bonds). It is merely a paper claim to wealth.
3. Social Capital: The network of relationships, shared values, and trust that enables participants to work effectively together (E.g., community networks, civil society organizations).
Concept of Human Capital
Human Capital refers to the stock of skills, knowledge, abilities, health, and experience accumulated by people, which has economic value.
It is developed through investment in education, training, and healthcare.
Difference between Human Capital and Human Development:
Human Capital views humans as a means to increase productivity and economic growth (Focus on utility).
Human Development views humans as an end in themselves; it focuses on welfare, freedoms, and expanding choices (Focus on welfare).
Human Capital Formation (HCF): The process of adding to the stock of human capital over time. Sources of HCF include:
Investment in Education: Increases productivity and efficiency of labour.
Investment in Health: Improves life expectancy and vitality, ensuring a more productive workforce.
On-the-Job Training: Increases skill levels specific to the work environment.
Expenditure on Migration: Facilitates better utilization of skills in suitable job markets.
Expenditure on Information: Helps in making decisions regarding job opportunities and resource allocation.
| Aspect | Human Capital | Physical Capital |
|---|---|---|
| Tangibility | Intangible (in mind and body) | Tangible (can be seen and touched) |
| Separability | Cannot be separated from the owner | Can be bought and sold in the market |
| Mobility | Highly mobile across countries (via migration) | Less mobile (difficult to move factories) |
| Depreciation | Depreciates with age, but skills appreciate with use | Depreciates with use |
Prelims tips
- Physical Capital = Tangible assets (Machinery).
- Human Capital = Intangible assets (Skills, Health).
- HCF is achieved through investment in Education, Health, and Training.
- Human Development is the end; Human Capital is the means.
Mains points
- Human Capital Formation is key to sustainable and inclusive economic growth.
- The state's role in investing in social sectors (education/health) is justified by the public good nature of human capital.
- Social Capital complements human and physical capital, boosting productivity and reducing transaction costs.
- Developing nations face challenges in converting financial capital into human capital due to weak institutions and corruption.
Economic Growth vs. Economic Development
Economic Growth refers to a quantitative increase in a country's output (measured by GDP). Economic Development is a qualitative and multi-dimensional process that includes growth alongside improvements in living standards, education, health, and reduction in inequality.
Economic Growth (Quantitative)
Definition: It is the increase in the real output of goods and services produced by an economy over a period of time.
Nature: Quantitative, narrow, and uni-dimensional.
Measurement: Measured by increase in Gross Domestic Product (GDP), Gross National Product (GNP), or per capita income.
Scope: Primarily related to developed nations, as they mainly focus on increasing output.
Outcome: Higher productivity and increased national income.
Sustainability: Growth can be temporary (e.g., due to a temporary boom) and may not be sustainable if resources are overexploited.
Example: If India’s GDP rises from 3.5 trillion to 3.8 trillion in a year, it is economic growth.
Economic Development (Qualitative)
Definition: It is a broader concept that includes economic growth plus changes in non-economic factors like institutional, social, and cultural structures.
Nature: Qualitative, comprehensive, and multi-dimensional.
Measurement: Measured using indices like the Human Development Index (HDI), Physical Quality of Life Index (PQLI), and Gender Inequality Index (GII).
Scope: Primarily related to developing nations, focusing on improving overall quality of life.
Outcome: Structural changes, poverty reduction, better education, improved public health, and greater equality.
Sustainability: Development is generally a sustainable process aimed at long-term welfare.
Example: If along with GDP growth, infant mortality rates fall, literacy rates rise, and income inequality decreases, it is economic development.
Inclusive Growth
Inclusive Growth is defined as economic growth that is distributed fairly across society and creates opportunity for all, regardless of where they live or who they are.
The focus is not just on the rate of growth but on the distribution of its benefits to ensure sustained progress in poverty reduction and social equity.
This concept bridges the gap between the narrowness of economic growth and the broadness of economic development.
| Basis | Economic Growth (E.G.) | Economic Development (E.D.) |
|---|---|---|
| Concept | Narrow, Quantitative | Broad, Qualitative |
| Scope | Increase in GDP/Per Capita Income | E.G. + Welfare, Poverty Reduction, Equality |
| Measure | GDP, GNP | HDI, PQLI, GII |
| Relevance | More relevant for Developed Countries | More relevant for Developing Countries |
Prelims tips
- Growth is quantitative (GDP); Development is qualitative (HDI).
- Growth is necessary but not sufficient for Development .
- HDI components: Health (life expectancy), Education, and Income (GNI per capita).
- Inclusive Growth aims for equity and shared benefits.
Mains points
- India's economic strategy must prioritize development (qualitative change) over mere growth (quantitative increase) to reduce socio-economic disparities.
- High economic growth without development leads to 'jobless growth' and increased inequality.
- Human Development Indices offer a more holistic measure of national progress than GDP alone.
- Achieving inclusive growth is the core challenge for a country like India.
Economic Reforms and Digital Economy
Economic Reforms involve changes in government policies to shift the economy's structure, often through Liberalisation, Privatisation, and Globalisation (LPG). The Digital Economy, driven by ICT, is transforming traditional sectors, creating new opportunities, and presenting challenges for regulation and taxation.
Economic Reforms (The LPG Model)
Economic Reforms refer to policies undertaken to correct macroeconomic imbalances and structural rigidities, often involving a shift from a centrally planned or protected economy to a market-oriented one.
The 1991 reforms in India were driven by a balance of payments crisis and structural weaknesses.
1. Liberalisation (L): Reducing government control and restrictions on private economic activities. Aim: Unleash the private sector’s potential.
Examples: Abolishing industrial licensing (except for a few sectors), freedom in fixing prices, reducing foreign exchange controls.
2. Privatisation (P): Transferring ownership or control of public sector enterprises (PSUs) to the private sector. Aim: Improve efficiency and reduce fiscal burden on the government.
Examples: Sale of government stake (disinvestment), opening up core sectors like telecom and power to private players.
3. Globalisation (G): Integrating the national economy with the world economy. Aim: Increase competition, foreign investment, and exports.
Examples: Reduction of import tariffs, easier flow of capital and technology, enabling foreign companies to set up units in India.
Digital Economy
Definition: An economy that operates primarily through digital technologies, including the internet, mobile networks, and IT infrastructure. It covers digital platforms, e-commerce, digital payments, and data-driven services.
Components:
1. Core Digital Sector: Produces digital goods and services (e.g., software, IT consulting).
2. Digital Dependent Sector: Uses digital tools extensively (e.g., e-commerce, banking).
3. Digital Enabler: The infrastructure itself (e.g., telecom networks, internet access).
Implications for the Economy:
Positive: Increased efficiency, greater market reach, reduced transaction costs, new job creation (e.g., app developers, data analysts).
Challenges: Data privacy and security, digital divide (unequal access to technology), regulation of digital monopolies, and challenges in taxing global digital services (Base Erosion and Profit Shifting or BEPS).
| Policy Area | Pre-1991 (Protected) | Post-1991 (Reformed) |
|---|---|---|
| Industrial Licensing | Mandatory for most industries ('License Raj') | Abolished for almost all industries |
| Foreign Trade | High tariffs and quantitative restrictions (QRs) | Tariff reduction, removal of QRs (Globalisation) |
| Public Sector | Monopoly in many sectors, high losses | Disinvestment, privatisation, competition introduced |
| Financial Sector | Regulated interest rates, limited competition | Deregulated interest rates, entry of private/foreign banks |
Prelims tips
- LPG Reforms : Liberalisation, Privatisation, Globalisation (1991).
- Liberalisation = reducing restrictions on private sector.
- Privatisation = reducing government stake (disinvestment).
- Digital Economy is fundamentally driven by ICT and Data.
- BEPS is a challenge related to taxing the Digital Economy.
Mains points
- The 1991 reforms radically transformed India's economy, boosting growth but also increasing inequality, leading to the need for second-generation reforms.
- The Digital Economy is a powerful engine for development, but it must be inclusive to avoid exacerbating the digital divide.
- Policy challenges in the digital age include regulating data as an asset and designing a fair tax regime for technology giants.
- Reforms led to India's integration into the global supply chain, making it vulnerable to global economic cycles.
Indian Agriculture and Allied Sectors
Indian Agriculture, despite its declining contribution to GDP, remains the largest employer in the country and is vital for food security. Allied sectors like livestock, fisheries, and forestry are increasingly important for diversifying farm incomes and promoting sustainable rural livelihoods.
Importance of Indian Agriculture
Employment: Provides livelihood to roughly half of the country's population, making it the largest employer.
Food Security: Ensures food grains and other essential items are available for the entire population.
Industrial Raw Materials: Supplies inputs to agro-based industries (e.g., cotton to textiles, sugarcane to sugar mills).
Trade: Significant contributor to exports (e.g., spices, rice, tea).
Allied Sectors
1. Livestock (Animal Husbandry): Provides dairy products (milk), meat, leather, and manure. Crucial for supplementary income, especially for marginal and small farmers. India is the largest milk producer globally.
2. Fisheries: Includes marine (sea) and inland (river, pond) fishing. Important source of protein and export revenue. Growth driven by Blue Revolution initiatives.
3. Forestry: Includes sustainable logging, timber production, and forest-based minor produce. Vital for environmental balance, tribal livelihoods, and ecological services.
Challenges in Indian Agriculture
Fragmentation of Land Holdings: Average farm size is small and declining, hindering mechanization and efficiency.
Monsoon Dependence: Despite irrigation, a significant portion of farming is rain-fed (vulnerable to climate change).
Input Scarcity: Inefficient use of water, poor soil health, and high cost of fertilizers/pesticides.
Market Access and Price Volatility: Issues with regulated markets (APMCs), storage infrastructure, and Minimum Support Price (MSP) coverage leading to farmer distress.
Credit Availability: Farmers face challenges in accessing formal credit, leading to reliance on moneylenders and high indebtedness.
| Revolution | Objective/Sector | Associated Area |
|---|---|---|
| Green Revolution | Food grain production (Wheat, Rice) | High Yielding Varieties (HYV), Fertilizers, Irrigation |
| White Revolution | Milk production (Dairy) | Operation Flood (Verghese Kurien) |
| Blue Revolution | Fish production (Fisheries/Aqua-culture) | Marine and Inland fishing |
| Yellow Revolution | Oilseeds production | Edible Oils (Mustard, Sunflower) |
Prelims tips
- Largest employer in India: Agriculture.
- Operation Flood is related to the White Revolution (Milk).
- Blue Revolution is for Fisheries.
- MSP is a key policy to support farm prices.
- Land fragmentation is a major constraint in Indian farming.
Mains points
- Sustainable agriculture requires a shift from chemical farming to organic and climate-resilient practices.
- Reforming the agricultural market (e.g., replacing APMCs, improving storage) is essential to double farmer income.
- The growth of allied sectors provides diversification and resilience against crop failure, contributing to inclusive growth.
- Addressing rural indebtedness through formal credit and insurance is crucial for reducing farmer distress.
Social Sector: Health and Education
The social sectors of Health and Education are crucial for Human Capital Formation, directly impacting productivity, poverty reduction, and overall economic development. They require significant public investment to ensure equitable access and high-quality services.
Importance for Economic Development
Investment in health and education is considered a core investment in Human Capital, yielding high long-term social and economic returns.
Productivity: Healthier and more educated workers are more efficient, innovative, and adaptable.
Poverty Reduction: Education provides skills for better employment; health reduces workdays lost due to illness, breaking the cycle of poverty.
Equity: Public provision of these services helps reduce inequality by providing opportunities to disadvantaged groups.
Challenges and Policy in Education (India)
Challenges: Low public expenditure (relative to GDP), poor infrastructure, high dropout rates (especially at secondary level), and a focus on mere literacy rather than skills and vocational training.
Key Policies:
Right to Education (RTE) Act, 2009: Makes free and compulsory education for children aged 6 to 14 a fundamental right.
Sarva Shiksha Abhiyan (SSA): Universal elementary education program.
National Education Policy (NEP) 2020: Focuses on holistic, multidisciplinary education, vocational integration, and achieving universal Foundational Literacy and Numeracy (FLN).
Challenges and Policy in Health (India)
Challenges: High out-of-pocket expenditure (OOPE) by citizens, rural-urban disparities in quality, shortage of public health infrastructure (Primary Health Centres), and the dual burden of communicable and non-communicable diseases.
Key Policies:
National Health Policy 2017: Aims to achieve universal health coverage and substantially increase public health expenditure.
Ayushman Bharat: Consists of two components:
1. Pradhan Mantri Jan Arogya Yojana (PMJAY): Provides health assurance up to ₹5 lakh per family per year for secondary and tertiary care.
2. Health and Wellness Centres (HWCs): Aim to provide comprehensive primary healthcare closer to homes.
| Sector | Key Indicator | Significance |
|---|---|---|
| Education | Gross Enrolment Ratio (GER) | Measures the participation rate in education. |
| Education | Literacy Rate | Percentage of population able to read and write. |
| Health | Infant Mortality Rate (IMR) | Number of deaths of children under one year of age per 1000 live births (Welfare measure). |
| Health | Life Expectancy at Birth | Average number of years a person is expected to live (Human Capital measure). |
Prelims tips
- RTE Act : Age group 6-14.
- NEP 2020 aims for FLN and higher GER.
- Ayushman Bharat PMJAY covers up to ₹5 lakh.
- OOPE (Out-of-Pocket Expenditure) is high in India's health sector.
- IMR and Life Expectancy are components of the Human Development Index .
Mains points
- Public spending on health and education must increase significantly to realize India's demographic dividend.
- Poor health outcomes and high out-of-pocket expenditure act as poverty traps for millions of households.
- NEP 2020 reforms aim to shift the focus from rote learning to critical thinking, a key for a knowledge-based economy.
- Equitable access to quality health and education is essential for converting economic growth into true human development.
Business Cycle: Boom, Recession, Depression and Recovery
A business cycle is the recurring rise and fall of economic activity (real GDP, employment, investment) around its long-run trend, moving through expansion/boom, recession, depression (trough) and recovery.
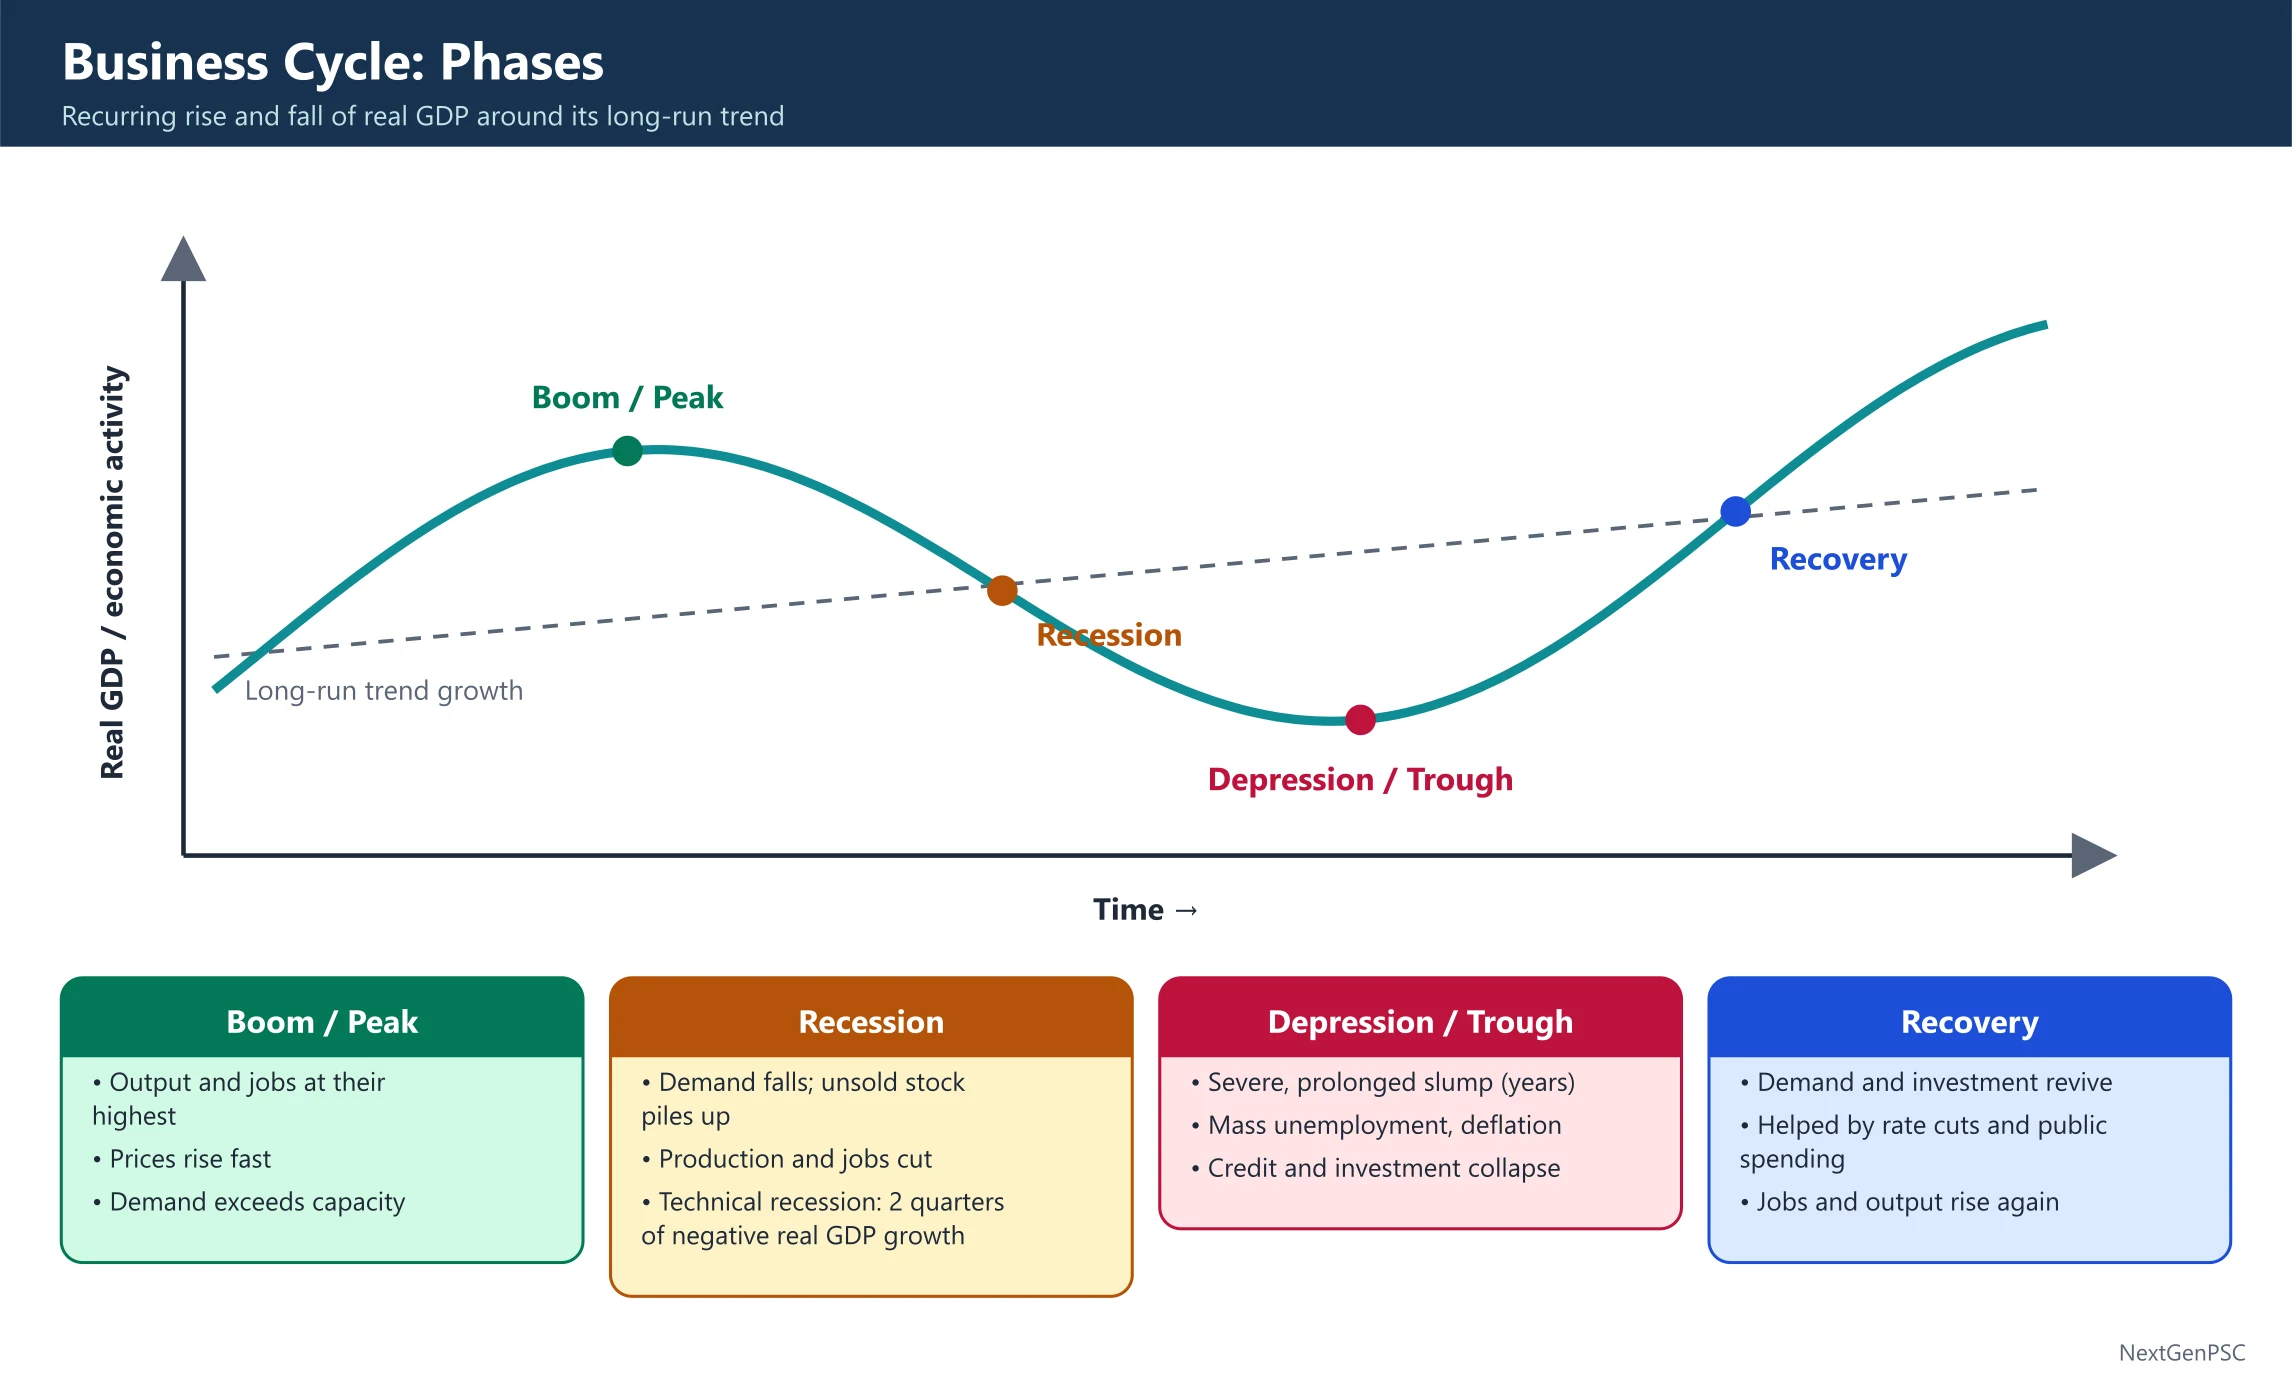
Phases of the Business Cycle
Expansion and Boom (Peak): output, employment, incomes and prices rise; demand runs ahead of capacity, so inflationary pressure builds. The peak is the highest point before activity turns down.
Recession (Contraction): follows the peak. Demand falls, firms are left with unsold stock (involuntary inventory accumulation), so they cut production, investment and jobs; profits and prices soften.
Depression (Trough): a severe and prolonged recession – very high unemployment, falling prices or deflation, collapse of credit and investment, widespread business failures. It lasts years rather than months (e.g. the Great Depression of the 1930s).
Recovery (Revival): demand and investment pick up from the trough, often helped by lower interest rates and government spending; employment and output rise again towards a new expansion.
Recession vs Technical Recession vs Depression
Technical recession: conventionally defined as two consecutive quarters of negative real GDP growth (quarter-on-quarter). India entered a technical recession in 2020-21 (April–September 2020) because of the Covid-19 lockdown.
Recession (broader sense): a significant, widespread decline in economic activity lasting more than a few months – seen in GDP, income, employment, industrial production and sales.
Depression: much deeper and longer than a recession, with abnormal unemployment and a sharp fall in credit and trade.
Slowdown: GDP still grows but at a lower rate – it is not a recession.
Causes of Business Cycles
Demand-side: swings in investment, consumer confidence and government spending (Keynesian view).
Monetary: excessive credit expansion followed by tightening (monetarist view).
Supply shocks: oil price spikes, pandemics, wars, crop failures.
Psychological: waves of optimism and pessimism among investors ('animal spirits').
Policy Response
Counter-cyclical policy: in a recession – lower policy rates, more liquidity, higher public spending and tax cuts; in a boom – tighter money and fiscal consolidation.
Automatic stabilisers: progressive taxes and welfare spending soften the cycle without new decisions.
| Phase | Output and Jobs | Prices | Inventories / Investment |
|---|---|---|---|
| Boom (Peak) | Highest; near full employment | Rising fast | Low inventories; high investment |
| Recession | Falling | Rise slows or softens | Unsold stock piles up; investment cut |
| Depression (Trough) | Lowest; mass unemployment | Falling (deflation possible) | Investment collapses |
| Recovery | Rising again | Stable, then rising | Stocks run down; investment revives |
Prelims tips
- Sequence: Boom (peak) → Recession → Depression (trough) → Recovery → Boom.
- Technical recession = two consecutive quarters of negative real GDP growth.
- Involuntary inventory accumulation is a hallmark of a recession.
- Depression = severe, prolonged recession (years, not months), e.g. the Great Depression of the 1930s.
- A slowdown (lower but positive growth) is not a recession.
Mains points
- Business cycles hurt the poor most through job and income losses, so counter-cyclical fiscal space and automatic stabilisers matter for inclusive growth.
- India's 2020 technical recession showed the value of quick monetary easing and targeted fiscal support (free food grains, credit guarantees) over broad stimulus.
- Pro-cyclical fiscal policy (spending more in booms, cutting in slumps) deepens cycles; rule-based frameworks such as FRBM with escape clauses aim to prevent this.
- Global integration transmits cycles across borders through trade, capital flows and commodity prices, so domestic policy must watch the external sector too.
Did you know?
- The NBER in the USA does not use the 'two quarters' rule; it dates recessions by judging a broad set of indicators.
- During the Great Depression, US unemployment reached about 25%.
- Keynes wrote his General Theory (1936) largely to explain why the Great Depression persisted.