
Indian Economy · UPSC Notes
Budgeting and Fiscal Policy — UPSC Economy Notes
Free, exam-focused notes for UPSC Prelims and Mains, with Prelims tips and Mains points for every topic. 30 topics.
Open in the interactive reader: bookmarks, progress tracking and read-aloud.
Budgeting and Fiscal Policy
The Budget is the government’s annual financial statement, presented under Article 112 of the Constitution. It contains estimates of income (receipts) and expenditure (spending) for the coming financial year. It guides resource allocation, reflects government priorities, and requires approval of Parliament. The Union Budget is a legal tool for efficient use of scarce resources.
Overview of Budget
The Budget is a detailed financial plan of the government for one year.
It estimates revenue (money earned by government) and expenditure (money spent by government).
Article 112 of the Constitution calls it the ‘Annual Financial Statement’.
It is not just numbers, but also shows government policies, taxation plans, and developmental goals.
Budget is prepared by the Budget Division of the Department of Economic Affairs, Ministry of Finance.
Elements of the Budget
Estimates of revenue receipts (tax and non-tax income).
Estimates of capital receipts (borrowings, loans, recoveries).
Expenditure estimates (on welfare, infrastructure, defense, etc.).
Ways and means to raise revenue (taxation proposals).
Review of last year’s income and spending, with explanation of surplus or deficit.
Financial and economic policies for the coming year.
Evolution of Budget in India
Until 2017, India had two budgets: Railway Budget and General Budget.
In 2017, both were merged into a single Union Budget for simplification.
Constitutional Provisions on Budget
Article 112 – Annual Financial Statement
The President lays before both Houses of Parliament the government’s estimated receipts and expenditures.
Expenditures are divided into:
Charged on Consolidated Fund of India (like President’s salary, judges, CAG, etc.) – not subject to voting.
Other expenditures from the Consolidated Fund – subject to Parliament’s approval.
Article 113 – Demands for Grants
Expenditures not charged on Consolidated Fund are presented as Demands for Grants to Lok Sabha.
Lok Sabha can accept, reduce, or reject demands.
No demand can be made without the President’s recommendation.
Article 114 – Appropriation Bill
After grants are voted, an Appropriation Bill is introduced.
It allows withdrawal of money from the Consolidated Fund of India for approved purposes.
No amendment can be made in Parliament to change the bill.
Article 265 – Taxes only by authority of law
No tax can be levied or collected without parliamentary approval.
Finance Bill, part of the Budget, is passed to change tax laws and raise revenue.
Article 266 – Consolidated Fund and Public Account of India
All government revenues, loans, and repayments form the Consolidated Fund of India.
All other public money (like provident fund, small savings) go to the Public Account of India.
No money can be withdrawn from the Consolidated Fund without Parliament’s approval.
| Aspect | Details |
|---|---|
| Definition | Annual Financial Statement (Article 112) – estimates of receipts and expenditure |
| Prepared by | Budget Division, Department of Economic Affairs, Ministry of Finance |
| Evolution | Earlier two budgets (Railway + General), merged in 2017 into one Union Budget |
| Approval Process | Demands for Grants → Appropriation Bill → Finance Bill |
| Funds | Consolidated Fund of India and Public Account of India |
Prelims tips
- Article 112 – Budget is called Annual Financial Statement.
- Article 265 – No tax without Parliament’s approval.
- Union Budget merged with Railway Budget in 2017.
- Finance Bill is a Money Bill, part of Budget process.
Mains points
- Budget reflects the government’s revenue and expenditure priorities for a financial year.
- It ensures optimal allocation of scarce resources in line with socio-economic objectives.
- Budgetary process strengthens accountability of the executive to the legislature.
- Articles 112–114, 265–266 of Constitution define the framework of budgeting.
- Union Budget after 2017 is a consolidated single budget covering all sectors.
Objective and Types of Budget
The Budget is not only a financial statement but also a tool for planning, allocation of resources, and ensuring legislative control over government spending. It can be of different types – balanced, surplus, deficit, zero-based, and performance-based – depending on how revenue and expenditure are managed.
Objectives of Budget
Ensures planned and efficient allocation of limited government resources.
Provides parliamentary control over the executive through debates, discussions, cut motions, and passing of Appropriation and Finance Bills.
Article 114(3) of the Constitution: 'No amount can be withdrawn from the Consolidated Fund of India without approval of law by Parliament.'
Promotes transparency and accountability in government spending.
Types of Budget
1. Balanced Budget
When estimated expenditure equals estimated revenue in a financial year.
Considered ideal by traditional economists as it shows the government is 'living within its means'.
2. Surplus Budget
Revenues (taxes, non-tax income) are more than expenditure.
Indicates strong financial health of the government.
Useful in times of high inflation:
Government increases taxes and reduces expenditure.
Withdraws money from the economy, reduces demand, and helps control inflation.
3. Deficit Budget
Expenditure is greater than revenue.
Shows that taxes and receipts are not sufficient to cover government expenses.
Economists have two views:
Traditional view: Deficit is risky, shows overspending, weakens financial health.
Modern view: Deficit, if spent on infrastructure and development, can promote economic growth and job creation.
4. Zero-Based Budgeting (ZBB)
Concept given by Edward Hilton Young in 1924.
Every new budget starts from a 'zero base' – no past allocations are assumed.
Every expense must be justified afresh for the new period.
Focus is on evaluating needs and costs of every project or department.
Introduced in India in 1983 in the Department of Science and Technology.
5. Performance Budgeting
Introduced in India in 1969 on recommendation of the Administrative Reforms Commission.
Links expenditure with outcomes (what results were achieved from money spent).
Focuses on functions, programmes, activities and projects with clear targets.
Example: If Ministry of Health reports that ₹1000 crore under Janani Suraksha Yojana reduced Maternal Mortality Ratio (MMR) from 212 to 190, it shows spending achieved measurable outcomes.
Helps government improve expenditure priorities and increase efficiency.
| Type of Budget | Description | Usefulness |
|---|---|---|
| Balanced Budget | Expenditure = Revenue | Shows financial discipline |
| Surplus Budget | Revenue > Expenditure | Useful in controlling inflation |
| Deficit Budget | Expenditure > Revenue | Can promote growth if spent on development |
| Zero-Based Budget | Starts from scratch, every expense justified | Improves efficiency, avoids waste |
| Performance Budget | Links spending with outcomes | Improves accountability and prioritization |
Prelims tips
- Balanced, Surplus, and Deficit are the three traditional budget types.
- Zero-Based Budgeting introduced in India in 1983 (Dept. of Science and Technology).
- Performance Budgeting introduced in India in 1969 (Administrative Reforms Commission).
- Surplus budget helps control inflation; deficit budget can stimulate growth.
Mains points
- Budget types reflect different fiscal strategies: discipline, control of inflation, or economic stimulus.
- Zero-Based Budgeting forces rationalization of expenditure and avoids waste.
- Performance Budgeting improves accountability by linking money spent with actual outcomes.
- Choice of budget type depends on macroeconomic conditions like inflation, recession, or resource constraints.
Outcome, Participatory, and Gender Budgeting
These are modern approaches to budgeting that go beyond just spending money. Outcome Budgeting links spending with actual results, Participatory Budgeting involves citizens directly in deciding priorities, and Gender Budgeting ensures that women’s needs are specifically addressed in financial planning.
Outcome Budget
Objective: To connect outlay (money allocated), output (what is directly produced), and outcome (real impact or improvement).
Outlay = money given for a scheme/project.
Output = direct, measurable result (like number of schools built, vaccines given).
Outcome = broader impact on society (like literacy improvement, reduction in disease rates).
Analyses progress of each ministry against money allocated in the Budget.
Major feature: Measures results in physical units, not just rupees.
Example: Ministry of Health given ₹5 lakh crores → must reduce Infant Mortality Rate below 25 and Maternal Mortality Rate below 110 within financial year.
Started in India: From 2006-07, every ministry must present outcome budget to Ministry of Finance.
Participatory Budgeting
A democratic process where ordinary citizens decide how part of government budget should be spent.
Involves people in full budget cycle:
Identifying local needs (like roads, parks, health centers).
Preparing and suggesting proposals.
Participating in review, discussion, and voting.
Monitoring how funds are used (procurement, contracts).
Checking actual implementation of projects.
First tried in India: By Janaagraha in Bengaluru (2001).
Successful example: Pune, where citizens actively influenced local budget priorities.
Gender Budgeting
Involves analyzing the budget with a gender perspective – asking 'How much is spent on women’s welfare and empowerment?'.
Aim: Promote gender equality by ensuring women benefit equally from government development programs.
Why needed?
Women are 48% of population but lag in education, health, jobs, and resources.
Resource allocation affects men and women differently.
Tool for gender mainstreaming: Ensures government spending directly reduces gender inequalities.
Impact: Allows policymakers, NGOs, and women’s rights groups to track and demand more funds for women-centric programs.
Reflection of India’s commitment to gender equality goals.
| Type | Meaning | Example/Impact |
|---|---|---|
| Outcome Budget | Links money spent with measurable results and outcomes. | Health Ministry funding tied to reducing Infant Mortality. |
| Participatory Budget | Citizens directly decide local budget priorities. | Pune’s ward-level citizen budgeting. |
| Gender Budget | Analyzes spending for promoting gender equality. | Funds allocated to women’s health, education, and welfare schemes. |
Prelims tips
- Outcome Budget links outlay-output-outcome; started in India in 2006-07.
- Participatory Budgeting first tried in Bengaluru (2001) by Janaagraha; strong example in Pune.
- Gender Budgeting focuses on women’s welfare and equality; started in India officially in 2005-06 Union Budget.
Mains points
- Outcome Budget improves accountability by linking money spent to measurable outcomes.
- Participatory Budget deepens democracy and ensures local priorities are reflected.
- Gender Budgeting addresses structural inequalities and promotes inclusive development.
- Together, these budgeting innovations make financial planning more transparent, participatory, and equitable.
Implementation of Gender Budgeting in India
Gender Budgeting in India was officially introduced in Union Budget 2005-06. It focuses on ensuring that women benefit directly from public spending. It divides allocations into women-specific schemes (100% for women) and pro-women schemes (where at least 30% of allocation is for women). Over time, India has significantly increased its gender budget, reflecting the government’s emphasis on women-led development.
Introduction
Gender Budgeting was formally adopted in India in Union Budget 2005-06.
It ensures that planning, allocation, and monitoring of resources take into account women’s needs and promote gender equality.
Structure of Gender Budget in India
Part A: Women-Specific Schemes – Entire (100%) allocation goes for women. Examples: Widow Pension Scheme, Girls’ Hostel Scheme, Maternity Benefit Scheme.
Part B: Pro-Women Schemes – At least 30% of the allocation is for women. Examples: Mid-Day Meal Programme, National Rural Livelihoods Mission, Biogas Programme.
In practice, most of India’s Gender Budget has been dominated by Part B allocations, making up nearly two-thirds of the total Gender Budget every year.
Growth of Gender Budget
In 2005-06, Gender Budget = Rs 24,241 crore (~5.5 billion).
By 2020-21, it increased to Rs 1,43,462 crore (~19 billion).
This is a six-fold increase, showing greater focus on women empowerment over the years.
Budget 2023-24 Updates
Emphasis on women-led development during Amrit Kaal (25-year lead-up to India@100).
Government highlighted 'Nari Shakti' (women power) as key to India’s bright future.
Initiatives include:
Financial assistance of over Rs 2.25 lakh crore under PM-Kisan Samman Nidhi, benefiting around 3 crore women farmers.
Launch of Mahila Samman Savings Certificate (valid up to March 2025).
Allows deposit of up to Rs 2 lakh in the name of a woman/girl.
Tenure: 2 years, fixed interest rate 7.5%.
Partial withdrawal allowed for flexibility.
Allocation to Ministry of Women and Child Development (MoWCD) increased by 1.08% compared to previous year (2022-23).
Significance
Gender Budgeting helps track and ensure that women get adequate share of resources.
Acts as a tool to promote women’s empowerment, reduce gender inequalities, and mainstream gender concerns in governance.
Reflects India’s commitment to inclusive and equitable development.
| Part | Description | Examples |
|---|---|---|
| Part A | 100% allocation for women-specific schemes | Widow Pension, Girls’ Hostel, Maternity Benefits |
| Part B | At least 30% allocation for women (Pro-women schemes) | Mid-Day Meal, Rural Livelihoods Mission, Biogas Programme |
Prelims tips
- Gender Budgeting formally introduced in Union Budget 2005-06.
- Divided into Part A (100% for women) and Part B (at least 30% for women).
- Most allocations fall under Part B (Pro-Women Schemes).
- Budget 2023-24: Mahila Samman Savings Certificate launched; special push for women farmers.
Mains points
- Gender Budgeting helps integrate women’s needs into mainstream governance.
- Ensures equitable distribution of resources by monitoring women-centric allocations.
- Part A ensures exclusive funds for women, while Part B ensures gender-sensitivity in general schemes.
- The rising allocation over time shows India’s growing commitment to women’s empowerment.
- Recent initiatives like Mahila Samman Savings Certificate strengthen women’s financial independence.
Components of a Budget
The Government Budget is broadly divided into two accounts – Revenue Account and Capital Account. Revenue Account deals with one-way transactions such as taxes and salaries, while Capital Account deals with two-way transactions such as borrowings and asset creation. Budget receipts are further classified into Capital Receipts (which create liabilities or reduce assets) and Revenue Receipts.
Overview
The Union Budget is the financial plan of the Government for a financial year (April–March).
It contains estimates of receipts (income) and expenditures (spending).
Broadly divided into two accounts: Revenue Account and Capital Account.
Revenue Account
Shows income and spending of the government during the current year.
These are one-way transactions (no repayment obligation).
Example: Government collecting taxes, government paying salaries.
Capital Account
Shows changes in government’s assets and liabilities.
These are two-way transactions – government either creates assets or incurs liabilities.
Example: Government borrows money (liability) or spends on infrastructure (asset creation).
Budget Receipts
Broadly classified as Revenue Receipts and Capital Receipts.
Capital Receipts are not regular in nature and either create liability or reduce assets.
Capital Receipts – Types
Debt Capital Receipts
Borrowed money which creates liability for the government.
Includes both internal borrowings and external borrowings.
Needs to be repaid in the future (by government or future generations).
If used only for regular expenditure, it can disturb fiscal stability and may lead to inflation.
Internal Borrowings (within India):
Loans raised from the public (through government securities).
Borrowings from the Reserve Bank of India (RBI).
Loans from financial institutions via Treasury Bills.
Money mobilized from small savings schemes (like Post-Office Savings, Kisan Vikas Patra, etc).
Funds from Provident Funds (EPFO, PPF, etc).
External Borrowings (from abroad):
Loans and aid from international financial institutions such as IMF, World Bank, BRICS Bank, etc.
These are foreign debts and have to be repaid with interest in foreign currency.
Non-Debt Capital Receipts
Do not create future repayment obligations.
Examples: Disinvestment proceeds (selling government stake in public enterprises), recovery of loans given by government.
| Account | Nature | Examples |
|---|---|---|
| Revenue Account | One-way transactions (no repayment) | Taxes collected, Salaries paid |
| Capital Account | Two-way transactions (liability or asset creation) | Borrowings, Infrastructure investment |
| Type | Nature | Examples |
|---|---|---|
| Debt Capital Receipts | Creates liability; must be repaid | Internal borrowings (RBI, public, savings), External borrowings (IMF, World Bank) |
| Non-Debt Capital Receipts | No liability; no repayment needed | Disinvestment proceeds, Loan recovery |
Prelims tips
- Revenue Account = one-way transactions (no repayment).
- Capital Account = two-way transactions (assets/liabilities).
- Capital Receipts divided into Debt (borrowing) and Non-Debt (disinvestment, loan recovery).
- Internal borrowing sources: RBI, Treasury bills, small savings, provident funds.
Mains points
- Revenue Account ensures smooth running of government through taxes and other current receipts.
- Capital Account focuses on long-term asset creation and managing liabilities.
- Debt Capital Receipts, if used unwisely for routine expenditure, can harm fiscal health.
- Non-Debt Capital Receipts like disinvestment reduce government ownership but avoid debt burden.
- Understanding these distinctions is crucial for analyzing fiscal policy and budget priorities.
Budget Receipts and Expenditure
Government receipts are broadly classified into Capital Receipts (Debt and Non-Debt) and Revenue Receipts (Tax and Non-Tax). Government expenditure is divided into Capital and Revenue Expenditure. This classification helps in understanding how the government earns and spends money, and whether it is for asset creation or routine administration.
Non-Debt Capital Receipts
Capital Receipts which do not create liabilities (government does not need to repay them).
Includes money raised through sale of government-owned assets and recovery of past loans.
Components of Non-Debt Capital Receipts:
Disinvestment proceeds: Money earned by selling government shares/stakes in Public Sector Enterprises (PSEs).
Recovery of Loans and Advances: Money repaid to the Government of India by state governments, public enterprises, or foreign countries who had earlier taken loans.
Revenue Receipts
Receipts which are regular in nature and do not create liability or reduce assets.
Further divided into Tax Revenue and Non-Tax Revenue.
Tax Revenue Receipts:
Money earned by government through taxes on individuals and businesses.
Subdivided into:
Direct Taxes: Paid directly by individuals/companies (e.g., Income Tax, Corporate Tax).
Indirect Taxes: Collected indirectly on goods/services (e.g., GST, Excise Duty, Customs Duty).
Non-Tax Revenue Receipts:
Income of government from sources other than taxes.
Includes:
Fines and penalties
Dividends and profits from Public Sector Enterprises (PSEs)
Interest on loans given by government (to states, PSEs, etc.)
Petroleum license fees
Power supply and electricity charges
Communication and broadcasting service fees
Road and bridge usage charges
Examination fees, police service fees
Sale of stationery, gazettes, defence services receipts
Budget Expenditure
Refers to all money spent by the Government of India to perform its functions.
Earlier divided into Plan and Non-Plan Expenditure, but since 2018-19, classified only as Revenue Expenditure and Capital Expenditure (as per C. Rangarajan Committee recommendation).
Revenue Expenditure:
Routine expenses for day-to-day functioning of government.
Do not create assets, recurring in nature.
Examples:
Payment of interest on loans
Salaries and pensions
Subsidies and grants
Health and education spending
Defence services
Capital Expenditure (explained earlier):
Leads to creation of assets or reduction of liabilities (e.g., infrastructure projects, loan repayments).
| Type | Nature | Examples |
|---|---|---|
| Debt Capital Receipts | Liability; must be repaid | Borrowings from RBI, public, IMF, World Bank |
| Non-Debt Capital Receipts | No repayment liability | Disinvestment, recovery of loans |
| Tax Revenue Receipts | Collected through taxes | Income Tax, Corporate Tax, GST |
| Non-Tax Revenue Receipts | Non-tax income sources | Dividends, fees, fines, interest on loans |
| Type | Nature | Examples |
|---|---|---|
| Revenue Expenditure | Recurring expenses; no asset creation | Salaries, pensions, subsidies, interest payments |
| Capital Expenditure | Asset creation or liability reduction | Infrastructure projects, loan repayments |
Prelims tips
- Non-Debt Capital Receipts = Disinvestment + Recovery of Loans.
- Revenue Receipts = Tax (direct + indirect) + Non-Tax (fees, fines, dividends).
- Revenue Expenditure = No asset creation (salaries, subsidies, pensions).
- Capital Expenditure = Asset creation or liability reduction (infrastructure, loan repayments).
Mains points
- Revenue Receipts help fund routine government functions, while Capital Receipts are used for long-term investments or liability management.
- Non-Debt Capital Receipts reduce government ownership but avoid future repayment burden.
- Revenue Expenditure reflects government’s commitment to welfare schemes and administration.
- Capital Expenditure is linked to development projects, asset creation, and long-term growth.
- Balanced use of Revenue and Capital Expenditure is crucial for fiscal stability and sustainable development.
Capital Expenditure
Capital expenditure refers to government spending that creates assets or reduces liabilities. It includes infrastructure building, purchase of assets, loans to states, and repayment of loans. Unlike revenue expenditure, capital expenditure brings long-term benefits such as improved productivity, private investment attraction, and sustainable growth.
What is Capital Expenditure?
Capital expenditure includes all government spending which leads to asset creation or liability reduction.
It is long-term in nature and contributes to sustainable growth and infrastructure development.
Examples of Capital Expenditure:
Construction of roads, bridges, and government buildings.
Purchase of land, machinery, and equipment.
Investment in shares and equity.
Loans given to state governments or foreign governments.
Repayment of loans taken by government in past.
Significance of Capital Expenditure
Long-term Benefits: Provides infrastructure, equipment, and facilities that can be used for years, improving quality of life and boosting economy.
Increased Productivity: Modern tools and facilities improve efficiency of government departments and save costs in the long run.
Attracts Private Investment: Better infrastructure encourages companies to set up industries, boosting employment and growth.
Enhances Government Revenue: Growth and private investment increase tax revenues, reducing need for borrowing.
Reduces Operating Costs: Investment in energy-efficient infrastructure saves long-term costs for both government and citizens.
Capital Expenditure in Union Budget 2023–24
Capital expenditure continues to be a key focus of the government.
Centre allocated ₹1.3 lakh crore as fifty-year interest-free loan to states for capital projects.
Capital investment outlay increased by 33% to ₹10 lakh crore (3.3% of GDP).
‘Effective Capital Expenditure’ estimated at ₹13.7 lakh crore (4.5% of GDP).
Indian Railways received ₹2.40 lakh crore – highest ever outlay, nine times higher than 2013–14 allocation.
New infrastructure projects:
50 additional airports, heliports, water aerodromes, and advanced landing grounds to improve regional connectivity.
Urban Infrastructure Development Fund (UIDF) created using priority sector lending shortfall, to support urban infrastructure.
| Type of Spending | Examples |
|---|---|
| Infrastructure | Roads, bridges, airports, railways |
| Assets | Land, machinery, government buildings |
| Investments | Shares, equity in companies |
| Loans | Loans to states and foreign governments |
| Repayment | Repaying government borrowings |
Prelims tips
- Capital expenditure = Asset creation or liability reduction.
- Unlike revenue expenditure, it has long-term developmental impact.
- Budget 2023–24 gave record outlay to Indian Railways (₹2.40 lakh crore).
- Effective Capital Expenditure = Direct outlay + loans to states (₹13.7 lakh crore, 4.5% of GDP).
Mains points
- Capital expenditure is essential for infrastructure development and long-term growth.
- It helps attract private investment and enhances productivity across sectors.
- Union Budget 2023–24 focused heavily on capital spending, highlighting infrastructure revival and connectivity projects.
- Increased capital expenditure can improve government revenues indirectly through economic growth.
- Balanced approach between capital and revenue expenditure ensures both short-term welfare and long-term development.
Budget Deficit and its Types
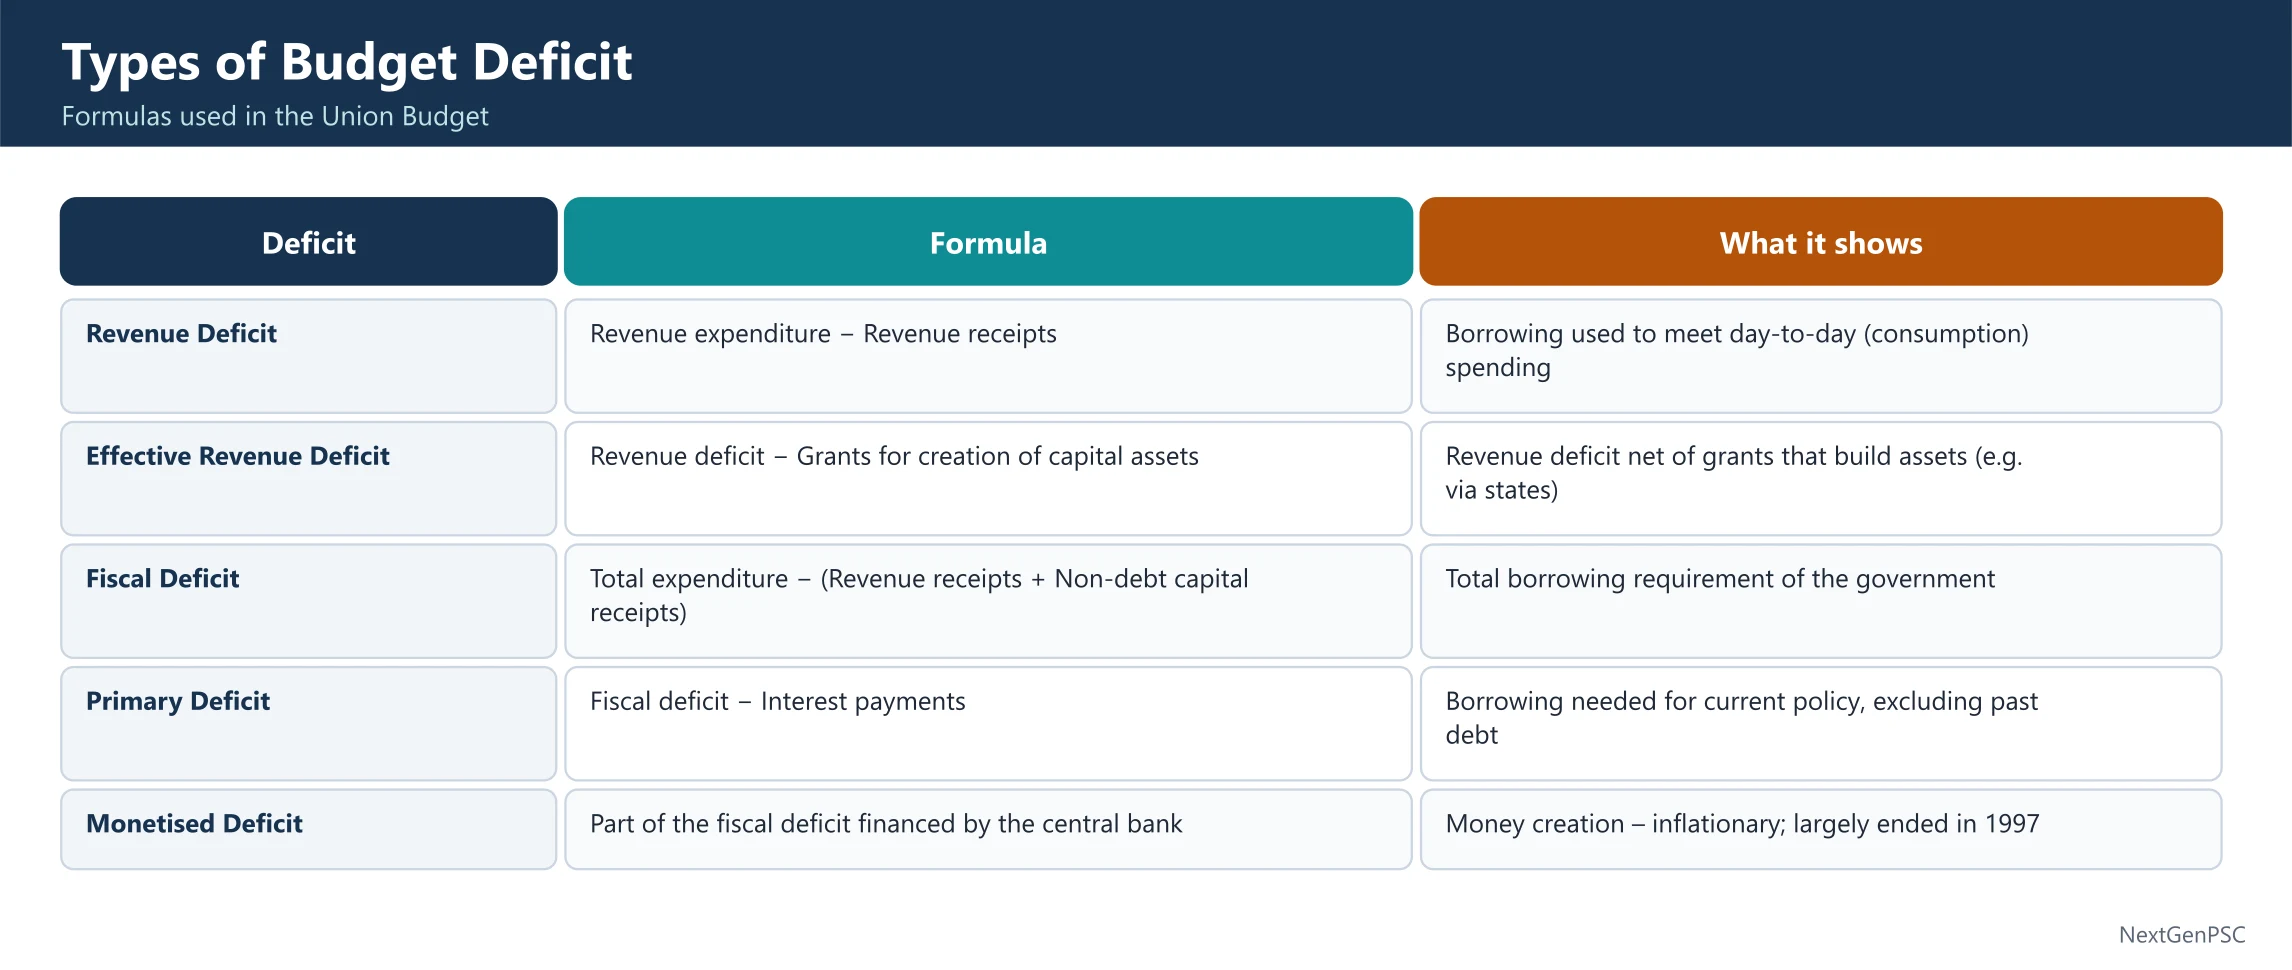
A budget deficit occurs when the government’s total expenditure exceeds its total receipts. It indicates that the government is spending more than it earns. There are different types of budget deficits such as Revenue Deficit, Effective Revenue Deficit, and Fiscal Deficit. Each type highlights different aspects of imbalance between government income and expenditure.
What is Budget Deficit?
A situation where government’s expenditure is greater than its receipts.
Shows mismatch between resources collected (like taxes, fees, non-tax revenues) and money spent.
Indicates financial pressure on government and need to borrow or adjust its policies.
Types of Budget Deficits
1. Revenue Deficit
Refers to excess of revenue expenditure over revenue receipts.
Formula: Revenue Deficit (RD) = Total Revenue Expenditure (RE) – Total Revenue Receipts (RR).
Implies that government is unable to cover its routine expenses from its regular income.
Key Concerns:
Leads to more borrowing and increases debt burden.
Reduces government’s capacity to spend on social programs (education, health, welfare).
Can create inflationary pressure if financed by printing money.
Negatively impacts economic growth due to reduced spending on infrastructure.
Can result in poor international credit rating, making borrowing costlier.
Solutions: Reduce expenditure, increase revenue receipts through taxes and non-tax sources.
2. Effective Revenue Deficit
Difference between revenue deficit and grants used for creation of capital assets.
Formula: Effective Revenue Deficit = Revenue Deficit – Grants for creation of capital assets.
Introduced in Union Budget 2011–12 on recommendation of Rangarajan Committee.
Purpose: Grants to states used for building assets should not be treated as wastage; hence deducted to get 'true' revenue deficit.
3. Fiscal Deficit
Represents overall shortfall in government finances.
Formula: Fiscal Deficit = Total Expenditure – (Revenue Receipts + Non-debt Capital Receipts).
Excludes borrowings from receipts because deficit itself has to be financed through borrowings.
Implications:
Creates Debt Trap: Continuous borrowing increases interest payments, which further increase deficits.
Leads to Inflation: Borrowings from RBI often mean printing new currency, which increases money supply.
Creates Foreign Dependency: Borrowing from international agencies makes country dependent on other economies.
Ways to Manage: Borrow from domestic sources (like banks, institutions) or external sources (like IMF, World Bank).
| Type | Definition | Formula | Key Implication |
|---|---|---|---|
| Revenue Deficit | Excess of revenue expenditure over revenue receipts | RE – RR | Indicates dissaving, borrowing needed for consumption |
| Effective Revenue Deficit | Revenue deficit minus grants used for capital assets | RD – Grants for capital assets | Shows 'true' deficit after excluding productive grants |
| Fiscal Deficit | Total expenditure minus total receipts (excluding borrowings) | TE – (RR + Non-debt CR) | Indicates overall borrowing needs and debt trap risk |
Prelims tips
- Revenue Deficit shows mismatch in day-to-day income and expenses.
- Effective Revenue Deficit concept introduced in Union Budget 2011–12.
- Fiscal Deficit is key indicator of overall financial health of government.
- High fiscal deficit often leads to inflation and debt trap.
Mains points
- Budget deficits highlight structural imbalances in government finance.
- Revenue Deficit reflects shortfall in meeting day-to-day obligations.
- Effective Revenue Deficit helps in identifying real wasteful expenditure by excluding productive grants.
- Fiscal Deficit is critical as it directly shows borrowing needs and overall debt sustainability.
- Reducing deficit requires balanced approach of cutting expenditure and boosting revenue.
Primary Deficit, Monetised Deficit and FRBM Act, 2003
Primary Deficit measures the excess of current year’s expenditure over receipts excluding past interest payments, Monetised Deficit shows how much of deficit is financed by RBI’s money printing, and the FRBM Act, 2003 aims to control fiscal deficit and ensure financial discipline in India.
Primary Deficit
Definition: The difference between fiscal deficit and interest payments on previous loans.
Formula: Primary Deficit = Fiscal Deficit – Interest Payments.
Meaning: It shows how much of the current year’s borrowing is being used for fresh expenses (not for paying old interest).
If primary deficit is low or zero: It means most of the government borrowing is only to pay interest on old loans, not for development or new projects.
Importance: Helps in understanding present year’s fiscal imbalance.
Monetised Deficit
Definition: The part of fiscal deficit financed directly by RBI, either by printing new money or using government’s account balance with RBI.
Formula: Monetised Deficit = Borrowings from RBI + Withdrawal from government’s cash balance with RBI.
Meaning: Simply put, it represents expansion of money supply by RBI to meet government’s deficit.
Concern: Monetisation can cause inflation as it increases money in circulation.
Fiscal Responsibility and Budget Management Act (FRBM), 2003
Objective: To ensure financial discipline, reduce fiscal deficit, and maintain macroeconomic stability in India.
Targets (as amended):
Reduce fiscal deficit to 3% of GDP by March 31, 2021.
Ensure Central Government debt does not exceed 40% of GDP by 2024-25.
Combined (Centre + States) debt should not exceed 60% of GDP.
Key Rule: No money can be borrowed or spent beyond the limits set by law, ensuring Parliament’s control.
Escape Clause: Allows temporary relaxation of deficit targets by 0.5% of GDP under emergencies like:
National security or war.
Agricultural collapse or natural disasters.
Structural economic reforms.
Sudden fall in economic growth.
Counter-cyclical Fiscal Policy: If economy slows down, government can borrow more to stimulate growth. If economy grows fast, government should reduce deficit.
Authority: Recommended by N.K. Singh Committee; ensures balanced use of fiscal flexibility.
| Concept | Definition | Formula / Rule | Key Implication |
|---|---|---|---|
| Primary Deficit | Excess of current expenditure over receipts (excluding past interest payments) | Fiscal Deficit – Interest Payments | Shows how much borrowing is for fresh spending, not past interest |
| Monetised Deficit | Part of deficit financed directly by RBI | Borrowings from RBI + Govt. balance drawdown | Represents money printing; can cause inflation |
| FRBM Act, 2003 | Law for fiscal discipline and deficit control | Limit FD to 3% of GDP; Debt: Centre 40%, Total 60% | Ensures sustainable borrowing with flexibility during crises |
Prelims tips
- Primary Deficit = Fiscal Deficit – Interest Payments.
- Monetised Deficit means RBI directly finances deficit (printing money).
- FRBM Act (2003) aims at limiting fiscal deficit to 3% of GDP.
- Escape Clause allows flexibility in emergencies like war, disasters, or reforms.
Mains points
- Primary Deficit is important for assessing fresh fiscal imbalance beyond old interest liabilities.
- Monetised Deficit highlights the risk of inflation when RBI prints money to cover government’s shortfall.
- FRBM Act brings legal framework for fiscal discipline, deficit targets, and sustainable debt management.
- Escape Clause ensures flexibility for government during economic shocks or emergencies.
- Together, these concepts are vital to understand India’s fiscal health and macroeconomic stability.
Fiscal Responsibility and Budget Management (FRBM) Act, 2003 — with 2024-25 Update
The FRBM Act aims to bring financial discipline by reducing deficits and debt. In FY 2024-25, India achieved a fiscal deficit of 4.8% of GDP, aligning with revised targets. The journey towards FRBM targets continues with updated metrics.
Overview (Revised)
The FRBM Act was enacted in 2003 to ensure responsible public finance management and control over borrowing.
It targets limiting the fiscal deficit, reducing revenue deficit, and maintaining debt at sustainable levels.
It includes an 'Escape Clause' to allow deviation during emergencies like war, disasters, or deep recessions.
Key Provisions
Fiscal Deficit Goal: Originally up to 3% of GDP, though deadlines and flexibility have changed via amendments.
Debt Limits: Aim was to cap central government debt at 40% of GDP and combined (Centre + States) debt at 60% of GDP by 2024-25.
Transparency: The government must lay several documents with the Budget — like Medium Term Fiscal Policy Statement, Fiscal Policy Strategy Statement, Macro-Economic Framework — and after the Budget, a Medium-Term Expenditure Framework.
Amendments to Date
Amended in 2004, 2012, 2015, and 2018. The 2018 amendment was especially significant — it added escape clauses and revised timelines.
NK Singh Committee Recommendations (2017)
Use debt-to-GDP ratio as the main anchor for fiscal policy (Centre: 40%, States: 20% by 2023).
Set up an independent Fiscal Council to monitor compliance.
Borrowing from RBI should be restricted, allowed only under strict conditions (short-term needs or secondary market operations).
Specify clear conditions under which deviation from targets is permitted (war, calamity, reforms, etc.).
Effectiveness & Challenges
Early Success: The Act helped reduce fiscal deficit from 5.8% of GDP in 2002-03 to ~2.6% in 2007-08.
Challenges: Post-pandemic debt levels surged above FRBM target ranges; states often miss targets due to populist fiscal choices; escape clauses used frequently.
2024-25 Data & Performance
Fiscal Deficit (Revised Estimate): ₹15,64,827 crore, which is 4.8% of GDP.
Revenue Deficit (Revised Estimate): ₹6,10,098 crore, ~1.9% of GDP.
Primary Deficit (Revised Estimate): ₹4,31,587 crore, ~1.3% of GDP.
Effective Revenue Deficit (Revised): ₹3,10,207 crore, ~1.0% of GDP.
Borrowing Components: Net debt receipts ₹15,17,576 crore; market borrowings and short-term borrowings are key parts.
Budget Estimates 2025-26 (as projection)
Fiscal Deficit target: 4.4% of GDP.
Revenue Deficit target: ~1.5% of GDP.
Outstanding Liabilities (Debt-to-GDP for Centre): ~56.1% of GDP.
Gross market borrowings in 2025-26 estimated at ₹14.82 lakh crore.
Capital expenditure for 2025-26 expected at ₹11.21 lakh crore (≈ 3.1% of GDP).
| Indicator | FY 2023-24 (Actual / BE) | FY 2024-25 (Revised / Actual) | FY 2025-26 (Target / BE) |
|---|---|---|---|
| Fiscal Deficit (% of GDP) | 5.9% (BE) | 4.8% (RE) | 4.4% (Target) |
| Revenue Deficit (% of GDP) | 1.8% (BE) | 1.9% (RE) | 1.5% (Target) |
| Primary Deficit (% of GDP) | 1.4% (BE) | 1.3% (RE) | 0.8% (Target) |
| Central Govt Debt-to-GDP | — | ~56.1% (Projected) | — |
| Aspect | Details |
|---|---|
| Year of Enactment | 2003 |
| Main Objective | Ensure fiscal discipline, reduce deficits, and promote transparency |
| Targets | Fiscal deficit 3% of GDP, Debt-to-GDP ratio Centre 40%, States 20% |
| Amendments | 2004, 2012, 2015, 2018 (major changes in targets and timelines) |
| Escape Clause | Allows deviation in case of war, crisis, economic slowdown |
| NK Singh Committee | Recommended debt-to-GDP as anchor, Fiscal Council, strict limits on borrowing |
Prelims tips
- In FY 2024-25, India achieved a fiscal deficit of 4.8% of GDP.
- Revenue deficit in 2024-25 was ~1.9% of GDP, primary deficit ~1.3%.
- Target for FY 2025-26 fiscal deficit is 4.4% of GDP.
Mains points
- 2024-25 data shows significant progress towards fiscal consolidation under FRBM framework.
- Maintaining debt sustainability is as important as reducing deficits.
- Challenges persist: ensuring enough revenue, curbing non-productive expenditure, and avoiding overuse of escape clauses.
- The roadmap for 2025-26 and beyond needs consistency with FRBM goals and realistic growth assumptions.
- Recent metrics help evaluate how close India is to long-term debt targets and guide policy corrections.
Deficit Financing (India) — History, Methods, Pros & Cons
Deficit financing means meeting the government’s excess spending (expenditure > receipts) by using outside resources. India historically used central bank money creation (till 1997) and now mainly uses borrowing (market loans, small savings, external loans) and temporary cash support via Ways and Means Advances (WMA).
Overview
What it is: When the Union/State budget shows a gap (spending > receipts), the gap is financed using different tools. This practice is called ‘deficit financing’.
Why it happens: Development needs (roads, rail, health, education), welfare programs and cyclical slowdowns often push spending above regular revenues.
How it is seen today: Under modern fiscal rules, the government primarily borrows (instead of printing money) and uses cash-management lines like WMA from RBI.
Historical Journey (Pre-1997 to Now)
1950s–1997: Monetised deficit was common—government issued ad-hoc Treasury Bills to RBI; RBI created new money. This raised money supply and, at times, inflation.
1980s stress: Fiscal deficit averaged ~6.6% in the 1980s; deficit financing’s share rose (e.g., ~17% in the 7th Plan), contributing to macro stress and the 1991 crisis.
1997 Reform: Ad-hoc T-Bills were abolished. A new system—Ways and Means Advances (WMA)—was adopted: only short-term, capped, and time-bound support from RBI to smooth cash mismatches, not to fund long-term deficits.
Post-2003: FRBM Act tightened discipline—emphasis on market financing, transparency, and limiting monetisation except in rare emergencies (escape clauses).
Current Practice: How Deficits Are Financed
Internal Borrowings: Dated government securities (G-Secs), Treasury Bills, small savings (PPF, NSC), provident funds, etc.
External Borrowings: Multilateral/bilateral loans, limited sovereign external debt. External share remains relatively low to reduce currency risk.
WMA/Overdraft with RBI: Short-term bridge for cash-flow mismatches (not a permanent source).
Disinvestment & Asset Monetisation: Non-debt receipts that reduce borrowing needs (sell stake/lease public assets).
Crowd-ing Out vs. Growth Push
Internal borrowing can push up interest rates and ‘crowd out’ private borrowers if very large—making corporate/household loans costlier.
But well-targeted capital spending (infra) financed by borrowing can raise long-term growth, private investment and future tax revenues.
External Borrowing: For & Against
Arguments For:
– Frees domestic savings for private sector (less pressure on local rates).
– Can set international benchmarks (helps Indian firms borrow abroad).
– Diversifies investor base and can discipline finances (markets watch closely).
Arguments Against:
– Exchange-rate risk: If INR weakens, repayment cost in rupees jumps.
– Global spillovers: Sudden stops or risk-off cycles can tighten funding.
– Stronger INR (due to large inflows) can hurt exports’ price competitiveness.
– ‘Addiction risk’: Future governments may rely too much on foreign debt.
Simple, Beginner-Friendly Examples
Example 1 (Internal loan): Govt issues ₹100 of G-Secs to build a highway. Today’s debt rises by ₹100; tomorrow’s growth and tolls can raise revenues to service it.
Example 2 (External loan): Govt borrows 1 at ₹70/ (=₹70). If INR later is ₹80/, repaying 1 costs ₹80—₹10 extra purely due to currency movement.
Example 3 (WMA): Tax inflows arrive next week but salaries are due today; RBI gives short-term WMA (like an overdraft). Govt repays when taxes come in.
Linking to Fiscal Indicators
Fiscal Deficit: Total spending minus total non-borrowed receipts; equals net borrowing need.
Primary Deficit: Fiscal deficit minus interest payments—tells how much current policy (excluding past debt interest) adds to borrowing.
Monetised Deficit (historic idea): Increase in RBI credit to government—now constrained to avoid inflation.
Good Practices for Safer Deficit Financing
Use more for capital (assets) than revenue (consumption) spending.
Keep external debt share moderate; hedge currency risk when feasible.
Strengthen tax base and non-tax revenues to lower persistent gaps.
Maintain credible fiscal glide path (targets published and met).
Improve cash management (accurate forecasts reduce expensive last-minute borrowing).
| Phase/Tool | What It Meant | Impact/Risk | Today’s Status |
|---|---|---|---|
| Ad-hoc Treasury Bills (Pre-1997) | RBI directly funded govt by creating money | Higher money supply, inflation risk; weak monetary autonomy | Abolished in 1997 |
| Ways & Means Advances (WMA) | Short-term, capped overdraft from RBI to manage cash gaps | Bridges timing mismatch; not for long-term funding | Active—rules/caps apply |
| Internal Borrowing (G-Secs, T-Bills) | Market loans from banks, funds, households | Large borrowings may crowd out private sector | Primary source |
| Small Savings/Provident Funds | Household savings mobilised via schemes | Higher cost than market at times; stable base | Supplementary source |
| External Borrowing | Loans in foreign currency from multilaterals/markets | FX risk; global cycles matter; can diversify | Limited share, used prudently |
| Disinvestment/Asset Monetisation | Sell/lease govt assets to raise non-debt receipts | Market-timing risk; execution complexity | Used to reduce borrowing need |
| Term | Plain Meaning | Why It Matters |
|---|---|---|
| Fiscal Deficit | Spending minus non-borrowed receipts | Equals net borrowing need |
| Primary Deficit | Fiscal deficit minus interest payments | Shows current policy gap excluding past debt costs |
| Monetised Deficit | Increase in RBI credit to govt | Inflation risk; now constrained |
| Crowding Out | Govt borrowing pushes up interest rates | Private loans become costlier |
| WMA | Short-term RBI overdraft to govt | Smoothens cash timing; not for long-term |
Prelims tips
- Deficit financing ≠ only money printing; in India it mainly means borrowing (post-1997).
- Ad-hoc T-Bills ended in 1997; WMA is only a short-term bridge.
- Crowding-out: Large govt borrowing can raise interest rates and squeeze private credit.
- External borrowing carries FX risk; a weaker INR makes repayment costlier.
Mains points
- Critically evaluate India’s shift from monetised deficits to market borrowing—benefits (discipline, transparency) vs costs (crowding-out).
- Discuss how well-targeted capital expenditure can justify borrowing by raising growth and future revenues.
- Examine prudential limits for external debt and the role of currency risk management.
- Assess WMA’s design: adequate cash-buffer without diluting monetary policy independence.
- Link deficit financing choices to FRBM glide path, inflation control, and debt sustainability.
Monetization of Deficit
Monetization of deficit means financing the government’s fiscal deficit by printing new money (non-debt financing) rather than borrowing, so that public debt does not rise. In practice, this involves the central bank (RBI in India) creating money to meet government expenditure. It can be done either directly (RBI prints money and buys bonds directly from government) or indirectly (RBI buys bonds from secondary market via Open Market Operations).
What is Monetization of Deficit?
It is a method of financing fiscal deficit without creating debt to be repaid later.
Means RBI creates fresh money and provides it to the government by buying its bonds.
Called a form of 'non-debt financing' because debt stock does not increase.
Methods of Monetization
Direct Monetization: RBI directly buys government bonds in the primary market and prints new money to pay for them. Practiced in India till 1997.
Indirect Monetization: RBI purchases government bonds in the secondary market through Open Market Operations (OMOs), injecting liquidity indirectly.
History in India
Till 1997: Direct monetisation was common; RBI automatically financed deficits by issuing ad-hoc Treasury Bills to government.
1994 & 1997: Agreements signed between RBI and Government to phase out this system.
FRBM Act, 2003: Banned RBI from directly subscribing to government securities from April 1, 2006. RBI could only buy in secondary market via OMOs.
Present Status
Direct monetisation is banned under normal conditions to ensure RBI independence and inflation control.
However, FRBM escape clauses (post NK Singh Committee) allow direct monetisation in exceptional events: national security threats, war, agricultural collapse, deep recession (output fall of >3% from average of previous 4 quarters), or major structural reforms.
Key Differences: Direct vs Indirect
Both increase money supply and may trigger inflation.
In OMOs: RBI controls timing and amount of liquidity injection as part of monetary policy.
In Direct Monetisation: Government dictates amount and timing, undermining RBI independence and inflation management.
Risks and Concerns
Inflation: More money chasing same goods pushes prices up.
Fiscal Dominance: Government borrowing dictates money supply, reducing RBI autonomy.
Loss of Investor Confidence: Frequent monetisation can lead to fear of uncontrolled inflation, affecting credit ratings and investment.
Long-Term Dependence: If used repeatedly, governments may avoid fiscal discipline.
Simple Example for Beginners
Direct Monetisation: Govt needs ₹1,000 crore. RBI prints new notes and buys govt bonds worth ₹1,000 crore. No debt stock rises, but money supply jumps.
Indirect Monetisation: Govt issues bonds to public; RBI later buys same bonds from banks/investors in secondary market, injecting liquidity gradually under its control.
| Aspect | Direct Monetisation | Indirect Monetisation (OMO) |
|---|---|---|
| Who decides money supply? | Government decides (borrowing need) | RBI decides (monetary policy) |
| Market Involvement | No – RBI buys directly from govt | Yes – RBI buys from investors in secondary market |
| Risk of Inflation | High, uncontrolled by RBI | Moderate, controlled by RBI |
| Status in India | Stopped in 1997, allowed only in emergencies | Regular tool of monetary policy |
| Impact on RBI Independence | Reduced | Maintained |
Prelims tips
- Monetisation of deficit = central bank printing money to fund govt, not borrowing.
- Direct monetisation stopped in 1997; FRBM Act 2003 bars RBI from buying govt bonds directly.
- Escape clause allows direct monetisation in emergencies like war, crisis, deep recession.
- OMOs are indirect monetisation and part of normal monetary policy.
Mains points
- Discuss merits and risks of direct deficit monetisation in India.
- Examine why FRBM Act barred RBI from direct monetisation and its impact on inflation control.
- Evaluate whether OMOs can substitute direct monetisation without destabilising markets.
- Critically analyse NK Singh Committee’s escape clause provisions allowing direct monetisation.
- Debate whether India should consider temporary direct monetisation in extraordinary events like COVID-19.
Impact of Deficit Financing & Public Debt
Deficit financing refers to covering government expenditure by printing new money or borrowing, which can cause inflation, affect investments, increase inequalities but also support capital formation. Public debt is the total amount borrowed by the government, both internal and external, to meet its expenditure needs. While classical economists opposed it, Keynes argued that debt-financed spending can generate employment and growth.
Impact of Deficit Financing
Inflationary Pressure: Printing more currency increases money supply, pushing up demand and prices of goods and services. More money chasing same goods leads to inflation.
Effect on Investments: Inflation makes employees demand higher wages. Rising wages increase production costs, discouraging investors from investing further.
Capital Formation: Inflation benefits producers (higher profits) more than fixed-income earners. Producers save more, leading to higher community savings. These savings can be used for investment and capital formation, driving long-term economic growth.
Social Inequalities: Inflation caused by deficit financing worsens inequality. Rich producers gain more wealth, while poor fixed-income earners lose purchasing power. Thus, 'rich become richer, poor become poorer'.
Public Debt – Meaning
Public debt is the total liabilities of the Central Government, including borrowing from internal and external sources.
Includes debt against Consolidated Fund of India and liabilities in Public Account.
Issued through short-term Treasury Bills and long-term Government Bonds. States issue bonds called State Development Loans (SDLs).
India has reduced dependence on foreign debt over the years and relies more on internal borrowing.
Historical Perspectives
Classical Economists (Adam Smith, Ricardo, Malthus): Opposed public debt, considered it wasteful as it drains private resources for unproductive public spending.
Keynesian View: Advocated borrowing during recessions to increase government spending. Debt-funded spending can mobilize savings, create demand, generate employment, and help recover from economic depressions. Applied successfully in 1930s Great Depression and 2008 financial crisis.
Sources of Public Debt
Internal Debt: Loans raised domestically through market instruments (bonds, treasury bills), non-market borrowings (National Small Savings Fund), or financial corporations.
External Debt: Borrowings from international institutions like World Bank, IMF, IDA, IFC, etc., usually for developmental projects. Must be repaid in foreign currency.
Why Public Debt is Needed
Taxation Limit: Government cannot keep raising taxes beyond a point due to the Laffer Curve effect. Higher tax rates can reduce overall tax revenue as people avoid taxes.
Budget Deficit: When revenue falls short, borrowing helps fill the gap.
Emergency Situations: In crises like COVID-19, war, or economic slowdown, tax revenues fall but expenditure rises. Public debt helps meet essential spending.
Laffer Curve – Simple Explanation
Shows relationship between tax rates and tax revenue.
If tax rates are too high, tax revenue falls because people evade taxes or stop working productively.
If tax rates are reasonable, more people pay taxes honestly, and government revenue can increase.
| Type | Details |
|---|---|
| Internal Debt | Borrowed within country via bonds, treasury bills, savings funds, financial institutions. |
| External Debt | Borrowed from World Bank, IMF, IDA, IFC etc., repayable in foreign currency. |
| Short-term | Treasury bills (less than 1 year). |
| Long-term | Government bonds and State Development Loans (SDLs). |
Prelims tips
- Deficit financing increases inflation and inequality but can aid capital formation.
- Public debt = total liabilities of Central Govt including internal + external borrowings.
- FRBM Act reduced direct monetisation of deficits post-2003.
- Laffer Curve shows that very high taxes reduce revenue due to evasion.
Mains points
- Analyse both positive and negative impacts of deficit financing in India.
- Discuss how public debt can be productive if used for capital formation (infrastructure, investment).
- Examine India’s strategy of reducing foreign debt dependence and its benefits.
- Critically analyse Keynesian vs Classical views on public debt.
- Explain how Laffer Curve guides limits on taxation and need for public borrowing.
Different Aspects of Public Debt
Public debt is a double-edged sword. On one hand, it helps finance infrastructure, education, health, and technology, thereby supporting economic growth. On the other, excessive debt can fuel inflation, burden future generations with taxes, and reduce private investment. India’s debt-to-GDP ratio remains lower than global averages, showing resilience, though fiscal prudence is essential.
Positive Aspects of Public Debt
Since 1930s, public debt has become a regular tool of fiscal policy.
Financing Infrastructure: Governments borrow to build roads, ports, power plants, etc. Such projects create a multiplier effect by generating employment, reducing transport costs, and attracting further investments.
Technology & Skills: Debt-financed investments in modern technology improve efficiency and upgrade labour skills.
External Loans: Borrowing from abroad helps strengthen foreign exchange reserves, enabling imports of critical goods and services.
Revenue-Expenditure Gap: Debt bridges mismatch between government’s expected revenue and planned expenditure.
Public Services: Debt is also used for funding education, health, and welfare services, which improve human development.
Negative Aspects of Public Debt
Inflation: Borrowed money spent on projects or welfare schemes increases money supply, raising demand and prices of goods/services.
Example: MNREGA was linked to rising rural wages and double-digit inflation (2008–2012).
Unproductive Welfare Schemes: Public debt may fund welfare schemes that lack economic returns. Over time, they become a burden on taxpayers.
Burden on Future Generations: Loans taken today must be repaid tomorrow, leaving less fiscal space for future capital expenditure.
Sovereignty Issues: Foreign debt can come with conditions. Countries risk compromising their sovereignty when unable to repay.
Example: Sri Lanka leased Hambantota Port to China for 99 years due to debt repayment failure, known as China’s 'Debt Trap'.
Crowding Out Effect: High public debt increases interest rates (risk premium), discouraging private investment and slowing GDP growth.
India’s Public Debt Situation
Global Level:
Economic Survey 2022–23: India’s general government debt-to-GDP ratio rose modestly from 81% in 2005 to ~84% in 2021.
Global average debt-to-GDP: 248%.
Major Economies: US (264%), UK (257%), France (345%), Japan (426%), China (295%).
India remains lower with debt-to-GDP ~170%.
Debt Composition in India: Household debt = 36% of GDP, Non-financial private sector debt = 88%, Government debt = 82%.
Global Averages: Household debt = 62%, Private non-financial companies = 160%. India is below these averages.
Central Level:
Union Government liabilities declined from 59.2% of GDP in FY21 to 56.7% in FY22.
Public debt-to-GDP peaked at 100.86% in 2020 (due to COVID spending) compared to 76.86% in 2014, RBI data shows.
| Aspect | Details |
|---|---|
| Positive Impact | Funds infrastructure, education, health; creates jobs; improves technology and skills; strengthens forex reserves. |
| Negative Impact | Causes inflation; burdens future taxpayers; risks sovereignty with external loans; crowds out private investment. |
| Country | Debt-to-GDP Ratio |
|---|---|
| India | 170% (2021) |
| United States | 264% |
| United Kingdom | 257% |
| France | 345% |
| Japan | 426% |
| China | 295% |
| Global Average | 248% |
Prelims tips
- India’s debt-to-GDP ratio is modest compared to global averages.
- Sri Lanka’s Hambantota port case is an example of debt-trap diplomacy.
- Public debt can cause 'crowding out effect' reducing private investment.
- Laffer Curve explains why tax increases have limits and borrowing becomes necessary.
Mains points
- Evaluate both positive and negative impacts of public debt in India.
- Discuss how public debt can be productive when invested in infrastructure and human capital.
- Critically analyze risks of foreign debt and debt-trap diplomacy.
- Examine India’s relatively stable debt-to-GDP ratio compared to global economies.
- Assess long-term sustainability of India’s fiscal policy in context of rising debt post-COVID.
Reasons for Higher Public Debt in India and Sustainability Measures
India’s public debt is high due to factors like bank recapitalisation, low tax-to-GDP ratio, and loopholes in the tax system. To ensure debt sustainability, India must privatise loss-making PSUs, improve tax collection through GST expansion, adopt public-private partnerships, and invest in infrastructure and human capital. The FRBM Act sets a long-term target of reducing debt-to-GDP ratio to 60% (40% Centre + 20% States).
Reasons for Higher Public Debt in India
Bank Recapitalisation: In 2017–18, ₹80,000 crore recapitalisation bonds were issued to support state-run banks, raising government debt levels.
Low Tax-to-GDP Ratio: Although India’s national income has multiplied since independence, the gross tax-to-GDP ratio is still low (~10.2% in 2021). In BE 2023–24, the ratio was only 11.1%, comparable to RE 2022–23.
Imperfect Tax System: Tax evasion is widespread due to loopholes and inefficiencies in India’s tax system, reducing government revenue.
Achieving Debt Sustainability in India
Privatisation: Loss-making PSUs such as Air India should be privatised to reduce government burden. Adopt the principle of 'minimum government, maximum governance'.
FRBM Act 2003: Mandates fiscal consolidation and macroeconomic sustainability through prudent debt management and monetary policy.
Public Financial Management System (PFMS): Should be used more effectively for transparency and accountability.
Public-Private Partnerships (PPP): Encouraged in social schemes and infrastructure projects to reduce debt reliance.
Infrastructure and Human Capital Investment: Long-term growth requires strong investment in transport, education, health, and skills.
GST Expansion: Harmonising GST and extending it to more sectors will improve the tax-to-GDP ratio.
Investor-Friendly Environment: Policies should encourage foreign and domestic investors, creating alternative financing sources and reducing debt dependency.
Debt-to-GDP Ratio
Definition: Ratio of total public debt to the country’s gross domestic product, indicating a nation’s ability to repay its debt.
Higher Ratio: Means greater risk of default and weaker repayment capacity.
FRBM Act Target: 60% combined debt-to-GDP ratio – with 40% for Centre and 20% for States.
| Reason | Explanation |
|---|---|
| Bank Recapitalisation | ₹80,000 crore recapitalisation bonds in 2017–18 raised debt levels. |
| Low Tax-to-GDP Ratio | Tax-to-GDP ratio is around 10–11%, much lower than global peers. |
| Imperfect Tax System | High tax evasion due to loopholes reduces revenue collection. |
| Entity | Target Ratio |
|---|---|
| Central Government | 40% of GDP |
| State Governments | 20% of GDP |
| Combined (Centre + States) | 60% of GDP |
Prelims tips
- Bank recapitalisation bonds (₹80,000 crore in 2017–18) raised India’s debt.
- India’s tax-to-GDP ratio remains ~11%, lower than many countries.
- FRBM Act mandates debt-to-GDP ratio at 60% (40% Centre, 20% States).
- Privatisation and GST expansion are key for debt sustainability.
Mains points
- Analyze structural reasons behind India’s higher debt such as bank recapitalisation and low tax base.
- Discuss measures like PSU privatisation, GST expansion, and PPPs to reduce debt burden.
- Evaluate role of FRBM Act in maintaining debt sustainability.
- Explain importance of improving tax-to-GDP ratio for fiscal health.
- Critically assess whether India’s debt trajectory is sustainable post-COVID.
Recent Changes in Indian Budgeting
In recent years, India has made important changes to the budgeting process such as advancing the Union Budget presentation to February 1 and merging the separate Railway Budget with the Union Budget. These reforms aim to improve efficiency, speed up infrastructure projects, and present a holistic financial picture of the government.
Advancement of the Budget Presentation
Earlier, Union Budget was presented on 28 February every year.
Since 2017–18, it is presented on 1 February every year (advanced by 27 days).
Advantages of Early Budget
Budget process takes ~2 months. Earlier, the government used Vote on Account to get funds for first 2 months.
Now, with early presentation, budget process finishes before April 1, eliminating need for Vote on Account.
State governments get more time to plan and utilise funds.
Longer investment window reduces delays in infrastructure projects. Earlier, projects were delayed due to late budget approval in June and monsoon season.
Disadvantages of Early Budget
Lack of comprehensive data: Budget is now prepared with only 6 months of revenue and expenditure data instead of 9 months.
Planning becomes difficult due to reliance on incomplete trends and uncertainty about monsoon forecasts.
Merger of Railway Budget with Union Budget
Railway Budget was merged with Union Budget from FY18 (recommendation of Bibek Debroy Committee).
Earlier, Railway Budget was separated in 1924 as it formed 84% of total budget.
Now, Railways form less than 15% of Union Budget, so merger became practical.
Advantages of Merger
Provides holistic picture of government’s finances.
Facilitates multimodal transport planning (railways, roads, waterways) through initiatives like PM Gatishakti.
Improves efficient use of resources for both Railways and Union Government.
Railways no longer need to pay dividends to Government revenues.
Finance Ministry has more flexibility for mid-year review and capital expenditure allocation.
Disadvantages of Merger
Risk of Railways losing its commercial character, becoming like any other government department.
Populist decisions (e.g., not increasing passenger fares) may reduce revenue.
If general budget revenue falls, Railways may face similar cuts in its allocated funds.
| Reform | Advantages | Disadvantages |
|---|---|---|
| Advancement of Budget (2017) | Eliminates Vote on Account; More time for states; Faster project execution | Incomplete revenue/expenditure data; Uncertain monsoon impact |
| Merger of Railway Budget (2017–18) | Holistic financial picture; Better resource allocation; No dividend burden on Railways | Railways may lose commercial nature; Revenue cuts if budget shortfalls occur |
Prelims tips
- Budget presentation advanced from 28 Feb to 1 Feb (since 2017).
- Railway Budget merged with Union Budget in 2017–18.
- Bibek Debroy Committee recommended merger of Railway Budget.
- Early budget removes Vote on Account system.
Mains points
- Discuss rationale behind advancing the Union Budget date and its impact on fiscal planning.
- Critically examine pros and cons of merging the Railway Budget with the Union Budget.
- Explain how early budget helps in efficient fund utilisation by states.
- Analyze risks of incomplete data in early budget formulation.
- Evaluate whether merger diluted Railways’ autonomy or improved efficiency.
Ending of Plan and Non-Plan Classification in Budgeting
From 2017–18, the Government of India ended the distinction between Plan and Non-Plan expenditure. All expenditure is now classified as either Revenue or Capital spending. This reform was aimed at simplifying budgeting, improving transparency, and linking expenditure more directly to outcomes.
Background
Plan vs Non-Plan classification was introduced in the First Five-Year Plan (1951).
Plan expenditure: Spending decided by Planning Commission for development projects and schemes.
Non-Plan expenditure: All other spending such as salaries, pensions, subsidies, maintenance of assets, interest payments, defense, etc.
Over time, this created confusion and inefficiency in budgeting.
Rationale for Ending Classification (2017–18 onwards)
Planning Commission was dismantled in 2014 and replaced by NITI Aayog, making the old system irrelevant.
Misconception: Plan expenditure was wrongly seen as 'developmental' while Non-Plan was considered 'non-developmental'.
Bias towards Plan expenditure led to neglect of crucial items like maintenance, salaries, and pensions.
Fragmentation of resources: Separate allocation of Plan and Non-Plan made it difficult to assess true cost of delivering services.
Merging Plan and Non-Plan into Capital and Revenue spending makes budgeting more transparent and outcome-oriented.
New Classification System
Revenue Expenditure: Expenditure that does not create assets or reduce liabilities (e.g., salaries, subsidies, interest payments, pensions).
Capital Expenditure: Expenditure that creates assets or reduces liabilities (e.g., infrastructure projects, loans to states, repayment of debt).
This reclassification helps in better tracking of how government spending impacts long-term development and economic growth.
Significance
Simplifies budget structure and makes it easier to understand for policymakers, economists, and citizens.
Helps link outlays (money spent) to outcomes (results achieved).
Brings focus on quality of expenditure instead of just quantum of expenditure.
Allows for better fiscal discipline and accountability by removing artificial categories.
| Old Classification | New Classification | Issues Resolved |
|---|---|---|
| Plan Expenditure | Capital Expenditure | Removes bias, tracks asset creation |
| Non-Plan Expenditure | Revenue Expenditure | Removes misconception of 'non-developmental' spending |
Prelims tips
- Plan vs Non-Plan classification ended from FY 2017–18.
- Now expenditures are divided into Revenue and Capital spending.
- This change followed dismantling of Planning Commission.
- Helps link expenditure to outcomes more clearly.
Mains points
- Explain the historical background of Plan and Non-Plan expenditure classification.
- Critically examine problems with old classification system such as bias and fragmentation of resources.
- Discuss rationale behind switching to Capital and Revenue expenditure system.
- Analyze how the new system improves transparency and fiscal discipline.
- Examine impact on linking outlays with outcomes.
Rationalisation of Centrally Sponsored Schemes (CSS)
Centrally Sponsored Schemes (CSS) are those schemes where both the Central Government and the State Governments share the cost of implementation. They aim to supplement the efforts of state governments, ensure uniform development across regions, and address issues that fall under the State List but need central support. Rationalisation means reducing duplication, categorising schemes into Core, Core of Core, and Optional, and ensuring better cooperation under the spirit of Cooperative Federalism.
Overview
CSS are financed jointly by Centre and States, with funding ratios such as 50:50, 60:40, 70:30, 75:25, or 90:10 (for North-Eastern and hilly states).
While the Central Government provides a larger share, implementation is done by states or their agencies.
CSS usually deal with matters listed in the State List of the Constitution but are supported by the Centre due to larger resource availability.
Example: MGNREGA (Mahatma Gandhi National Rural Employment Guarantee Act).
Funding Pattern
General ratio: 60% Centre : 40% States.
For special category states (North-Eastern & Himalayan): 90% Centre : 10% State.
In some schemes: 80% Centre : 20% State.
Classification (as per Union Budget 2016–17)
Core Schemes: Developmental schemes under National Development Agenda requiring joint Centre-State action (e.g., PM Gram Sadak Yojana, Green Revolution).
Core of Core Schemes: Schemes focusing on social protection and social inclusion; fully funded by Centre (e.g., Umbrella scheme for development of SCs, Minorities).
Optional Schemes: States may choose which schemes to implement; Centre allocates lump sum funds (e.g., Border Area Development Programme).
Significance
Ensures balanced development by implementing welfare and development schemes across states.
Provides states with additional funds, expertise, and resources from Centre.
Helps address national priorities with regional implementation flexibility.
Criticism
Sometimes overlap with state responsibilities, leading to inefficiency.
Rigid design leaves little flexibility for states.
Declining allocations cause financial stress for states.
Excessive central intervention may weaken federalism.
Rationalisation Efforts
Sub-Group of Chief Ministers formed under NITI Aayog (2015).
Recommended limiting total number of CSS to around 30.
Schemes divided into Core and Optional categories.
Core schemes to focus on national development priorities in the spirit of Team India.
Social protection and inclusion programmes should form Core of Core.
| Category | Details | Examples |
|---|---|---|
| Core Schemes | Joint Centre-State schemes under National Development Agenda | PM Gram Sadak Yojana, Green Revolution |
| Core of Core | Fully funded by Centre, focus on social protection & inclusion | Umbrella Scheme for SCs, Minorities |
| Optional Schemes | States can choose; lump sum funds allocated | Border Area Development Programme |
Prelims tips
- CSS are joint Centre-State schemes with shared funding.
- Funding ratios vary: 60:40, 80:20, 90:10 (special states).
- Union Budget 2016–17 classified them into Core, Core of Core, and Optional.
- NITI Aayog recommended reducing total CSS to 30 schemes.
Mains points
- Discuss the role of CSS in promoting cooperative federalism.
- Critically examine challenges such as rigidity, declining funds, and overlap with state functions.
- Explain the rationale for rationalisation and NITI Aayog’s recommendations.
- Evaluate how rationalisation improves efficiency and reduces duplication.
- Suggest reforms for better balance between Union priorities and State flexibility.
Rationalisation of Centrally Sponsored Schemes (CSS)
Centrally Sponsored Schemes (CSS) are programmes designed by the Central Government but implemented by States. Over the years, their number grew very large, leading to duplication, overlapping responsibilities, and wastage of money. To fix this, different committees (like the Chaturvedi Committee) and the 15th Finance Commission recommended reducing, merging, and simplifying these schemes. Recent Union Budgets have rationalised schemes into fewer umbrella schemes, so that resources are used more effectively and benefits reach people faster.
What are Centrally Sponsored Schemes?
CSS are programmes in which the central government provides most of the funds, while state governments also contribute a small share.
The Centre designs the scheme, but the actual implementation is done by states or their agencies.
The sharing pattern differs: in most states, it is 60:40 (Centre: State); in some special category states (like those in the North-East), it is 90:10.
Example: MGNREGA is a Centrally Sponsored Scheme.
Why Rationalisation of CSS Was Needed?
Over the years, the number of CSS increased from a few dozen to more than 130. This created duplication of work and confusion.
Funds were often delayed or released only when states met certain conditions, making it difficult for states to plan their budgets.
The 'one-size-fits-all' design ignored the fact that every state has different needs, geography, and social issues.
States complained that these schemes forced them to spend their limited funds on central priorities instead of their own local needs.
Recommendations of Committees
Chaturvedi Committee (2014): Suggested reducing the number of CSS from 147 to 66, to avoid overlapping and make monitoring easier.
15th Finance Commission: Suggested discontinuing small or irrelevant schemes and setting a minimum budget threshold for CSS. This way, only schemes with a meaningful impact would continue.
Recent Rationalisation Steps
2018 – Samagra Shiksha: Three education schemes (SSA, RMSA, TT & AE) merged into one umbrella programme to provide education from pre-primary to higher secondary in an integrated way.
Budget 2022-23: A major exercise was carried out to simplify CSS. The number of schemes was cut down from 130 to 65 umbrella schemes across ministries.
Examples of rationalisation by ministries:
Ministry of Women & Child Development: Reduced from 19 schemes to just 3 umbrella schemes (Mission Shakti, Mission Vatsalya, Saksham Anganwadi & POSHAN 2.0).
Ministry of Animal Husbandry & Dairying: 12 schemes merged into 2; 3 schemes discontinued. New schemes: Infrastructure Development Fund and Development Programmes (Animal Husbandry).
Ministry of Agriculture & Farmers’ Welfare: 20 schemes reduced to 3 umbrella schemes (Krishionati Yojana, Integrated Scheme on Agricultural Cooperative, Rashtriya Krishi Vikas Yojana).
Advantages of Rationalisation
Avoids wastage of money by merging duplicate schemes.
Makes monitoring easier since there are fewer schemes to track.
Ensures states’ limited funds are not overburdened by cost-sharing requirements.
Promotes cooperative federalism by giving states more freedom in implementation.
Helps focus on outcomes (real improvements on the ground) rather than spreading resources too thinly.
Criticism and Challenges
Some states argue that even after rationalisation, the Centre still dominates design and funding, which reduces state autonomy.
Smaller schemes that focused on very specific issues may lose importance after being merged into larger umbrella schemes.
States worry that their unique needs may not be fully addressed under broad umbrella programmes.
| Year/Committee | Recommendation/Action |
|---|---|
| 2014 – Chaturvedi Committee | Reduce 147 schemes to 66 to remove duplication |
| 2015 – NITI Aayog Sub-Group | Suggested dividing CSS into Core, Core of Core, and Optional |
| 2018 – Samagra Shiksha | Merged 3 education schemes into one integrated scheme |
| 2022–23 Budget | 130 schemes rationalised into 65 umbrella schemes |
| 15th Finance Commission | Minimum budget threshold and discontinuation of small schemes |
Prelims tips
- CSS are designed by the Centre, implemented by States with shared funding.
- Chaturvedi Committee (2014) – reduce 147 schemes to 66.
- 15th Finance Commission – minimum threshold, stop small schemes.
- Budget 2022–23 merged 130 schemes into 65 umbrella schemes.
Mains points
- Explain how too many CSS created duplication and inefficiency.
- Discuss recommendations of Chaturvedi Committee (2014) and 15th Finance Commission.
- Evaluate benefits of rationalisation – efficient use of funds, outcome-based approach, cooperative federalism.
- Critically assess challenges – central dominance, risk of ignoring local needs, loss of small targeted schemes.
- Suggest reforms – more consultation with states, flexibility in design, outcome-linked funding.
Central Sector Schemes (CSS) vs Centrally Sponsored Schemes (CSSs)
Central Sector Schemes are fully funded and implemented by the Union Government, while Centrally Sponsored Schemes are funded partly by the Centre and partly by the States, but implemented by State Governments. This division is based on the Union List and State List subjects of the Indian Constitution.
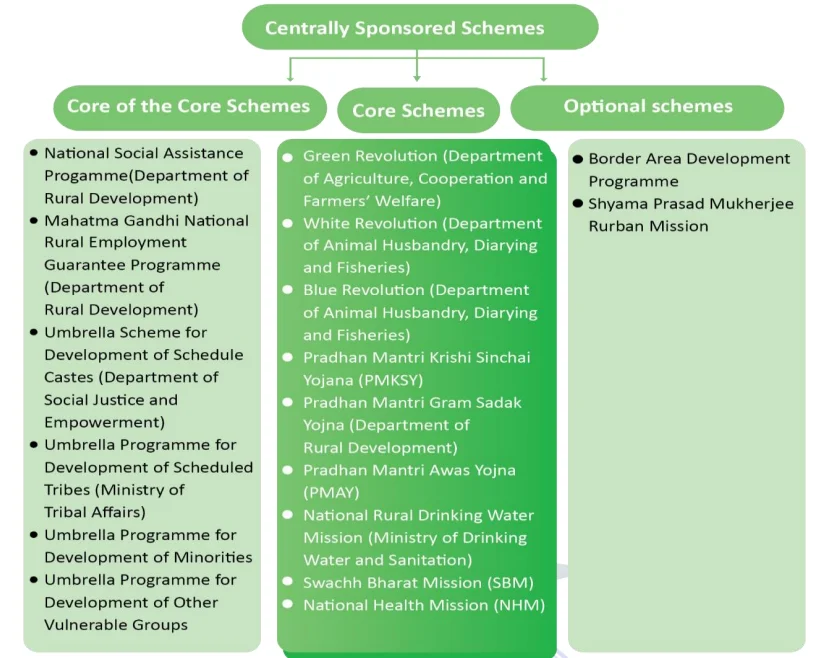
Central Sector Schemes
Fully funded and executed by the Union Government.
These schemes are related to subjects in the Union List (like defence, space, telecom, atomic energy, etc.).
No financial burden is placed on states.
Examples include:
BharatNet: World’s largest rural broadband programme using optical fibre, implemented by Bharat Broadband Network Limited (BBNL).
Namami Gange: A flagship mission started in 2014 to reduce pollution and rejuvenate the Ganga River.
Stand Up India: Launched in 2016 to promote entrepreneurship among SCs, STs, and Women by providing institutional credit.
Centrally Sponsored Schemes
Designed by the Centre but implemented by states or their agencies.
Funding is shared between Centre and States in ratios like 60:40, 80:20, or 90:10 (special category states).
Focuses on areas in the State List (like health, education, rural employment, etc.), but supported financially by the Centre.
Can be further classified into Core Schemes, Core of the Core Schemes, and Optional Schemes.
Key Differences
Funding: Central Sector Schemes = 100% Centre; Centrally Sponsored Schemes = Centre + State share.
Implementation: Central Sector Schemes = Union Government; Centrally Sponsored Schemes = State Governments.
Classification: Central Sector Schemes = No further division; Centrally Sponsored Schemes = Divided into Core/Core of Core/Optional.
Example: BharatNet (Central Sector); MGNREGA (Centrally Sponsored).
| Aspect | Central Sector Schemes | Centrally Sponsored Schemes |
|---|---|---|
| Funding | 100% by Union Government | Shared by Centre and States (60:40, 80:20, 90:10) |
| Implementation | By Union Government ministries/agencies | By State Governments/agencies |
| Scope | Union List subjects (defence, telecom, atomic energy) | State List subjects (health, education, rural jobs) |
| Classification | No subcategories | Core, Core of Core, Optional |
| Examples | BharatNet, Namami Gange, Stand Up India | MGNREGA, PM Gram Sadak Yojana, Mid-Day Meal Scheme |
Prelims tips
- Central Sector Schemes = 100% funded & implemented by Centre.
- Centrally Sponsored Schemes = Jointly funded, implemented by States.
- Union List → Central Schemes; State List → Sponsored Schemes.
- Examples: BharatNet (Central), MGNREGA (Sponsored).
Mains points
- Explain how Central Sector Schemes focus on national priorities like telecom, defence, river conservation.
- Discuss why Centrally Sponsored Schemes are important for state-level issues like health, education, and rural employment.
- Highlight funding and implementation differences.
- Evaluate pros and cons: Central Schemes ensure uniformity; Sponsored Schemes ensure local participation but may strain state budgets.
Public Financial Management System (PFMS)
PFMS is a web-based financial management platform developed by the Controller General of Accounts (CGA) under the Ministry of Finance. It was created to track fund flows, ensure real-time reporting, and enable transparency in the use of public money, especially for government schemes. It is a key part of the Government of India’s Digital India initiative.
Background
Launched in 2009 to track funds released under all Plan schemes of the Government of India.
Initially focused on monitoring expenditure at different levels of programme implementation.
In 2013, the scope was expanded to include direct payments to beneficiaries under various schemes.
Functions of PFMS
Provides a strong financial management system for the Union Government by creating an efficient fund flow mechanism and an integrated accounting network.
Offers real-time, reliable, and meaningful financial data to stakeholders through its MIS (Management Information System).
Acts as a decision-support system, helping policymakers track and control expenditure.
Ensures all government agencies route money through bank accounts, which are monitored in real-time by RBI, making fiscal stress visible immediately.
Creates a database of all recipient agencies and integrates with Core Banking Solutions (CBS) of banks.
Tracks fund flows to the lowest level of implementation (e.g., local bodies, NGOs, beneficiaries).
Strengthens transparency, accountability, and responsiveness in financial governance by monitoring payments, receipts, pensions, provident funds, etc.
Key Role
Helps in tracking government funds until the last beneficiary level.
Ensures efficient utilisation of funds with reduced leakages and delays.
Enables better planning and outcome-based fund allocation.
Single Nodal Agency (SNA) Dashboard
Launched in 2022 by the Ministry of Finance as part of PFMS reforms.
Tracks transfers of funds to States for Centrally Sponsored Schemes (CSS) and monitors their utilisation.
Helps cut down unnecessary interest expenditure by releasing money only when it is required.
Provides data on unspent balances, allowing states to rationalise their proposals for fresh fund releases.
Requires each state to designate a Single Nodal Agency (SNA) for every CSS.
The SNA must open a unique bank account in a commercial bank to manage all transactions related to that scheme.
Ensures real-time monitoring and efficient use of central funds at the state level.
Significance
Promotes efficient, transparent, and accountable public financial management.
Reduces fund diversion and misuse by monitoring transactions electronically.
Strengthens cooperative federalism by ensuring better fund utilisation in Centrally Sponsored Schemes.
Aligns with Digital India by digitising and integrating financial flows across the Union and State governments.
| Aspect | Details |
|---|---|
| Launched | 2009, expanded in 2013 |
| Developed by | Controller General of Accounts (CGA), Ministry of Finance |
| Purpose | Tracking fund flow, direct benefit transfers, real-time monitoring |
| Technology | Web-based system integrated with banks' Core Banking Solutions |
| Recent Reform | SNA Dashboard (2022) for CSS fund monitoring |
Prelims tips
- PFMS launched in 2009; expanded in 2013 for direct transfers.
- Developed by CGA, Ministry of Finance.
- Integrated with banks’ CBS for real-time monitoring.
- SNA Dashboard (2022) tracks Centrally Sponsored Schemes fund utilisation.
Mains points
- PFMS ensures transparency and accountability in public financial management.
- Helps curb leakages by directly transferring money to beneficiaries.
- Strengthens fiscal discipline by real-time monitoring of government expenditure.
- SNA Dashboard further rationalises fund release to States, avoiding idle funds.
- Aligns with Digital India and e-Governance initiatives.
Fiscal Policy
Fiscal policy refers to the use of government spending, taxation, and borrowing to influence the economy. It is a key tool for managing economic growth, controlling inflation, reducing inequalities, and stabilising the balance of payments. In India, fiscal policy has been shaped by both developmental goals and the need for macroeconomic stability.
Introduction
Fiscal policy involves government decisions related to taxation (how much tax is collected), public expenditure (where and how money is spent), and public debt (how much government borrows).
It is based on the Keynesian principle that government actions can influence demand, production, and employment in the economy.
By changing tax rates or government spending, fiscal policy can stimulate growth during recessions or slow down inflation during booms.
Objectives of Fiscal Policy in India
Promoting Economic Growth: The government invests in infrastructure and industries such as steel, fertilizers, and machine tools. These industries lay the foundation for long-term industrial and agricultural development.
Reducing Income and Wealth Inequalities: Progressive taxation ensures the rich pay higher taxes, while the government spends more on welfare schemes like subsidies, healthcare, and education for the poor.
Ensuring Price Stability: Inflation (rise in prices) or deflation (fall in prices) can destabilise the economy. The government manages food supply through ration shops and fair price shops, ensuring stable prices of essentials like wheat and rice.
Correcting Balance of Payments Deficit: When imports exceed exports, foreign payments rise. The government responds by increasing tariffs on imports, promoting Make in India initiatives, and giving subsidies for exports.
Fiscal Policy vs Monetary Policy
Fiscal Policy: Managed by the Government of India (Ministry of Finance). Uses taxation, public spending, and borrowing as tools. Focus is on overall demand and long-term development.
Monetary Policy: Managed by the Reserve Bank of India (RBI). Uses interest rates, CRR (Cash Reserve Ratio), SLR (Statutory Liquidity Ratio), and repo rate as tools. Focus is on controlling inflation, ensuring credit flow, and maintaining currency stability.
In simple terms: Fiscal policy = Government budget decisions; Monetary policy = Central Bank’s control over money supply.
Automatic Stabilisers
Meaning: parts of the budget that move against the business cycle without any new decision – e.g. progressive income tax collections fall in a slump and rise in a boom; unemployment/welfare spending rises in a slump.
Limitations of Fiscal Policy in India
Committed expenditure: interest payments, salaries, pensions and subsidies leave little room for counter-cyclical spending.
Narrow tax base and revenue volatility: low tax-to-GDP ratio limits resources.
Time lags and crowding out: recognition, approval and implementation lags; heavy government borrowing can raise interest rates and crowd out private investment.
Rules and politics: FRBM targets restrict deficits, and populist pressures distort priorities.
| Aspect | Fiscal Policy | Monetary Policy |
|---|---|---|
| Authority | Government of India (Ministry of Finance) | Reserve Bank of India (RBI) |
| Main Tools | Taxes, Government spending, Borrowings | Repo rate, CRR, SLR, Open Market Operations |
| Focus | Growth, inequality reduction, fiscal balance | Inflation control, money supply, credit stability |
| Time Frame | Medium to long-term impact | Short to medium-term impact |
| Nature | Political decisions through budget | Technical/economic decisions by RBI |
Prelims tips
- Fiscal Policy = Government’s budgetary decisions on spending, taxes, and borrowing.
- Monetary Policy = RBI’s decisions on interest rates and money supply.
- Fiscal Policy is political; Monetary Policy is technical.
- Fiscal tools: taxation, subsidies, capital expenditure. Monetary tools: repo rate, CRR, SLR.
Mains points
- Fiscal policy plays a key role in India’s economic planning and social welfare.
- It is essential for balancing growth with equity, ensuring price stability, and correcting external imbalances.
- Monetary policy alone cannot ensure development; it must work in coordination with fiscal policy.
- Challenges include fiscal deficit, populist spending, and balancing short-term needs with long-term sustainability.
- An effective mix of fiscal and monetary policy ensures inclusive and stable economic growth.
Types of Fiscal Policy
Fiscal Policy refers to the use of government spending and taxation to influence a nation's economy. It is mainly of three types: Expansionary, Contractionary, and Neutral. These policies are used to manage growth, employment, and inflation.
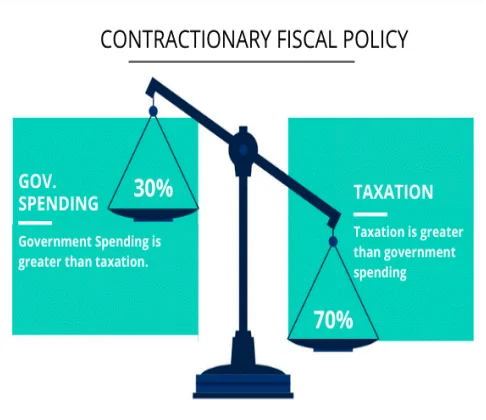
Overview
Fiscal Policy = Government’s use of taxation and spending to control economy.
Helps in managing demand, employment, production, and inflation.
Types: Expansionary, Contractionary, Neutral.
Expansionary Fiscal Policy
Used when the economy is slow or in recession.
Government increases its spending (e.g., on infrastructure, education, health).
Taxes may be reduced so that people have more money to spend.
Aim: Boost demand, create more jobs, increase production, and encourage growth.
Example: Government building new highways to increase employment and demand for materials.
Contractionary Fiscal Policy
Used when inflation is very high (prices rising too fast).
Government reduces its spending or increases taxes.
People have less money to spend, which reduces demand for goods and services.
Aim: Control inflation and prevent economy from overheating.
Example: Increasing tax on luxury goods to reduce unnecessary spending.
Neutral Fiscal Policy
Used when the economy is stable, neither in boom nor recession.
Government spends only what it earns through taxes.
No extra borrowing or excess spending.
Aim: Maintain balance without disturbing economy.
Example: Government budget where expenses = revenue, keeping economy steady.
| Type | Explanation | Objective |
|---|---|---|
| Expansionary | Govt increases spending and reduces taxes. | Boost growth, demand, and jobs. |
| Contractionary | Govt reduces spending or increases taxes. | Control inflation and reduce demand. |
| Neutral | Govt spends equal to its revenue from taxes. | Maintain balance in economy. |
Prelims tips
- Expansionary = more spending, less taxes; used in slowdown.
- Contractionary = less spending, more taxes; used in inflation.
- Neutral = spending equals revenue; used in stable economy.
- Fiscal Policy = Govt tool to manage economy along with Monetary Policy.
Mains points
- Expansionary policy helps in reviving economy during recession.
- Contractionary policy is necessary to control high inflation.
- Neutral policy ensures long-term stability by avoiding over-spending.
- Fiscal policies affect GDP growth, employment, inflation, and overall welfare.
- Success depends on proper timing and coordination with Monetary Policy.
Cyclicality of Fiscal Policy
Cyclicality of fiscal policy refers to how government adjusts its spending and taxation according to the ups and downs of the economy. It can be counter-cyclical (moving against the cycle to stabilize economy) or pro-cyclical (moving with the cycle, which may worsen fluctuations).
Overview
Fiscal policy changes depending on economic growth and slowdown.
Cyclicality shows whether policy stabilizes the economy or deepens the cycle.
Counter-cyclical Fiscal Policy
Moves opposite to economic cycle.
During recession/slowdown: Govt increases spending and reduces taxes to boost demand and growth.
During boom (high growth): Govt reduces spending and raises taxes to control inflation.
Aim: Stabilize economy and reduce extremes of boom & bust.
Example: US increasing infrastructure spending during 2008 global financial crisis.
Pro-cyclical Fiscal Policy
Moves in the same direction as economy.
During boom: Govt spends more and reduces taxes (further overheating economy).
During recession: Govt cuts spending and raises taxes (further slowing economy).
This worsens fluctuations, increasing unemployment in bad times and inflation in good times.
Example: Some developing countries cutting social welfare spending during crises due to limited resources.
Related Terms
Fiscal Drag
Situation where inflation or higher incomes push taxpayers into higher tax brackets (progressive taxation).
Leads to people paying more taxes even if real income has not increased much.
Example: A worker’s salary rises with inflation, but since tax bracket rises, disposable income does not increase equally.
Fiscal Neutrality
Govt policies that have no net effect on demand in the economy.
Any increase in govt spending is exactly matched by increased taxes or revenues.
Aim: Keep economy stable without stimulating or reducing demand.
Example: If govt spends ₹1,000 crore on health but collects equal extra tax, overall demand remains unchanged.
| Type | Explanation | Impact |
|---|---|---|
| Counter-cyclical | Moves against economic trend; spends more in recessions, less in booms. | Stabilizes economy; reduces unemployment & inflation swings. |
| Pro-cyclical | Moves with economic trend; spends more in booms, less in recessions. | Worsens fluctuations; increases risks of high inflation & unemployment. |
Prelims tips
- Counter-cyclical = stabilizing (Keynesian idea).
- Pro-cyclical = destabilizing, common in resource-limited developing economies.
- Fiscal Drag = higher taxes due to inflation pushing people into higher brackets.
- Fiscal Neutrality = no net impact on demand (balanced spending and revenue).
Mains points
- Counter-cyclical policy is preferred as it smooths economic fluctuations.
- Pro-cyclical policies often arise due to limited govt resources or borrowing constraints.
- Fiscal drag highlights hidden tax burdens during inflationary periods.
- Fiscal neutrality ensures long-term balance but may limit govt’s ability to stimulate economy.
- Cyclicality is closely linked to monetary policy and overall macroeconomic stability.
Accounting Methods (Cash vs Accrual)
Governments track their income and spending using accounting methods. The two main methods are Cash Basis (recording transactions only when cash is actually received or paid) and Accrual Basis (recording transactions when they are earned or incurred, regardless of cash movement). India primarily uses the Cash Basis for its budgeting.
What are Accounting Methods?
These are rules for recording government's financial transactions (income and expenses).
Goal: To provide a clear and accurate picture of the government's financial position.
1. Cash Basis Accounting
Rule: Transactions are recorded only when actual cash changes hands.
Income is recorded when cash is received .
Expenses are recorded when cash is paid .
Analogy: Think of your personal wallet. You only count the money when you physically receive it or spend it.
Advantages: Simple, easy to understand, clearly shows cash flow.
Disadvantages: Doesn't show future liabilities (like unpaid bills or future pension obligations) or assets (like receivables). Can be manipulated by delaying payments or rushing collections near year-end.
Usage in India: The Union and State governments primarily follow the Cash Basis for budgeting and accounting, as mandated by the Comptroller and Auditor General (CAG).
2. Accrual Basis Accounting
Rule: Transactions are recorded when the economic event occurs, regardless of when cash is exchanged.
Income is recorded when it is earned (e.g., when goods are sold, even if payment is later).
Expenses are recorded when they are incurred (e.g., when services are used, even if payment is later).
Analogy: Think of a business. It records a sale when the invoice is issued (revenue earned), not just when the customer pays. It records an expense when it receives an electricity bill (liability incurred), not just when it pays the bill.
Advantages: Provides a more comprehensive picture of financial health, including assets and liabilities. Better for long-term planning.
Disadvantages: More complex, requires sophisticated tracking systems.
Usage: Many corporations and some government entities (like public sector undertakings) use accrual accounting.
Transition in India?
There have been discussions and recommendations (e.g., by Fiscal Responsibility and Budget Management Review Committee under N.K. Singh) to gradually move towards accrual accounting for a more accurate fiscal picture, but the transition is complex and slow for government-wide implementation.
| Feature | Cash Basis | Accrual Basis |
|---|---|---|
| Recording Timing | When cash moves | When transaction occurs (earned/incurred) |
| Complexity | Simple | Complex |
| Financial Picture | Focus on cash flow | Comprehensive (incl. assets/liabilities) |
| Govt of India Usage | Primary method | Limited (used by some PSUs) |
Prelims tips
- Cash Basis: Records when cash received/paid. Simple, shows cash flow. (India's primary method).
- Accrual Basis: Records when earned/incurred. Comprehensive, shows assets/liabilities. Complex.
- CAG mandates cash basis for government accounts in India.
- Recommendations exist to move towards accrual basis.
Mains points
- Cash basis accounting, while simple, provides an incomplete picture of the government's long-term fiscal health as it ignores future liabilities like pensions and guarantees.
- Accrual accounting offers better transparency and helps in assessing the true cost of government services and long-term fiscal sustainability.
- The transition to accrual accounting for governments is challenging due to complexity, capacity constraints, and potential impacts on reported deficit figures.
- A gradual, phased approach might be needed for India to adopt accrual principles.
Budget Documents
The Union Budget presented in Parliament includes several key documents mandated by the Constitution or the FRBM Act. These include the Annual Financial Statement, Demands for Grants, Appropriation Bill, Finance Bill, and various explanatory statements that provide details on government finances, policies, and macroeconomic outlook.
Constitutional Requirements
Article 112: Annual Financial Statement (AFS)
The main budget document, showing estimated receipts and expenditure for the year.
Distinguishes between Revenue and Capital accounts.
Shows expenditures 'Charged' upon the Consolidated Fund (non-votable) and those 'Made' from it (votable).
Article 113: Demands for Grants (DG)
Detailed estimates of expenditure from the Consolidated Fund that require voting by the Lok Sabha.
Presented ministry-wise. Each demand specifies the total grant needed.
Article 114: Appropriation Bill
Introduced after DGs are voted.
Gives legal authority to the government to withdraw money from the Consolidated Fund to meet the approved expenditures.
Becomes the Appropriation Act after Presidential assent.
Article 110: Finance Bill
Contains the government's proposals for levying new taxes, altering existing tax structures, or continuing existing ones beyond the period approved by Parliament.
Presented with the Budget.
Must be passed by Parliament within 75 days.
Certified as a Money Bill.
Requirements under FRBM Act, 2003
These documents provide context and justification for the budget numbers:
1. Macro-Economic Framework Statement: Assesses GDP growth, fiscal balance, and external sector balance prospects.
2. Fiscal Policy Strategy Statement: Outlines government's fiscal priorities, policies for the year, and justification for any deviation from FRBM targets.
3. Medium-Term Fiscal Policy cum Fiscal Policy Strategy Statement: Projects key fiscal indicators (deficits, debt, revenue, expenditure) for the next three years and outlines the path for fiscal consolidation. (This combined statement replaced separate Medium-Term Fiscal Policy and Fiscal Policy Strategy statements after 2018 FRBM amendment).
4. Medium-Term Expenditure Framework (MTEF) Statement: Presented in Parliament after the budget session (usually Monsoon session). Sets rolling targets for expenditure (Revenue and Capital) for the next three years.
Other Explanatory Documents
Expenditure Budget: Gives detailed ministry-wise expenditure estimates (Revenue and Capital) and explanations.
Receipts Budget: Provides details of tax and non-tax revenue receipts and capital receipts.
Budget at a Glance: A summary document showing key figures for receipts, expenditure, deficits, and economic indicators.
Memorandum Explaining the Provisions in the Finance Bill: Explains the legal and technical aspects of the tax proposals in the Finance Bill.
Outcome Budget: Links financial outlays for schemes with measurable performance outcomes (introduced later, presented by ministries).
Prelims tips
- Annual Financial Statement (AFS): Main budget document (Art 112).
- Demands for Grants (DG): Votable expenditure estimates (Art 113).
- Appropriation Bill: Authorizes withdrawal from Consolidated Fund (Art 114).
- Finance Bill: Contains tax proposals (Art 110 - Money Bill).
- FRBM Act mandates Macro-Economic Framework, Fiscal Policy Strategy, and Medium-Term Fiscal Policy statements.
Mains points
- The various budget documents ensure transparency and legislative oversight over public finances.
- Constitutional provisions (Art 112-114) establish the process for budget approval and fund withdrawal.
- FRBM Act mandates additional documents to enforce fiscal discipline and provide a medium-term outlook.
- Documents like Expenditure Budget and Receipts Budget provide granular details for analysis.
- The set of documents collectively provides a comprehensive view of the government's financial health, policy priorities, and economic strategy.
Debt Management
Public Debt Management refers to the process of establishing and executing a strategy for managing the government's debt. The goal is to ensure the government can meet its financing needs at the lowest possible cost over the medium to long run, consistent with a prudent degree of risk, while also developing the domestic debt market.
What is Public Debt Management?
It involves managing the government's borrowing program – deciding how much to borrow, from where (domestic vs external), for how long (short-term vs long-term), and at what cost (interest rate).
Key Objectives:
Meet the government's financing gap (fiscal deficit) reliably.
Minimize borrowing costs over time.
Keep risks (like interest rate risk, rollover risk, currency risk) under control.
Develop a deep and liquid domestic market for government securities (G-Secs).
Who Manages Debt in India?
Currently, the Reserve Bank of India (RBI) manages the public debt for both the Central and State governments.
RBI acts as the government's banker and debt manager, handling auctions of G-Secs and Treasury Bills.
There have been proposals (e.g., suggested by FRBM Review Committee) to set up an independent Public Debt Management Agency (PDMA) outside RBI to avoid potential conflicts of interest between RBI's roles as debt manager (wanting low rates) and monetary authority (sometimes needing high rates to control inflation). However, PDMA has not been fully established yet.
Key Aspects of Debt Management Strategy
1. Composition of Debt:
Domestic vs External: India relies heavily on domestic debt (~95% of central govt debt) to minimize exchange rate risk.
Instruments: Mix of short-term Treasury Bills (T-Bills, up to 1 year) and long-term dated securities (G-Secs, 2-40 years).
2. Maturity Profile:
Avoiding bunching of repayments in a single year (rollover risk).
Elongating maturity (issuing more long-term bonds) reduces frequent refinancing needs but might lock in higher rates.
3. Cost Minimization:
Conducting auctions efficiently.
Issuing different types of bonds (e.g., floating rate, inflation-indexed) based on market conditions.
4. Risk Management:
Monitoring interest rate risk (impact of rate changes on borrowing cost).
Managing currency risk for external debt.
5. Market Development:
Ensuring sufficient liquidity in the G-Sec market.
Broadening the investor base (including retail investors via RBI Retail Direct).
Debt Sustainability
Debt management is closely linked to debt sustainability – ensuring that the government can continue servicing its debt without requiring unrealistic future adjustments.
Key indicator: Debt-to-GDP ratio. FRBM Act aims to bring this down (e.g., Centre's target 40%).
Sustainability depends on:
GDP Growth Rate (g)
Average Interest Rate on Debt (r)
Primary Deficit (Fiscal Deficit - Interest Payments)
Rule of thumb: Debt is generally sustainable if g > r (growth rate is higher than interest rate) and the primary balance is stable or improving.
Prelims tips
- Public Debt Management: Strategy for govt borrowing - cost, risk, maturity.
- Managed by RBI in India.
- Proposals exist for an independent PDMA.
- India relies heavily on domestic debt.
- Debt Sustainability: Ability to service debt. Key factor: Is GDP Growth (g) > Interest Rate (r)?
Mains points
- Effective debt management minimizes borrowing costs and risks for the government.
- RBI's dual role as debt manager and monetary authority creates potential conflicts, strengthening the case for an independent PDMA.
- Developing a deep domestic G-Sec market is crucial for stable financing and effective monetary policy transmission.
- Debt sustainability analysis (comparing growth vs interest rates, primary balance trends) is vital for long-term fiscal health.
- While India's reliance on domestic debt reduces currency risk, managing the large quantum of debt remains a key challenge.
Finance Commission
The Finance Commission is a constitutional body (Article 280) set up every five years by the President of India. Its primary role is to recommend the distribution of tax revenues between the Union and the States (vertical devolution) and among the States themselves (horizontal devolution). It plays a crucial role in shaping India's fiscal federalism.
Constitutional Basis
Article 280: Mandates the President to constitute a Finance Commission every fifth year, or earlier if necessary.
Article 281: Requires the President to lay the Commission's recommendations, along with an explanatory memorandum, before each House of Parliament.
Composition
Consists of a Chairman and four other members appointed by the President.
Parliament determines their qualifications (Finance Commission Act, 1951):
Chairman: Person with experience in public affairs.
Members (should have expertise in):
Finance and accounts of the government.
Financial matters and administration.
Economics.
Judge of a High Court (or qualified to be one).
Key Functions (Terms of Reference - ToR)
The Commission makes recommendations on:
1. Vertical Devolution: The distribution of the net proceeds of taxes between the Union and the States (how much % of central taxes goes to states).
2. Horizontal Devolution: The allocation of the states' share among the different states (based on criteria like population, area, income distance, forest cover, demographic performance, tax effort).
3. Grants-in-Aid: The principles governing grants-in-aid to the States out of the Consolidated Fund of India (Article 275 - statutory grants, especially revenue deficit grants).
4. Augmenting State Funds for Local Bodies: Measures needed to increase the Consolidated Fund of a State to supplement resources for Panchayats and Municipalities (based on State Finance Commission recommendations).
5. Other Matters: Any other matter referred by the President in the interest of sound finance (e.g., reviewing disaster management financing - 15th FC).
Nature of Recommendations
The recommendations are advisory in nature and not legally binding on the government.
However, conventionally, the central government largely accepts the core recommendations regarding tax devolution.
Recent Finance Commissions
14th Finance Commission (Chairman: Y.V. Reddy): Award Period 2015-20. Major recommendation: Increased states' share in central taxes from 32% to 42%.
15th Finance Commission (Chairman: N.K. Singh): Award Period 2021-26 (extended due to pandemic). Recommendation: Maintained states' share at 41% (1% adjusted for newly formed UTs of J&K and Ladakh). Introduced criteria like 'Demographic Performance' and 'Tax Effort'. Recommended various grants (Revenue Deficit, Sector-Specific, State-Specific, Local Body, Disaster Management).
Importance in Fiscal Federalism
Acts as a balancing wheel of fiscal federalism, ensuring equitable distribution of resources.
Addresses vertical fiscal imbalances (Centre collects more taxes, States have more expenditure needs) and horizontal imbalances (differences among states).
Promotes fiscal discipline and provides predictability in resource transfers.
Prelims tips
- Finance Commission: Constitutional body (Art 280), set up every 5 years.
- Recommends vertical (Centre-State) and horizontal (among States) tax devolution.
- Recommendations are advisory, not binding.
- 14th FC (YV Reddy) raised state share to 42%.
- 15th FC (NK Singh) recommended 41% state share (2021-26).
- Composition: Chairman + 4 members.
Mains points
- The Finance Commission is vital for maintaining fiscal balance in India's federal structure.
- It uses objective criteria for horizontal devolution to ensure equity among states with varying capacities.
- Grants-in-aid recommended by FC help address specific needs of states (e.g., revenue deficit, local bodies).
- The acceptance of FC recommendations, though advisory, reflects the spirit of cooperative federalism.
- Evolution of criteria (like adding demographic performance by 15th FC) shows its dynamic nature in addressing contemporary challenges.
Treasury Single Account (TSA)
The Treasury Single Account (TSA) is a unified structure of government bank accounts, usually held at the central bank (like RBI). It gives the government a consolidated view of its cash resources, enabling efficient cash management, reduced borrowing costs, and better control over public funds.
What is a TSA?
Instead of government agencies holding many separate bank accounts across different commercial banks, TSA centralizes government cash balances into one main account (or a linked set of accounts) at the central bank.
Analogy: Imagine a large family where each member has multiple wallets hidden in different places. It's hard to know the total cash available. TSA is like pooling all the money into one central family locker managed by the head (Ministry of Finance/Central Bank), making it easy to see the total and manage it efficiently.
Why is TSA Important?
Consolidated Cash View: Allows the Ministry of Finance to know the government's total cash position accurately and in real-time.
Efficient Cash Management: Reduces idle cash lying in numerous agency accounts. Funds can be used optimally where needed.
Reduced Borrowing Costs: By knowing the exact cash balance, the government can minimize unnecessary short-term borrowing, saving interest costs.
Better Control & Transparency: Centralized control helps prevent misuse or leakage of funds. All transactions flow through a monitored system.
Improved Monetary Policy: Helps the central bank manage liquidity in the banking system more effectively, as government cash balances are predictable.
TSA in India
India has been progressively moving towards a TSA system.
The Controller General of Accounts (CGA) and RBI manage the central government's cash balances.
The Public Financial Management System (PFMS) acts as a key platform supporting the TSA framework by tracking fund flows.
Introduction of the Single Nodal Agency (SNA) model for Centrally Sponsored Schemes (CSS) is a major step towards TSA, where each scheme's funds for a state are managed through a single designated bank account.
While a full, textbook TSA covering all government entities might still be evolving, the core principles of consolidation and central control are being implemented.
Implementation Challenges
Requires strong IT infrastructure and integration between government departments, central bank, and commercial banks.
Resistance from government agencies used to holding their own funds.
Need for clear legal and regulatory framework.
Prelims tips
- TSA: Unified structure of govt bank accounts at the central bank (RBI).
- Goal: Efficient cash management, reduce borrowing costs, improve transparency.
- Reduces idle cash in multiple agency accounts.
- Supported by PFMS in India.
- SNA model for CSS is a step towards TSA implementation.
Mains points
- TSA is a key public financial management reform that enhances fiscal discipline and efficiency.
- By providing a consolidated view of government cash, it minimizes the cost of government borrowing.
- Improved cash forecasting and management through TSA strengthens coordination between fiscal and monetary policy.
- Implementation requires political will, strong IT systems, and capacity building across government agencies.
Types of Grants (Constitutional Grants)
The Constitution of India provides for financial assistance from the Centre to the States in the form of grants-in-aid. These grants help bridge fiscal gaps, promote welfare, and ensure balanced regional development. Key types include Statutory Grants (Article 275) and Discretionary Grants (Article 282).
Why Grants are Needed?
India has vertical fiscal imbalance: Centre collects more revenue, while States have larger expenditure responsibilities (health, education, law & order).
Grants help transfer resources from the Centre to the States to meet their needs.
They also help address horizontal imbalances (differences in fiscal capacity among states).
Types of Grants-in-Aid
1. Statutory Grants (Article 275):
These grants are given based on the recommendations of the Finance Commission.
Parliament provides these grants to states that are in need of financial assistance (not every state gets them).
Charged on the Consolidated Fund of India every year.
Can be general (like Revenue Deficit Grants to cover gaps) or specific (for promoting welfare of Scheduled Tribes or improving administration in Scheduled Areas).
Example: 15th Finance Commission recommended Post Devolution Revenue Deficit Grants (PDRDG) for 17 states for FY22-26.
2. Discretionary Grants (Article 282):
Both the Union and the States can make grants for any public purpose, even if the subject matter is not within their legislative competence.
These grants are given at the discretion of the Union government (no obligation).
Often used to influence state actions or implement central schemes.
Historically, grants given via the Planning Commission (now NITI Aayog) fell under this category.
These grants have become significant, sometimes exceeding statutory grants, leading to concerns about Centre's dominance.
3. Other Grants:
There can be other grants for specific purposes (e.g., grants for jute export duty compensation - Article 273, though this is now less relevant).
Statutory vs Discretionary Grants
Basis: Statutory grants are based on Finance Commission recommendations (need-based); Discretionary grants are based on Centre's choice (often scheme-based).
Obligation: Statutory grants are more predictable; Discretionary grants depend on Centre's will.
Article: Statutory under Art 275; Discretionary under Art 282.
Role in Fiscal Federalism
Grants are a key instrument for resource transfer in India's federal system.
Statutory grants (via Finance Commission) aim for equity and address fiscal needs objectively.
Discretionary grants allow the Centre to pursue national objectives but can sometimes lead to centralization or political bargaining.
Balancing these two types of grants is crucial for healthy Centre-State financial relations.
Special Grants under Article 116
Vote on Account – Art. 116(1)(a): advance grant for part of the year pending passage of the full budget.
Vote of Credit – Art. 116(1)(b): a 'blank cheque' for an unexpected demand whose magnitude or indefinite character cannot be stated in detail (e.g. during war).
Exceptional Grant – Art. 116(1)(c): for a purpose that is not part of the current service of any financial year.
Prelims tips
- Grants-in-aid help bridge vertical and horizontal fiscal imbalances.
- Statutory Grants: Art 275, based on Finance Commission recommendations, for states in need.
- Discretionary Grants: Art 282, given by Centre for any public purpose at its discretion.
- Statutory grants are charged on Consolidated Fund; Discretionary grants depend on Centre's choice.
Mains points
- Grants are essential mechanisms for resource transfer in Indian federalism.
- Statutory grants ensure rule-based, equitable transfers based on objective criteria set by the Finance Commission.
- Discretionary grants provide flexibility to the Centre but raise concerns about potential bias and undermining state autonomy.
- The balance between statutory and discretionary grants impacts Centre-State relations and the overall health of fiscal federalism.
- Finance Commission's role in recommending grants is crucial for maintaining fiscal stability and equity.