
Indian Economy · UPSC Notes
Inclusive Growth — UPSC Economy Notes
Free, exam-focused notes for UPSC Prelims and Mains, with Prelims tips and Mains points for every topic. 23 topics.
Open in the interactive reader: bookmarks, progress tracking and read-aloud.
Inclusive Growth
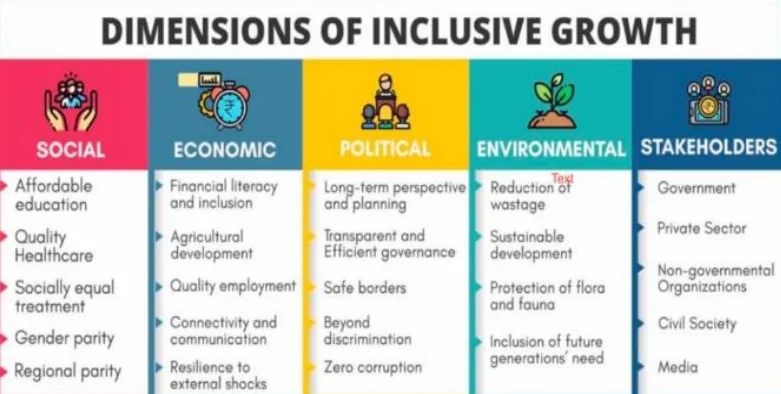
Inclusive growth is a pattern of economic growth that ensures fairness, equity, and opportunities for all sections of society. It reduces inequalities, promotes participation of marginalized groups, and ensures that growth is sustainable, environment-friendly, and non-discriminatory.
Introduction
As per OECD, Inclusive Growth is economic growth distributed fairly across society and creating opportunities for all.
As per UNDP, it is a process and an outcome where all groups participate in growth and benefit equitably from it.
In simple words, it means growth that does not leave anyone behind.
Salient Features
Reduction of Inequalities: Narrows gaps between rich and poor, rural and urban, men and women, and across sectors.
Regional Balance: Focuses on reducing regional disparities, ensuring backward areas also develop.
Broad Participation: Involves all sections of society, especially marginalized groups.
Addressing Constraints: Removes barriers faced by excluded groups (SCs, STs, women, differently-abled, minorities).
Non-Discrimination: Fair access to resources, services, and opportunities without bias.
Sustainability: Growth that is environment-friendly, good in governance, and gender-sensitive.
Why Inclusive Growth is Important?
Prevents social unrest caused by inequality and exclusion.
Strengthens democracy and social justice.
Ensures faster poverty reduction.
Improves productivity by utilizing the full potential of the workforce.
Creates a fair and sustainable development path for future generations.
| Aspect | Inclusive Growth | Non-Inclusive Growth |
|---|---|---|
| Distribution of Benefits | Shared fairly across all groups | Concentrated in hands of few |
| Participation | Broad participation of marginalized groups | Excludes weaker sections |
| Sustainability | Environment-friendly, gender-sensitive | Often exploitative and unsustainable |
| Regional Development | Reduces disparities among regions | Benefits limited to few regions |
Prelims tips
- OECD: Inclusive growth = Fair distribution + Opportunities for all.
- UNDP: Inclusive growth = Process + Outcome with equitable benefits.
- Key features: Reduces inequality, ensures participation, promotes sustainability.
Mains points
- Inclusive growth is essential for poverty reduction, social justice, and sustainable development.
- Focuses on removing structural barriers faced by marginalized communities.
- Links economic growth with equity, fairness, and environmental responsibility.
- Acts as a foundation for long-term political stability and social harmony.
Elements of Inclusive Growth
Elements of Inclusive Growth are the pillars of equitable development, ensuring that economic progress benefits all. These include agriculture development, poverty reduction, and reduction of regional disparities – supported by targeted government schemes and policies.
Agriculture Development
Agriculture is vital for rural livelihood. Over two-thirds of rural households depend on it (FAO).
PLFS 2019-20: 75.7% of rural women and nearly 60% of employed women in India are engaged in agriculture.
Challenges: low productivity, limited irrigation, market linkages, and income insecurity.
Key Government Schemes:
PM-KISAN: Direct income support of ₹6000 per year to farmers.
PM Fasal Bima Yojana (PMFBY): Crop insurance against risks like drought/flood.
e-NAM: Online trading platform to connect farmers with markets.
PM Krishi Sinchai Yojana: Irrigation support under motto 'Har Khet Ko Pani'.
Poverty Reduction
Poverty is declining but still significant. UNDP MPI 2022: India had 228.9 million poor in 2020.
415 million people moved out of poverty between 2005-21, poverty incidence fell from 55.1% to 16.4%.
Strategies: welfare programs, skilling, education, and healthcare.
Key Government Schemes:
MGNREGA: 100 days of guaranteed rural employment.
National Food Security Act (NFSA): Subsidized food grains to 80 crore+ people.
Ayushman Bharat (PM-JAY): World’s largest health insurance scheme.
Deen Dayal Upadhyaya Grameen Kaushalya Yojana (DDU-GKY): Skill development for youth.
Reduction in Regional Disparities
Uneven growth across states – Kerala and Gujarat more developed, Jharkhand and Chhattisgarh less developed.
Within states too, urban areas often prosper while rural regions lag.
Balanced regional development requires special programs and resource allocation.
Key Government Schemes:
Aspirational Districts Programme (ADP): Targeted development in 112 backward districts.
Bharatmala & Sagarmala Projects: Infrastructure connectivity to boost regional growth.
UDAN Scheme: Enhancing regional air connectivity.
PMGSY (Pradhan Mantri Gram Sadak Yojana): Rural roads for connectivity.
| Element | Focus Area | Key Schemes |
|---|---|---|
| Agriculture Development | Productivity, irrigation, market access | PM-KISAN, PMFBY, e-NAM, PM Krishi Sinchai Yojana |
| Poverty Reduction | Food security, employment, health, skill development | MGNREGA, NFSA, Ayushman Bharat, DDU-GKY |
| Regional Disparities | Balanced development, connectivity | Aspirational Districts Programme, Bharatmala, UDAN, PMGSY |
Prelims tips
- PM-KISAN provides ₹6000/year to farmers in 3 installments.
- MGNREGA guarantees 100 days of rural employment.
- Ayushman Bharat provides ₹5 lakh health cover per family per year.
- Aspirational Districts Programme covers 112 backward districts.
Mains points
- Agriculture development is crucial since most rural households depend on it – schemes like PM-KISAN and PMFBY provide direct support.
- Poverty reduction achieved through food security (NFSA), employment (MGNREGA), health (Ayushman Bharat), and skills (DDU-GKY).
- Regional disparities tackled via Aspirational Districts Programme, infrastructure schemes (Bharatmala, Sagarmala, PMGSY), and UDAN.
- Together, these initiatives ensure inclusive, balanced, and sustainable growth in India.
Pillars of Inclusive Growth
Inclusive growth is possible only when access to finance, skill enhancement, social development, technology, and sustainability are integrated into policy and practice.
Financial Inclusion
Ensures that weaker sections and low-income groups (LIGs) can access financial services (bank accounts, credit, insurance, pensions) at affordable cost in a transparent manner.
Builds a culture of saving and investment → creates virtuous cycle of growth and financial security.
Example: Pradhan Mantri Jan Dhan Yojana (PMJDY), Direct Benefit Transfer (DBT), Aadhaar-enabled payment system.
Skill Development
With nearly 2/3rd population in working age group (15–59 years), India’s demographic dividend is huge.
Challenges: shortage of highly trained workforce + lack of jobs for conventionally skilled youth.
Focus on job-oriented skills, vocational training, apprenticeships, and digital skills to boost employability.
Example: Skill India Mission, PMKVY, Startup India providing skilling + employment opportunities.
Social Sector Development
Investment in education, health, sanitation, housing improves standard of living and reduces inequality.
Creates stronger human capital, leading to higher productivity.
Example: Ayushman Bharat (healthcare), Swachh Bharat Abhiyan (sanitation), PM Awas Yojana (housing).
Technological Advancement
Industry 4.0 (AI, IoT, Automation) can either reduce or increase inequality depending on usage.
Focus on digital literacy and access to technology ensures marginalized communities also benefit.
Example: TribesIndia.com helps tribal communities sell products online nationwide.
Sustainable Economic Growth
Inclusive growth must be environmentally sustainable to benefit both present and future generations.
Adoption of green technologies, renewable energy, energy efficiency to reduce carbon emissions.
Example: National Solar Mission, push for electric vehicles, sustainable agriculture practices.
Challenges in Achieving Inclusive Growth
Despite several initiatives, India faces major challenges in achieving inclusive growth, such as inequality, jobless growth, skill gaps, digital divide, poor infrastructure, and environmental concerns. Addressing these barriers is critical for ensuring equitable and sustainable development.
1. Rising Inequality
Economic growth has been uneven, with benefits concentrated in the hands of a few.
Oxfam (2023) reports that top 1% of Indians own more than 40% of total wealth.
2. Jobless Growth
Growth in India has not created enough quality jobs.
Most employment is in informal sector with low wages and no social security.
Youth unemployment is a major concern, especially among educated graduates.
3. Skill Gaps
Large mismatch between industry needs and workforce skills.
Only a small percentage of workforce has received formal training.
Skilling schemes like Skill India and PMKVY face implementation challenges.
4. Digital Divide
Unequal access to internet and digital technology between urban-rural and rich-poor.
Limits access to education, e-governance, financial inclusion (Digital India, JAM trinity).
5. Regional Disparities
Some states (Kerala, Gujarat, Maharashtra) are far ahead while states like Bihar, Jharkhand, Chhattisgarh lag behind.
This imbalance leads to migration, social unrest, and uneven opportunities.
6. Weak Infrastructure
Rural areas still lack proper roads, electricity, health, and education facilities.
Infrastructure gaps make growth uneven and exclude marginalized regions.
7. Gender Inequality
Female labor force participation remains very low (~25% as per PLFS 2021).
Gender pay gap, limited access to credit and property rights hinder women's empowerment.
8. Environmental Concerns
Rapid industrialization and urbanization cause pollution, deforestation, and climate change.
Poor bear the brunt of environmental degradation (loss of livelihoods, health issues).
| Challenge | Impact |
|---|---|
| Rising Inequality | Wealth concentrated in hands of few, social unrest risk |
| Jobless Growth | Youth unemployment, informal sector dominance |
| Skill Gaps | Mismatch between education and industry needs |
| Digital Divide | Excludes rural poor from opportunities |
| Regional Disparities | Uneven growth, migration pressures |
| Weak Infrastructure | Hinders balanced growth and access to services |
| Gender Inequality | Low female participation, gender pay gap |
| Environmental Concerns | Climate risks, loss of livelihoods, health issues |
Prelims tips
- Oxfam 2023: Top 1% Indians own >40% of total wealth.
- PLFS 2021: Female labor force participation ~25%.
- Major barriers: Inequality, jobless growth, digital divide, weak infrastructure.
Mains points
- Inclusive growth in India is challenged by inequality, unemployment, and skill mismatches.
- Digital divide and regional disparities keep large sections excluded from benefits of growth.
- Gender inequality and weak infrastructure reduce inclusivity of development.
- Environmental sustainability must be balanced with economic growth to ensure long-term welfare.
Way Forward for Inclusive Growth
Inclusive growth requires targeted policies in financial inclusion, skilling, social sector investment, technology use, and sustainable development. These measures ensure that economic benefits are equitably distributed and future-ready.
Financial Inclusion
Ensuring vulnerable groups like weaker sections and low-income households get access to banking, credit, insurance, and pensions at affordable rates.
Promotes a culture of saving and investment, creating a virtuous cycle of growth.
Example: Jan Dhan Yojana, Direct Benefit Transfer (DBT), Aadhaar-enabled Payment System.
Skill Development
India’s demographic dividend (working-age majority) can only be harnessed through education and skilling.
Challenges: shortage of highly trained workforce + lack of jobs for conventionally skilled youth.
Need for job-oriented vocational skills, apprenticeship programs, and industry-academia linkages.
Example: Skill India Mission, PMKVY.
Social Sector Development
Investment in health, education, sanitation, and housing improves standard of living and reduces inequality.
Improves human capital, leading to higher productivity.
Example: Ayushman Bharat (healthcare), Swachh Bharat Abhiyan (sanitation), PMAY (housing).
Technological Advancement
With Industry 4.0 (AI, IoT, automation), technology can either reduce or deepen inequality.
Focus on digital literacy and affordable access to technology for rural and marginalized groups.
Example: TribesIndia.com – helps tribal communities market their products online nationwide.
Sustainable Economic Growth
Growth must be environmentally sustainable to ensure long-term inclusivity.
Adoption of energy-efficient processes and green technologies to reduce carbon emissions.
Focus on renewable energy, circular economy, and sustainable agriculture.
| Measure | Expected Impact |
|---|---|
| Financial Inclusion | Greater access to banking, credit, insurance for poor |
| Skill Development | Higher employability of youth, harnessing demographic dividend |
| Social Sector Investment | Improved health, education, sanitation, housing |
| Technological Advancement | Bridges digital divide, new opportunities for marginalized groups |
| Sustainable Growth | Green economy, reduced carbon footprint, long-term welfare |
Prelims tips
- Jan Dhan-Aadhaar-Mobile (JAM) Trinity is key to financial inclusion.
- Skill India Mission launched in 2015 to train 40 crore youth by 2022.
- India’s demographic dividend window: till 2055.
- TribesIndia.com: e-commerce platform for tribal products.
Mains points
- Inclusive growth requires expanding financial access, promoting skilling, and social sector investments.
- Digital inclusion and technological innovation are key to bridging inequality gaps.
- Sustainable growth is essential to balance environment with development.
- Policy focus must shift from GDP-centric growth to people-centric growth.
Need for Inclusive Growth
Inclusive growth is essential for India to reduce poverty, remove inequalities, improve access to services, and ensure that economic progress benefits every section of society equally.
Lack of Accessibility to Core Public Services
Public spending on healthcare (1.5% of GDP) and education (4.4% of GDP) is much lower than global standards.
Even where services exist, delivery is often poor and uneven across states and districts.
Example: Many rural areas lack functional schools, doctors, and quality hospitals.
High Prevalence of Malnutrition and Undernourishment
NFHS-5 report: Anaemia rates have increased across all groups – children under 5 years, adolescent girls & boys, and pregnant women.
Every second woman, and 2 out of 3 children (6–59 months) are anaemic.
India also ranks among the highest globally in stunting (low height for age) and wasting (low weight for height).
This reflects poor health outcomes despite GDP growth.
Economic and Social Inequalities
Large disparities exist both between states and within states.
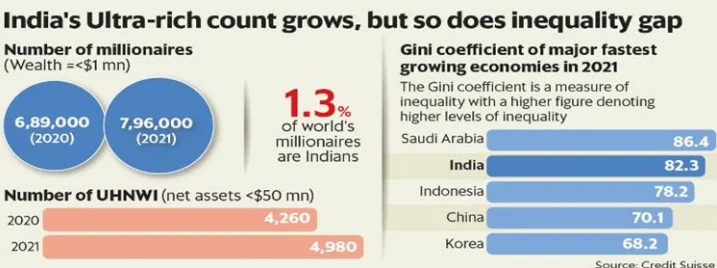
Rising income inequality: The richest 10% hold 77% of India’s wealth (Oxfam report).
Causes: Crony capitalism, inheritance-driven wealth, weak redistribution policies.
Poor states with low public service delivery (like Bihar, Jharkhand) lag behind developed ones (like Kerala, Gujarat).
Uneven Economic Growth across Sectors and Regions
Agriculture’s share in GDP has declined sharply, while services sector contribution is growing.
Many regions (metros, coastal states) have grown faster compared to hinterland states.
This creates a rural–urban divide and regional imbalance.
Demand for Skilled Labour
Globalisation, FDI inflows, and technological changes (automation, AI, Industry 4.0) demand a highly skilled workforce.
India faces skill gaps: conventional skills are not sufficient for new-age jobs.
Labour laws often discourage formal employment, leading to 'casualization' of labour (short-term, insecure jobs without social security).
Example: IT sector and manufacturing demand high skill, but majority of workforce is still in low-skill agriculture and informal jobs.
Inequality in India
Inequality refers to the unequal distribution of income, wealth, status, rights, and opportunities among individuals or groups. In India, inequality exists both in economic and social terms, affecting development and inclusivity.
Definition of Inequality
United Nations: Inequality = condition of being unequal, especially in terms of status, rights, and opportunities.
Types of Inequality
Economic Inequality: Unequal distribution of income and opportunities within society.
Example: Wealth concentrated in a small section while majority struggle with poverty.
Social Inequality: Unequal access to resources based on social categories like caste, religion, gender, ethnicity, etc.
Example: Women facing wage gaps, caste-based discrimination in education and jobs.
Status of Inequality in India (Oxfam 2023 Report)
Top 5% of Indians hold over 60% of the nation’s wealth.
Bottom 50% of the population owns only 3% of wealth.
Between 2012–2021, top 1% gained 40% of the wealth generated in India.
Gini Coefficient (income inequality index) rose from 0.32 in 1983 → 0.36 in 2019.
Key Concepts
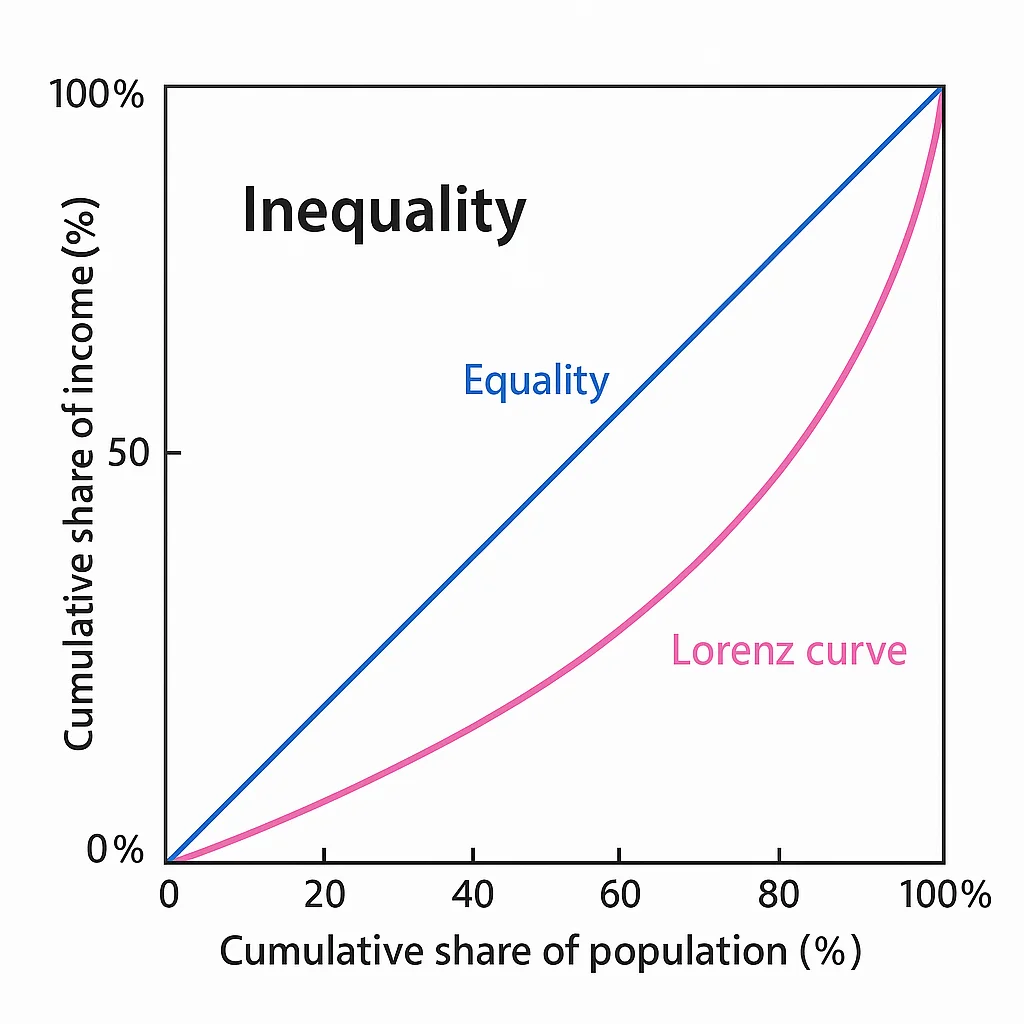
Gini Coefficient: Statistical measure of inequality (0 = perfect equality, 1 = perfect inequality). Higher values indicate greater inequality.
Lorenz Curve: Graph showing share of income earned by different population groups. The farther it bends away from the equality line, the greater the inequality.
Pro-poor growth: growth in which the incomes of the poor rise faster than average (relative definition) or at least rise enough to reduce poverty (absolute definition) – a core idea behind inclusive growth.
| Aspect | Economic Inequality | Social Inequality |
|---|---|---|
| Meaning | Unequal income and wealth distribution | Unequal access based on caste, religion, gender, etc. |
| Example | Richest 5% own 60% of wealth | Caste discrimination, gender wage gap |
| Impact | Widening rich-poor gap | Marginalisation of weaker communities |
Prelims tips
- Gini Coefficient is the most used tool for inequality measurement (0 = equality, 1 = inequality).
- Oxfam 2023: Top 5% Indians hold 60% wealth, bottom 50% hold just 3%.
- Lorenz Curve is graphical representation of inequality.
Reasons for Inequality in India
Inequality in India arises due to a mix of historical, social, and economic factors. It is reinforced by wealth concentration, dependence on agriculture, poor social safety nets, and unequal access to opportunities.
Historical Reasons
Discrimination against marginalized groups (like lower castes, tribal communities, women) limited their access to education, healthcare, and jobs for centuries.
This historical disadvantage continues to affect opportunities in the present.
Wealth Accumulation
Concentration of Wealth: A small group controls most wealth, passing advantages to their children, perpetuating inequality.
Inadequate Land Reforms: Many families remain landless or own small plots, making them vulnerable to poverty.
Crony Capitalism: Nepotism, favoritism, and corruption help the wealthy and connected accumulate more wealth, leaving others behind.
Dependence on Agriculture
Nearly 45% of Indians still depend on agriculture, but agriculture’s share in GDP is shrinking.
This mismatch keeps rural populations poor compared to urban populations that benefit from services and industry.
Tax Policy
Heavy reliance on indirect taxes (like GST) affects rich and poor equally.
Poor households spend a larger share of their income on taxed goods, worsening inequality.
Rural-Urban Divide
Rural areas lack job diversification, industries, and infrastructure.
Urban regions attract investment and better wages, widening the income gap.
Lack of Inclusive Growth Policies
Skewed Distribution: Benefits of economic growth are often cornered by urban elites and specific industries.
Regressive Taxation: Policies sometimes favor the wealthy instead of reducing inequality.
Weak Social Safety Nets: Insufficient welfare schemes mean the vulnerable have no cushion during crises (e.g., pandemic).
| Cause | Explanation |
|---|---|
| Historical Discrimination | Marginalized groups denied equal access to education, jobs, healthcare |
| Wealth Concentration | Wealth remains with a small elite, inherited by their next generations |
| Agricultural Dependence | Large workforce in low-income agriculture while GDP share shrinks |
| Tax Policy | Heavy reliance on indirect taxes burdens the poor |
| Rural-Urban Divide | Lack of infrastructure and jobs in rural areas widens income gap |
| Weak Social Policies | Absence of strong welfare schemes and inclusive policies increases inequality |
Measuring Inclusive Growth
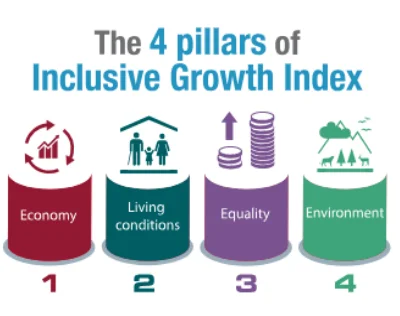
Inclusive growth cannot be measured only by GDP. Alternative indices like Inclusive Development Index, Social Progress Index, and Financial Inclusion Index help capture broader aspects such as equity, sustainability, social welfare, and access to financial services.
Inclusive Development Index (IDI)
Developed by the World Economic Forum as an alternative to GDP.
Assumes that people measure progress by their living standards, not just by GDP.
Based on three parameters and 12 indicators:
1. Growth and Development (4 indicators)
2. Inclusion (4 indicators)
3. Intergenerational Equity and Sustainability (4 indicators).
India ranked 62nd out of 74 emerging economies, and was the least inclusive among G-20 countries.
Social Progress Index (SPI)
Focuses on outcomes of government measures, not just the money spent.
Measures efficiency – how effectively public spending improves people's lives.
Captures social welfare like health, education, rights, and environment.
Financial Inclusion Index (FI-Index)
Developed by RBI in 2021, published every year in July.
No fixed base year; it is comprehensive and dynamic.
Covers five sectors: Banking, Investments, Insurance, Postal, and Pension.
Composite FI-Index for 2022 improved to 56.4 (from 53.9 in 2021), showing gradual progress in financial inclusion.
Limitations of Other Indices
GDP: Excludes factors like pollution, income inequality, and well-being.
Gini Coefficient: Considers only income inequality, ignoring social inequalities and opportunities.
Gross National Happiness Index: May overlook aspects like gender neutrality and detailed economic measures.
Human Development Index: Ignores income distribution and inequality, despite measuring health, education, and income.
| Index | What it Measures | Limitations |
|---|---|---|
| Inclusive Development Index | Growth, inclusion, sustainability across generations | Does not cover all social dimensions |
| Social Progress Index | Outcomes of public spending on welfare | Does not capture income directly |
| Financial Inclusion Index | Access to banking, insurance, pensions, investments | Still evolving, does not reflect quality of access |
| GDP | Monetary value of goods and services | Ignores inequality, environment, welfare |
| Gini Coefficient | Income inequality | Ignores social or opportunity inequality |
Measures Taken by India for Inclusive Growth
Since Independence, India has taken multiple measures to promote inclusive growth, focusing on rapid yet equitable development. NITI Aayog’s New India @75 vision highlights inclusivity in education, health, urban development, and technology-led growth.
NITI Aayog’s New India @75 Vision
Aim: Rapid growth of 9-10% by 2022-23 which is inclusive, clean, sustained and formalised.
Technology to be leveraged for sustainable and participatory development.
Urban inclusivity: Ensure urban poor, slum dwellers and migrants can access basic city services.
Inclusive schools: Focus on infrastructure like accessible toilets, fair admissions, and inclusive curriculum.
Inclusive higher education: Special focus on vulnerable groups.
Inclusive healthcare: Ambulatory services providing diagnostic, curative, rehabilitative and palliative care close to people.
Government Initiatives: Short-term vs Long-term Policies
Short-term Policies
Aim to supply essential goods and services to the marginalised sections immediately.
Examples: Food and nutrition programmes, healthcare and sanitation schemes, housing, and drinking water provisions.
Long-term Policies
Aim to make the population self-reliant in the long run.
Examples: Poverty alleviation schemes, education programmes, skill development, vocationalisation of education.
Policy Approaches Since Independence
Growth Oriented Policy
First Five Year Plan (1951-56): Balanced and rapid growth.
Twelfth Plan (2012-17): Faster and more inclusive growth.
Concern: Growth has not been equally shared, leading to rising inequality.
Direct Intervention
Use of legislation, regulation, credit assistance, livelihood security.
Post-1991 reforms: Government shifted from regulator to facilitator.
Focus on financial inclusion (e.g., PM Jan Dhan Yojana).
Capacity Building
Skill development, entrepreneurship, and rural training.
Improve efficiency, accountability, and transparency in governance.
Welfare Schemes
Targeted schemes for disadvantaged groups.
Examples: Food subsidies, nutrition schemes, scholarships for SC/ST/minorities, PM Jan Aarogya Yojana.
Public Participation
Participation of citizens in governance is crucial.
Examples: Atal Bhujal Yojana (community-based groundwater management), SHGs, Kerala’s Kudumbashree for women empowerment.
Prelims tips
- NITI Aayog’s New India @75 vision emphasises inclusivity in education, healthcare, and technology.
- PM Jan Dhan Yojana is India’s flagship initiative for financial inclusion.
- Kudumbashree (Kerala) is a classic example of women’s empowerment through SHGs.
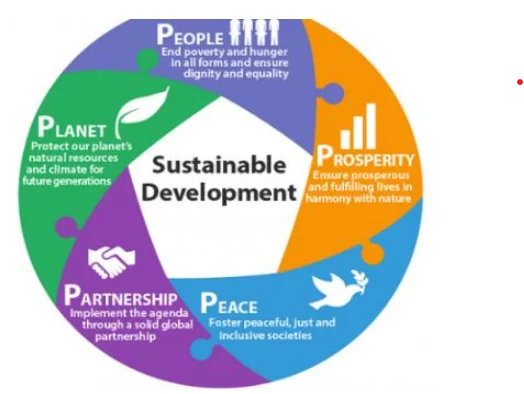
Sustainable Development
Sustainable Development means meeting present needs without compromising the ability of future generations to meet their own needs. It integrates economic growth, environmental protection, and social justice.
Origin of Sustainable Development
1972: Concept first discussed at United Nations Conference on Human Environment (Stockholm).
1987: Brundtland Report 'Our Common Future' introduced the famous definition of sustainable development and linked economy, environment, and social inclusion.
1992: Earth Summit (UNCED, Rio de Janeiro) – Adopted Rio Declaration with 27 principles of sustainable development, including precautionary principle and polluter pays principle.
Concept of Sustainable Development
Balance between consumption of natural resources and their conservation.
Economic growth is necessary for welfare, but it must not cause irreparable damage to the environment.
Development should be long-term, environmentally safe, and socially fair.
Principles of Sustainable Development
1. Living within Environmental Limits
Using natural resources responsibly so that they can regenerate.
Example: Using solar and wind energy instead of depleting coal reserves.
2. Integrated Decision-Making
Policies must align economic, social, and environmental goals.
Example: A new industry must create jobs but also control pollution.
3. Good Governance
Decisions should be democratic, transparent, inclusive, participatory, and accountable.
Example: Public consultations before approving a large dam project.
4. Responsible Use of Science
Scientific evidence should guide policy-making.
Example: IPCC climate reports influencing global climate agreements.
Key Doctrines
Precautionary Principle
If there is a risk of severe or irreversible damage, preventive steps should be taken even if full scientific certainty is lacking.
Example: Ban on harmful pesticides when evidence suggests long-term health damage.
Polluter Pays Principle
Those who cause pollution should bear the cost of managing it, not society at large.
Example: European Union’s Emissions Trading Scheme where carbon-emitting industries must pay for their emissions.
Prelims tips
- Brundtland Report (1987) gave the famous definition of sustainable development.
- Earth Summit 1992 (Rio) adopted 27 principles including Precautionary & Polluter Pays.
- Polluter Pays Principle: First applied widely in EU’s carbon trading system.
Millennium Development Goals (MDGs)
The Millennium Development Goals (MDGs) were 8 international goals set by the United Nations in 2000, to be achieved by 2015. They focused on poverty reduction, education, health, gender equality, environment, and global cooperation.
Background
MDGs were adopted from the United Nations Millennium Declaration (2000).
Signed by 189 member states, including India.
Provided measurable targets for poverty, health, education, gender, and environment.
Timeframe: 1990 (baseline) to 2015 (target year).
8 Millennium Development Goals
1. Eliminate extreme poverty and hunger.
2. Achieve universal primary education.
3. Promote gender equality and empower women.
4. Reduce child mortality.
5. Improve maternal health.
6. Combat HIV/AIDS, malaria, and other diseases.
7. Ensure environmental sustainability.
8. Develop a global partnership for development.
India’s Achievements
1. Poverty & Hunger
1990 Poverty Headcount Ratio (PHCR) = 47.8%. Target for 2015 = 23.9%.
In 2011-12, PHCR was 21.9% (target achieved).
Malnourishment declined to 40% in 2015, but target was 26% (not achieved).
2. Universal Primary Education
Primary enrolment and completion rates improved significantly.
Male youth literacy ~94.8% and female youth literacy ~92.5% (close to universal literacy).
3. Gender Equality
Representation of women in Parliament: only 12.24% in 2015 (far below 50% target).
Progress made in school enrolment, but political empowerment lagged behind.
4. Child Mortality
Under-5 mortality rate (U5MR) declined from 125 per 1,000 (1990) to 49 (2013).
Target = 42 per 1,000. India was moderately on track.
5. Maternal Health
Maternal Mortality Ratio (MMR) dropped from 437 per 100,000 (1990) to 167 in 2009.
Target = 109 per 100,000 by 2015. Progress made but target not achieved.
6. Combating Diseases
HIV, malaria, and tuberculosis prevalence declined steadily.
India broadly on track in this area.
7. Environmental Sustainability
Forest cover increased to 21.23% (addition of ~5871 sq. km).
Protected areas covered 4.83% of land area.
8. Global Partnership
India became an important development partner.
Extended technical, economic, and intellectual cooperation to other nations.
| Goal | Target for 2015 | India’s Achievement |
|---|---|---|
| Poverty | Reduce PHCR to 23.9% | Achieved 21.9% |
| Hunger | Reduce malnutrition to 26% | Reached 40% (Not achieved) |
| Primary Education | Universal enrolment | Literacy 92-95% |
| Gender Equality | 50% women in parliament | 12.24% achieved |
| Child Mortality | 42 per 1000 | 49 per 1000 (Moderate progress) |
| Maternal Health | 109 per 100,000 | 167 per 100,000 (Not achieved) |
| Diseases | Decline in HIV, malaria, TB | On track |
| Environment | Increase green cover | Forest cover 21.23% |
| Global Partnership | Strengthened cooperation | India became donor and partner |
Sustainable Development Goals (SDGs)
The Sustainable Development Goals (SDGs) are a set of 17 global goals adopted by UN member states in 2015 as part of the 2030 Agenda for Sustainable Development. They aim to end poverty, protect the planet, and ensure prosperity for all by 2030.
Background
Origin: At the UN Conference on Sustainable Development (Rio+20), Rio de Janeiro, June 2012.
Outcome Document: 'The Future We Want' launched the process of creating SDGs.
Adoption: Officially adopted at the UN Sustainable Development Summit, September 2015.
Framework: 2030 Agenda for Sustainable Development with 17 Goals and 169 targets.
Support: UN Department of Economic and Social Affairs (UN-DESA) provides technical support and capacity building.
Key Features of SDGs
Global in nature, applying to both developed and developing countries.
Integrated approach—linking economic growth, social inclusion, and environmental sustainability.
Goals cover poverty, hunger, health, education, gender equality, clean water, clean energy, decent work, innovation, reduced inequalities, climate action, and peace.
Timeframe: 2015–2030.
Builds on Millennium Development Goals (MDGs) but more comprehensive with broader targets.
17 Sustainable Development Goals
1. No Poverty.
2. Zero Hunger.
3. Good Health and Well-being.
4. Quality Education.
5. Gender Equality.
6. Clean Water and Sanitation.
7. Affordable and Clean Energy.
8. Decent Work and Economic Growth.
9. Industry, Innovation, and Infrastructure.
10. Reduced Inequalities.
11. Sustainable Cities and Communities.
12. Responsible Consumption and Production.
13. Climate Action.
14. Life Below Water.
15. Life on Land.
16. Peace, Justice, and Strong Institutions.
17. Partnerships for the Goals.
| Aspect | MDGs (2000–2015) | SDGs (2015–2030) |
|---|---|---|
| Number of Goals | 8 Goals | 17 Goals |
| Targets | 21 Targets | 169 Targets |
| Focus | Developing countries | All countries (developed + developing) |
| Approach | Mainly social sectors (health, education) | Integrated: economic, social, environmental |
| Timeframe | 2000–2015 | 2015–2030 |
Prelims tips
- SDGs adopted in 2015 at UN Sustainable Development Summit.
- 17 Goals + 169 Targets; Timeframe: 2015–2030.
- SDGs are universal, unlike MDGs which focused on developing countries.
- India’s progress is tracked by NITI Aayog through SDG India Index.
Mains points
- SDGs focus on inclusiveness, sustainability, and global partnership.
- They go beyond MDGs by addressing environment, inequality, and governance.
- India integrates SDGs in planning through NITI Aayog’s indices and state-level action.
- Challenges: financing, climate change, inequality, and monitoring progress.
- Importance: Long-term vision for balanced growth, social justice, and environmental sustainability.
Green GDP & Energy Efficiency in India
Green GDP is an adjusted measure of GDP that accounts for environmental costs like resource depletion and pollution. India, through policies like Ujjwala, PAHAL, and Bureau of Energy Efficiency initiatives, is working towards inclusive and sustainable growth.
Green GDP
Introduced by UN Handbook in 1993.
Definition: GDP adjusted for environmental degradation, natural resource depletion, and biodiversity loss.
Formula: Green GDP = GDP – (Cost of environmental damage + Resource depletion).
Importance: Encourages sustainable policies by showing the ‘real’ cost of growth.
Example: If GDP grows by building industries but forests are destroyed, Green GDP deducts the value of destroyed forests.
Energy Access Challenges
Large disparity between rural and urban households.
Rural households rely heavily on non-commercial biomass (firewood, dung cakes) → causes indoor air pollution and health hazards.
NSSO 2011-12: 81% of rural households and 59% of urban poor households depend on firewood.
Initiatives:
Pradhan Mantri Ujjwala Yojana: Provides LPG connections to poor households, reducing smoke-related health issues.
PAHAL (DBTL): Direct Benefit Transfer for LPG subsidies, reducing leakages. Recognized by Guinness Book of World Records.
Energy Efficiency
Concept: Using less energy for same output → lowers costs, reduces emissions.
Energy Conservation Act (2001) established Bureau of Energy Efficiency (BEE).
Energy Efficiency Programmes:
1. Standards & Labelling (2006): Star rating (1–5 stars) for appliances to guide consumers on energy efficiency.
2. SMEs: Energy-saving demonstration projects in textiles, bricks, food clusters.
3. Buildings:
Energy Conservation Building Code (ECBC): Minimum efficiency standards for new commercial buildings.
Eco-Niwas Samhita (2018): Energy code for residential buildings.
4. Industries:
Perform, Achieve, Trade (PAT) Scheme: Assigns energy reduction targets to industries. Extra savings converted into tradable Energy Saving Certificates (ESCerts).
5. UJALA Scheme (2015): Promotes use of affordable LED bulbs nationwide, reducing energy demand.
| Aspect | Conventional GDP | Green GDP |
|---|---|---|
| Focus | Economic output only | Economic + Environmental costs |
| Environment | Ignored | Accounted (degradation, resource use) |
| Policy Impact | Encourages growth at all costs | Encourages sustainable growth |
| Example | Building factories increases GDP | Deducts cost of deforestation in GDP |
Prelims tips
- Green GDP = GDP – Environmental Degradation – Resource Depletion.
- India’s Ujjwala Yojana & PAHAL improve clean energy access.
- PAT Scheme + UJALA are flagship energy efficiency programmes under BEE.
Mains points
- Green GDP highlights real cost of growth by deducting environmental damage.
- Energy efficiency ensures sustainable development while meeting energy needs.
- Programmes like PAT, ECBC, and UJALA reduce energy intensity of economy.
- Challenges: Rural energy dependence on biomass, rising emissions, and need for clean technology adoption.
- Way forward: Strengthen renewable energy, expand financial inclusion in energy access, periodic review of energy codes.
Schemes for Inclusive Growth in India
Inclusive Growth requires policies that ensure equitable access to finance, jobs, agriculture, skills, and technology. The Government of India has launched several flagship schemes across these domains.
Financial Inclusion Schemes
Pradhan Mantri Jan Dhan Yojana (PMJDY): Provides universal banking services with zero-balance accounts, RuPay debit cards, and overdraft facility.
Pradhan Mantri Jeevan Jyoti Bima Yojana (PMJJBY): Life insurance of ₹2 lakh at a premium of ₹330 per year.
Pradhan Mantri Suraksha Bima Yojana (PMSBY): Accidental insurance of ₹2 lakh at a premium of ₹12 per year.
Atal Pension Yojana (APY): Pension scheme for unorganised workers ensuring lifelong financial security.
Pradhan Mantri Mudra Yojana (PMMY): Provides collateral-free loans up to ₹10 lakh to small businesses under Shishu, Kishor, and Tarun categories.
JAM Trinity (Jan Dhan, Aadhaar, Mobile): Enables direct transfer of subsidies and benefits to beneficiaries, reducing leakages.
Employment and Inclusive Growth
MGNREGA: Provides 100 days of guaranteed wage employment to rural households.
Skill Training for Employment Promotion among Urban Poor (STEP-UP): Enhances employability of urban poor through skill development.
Swaran Jayanti Shahari Rozgar Yojna (SJSRY): Provides employment to urban poor through training and self-employment support.
Agriculture and Inclusive Growth
Pradhan Mantri Krishi Sinchayee Yojana (PMKSY): Aims to achieve ‘Har Khet Ko Pani’ and improve water-use efficiency (‘More crop per drop’).
National Agriculture Market (e-NAM): Online trading platform for transparent agricultural marketing.
National Food Security Act (NFSA): Provides subsidised food grains to nearly two-thirds of India’s population.
Technology and Inclusive Growth
Digital India Programme: Aims to transform India into a digitally empowered society and knowledge economy. Includes BharatNet, e-Governance, and Digital Literacy initiatives.
Skill Development and Inclusive Growth
National Skill Development Mission: Umbrella framework for skill training initiatives across sectors.
Pradhan Mantri Kaushal Vikas Yojana (PMKVY): Provides industry-relevant skill training with certification.
Deen Dayal Upadhyaya Grameen Kaushalya Yojana (DDU-GKY): Focuses on skill development and employment for rural youth.
Pradhan Mantri Vidya Lakshmi Karyakram: Provides education loans and scholarships to students through a single online portal.
Self-Employment and Talent Utilisation (SETU): Supports startups and innovation-driven entrepreneurship.
Atal Innovation Mission (AIM): Promotes innovation, incubation centres, and Atal Tinkering Labs in schools.
| Domain | Key Schemes |
|---|---|
| Financial Inclusion | PMJDY, PMJJBY, PMSBY, APY, PMMY, JAM Trinity |
| Employment | MGNREGA, STEP-UP, SJSRY |
| Agriculture | PMKSY, e-NAM, NFSA |
| Technology | Digital India |
| Skill Development | NSDM, PMKVY, DDU-GKY, Vidya Lakshmi, SETU, AIM |
Prelims tips
- JAM Trinity is key enabler of DBT (Direct Benefit Transfer).
- MGNREGA provides 100 days of guaranteed employment.
- PMKSY aims for 'More crop per drop' (efficient irrigation).
- Digital India + AIM promote technology-driven inclusive growth.
Mains points
- Inclusive growth in India requires bridging rural-urban divide via finance, jobs, agriculture, skills, and technology.
- Schemes like PMJDY and MUDRA enhance financial inclusion.
- MGNREGA provides social security and rural demand push.
- Skill programmes like PMKVY & DDU-GKY make youth employable.
- Digital India & AIM boost innovation and tech inclusiveness.
Demographic Dividend
Demographic Dividend refers to the economic growth potential that can result from shifts in a population’s age structure, mainly when the share of the working-age population (15 to 64 years) is larger than the non-working-age share of the population (14 and younger, and 65 and older).
What is Demographic Dividend?
It is a 'window of opportunity' in a country's development when it has a relatively high proportion of working-age people.
This leads to fewer dependents (children and elderly) for each working adult.
This shift can boost economic growth if the larger workforce is educated, healthy, and productively employed.
India's Demographic Dividend
India has one of the youngest populations in the world. The median age is around 28 years.
This 'dividend' phase started around 2005-06 and is expected to last till 2055-56 (UNFPA).
Tapping the Dividend
The dividend is not automatic. To realize it, India must invest in:
Human Capital: Quality education and skill development (like Skill India Mission) to make the workforce employable.
Health: Ensuring a healthy workforce (e.g., Ayushman Bharat).
Job Creation: Creating sufficient high-productivity jobs (e.g., Make in India, Start-up India).
Governance: Good policies to promote investment and economic growth.
Challenges
If not managed, the dividend can become a 'demographic disaster'.
Jobless Growth: Economy growing without creating enough jobs.
Skill Mismatch: Workforce skills do not match industry demands.
Low Female Labour Force Participation (FLFP): A large part of the potential workforce (women) is not participating in the economy.
Prelims tips
- Demographic Dividend: High share of working-age population (15-64 years).
- India's window of opportunity: Approx. 2005 to 2055.
- Key requirements to tap dividend: Education, Skills, Health, and Jobs.
Mains points
- The demographic dividend offers a limited-time opportunity for rapid economic growth.
- It is not a guarantee; it depends entirely on policy choices related to human capital development (health, education, skills).
- Failure to create jobs and improve skills can turn the dividend into a demographic burden, leading to social unrest.
Demographics
Demographics is the statistical study of human populations. For UPSC, it involves understanding India's population structure (age, sex, location, literacy) and its implications for planning and development.
What is Demographics?
It is the study of a population based on factors such as age, sex, education, income, occupation, religion, marital status, and geographic location.
Data is primarily collected through the Census (conducted every 10 years) and surveys like the National Family Health Survey (NFHS).
Key Demographic Concepts
Population Growth Rate: The rate at which the number of individuals in a population increases.
Birth Rate (Crude Birth Rate): The number of live births per 1,000 people per year.
Death Rate (Crude Death Rate): The number of deaths per 1,000 people per year.
Total Fertility Rate (TFR): The average number of children a woman would have in her lifetime.
Sex Ratio: The number of females per 1,000 males in a population.
Literacy Rate: The percentage of the population aged 7 and above who can read and write with understanding.
Urbanization: The increase in the proportion of people living in urban areas.
India's Demographic Profile
Population: Over 1.4 billion (world's most populous country).
Age: Young population (Median age ~28), forms the basis of the 'Demographic Dividend'.
TFR: India's TFR has fallen to 2.0 (NFHS-5), which is below the replacement level of 2.1. This indicates population stabilization.
Sex Ratio: 943 females per 1000 males (Census 2011). Sex ratio at birth is a key concern.
Regional Variation: Southern states (like Kerala, Tamil Nadu) have aging populations and low TFR, while Northern states (like UP, Bihar) have younger populations and higher TFR.
Prelims tips
- Census is the primary source of demographic data in India.
- India's TFR is 2.0 (below replacement level 2.1) as per NFHS-5.
- Demographic Transition: Shift from high birth/death rates to low birth/death rates.
Mains points
- Demographic data is crucial for policy formulation, resource allocation, and achieving inclusive growth.
- India's demographic diversity (North-South divide) requires region-specific policies rather than a one-size-fits-all approach.
- Issues like low sex ratio at birth and female workforce participation must be addressed to ensure inclusive development.
Growth vs Development
Economic Growth is a quantitative measure of the increase in a country's economic output (like GDP), while Economic Development is a qualitative measure of the improvement in the quality of life and well-being of the population (like HDI).
Economic Growth
Concept: Increase in the real monetary value of goods and services produced by an economy over time.
Measurement: Typically measured by the percentage increase in real Gross Domestic Product (GDP) or Gross National Income (GNI).
Nature: Quantitative. It's a single-dimensional concept.
Example: India's economy growing at 7% per year.
Economic Development
Concept: A broader concept that includes economic growth plus improvements in social, political, and human well-being.
Measurement: Measured by indices like the Human Development Index (HDI), Gender Inequality Index (GII), and Physical Quality of Life Index (PQLI).
Nature: Qualitative and multi-dimensional. It implies structural changes in the economy and society.
Components: Includes factors like poverty reduction, improved literacy and health, lower inequality, and better infrastructure.
Key Relationship
Growth is necessary but not sufficient for Development.
A country can have high economic growth (rising GDP) but poor development (high inequality, pollution, low literacy). This is 'Jobless Growth' or 'Non-Inclusive Growth'.
Economic development requires economic growth to generate the resources (like tax revenue) needed to fund social programs (schools, hospitals).
Inclusive Growth is the bridge: It aims to ensure that economic growth (GDP increase) translates into economic development (better lives for all).
| Parameter | Economic Growth | Economic Development |
|---|---|---|
| Nature | Quantitative (मात्रात्मक) | Qualitative (गुणात्मक) |
| Main Indicator | GDP, GNI | HDI, GII, PQLI |
| Scope | Narrow (संकीर्ण) | Broad (व्यापक) |
| Focus | Increase in output | Improvement in quality of life |
Prelims tips
- Growth = Quantitative (e.g., GDP).
- Development = Qualitative (e.g., HDI).
- Development = Growth + Standard of Living.
- HDI includes: Life Expectancy, Education, and GNI per capita.
Mains points
- India's policy focus has shifted from just economic growth (pre-1990s) to inclusive growth and development (post-1990s).
- Economic growth is a means to an end; the end is human development.
- Inclusive growth policies (like financial inclusion, social sector spending) are essential to convert growth into development.
Outcomes of Inclusive Growth
The outcomes of inclusive growth are the tangible and intangible benefits that arise when economic progress is broad-based and equitable, leading to a more stable, prosperous, and just society.
Key Outcomes of Inclusive Growth
Achieving inclusive growth leads to several positive outcomes for a nation:
1. Poverty Reduction
This is the most direct outcome. When growth is inclusive, the poorest sections of society participate in and benefit from it, leading to a faster decline in poverty rates.
2. Reduced Inequality
It aims to narrow the gap between the rich and the poor, and between different regions and social groups (e.g., rural-urban, gender). This reduces social friction.
3. Broad-based Improvement in Quality of Life
Benefits go beyond just income. It leads to better access to essential services for all, including:
Health: Improved life expectancy, lower infant mortality.
Education: Higher literacy rates, better school enrollment.
Basic Amenities: Access to clean water, sanitation, and housing.
4. Social Cohesion and Political Stability
When people feel that the system is fair and they have an opportunity to succeed, it reduces social unrest, crime, and conflict. This fosters national unity and political stability.
5. Productive Employment
Instead of 'jobless growth', inclusive growth creates decent and productive jobs that provide fair wages and social security, utilizing the nation's human capital effectively.
6. Sustainable Development
Inclusive growth is inherently long-term. It implies that growth is not just for the present generation but is also environmentally sustainable, protecting resources for future generations.
7. Balanced Regional Development
It ensures that economic opportunities are not concentrated in a few cities or states, but are spread across the country, reducing forced migration and regional disparities.
Prelims tips
- Outcomes of Inclusive Growth: Poverty Reduction, Lower Inequality, Social Stability.
- It connects economic growth with social justice.
- It helps in achieving SDG 1 (No Poverty) and SDG 10 (Reduced Inequalities).
Mains points
- The ultimate goal of any economic policy should be the outcomes of inclusive growth, not just growth itself.
- These outcomes create a virtuous cycle: lower inequality leads to higher domestic demand, which in turn fuels more stable and sustainable growth.
- A society with these outcomes is more resilient to economic shocks.
Sectoral Focus for Inclusive Growth
To achieve inclusive growth, policies cannot be uniform. They must focus on specific sectors that have a high potential for job creation, poverty reduction, and connecting the marginalized to the economic mainstream.
Key Sectors for Inclusive Growth in India
1. Agriculture and Rural Development
Why: Over 45% of India's workforce is in agriculture, and a large proportion of the poor live in rural areas.
Focus: Increasing farmer income (not just output), improving irrigation (PM Krishi Sinchayee Yojana), market linkages (e-NAM), crop insurance (PM Fasal Bima Yojana), and promoting allied sectors like dairy and fisheries.
2. MSME (Micro, Small, and Medium Enterprises)
Why: This sector is the largest job creator after agriculture. It promotes regional balance and entrepreneurship.
Focus: Improving access to credit (MUDRA Yojana), technology upgradation, formalization (to provide social security), and linking them to larger supply chains.
3. Social Sector (Health and Education)
Why: These sectors build Human Capital, which is essential for a productive workforce (Demographic Dividend).
Focus: Ensuring affordable and quality healthcare for all (Ayushman Bharat) and equitable access to quality education and skill development (NEP 2020, Skill India).
4. Infrastructure (especially Rural and Urban)
Why: Infrastructure (roads, electricity, internet) is the backbone of the economy. It connects markets, reduces logistics costs, and improves access to services.
Focus: Rural roads (PM Gram Sadak Yojana), universal electricity (Saubhagya), digital connectivity (BharatNet), and affordable urban housing (PM Awas Yojana).
5. Labour-Intensive Manufacturing
Why: To absorb the large number of workers moving out of agriculture.
Focus: Promoting sectors like textiles, food processing, and electronics manufacturing (PLI Scheme) that can create jobs at scale.
Prelims tips
- MSME sector is the largest job creator after agriculture.
- BharatNet: Aims to provide broadband connectivity to all Gram Panchayats.
- MUDRA Yojana: Provides loans to non-corporate, non-farm small/micro enterprises.
Mains points
- A sectoral approach is vital for inclusive growth, as different sectors have different capacities for job creation and poverty alleviation.
- Connecting agriculture, industry (MSME), and services is key. For example, promoting the food processing industry (a manufacturing sector) adds value to agricultural produce and creates jobs.
- Investment in the social sector (health/education) is not just a welfare measure but a critical economic investment to improve productivity.
Self-Help Groups, Microfinance and DAY-NRLM
A Self-Help Group (SHG) is a group of about 10–20 people, mostly women from poor households, who save regularly, lend to each other and borrow from banks as a group. Through the NABARD SHG-Bank Linkage Programme (1992) and Deendayal Antyodaya Yojana–National Rural Livelihoods Mission (DAY-NRLM, 2011), SHGs have become a vehicle for financial inclusion, livelihoods and women's empowerment.
1. How SHGs Work
Savings first: Members pool small regular savings and lend internally.
Group guarantee: Peer pressure replaces collateral; banks lend to the group.
Federation: SHGs form village organisations and cluster-level federations for larger activities.
Panchasutra: Regular meetings, regular savings, internal lending, timely repayment, up-to-date books.
2. Programmes
SHG-Bank Linkage Programme (NABARD, 1992): The world's largest microfinance programme by number of clients.
DAY-NRLM (2011, renamed 2016): Mobilises one woman from each poor rural household into SHGs; provides revolving fund, community investment fund, interest subvention and skill training (DDU-GKY, RSETIs).
DAY-NULM: Urban counterpart.
Lakhpati Didi: Aim to help SHG women earn at least ₹1 lakh a year; target raised to 3 crore women (2024).
Kudumbashree (Kerala, 1998): State poverty-eradication mission working through neighbourhood groups.
3. Microfinance Institutions (MFIs)
Lend small loans without collateral, often through Joint Liability Groups.
Andhra Pradesh microfinance crisis (2010): Over-lending and coercive recovery led to the Malegam Committee (2011) and RBI regulation of NBFC-MFIs.
RBI framework (2022): Common rules for all lenders to low-income households (annual household income up to ₹3 lakh), with a cap on repayment burden.
4. Impact
Access to credit and savings; reduced dependence on moneylenders; women's confidence, mobility and voice in panchayats; delivery channel for schemes (e.g. Namo Drone Didi, Bank Sakhis).
5. Challenges
Regional imbalance (strong in the South); low-value livelihoods; weak market linkages; dormant groups; over-indebtedness from multiple loans; patriarchal control over loans.
6. Way Forward
Move from credit to enterprise—market linkages, value chains, digital bookkeeping, insurance, and convergence with FPOs and local governments.
| Feature | SHG model | MFI model |
|---|---|---|
| Starting point | Savings of members | Loan from the institution |
| Lender | Banks (linkage) | NBFC-MFIs, banks |
| Group role | Owns and manages funds | Joint liability for repayment |
| Regulator | Bank/NABARD guidelines | RBI microfinance framework |
Prelims tips
- SHG-Bank Linkage Programme was launched by NABARD in 1992.
- NRLM (2011) was renamed DAY-NRLM in 2016.
- Malegam Committee (2011) followed the Andhra Pradesh microfinance crisis.
- RBI 2022 framework defines microfinance loans for households with income up to ₹3 lakh.
- Kudumbashree is Kerala's poverty eradication mission (1998).
Mains points
- SHGs combine financial inclusion with social mobilisation, making them more than a credit tool.
- The next stage is livelihood quality: linking SHGs to markets, value chains and FPOs.
- Over-indebtedness and coercive recovery remain risks; credit bureaus and responsible-lending norms are essential.
- SHGs have proven effective as last-mile delivery partners during COVID-19 (masks, community kitchens).
- Empowerment depends on women controlling loans and income, not just being nominal borrowers.
Did you know?
- Muhammad Yunus and Grameen Bank (Bangladesh) won the Nobel Peace Prize in 2006 for microcredit.
- MYRADA in Karnataka pioneered SHG models in the 1980s that inspired NABARD's programme.
- Bank Sakhis are SHG women who act as banking correspondents in villages.
Public Health in India: NHM, Ayushman Bharat and Health Financing
Health is a State subject, but the Centre shapes it through the National Health Mission (2013), Ayushman Bharat (2018) and the National Health Policy, 2017. India has improved life expectancy and cut maternal and child deaths, yet faces low public spending, high out-of-pocket expenditure, staff shortages and the rise of non-communicable diseases.
1. Constitutional Basis
Public health and sanitation, hospitals: State List (Entry 6); population control and family planning, medical education: Concurrent List.
Article 21 (right to life includes health—Paschim Banga Khet Mazdoor Samity, 1996); Article 47 (DPSP: nutrition and public health).
2. Health System Structure
Primary: Sub-centres and Ayushman Arogya Mandirs (earlier Health and Wellness Centres), Primary Health Centres.
Secondary: Community Health Centres, district hospitals.
Tertiary: Medical colleges, AIIMS.
ASHA workers link households to the system.
3. Key Programmes
National Health Mission (2013): NRHM (2005) + NUHM; maternal-child health, Janani Suraksha Yojana, immunisation (Mission Indradhanush, 2014).
Ayushman Bharat (2018): (i) Ayushman Arogya Mandirs for comprehensive primary care; (ii) PM-JAY—health cover of ₹5 lakh per family per year for secondary and tertiary hospitalisation for poor and vulnerable families; extended in 2024 to all citizens aged 70 and above.
Ayushman Bharat Digital Mission (2021): ABHA health IDs and digital records.
PM-ABHIM (2021): Health infrastructure, labs and critical-care blocks.
Jan Aushadhi Kendras: Low-cost generic medicines.
4. National Health Policy, 2017
Public health spending of 2.5% of GDP by 2025; two-thirds of spending on primary care; reduce catastrophic expenditure.
5. Challenges
Financing: Government health expenditure remains below 2% of GDP; out-of-pocket spending, though falling, was still under 40% of total health spending (National Health Accounts 2021-22) and pushes families into poverty.
Human resources: Shortage of specialists in CHCs; uneven distribution of doctors and nurses.
Disease burden: Communicable diseases (TB) plus rising diabetes, hypertension, cancer and mental illness.
Quality and regulation of private hospitals, which provide most hospital care.
6. Way Forward
Raise public spending; strengthen primary care and prevention; integrate AYUSH and digital health carefully; regulate prices and quality; One Health approach linking human, animal and environmental health.
| Pillar | Focus | Level of care |
|---|---|---|
| Ayushman Arogya Mandir | Prevention, screening, primary care | Primary |
| PM-JAY | Insurance cover of ₹5 lakh per family per year | Secondary and tertiary hospitalisation |
Prelims tips
- Public health and hospitals are in the State List.
- NHM (2013) merged NRHM (2005) and NUHM (2013).
- PM-JAY covers ₹5 lakh per family per year; extended to all aged 70+ in 2024.
- National Health Policy 2017 target: public health spending 2.5% of GDP by 2025.
- Health and Wellness Centres were renamed Ayushman Arogya Mandirs.
Mains points
- Insurance-led models (PM-JAY) reduce hospital costs but cannot replace strong primary care and prevention.
- High out-of-pocket spending, mostly on medicines and outpatient care, is the main cause of health-related impoverishment.
- COVID-19 exposed gaps in surveillance, critical care and the health workforce; it also showed the value of ASHAs and digital tools.
- Centre–state coordination is vital because health is a state subject but national schemes drive funding.
- Universal Health Coverage needs public financing, regulation of private providers and focus on non-communicable diseases.
Did you know?
- The Bhore Committee (1946) laid the foundation of India's three-tier public health system.
- ASHA stands for Accredited Social Health Activist; the word also means 'hope' in Hindi.
- India was declared polio-free by the WHO in 2014.
Education in India: RTE, NEP 2020 and Learning Outcomes
India has achieved near-universal enrolment in elementary school, but the challenge has shifted to learning—surveys such as ASER show many children cannot read or do basic arithmetic at grade level. The Right to Education Act, 2009 made schooling a right for ages 6–14 (Article 21A), and the National Education Policy 2020 aims at foundational literacy, flexible curricula and higher enrolment in higher education.
1. Constitutional Provisions
Article 21A (86th Amendment, 2002): Free and compulsory education for children aged 6–14.
Article 45: Early childhood care and education up to age 6; Article 51A(k): duty of parents to provide opportunities for education.
Education moved from the State List to the Concurrent List by the 42nd Amendment (1976).
2. RTE Act, 2009
Neighbourhood schools, no detention and no capitation fee (no-detention policy later relaxed in 2019), norms for teachers and infrastructure, School Management Committees.
Section 12(1)(c): 25% seats in private unaided schools for disadvantaged children; upheld in Society for Unaided Private Schools (2012); minority schools exempted in Pramati (2014).
3. National Education Policy 2020
5+3+3+4 structure replacing 10+2, bringing ages 3–6 into formal schooling.
Foundational literacy and numeracy by grade 3 (NIPUN Bharat, 2021).
Mother tongue or local language as medium of instruction preferably till grade 5.
Vocational education from grade 6; reduced curriculum load; board exams made easier and twice a year.
Higher education: GER of 50% by 2035; four-year multidisciplinary UG with multiple entry and exit; Academic Bank of Credits; single regulator (proposed Higher Education Commission of India).
Public spending on education of 6% of GDP (first recommended by the Kothari Commission, 1964–66).
4. Schemes
Samagra Shiksha (2018), PM POSHAN (mid-day meal), PM SHRI schools (2022), PARAKH assessment centre, DIKSHA digital platform.
5. Challenges
Learning crisis (ASER, NAS); teacher vacancies and training gaps; single-teacher schools; dropouts at secondary level, especially girls and tribal children; digital divide exposed during COVID-19 school closures; low public spending (well below 6%); quality and employability in higher education.
6. Way Forward
Focus on learning outcomes over inputs, teacher accountability and support, early childhood education through anganwadis, remedial teaching, and better data for school-level planning.
| Stage | Years | Ages | Classes |
|---|---|---|---|
| Foundational | 5 | 3–8 | Pre-school (3 years) + Classes 1–2 |
| Preparatory | 3 | 8–11 | Classes 3–5 |
| Middle | 3 | 11–14 | Classes 6–8 |
| Secondary | 4 | 14–18 | Classes 9–12 |
Prelims tips
- Article 21A was inserted by the 86th Amendment, 2002; RTE Act came into force on 1 April 2010.
- Education was moved to the Concurrent List by the 42nd Amendment.
- RTE Section 12(1)(c): 25% reservation in private unaided schools.
- NEP 2020 target: GER 50% in higher education by 2035.
- Kothari Commission (1964–66) first recommended 6% of GDP for education.
Mains points
- Access has improved but quality has not kept pace; schooling is not the same as learning.
- Foundational literacy is the base of all later learning; NIPUN Bharat's success will shape India's human capital.
- Mother-tongue instruction aids learning but must balance mobility and parental demand for English.
- Teacher quality, accountability and support matter more than infrastructure for outcomes.
- Implementation of NEP needs Centre–state cooperation, since education is in the Concurrent List and states run most schools.
Did you know?
- ASER (Annual Status of Education Report) surveys are conducted in rural households by Pratham and partner volunteers.
- The mid-day meal scheme traces its roots to Tamil Nadu, where K. Kamaraj expanded school meals in the 1950s–60s.
- Nalanda, an ancient centre of learning, attracted students from across Asia.