
Indian Economy · UPSC Notes
Inflation — UPSC Economy Notes
Free, exam-focused notes for UPSC Prelims and Mains, with Prelims tips and Mains points for every topic. 26 topics.
Open in the interactive reader: bookmarks, progress tracking and read-aloud.
Inflation
Inflation is a sustained rise in the general price level of goods and services over time. It reduces the purchasing power of money and affects economic stability.
Definition
Inflation refers to a persistent increase in the general level of prices of goods and services over a period of time.
It results in a decline in the purchasing power of money, meaning the same amount of money buys fewer goods and services.
Measurement of Inflation
Inflation is expressed as a percentage rate showing how fast prices are rising in the economy.
Formula: (Price level in current year – Price level in previous year) ÷ Price level in previous year × 100.
Example: Price of 1 litre milk = ₹50 in 2021 → ₹60 in 2022. Inflation rate = (60-50)/50 × 100 = 20%.
Measured on a ‘point-to-point’ basis (same reference dates).
Year-on-Year (YoY): Comparison with same month/year in previous year.
Sequential: Comparison with previous quarter/month.
Causes of Inflation
1. Money Supply
Increase in money supply → Higher demand → Inflationary pressure.
When central bank prints more money or reduces interest rates, people have more to spend.
If supply does not increase in the same proportion, excess demand leads to higher prices.
Example: Suppose economy has ₹100 worth of goods and ₹100 in circulation → price = ₹1 per unit.
If money supply rises to ₹150 but supply of goods remains the same, more money chases the same goods.
Businesses raise prices (say by 50%). Price per unit rises → Inflation.
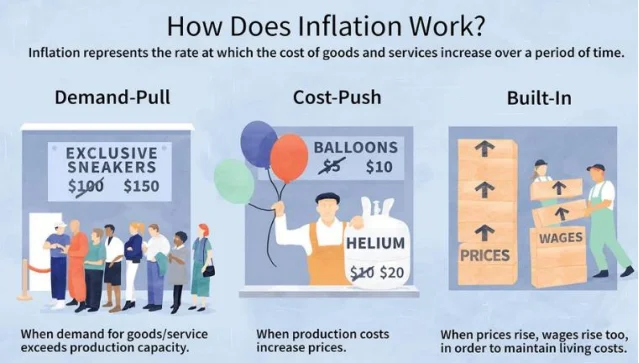
2. Demand-Pull Inflation
Occurs when demand for goods and services exceeds supply capacity.
Example: During festive season, demand for gold rises sharply → Prices surge.
3. Cost-Push Inflation
Occurs when production costs rise (e.g., wages, raw materials, fuel).
Producers transfer higher costs to consumers in form of higher prices.
Example: Increase in crude oil prices → Higher transport costs → Increase in commodity prices.
4. Structural Factors
Supply-side bottlenecks in agriculture, poor storage, lack of logistics cause inflation.
Example: Onion shortage due to crop failure → Spike in onion prices.
5. Imported Inflation
Rise in prices of imported goods (e.g., crude oil, gold) raises overall domestic inflation.
6. Inflationary Expectations
If people expect prices to rise in future, they buy more now.
This excess demand itself pushes prices upward (self-fulfilling prophecy).
| Type | Explanation | Example |
|---|---|---|
| Demand-Pull Inflation | When demand > supply, prices rise. | Festive demand for gold raises prices. |
| Cost-Push Inflation | When production costs increase, prices rise. | Rise in crude oil increases transport cost. |
| Imported Inflation | Due to rising prices of imports. | Global crude oil price rise impacts India. |
| Structural Inflation | Supply bottlenecks and inefficiencies. | Crop failure causes food inflation. |
| Inflationary Expectations | Future price rise expectations push current demand. | Consumers hoard goods expecting price hike. |
Prelims tips
- Inflation reduces purchasing power of money.
- Measured by CPI (Consumer Price Index) and WPI (Wholesale Price Index) in India.
- Demand-pull vs Cost-push inflation is a key prelims concept.
- Inflationary expectations can be self-fulfilling.
Mains points
- Inflation impacts growth, employment, savings, and investments.
- Persistent inflation reduces standard of living, especially for poor households.
- High inflation discourages savings and affects financial stability.
- Moderate inflation can encourage investment and production, but uncontrolled inflation destabilizes economy.
- Policy measures: monetary tightening (RBI), fiscal discipline (government), supply-side reforms.
Demand-side Causes of Inflation
Inflation can arise when aggregate demand exceeds aggregate supply in an economy. Factors like higher disposable income, government expenditure, cheap credit, deficit financing, rising exports, and repayment of debt increase demand, pushing prices upward.
1. Disposable Income
Higher disposable income (due to higher national income, tax cuts, or lower savings) increases demand for goods and services.
Demand-pull effect occurs if supply cannot match rising demand, leading to inflation.
Example: Tax cuts → Households spend more on goods, but supply lags → Prices rise.
Example 2: Higher disposable income increases housing demand → Limited supply pushes house/rent prices up.
2. Public Expenditure
Government spending on infrastructure, social welfare, and development raises aggregate demand.
If economy is near full capacity, extra demand leads to price hikes.
Example: Govt builds highways → Demand for cement, steel, labor rises → Inflationary pressure.
Financing govt spending through borrowing can also increase money supply, fueling inflation.
3. Cheap Money Policy (Credit Expansion)
When central bank reduces interest rates → borrowing becomes cheaper → households and firms borrow more.
More borrowing = Higher investment + consumption → Higher demand → Inflation.
Example: Businesses expand production, but higher input demand (raw materials, labor) raises costs, which are passed to consumers.
Cheap credit can also fuel cost-push inflation (e.g., speculative rise in commodity prices).
4. Deficit Financing
Govt spends more than revenue, financed by borrowing or printing money.
Extra money supply → Higher aggregate demand → Prices rise.
Example: Govt borrows from RBI to fund projects → Money supply expands → Inflationary demand.
5. Increase in Exports
Export growth reduces domestic supply, raising domestic prices.
Exporters earn higher incomes, boosting their domestic demand, which further raises prices.
Example: Higher oil exports → Oil producers earn more → Spend more domestically → Inflation.
6. Repayment of Public Debt
Govt repays past loans → Public has more money in hand → Aggregate demand rises.
More demand without corresponding supply → Inflationary pressure.
| Factor | Impact on Demand | Inflation Effect |
|---|---|---|
| Disposable Income | More household spending | Higher prices due to demand-pull effect |
| Public Expenditure | Govt projects increase demand | Higher input and service prices |
| Cheap Money Policy | More borrowing & investment | Demand-pull + Cost-push inflation |
| Deficit Financing | Govt borrows/prints money | Excess money supply = inflation |
| Increase in Exports | Domestic supply falls, exporters earn more | Domestic price rise |
| Repayment of Debt | Public gets more cash | Higher aggregate demand |
Prelims tips
- Demand-pull inflation is caused when AD > AS.
- Tax cuts → Higher disposable income → Inflationary pressure.
- Deficit financing = borrowing + printing money = more demand.
- Cheap money policy = Lower interest rates = more inflation risk.
Mains points
- Demand-side factors highlight how fiscal and monetary policies can trigger inflation.
- In India, deficit financing and public expenditure are major causes of inflation.
- Cheap credit policies can fuel both demand-pull and cost-push inflation.
- Export growth may boost forex but creates domestic inflationary pressure.
- Balancing growth with inflation control is key policy challenge.
Types of Inflation (Based on Rate/Speed of Price Rise)
Inflation can be classified based on the speed of rise in prices—from mild creeping inflation to dangerous hyperinflation. The rate determines its impact on the economy, ranging from positive demand stimulation to complete economic collapse.
1. Creeping Inflation (Mild Inflation)
Slow and steady rise in prices, usually up to 2% annually (as per US Fed Reserve).
Single-digit growth, predictable, long-term trend.
Seen as favourable for economy since it boosts demand—consumers buy early to avoid future price hikes.
Example: Developed economies often maintain 2% inflation as a healthy target.
2. Walking/Trotting Inflation
Moderate rise in prices, higher than creeping but still single-digit growth (say, 3–9%).
Creates expectation of higher prices → People hoard goods → Demand increases further.
Supply often fails to keep up, leading to more inflation.
Example: If onion prices steadily rise every month, households buy in bulk, causing further price spikes.
3. Galloping Inflation
Very high inflation, usually double-digit or triple-digit (20%, 100%, 200% per year).
Money loses value quickly, wages and business incomes fail to keep up.
Foreign investors avoid economy, leading to capital flight and instability.
Example: Latin American economies in 1970s–80s (Argentina, Brazil, Chile) faced 50–700% inflation.
4. Hyperinflation (Runaway Inflation)
Extreme, uncontrolled inflation; prices rise by thousands or millions % annually.
Prices increase daily or hourly; currency loses all credibility.
Caused by reckless fiscal policy (excessive money printing, especially during wars).
Examples:
Germany after WWI: Currency became worthless, people burned banknotes for fuel.
Zimbabwe 2008: Inflation rate reached 79,600,000,000% in Nov 2008; prices doubled daily; barter system replaced money economy.
| Type | Rate of Price Rise | Impact |
|---|---|---|
| Creeping | Up to 2% annually | Boosts demand, favourable |
| Walking/Trotting | 3–9% annually | Hoarding tendency, demand rises |
| Galloping | 20–200% annually | Unstable economy, capital flight |
| Hyperinflation | Thousands–millions % annually | Collapse of currency, barter system returns |
Prelims tips
- Creeping inflation (up to 2%) is considered healthy.
- Galloping inflation (double/triple digit) causes instability.
- Hyperinflation examples: Germany (1920s), Zimbabwe (2008).
- Walking inflation leads to hoarding and speculation.
Mains points
- Creeping inflation is beneficial as it encourages spending and investment.
- Walking inflation starts creating inefficiencies due to hoarding.
- Galloping inflation destabilises currency and economy; reduces investor confidence.
- Hyperinflation completely erodes trust in money and shifts economy to barter/foreign currency.
- Policy response differs: creeping tolerated, hyperinflation requires drastic reforms.
Causes and Effects of Hyperinflation
Hyperinflation occurs when money supply grows uncontrollably without corresponding economic growth. It erodes trust in currency, fuels speculative hoarding, and can collapse the financial system.
Causes of Hyperinflation
Excessive Money Supply: Government prints more money to cover fiscal deficits or finance wars without matching growth in output.
Budget Deficits: Reliance on central bank borrowing and printing of currency to meet rising public expenditure.
Collapse of Confidence: Citizens lose faith in currency’s value and begin avoiding its use.
Example: Germany (1920s) printed money to pay war reparations; Zimbabwe (2008) financed spending by excessive money printing.
Effects of Hyperinflation
Currency Devaluation: Domestic currency loses value in comparison to foreign currencies → people shift to stable foreign currencies (e.g., USD, Euro).
Hoarding Durable Goods: Citizens rush to buy jewellery, equipment, and property as store of value → further increases demand and raises prices.
Vicious Cycle: Rising prices → hoarding → shortage → further inflation.
Collapse of Financial System: Banks stop lending as money loses value; savings are wiped out.
Shift to Barter Economy: Formal economy collapses; trade happens via goods exchange.
Business Confidence Erodes: Investments decline, foreign investors pull out, unemployment surges.
| Causes | Effects |
|---|---|
| Excessive money printing | Currency loses value; people shift to foreign currency |
| Large fiscal deficits | Savings destroyed; banks stop lending |
| Loss of trust in money | Hoarding of durable goods; inflation spiral |
| War or political crisis | Collapse of economy; barter system returns |
Prelims tips
- Hyperinflation is caused by excessive money printing without real output growth.
- Zimbabwe (2008) and Germany (1920s) are classic examples.
- It usually leads to barter economy and collapse of financial system.
Mains points
- Hyperinflation destroys monetary system, shifting economy towards barter or foreign currency reliance.
- It results from reckless fiscal policy and excessive money printing.
- Causes erosion of savings, collapse of banking sector, and capital flight.
- Vicious inflationary spiral creates political and social instability.
- Policy response requires drastic monetary reforms, currency stabilization, and fiscal discipline.
Deflation and Disinflation
Deflation = sustained fall in prices (negative inflation), harmful to economy. Disinflation = slowdown in inflation rate, not harmful.
Deflation
Definition: Persistent fall in general price levels; inflation rate < 0% (negative).
Example: US recession (1920–21) after WWI and influenza pandemic saw continuous price fall.
Causes:
– Decrease in money supply or credit without fall in output.
– Drop in demand due to high interest rates or reduced government spending.
– Oversupply in some sectors without matching demand (e.g., China 2009 factory deflation).
Effects:
– Increases purchasing power of money → people delay spending, prefer saving.
– Increases real value of debt → discourages borrowing and investment.
– Leads to slowdown: low demand, falling wages, unemployment, reduced profits, credit crunch.
– Can push economy into depression.
Disinflation
Definition: Slowing down of inflation rate (prices still rise, but slower).
Example: If inflation falls from 10% → 8% → 6% → 4%, this is disinflation.
Causes:
– Contraction in business cycle.
– Tight monetary policy by central bank (reducing money supply).
Effect: Not harmful; indicates controlled inflation. Prices rise, but stability improves.
| Aspect | Deflation | Disinflation |
|---|---|---|
| Price Trend | Prices fall (negative inflation) | Prices rise but at slower rate |
| Inflation Sign | Negative inflation (e.g., -2%) | Positive inflation (e.g., 10% → 8%) |
| Impact | Harmful: causes slowdown, unemployment | Not harmful: signals stability |
| Consumer Behaviour | Postpone spending, increase saving | Spend normally; no fear of falling prices |
| Debt Burden | Increases real value of debt | No impact on real debt |
Prelims tips
- Deflation = negative inflation (prices fall).
- Disinflation = slowing inflation (prices rise slower).
- Deflation harmful, disinflation not harmful.
Mains points
- Deflation reduces demand, investment, wages, and employment; pushes economy into depression.
- Disinflation indicates controlled inflation, often result of monetary tightening.
- Policy challenge: balance between controlling inflation and avoiding deflationary spiral.
- Central banks use monetary easing (low interest rates, quantitative easing) to fight deflation.
- India rarely faces deflation, but disinflation phases occur during global slowdowns.
Demand-Pull Inflation
Occurs when demand for goods and services exceeds supply ('too much money chasing too few goods'). It is demand-driven price rise.
Meaning
Demand-pull inflation arises when aggregate demand (AD) > aggregate supply (AS).
Triggered by high consumer spending, investment, or government expenditure.
Often summarized as: 'Too much money chasing too few goods'.
Examples
Example 1: During an economic boom, low unemployment and high confidence → consumers spend more → businesses raise prices to match demand → wages rise → further demand → inflation spiral.
Example 2: College book bidding: You plan to sell books for ₹100, Junior A agrees. Junior B offers ₹150 → you sell to B. Demand competition pushes prices up.
Causes
1. Increase in Money Supply → more purchasing power → demand rises.
2. Increase in Government Expenditure → boosts demand in economy.
3. Tax Cuts → leaves households with more disposable income → more consumer spending.
4. Aggregate Demand Rise from consumers, businesses, and government together → limited supply leads to competition and higher prices.
Impact
Leads to short-term growth but sustained demand-pull can cause overheating of economy.
Can trigger wage-price spiral (higher wages → higher costs → higher prices).
| Aspect | Description |
|---|---|
| Definition | Inflation caused by demand > supply |
| Famous Phrase | 'Too much money chasing too few goods' |
| Causes | High money supply, government spending, tax cuts, rising demand |
| Impact | Rising prices, wage-price spiral, overheating of economy |
| Example | Book bidding, economic boom-driven inflation |
Prelims tips
- Demand-Pull Inflation is demand-driven; supply remains constant.
- Famous phrase: 'Too much money chasing too few goods'.
- Triggered by tax cuts, higher government spending, or money supply expansion.
Mains points
- Demand-pull inflation occurs in booming economies with high consumption.
- Causes wage-price spiral, making inflation persistent.
- Policies to control: contractionary monetary policy, reducing fiscal deficit, controlling money supply.
- India example: Post-2008 stimulus-led demand expansion created inflationary pressures.
Cost-Push Inflation & Structural Inflation
Cost-push inflation occurs when rising production costs (wages, raw materials, taxes) push prices upward. Structural inflation arises from bottlenecks and inefficiencies in supply chains, common in developing economies like India.
Cost-Push Inflation (Supply-Shock Inflation)
Triggered by increase in cost of production (raw material, wages, profit margins, taxes).
Producers pass increased costs onto consumers, raising final prices.
Example
Suppose crude oil prices rise globally due to geopolitical tension (e.g., US attack on Iran).
India, which imports ~90% of its oil, faces higher transport & production costs.
Manufacturers increase product prices (first-round inflation).
Workers demand higher wages to offset rising costs (second-round inflation).
Causes
1. Depreciation of Rupee → imports (oil, fertilizers, electronics) become expensive.
2. Poor Monsoon → reduces agricultural output → food inflation.
3. Supply Chain Bottlenecks → seen during Covid-19 & Russia-Ukraine war.
4. Speculation & Hoarding → onion, tomato price rise; wheat hoarding in 2022.
5. Increase in Indirect Taxes → raises commodity prices.
Structural Inflation (Bottleneck Inflation)
Originates from structural weaknesses like poor infrastructure, weak markets, inadequate cold storage.
Common in developing countries like India.
Supply fails while demand remains constant → prices rise.
Example
Farmer sells apples at ₹1000/quintal, consumer pays ₹2000.
Gap due to poor roads, transport, cold chains & middlemen inefficiencies.
Cost of logistics pushes up retail prices.
| Aspect | Cost-Push Inflation | Structural Inflation |
|---|---|---|
| Definition | Price rise due to higher production costs | Price rise due to bottlenecks & weak infrastructure |
| Nature | Short to medium term (supply shock) | Long-term & chronic (systemic weakness) |
| Causes | Rupee depreciation, higher wages, raw material cost, taxes | Poor roads, storage, markets, inefficient supply chain |
| Example | Crude oil price rise → transport cost inflation | Apples ₹1000 at farm → ₹2000 at retail due to bottlenecks |
Prelims tips
- Cost-push inflation is caused by supply shocks (raw materials, wages, taxes).
- Structural inflation is chronic in developing economies due to weak infrastructure.
- India often faces structural food inflation due to poor cold chains & logistics.
Mains points
- Cost-push inflation results from exogenous shocks like crude oil rise, wage push, rupee depreciation.
- Structural inflation persists due to systemic weaknesses like poor storage, transport, and agriculture markets.
- Policy response for cost-push: stabilizing currency, subsidies, tax reduction.
- Policy response for structural inflation: long-term investment in infrastructure, markets, cold storage, supply chain reform.
Effects of Inflation (Detailed)
Inflation not only raises prices but also reshapes how money works in daily life. It affects how much we can buy, how loans and debts are settled, how people save or invest, and how banks decide interest rates. These effects can be good in short term but harmful in long run if inflation remains high.
1. Effect on Purchasing Power
Purchasing power means how much goods/services can be bought with a unit of money (₹100, 1, etc).
When inflation rises, the value of money falls. Same note buys fewer items than before.
This makes daily expenses like food, fuel, rent, education, and healthcare costlier.
Example:
Milk Price (2021) = ₹40/litre → With ₹100, person buys 2.5 litres.
Milk Price (2022) = ₹50/litre → With ₹100, person buys only 2 litres.
Result: Decline in value of money; lifestyle adjustments become necessary.
If inflation is moderate, people adjust spending. But if inflation is high, families struggle to maintain same living standard.
2. Effect on Creditors and Debtors
Inflation redistributes wealth between lenders (creditors) and borrowers (debtors).
Lenders lose: They get back money whose real value is lower than when they lent it.
Borrowers gain: They repay loans in 'cheaper money'.
Example:
Loan = ₹1000 at 10% interest → Repayment after 1 year = ₹1100.
If inflation = 15%, then real interest = Nominal (10%) – Inflation (15%) = -5%.
This means that although borrower pays ₹1100, in real terms, it is worth less than ₹1000 at time of loan.
Hence, inflation benefits borrowers but harms lenders (unless interest rate adjusts with inflation).
Policy implication: Banks raise interest rates to protect themselves.
3. Effect on Savings
Savings behavior changes in response to inflation.
Short-run: Inflation encourages people to deposit money in banks, expecting to earn interest and protect money from losing value.
Long-run: If inflation is persistently high, savings decline because:
Cost of living rises (more money spent on food, rent, transport).
Real returns on bank deposits turn negative (if interest < inflation).
People may shift to buying assets like gold, real estate, or foreign currency as 'safe havens'.
Example:
A person saves ₹1000 in bank at 5% interest. Inflation = 4% → Real interest = +1% (benefit).
If inflation rises to 8% → Real interest = 5% – 8% = -3%.
Result: Saver loses value of money; chooses gold/property instead of bank deposits.
4. Effect on Interest Rates
Banks adjust interest rates in response to inflation to maintain profitability.
When inflation rises:
Deposit rates ↑ (to attract savers).
Lending rates ↑ (to cover higher cost of funds).
But higher interest rates make loans (housing, car, business) more costly, reducing investment and consumption.
When inflation falls, interest rates are cut to stimulate demand and growth.
Example:
Deposit rate = 5%, Inflation = 4% → Real return = +1% (positive).
If inflation jumps to 6% → Real return = -1%. Depositors unhappy; banks increase deposit rates to say 7%.
But, at same time, loan interest also rises → businesses hesitate to invest, growth slows down.
Broader Effects
On Standard of Living: Households struggle as cost of essentials rise faster than income.
On Investments: High inflation makes fixed income instruments (FDs, bonds) less attractive; encourages investment in real estate, gold, stocks.
On Government Policies: Central banks (like RBI) use monetary tools (repo rate, CRR) to control inflation.
On Economy: If moderate → may encourage production & investment; If uncontrolled → leads to instability, unemployment, and inequality.
| Aspect | Impact | Everyday Example |
|---|---|---|
| Purchasing Power | Money buys fewer goods | Milk costs ₹40 → ₹50 in a year |
| Creditors vs Debtors | Borrowers gain, lenders lose | Loan repayment worth less in real terms |
| Savings | Short-run ↑, Long-run ↓ | People shift from bank FDs to gold |
| Interest Rates | Banks raise both deposit & lending rates | Home loan becomes expensive when repo rate ↑ |
Effects of Inflation on Lending, Investment, Expenditure, Employment, Wages
Inflation influences almost every aspect of an economy: credit availability, business investment, consumer spending, employment levels, and even people's wages. Mild inflation can stimulate economic activity in the short run, but persistently high inflation distorts incentives, reduces real incomes, and dampens growth in the long run.
1. Effect on Lending (ऋण पर प्रभाव)
Short-run (mild inflation): Households save more, so banks have abundant deposits. Demand for loans also rises because borrowing cost is low. Result → Banks can lend more at lower interest rates.
Medium/long-run (high inflation): To protect themselves, banks raise lending rates. Higher interest makes loans expensive. Credit flow reduces → fewer home loans, car loans, and business loans.
Example: If home loan interest = 7% when inflation = 4% → loan is affordable. But if inflation rises to 9%, banks increase loan interest to 10–11% → borrowing declines.
2. Effect on Investment (निवेश पर प्रभाव)
Short-run: Businesses see high demand (inflation signals booming consumption). Borrowing is cheap, so they expand production and invest in new projects.
Long-run: As inflation persists, borrowing cost rises due to higher interest rates. Investors become cautious → delay projects. Economy’s growth momentum slows.
Example: A factory expands during mild inflation because sales are strong. But if inflation keeps rising, cost of raw materials + bank loans become too high → factory postpones expansion.
3. Effect on Expenditure (व्यय पर प्रभाव)
Consumption expenditure ↓ because goods and services become costlier (milk, vegetables, transport, tuition fees).
Investment expenditure ↑ in short run as cost of finance is lower (cheap borrowing encourages business expansion).
Over time, both household consumption and business investment fall when inflation gets too high.
4. Effect on Aggregate Demand (सकल माँग पर प्रभाव)
Rising inflation reflects high aggregate demand relative to supply. It signals higher purchasing power among consumers and shortage of supply.
Producers see this as opportunity → increase production to capture higher demand.
But if supply bottlenecks persist (limited raw materials, imports costlier), inflation continues unchecked.
5. Effect on Employment (रोज़गार पर प्रभाव)
Short-run: Mild inflation boosts production → firms hire more workers → unemployment falls → wages rise.
Long-run: Rising inflation erodes real incomes. Workers demand higher wages. Businesses, facing high borrowing costs and rising input prices, reduce hiring. Employment becomes stagnant or even negative.
Example: During early growth phase, retail companies hire more staff due to booming demand. But if inflation keeps rising, they cut jobs to reduce costs.
6. Effect on Wages (वेतन पर प्रभाव)
Nominal wages (money paid) rise during inflation, but real wages (purchasing power) fall because prices rise faster than income.
Hence, employees feel poorer even if salaries increase.
Example: Salary = ₹30,000/month. Inflation = 10%. Prices rise, so what ₹30,000 could buy earlier now needs ₹33,000. Real income fell.
7. Effect on Self-employed persons (स्व-नियोजित पर प्रभाव)
Self-employed (small shopkeepers, farmers, freelancers) face higher input costs (raw material, electricity, transport).
They may pass some cost to customers, but cannot always match inflation. Profit margins shrink.
High inflation also reduces demand, so their income stability is affected.
Example: A farmer’s fertilizer and diesel cost doubles during inflation, but he cannot double his selling price because consumers will shift to cheaper alternatives.
| Aspect | Short-run (Mild Inflation) | Long-run (High Inflation) |
|---|---|---|
| Lending | Abundant credit, low rates | Costly credit, higher interest rates |
| Investment | Expansion due to high demand | Dampened due to costly loans |
| Consumption | Initially stable | Falls as goods get costlier |
| Aggregate Demand | Encourages production | Supply bottlenecks keep inflation high |
| Employment | More jobs created | Job losses, neutral/negative hiring |
| Wages | Nominal wages rise | Real wages fall, purchasing power decreases |
| Self-employed | Can benefit from higher prices | Suffer due to high input costs and falling demand |
Impact of Inflation on Exchange Rate and Exports
Inflation erodes the purchasing power of money, weakens currency in international markets, and influences export competitiveness. The effect depends on relative inflation between trading partners, exchange rate regime, and interest rate policies.
1. Effect on Exchange Rate (विनिमय दर पर प्रभाव)
Inflation reduces the value of domestic currency compared to foreign currencies if inflation is higher than trading partners.
Higher inflation → domestic goods become expensive → exports fall → demand for domestic currency falls → currency depreciates.
Lower inflation compared to other countries → domestic goods cheaper → demand for currency rises → currency appreciates.
Example 1: If India’s inflation is 8% while USA’s is 2%, then Indian goods become expensive faster. Demand for Indian Rupee falls, and USD becomes stronger against INR.
Example 2: If 1 USD = ₹60 earlier, after persistent inflation in India, it may become 1 USD = ₹70. Rupee depreciates, meaning more Rupees are needed to buy 1 USD.
2. Inflation, Interest Rate and Exchange Rate Linkage
Inflation and interest rates are closely connected. Central banks raise interest rates to control inflation.
Higher interest rates → attract foreign investment → more demand for domestic currency → currency appreciates.
Lower interest rates → domestic spending increases but foreign investors look elsewhere → currency may depreciate.
Example: If RBI raises repo rate to fight inflation, foreign investors may bring dollars into India to earn higher interest. This increases demand for Rupee, strengthening INR temporarily.
3. Effect on Exports (निर्यात पर प्रभाव)
Positive impacts:
Currency depreciation due to inflation can make exports cheaper for foreign buyers. Exporters may earn more local currency per dollar received.
Example: Farmer exports onions for 1/kg. Earlier, 1 = ₹60, so he earned ₹60. If inflation weakens Rupee to 1 = ₹70, he now earns ₹70. Exports become more profitable.
Negative impacts:
Rising input costs (raw materials, energy, labour) increase production cost → exports become expensive → reduces competitiveness.
Example: If electricity and transport costs rise due to inflation, aluminium and cement exporters find it harder to compete globally.
Domestic demand effect:
When inflation is high, domestic consumers cut spending. Surplus production may be diverted to exports to sustain revenue.
Example: If domestic demand for cars falls due to high inflation, manufacturers may try to export more cars abroad.
4. Overall Balance
Short-run: Inflation may support exporters by weakening currency (Rupee depreciation).
Long-run: Persistent inflation increases input costs, reduces productivity, and scares away investors. This weakens exports competitiveness despite currency depreciation.
| Factor | Short-run Impact | Long-run Impact |
|---|---|---|
| Exchange Rate | Currency depreciates, boosting exports | Sustained inflation weakens confidence → more depreciation |
| Exports | Cheaper for foreign buyers, exporters benefit | High input costs reduce competitiveness |
| Interest Rate Link | Higher interest rates attract foreign investment, currency appreciates | Persistent inflation makes policy unstable, deters long-term investment |
Impact of Inflation on Imports, Balance of Trade, and Taxpayers
Inflation directly affects imports by making foreign goods costlier, influences balance of trade depending on a country’s economic structure, and increases the burden on taxpayers through higher indirect taxes and bracket creep in direct taxes.
1. Effect on Imports (आयात पर प्रभाव)
Inflation weakens domestic currency → imports become costlier because more local currency is needed to buy the same quantity of foreign goods.
Developing countries like India are heavily dependent on essential imports such as crude oil, fertilizers, machinery, and electronics. Inflation makes these imports costlier, increasing domestic inflation further (imported inflation).
Example:
If 1 = ₹50 and crude oil costs 1/litre → India pays ₹50 per litre.
If due to inflation and Rupee depreciation, 1 = ₹60, the same litre now costs ₹60. Import bill rises even if global prices remain unchanged.
2. Effect on Balance of Trade (व्यापार संतुलन पर प्रभाव)
Balance of trade = Exports – Imports. Inflation affects both sides.
Developed economies: Often benefit, as they export high-value goods/services, so mild inflation + weaker currency boosts exports.
Developing economies: Suffer, because they depend on essential imports (like oil, coal, fertilizers). Inflation increases import bills more than export earnings.
Scenarios:
If domestic inflation is higher than trading partners → currency depreciates → exports may rise (cheaper for foreigners). But import costs rise sharply, worsening trade balance.
If inflation reduces competitiveness of exports (due to high input costs), then exports decline while imports remain costly → trade deficit widens.
Example:
India imports ~85% of crude oil. If Rupee weakens due to inflation, oil imports costlier → Current Account Deficit widens. Even if exports like IT services rise, import bill overshadows it.
3. Effect on Taxpayers (करदाताओं पर प्रभाव)
Inflation impacts taxpayers through both indirect and direct taxes.
(a) Indirect Taxes:
Indirect taxes (like GST) are levied as a % of price of goods/services. When inflation increases prices, tax burden rises automatically.
Example: GST of 18% on TV priced ₹20,000 = ₹3,600. If inflation raises price to ₹25,000, GST rises to ₹4,500, even though TV is same.
(b) Direct Taxes – Bracket Creep:
Inflation may push nominal salaries into higher tax brackets, even if real income (purchasing power) has not increased. This is called 'Bracket Creep'.
Example:
→ Tax slabs (simplified): 0% up to ₹2.5L, 10% for ₹5–7.5L, 15% for ₹7.5–10L.
→ John earns ₹6L in FY 2021–22 (10% slab). Inflation raises salary to ₹7.7L in 2022–23, pushing him into 15% slab.
→ In reality, ₹7.7L buys the same as ₹6L earlier, but higher slab increases his tax liability.
Effect: No real rise in purchasing power, but higher tax burden due to inflation-induced salary hike.
| Aspect | Impact |
|---|---|
| Imports | Costlier due to currency depreciation; leads to imported inflation |
| Balance of Trade | Developed nations may benefit, developing nations often face deficits due to costly essential imports |
| Taxpayers | Indirect taxes rise with higher prices; direct taxes rise due to bracket creep |
Impact of Inflation on Capital Gains Tax and Economic Growth
Inflation affects taxation by inflating nominal capital gains, which may result in higher tax liability unless adjusted for inflation through indexation. It also influences economic growth positively in mild doses but negatively when it is high and uncontrolled.
1. Capital Gains Tax (पूंजीगत लाभ कर)
Inflation artificially inflates capital gains because the purchase price (cost of acquisition) appears lower compared to the sale price after many years, ignoring decline in real value of money.
Without adjustment, taxpayers pay tax on inflationary gains, not just real market gains.
Example:
Property bought in 2005 at ₹10 lakhs, sold in 2021 at ₹50 lakhs → apparent profit ₹40 lakhs.
At 20% tax, payable tax = ₹8 lakhs. But much of ₹40 lakhs is due to inflation.
To resolve this, India uses Cost Inflation Index (CII):
Formula: (CII of Sale Year ÷ CII of Purchase Year) × Actual Cost Price
CII for 2005 = 117; CII for 2021 = 317
Indexed cost price = (317/117) × 10,00,000 ≈ ₹27.09 lakhs
Real capital gain = 50 lakhs – 27.09 lakhs = ₹22.9 lakhs (not 40 lakhs).
Hence, tax is paid only on ₹22.9 lakhs, not ₹40 lakhs. This protects taxpayers from unfair taxation due to inflation.
2. Economic Growth (आर्थिक वृद्धि पर प्रभाव)
Mild inflation (around 4%, as targeted by RBI’s inflation targeting framework) is considered healthy. It signals demand in the economy, encourages production, and supports employment generation.
High inflation, however, reduces savings, increases interest rates, reduces investments, and dampens growth.
Positive Impacts of Mild Inflation:
Encourages production → higher aggregate supply.
Stimulates short-term investment because real cost of borrowing is low.
Acts as indicator of healthy demand in the economy.
Negative Impacts of High Inflation:
1. On Savings and Investment:
High inflation discourages savings since money loses value. People prefer immediate consumption rather than investing.
Example: At 10% inflation, money in bank deposits loses purchasing power faster than interest earnings. Businesses face uncertainty, reducing long-term investments.
2. On Consumer Spending:
As prices rise too fast, households reduce spending on non-essential goods. Aggregate demand falls, slowing growth.
3. On Wages and Costs:
Workers demand higher wages to maintain purchasing power. If wage growth exceeds productivity, business costs rise, reducing profits and investment.
4. On Interest Rates:
To curb inflation, central banks hike interest rates. Higher borrowing costs reduce credit demand, lowering consumption and investment, slowing GDP growth.
Important Concepts Related to Inflation
These terms describe different types and patterns of inflation such as reflation (reviving economy), skewflation (imbalanced inflation in some goods), open inflation (market-driven price rise), headline inflation (overall CPI-based inflation), and core inflation (inflation excluding volatile items).
Reflation
Refers to government efforts to stimulate the economy during periods of unemployment or recession.
Government uses expansionary fiscal or monetary policies: increasing expenditure, reducing taxes, lowering interest rates, or printing more money.
Leads to temporary rise in prices while reviving demand and economic growth.
Example: Great Depression of 1930s (USA) and Global Financial Crisis of 2008-09 where governments increased spending and reduced taxes to stimulate demand.
Skewflation
Occurs when prices of a few goods or services rise much faster than the average inflation rate.
Creates imbalance: some items become very expensive while others remain stable.
Example: Healthcare rising at 8% when overall inflation is 2%.
Example 2: Housing prices rising faster due to shortage of supply or rising construction costs.
Open Inflation
Happens in a free market economy where prices are not controlled by the government.
Prices rise openly due to increase in demand and limited supply.
Example: If demand for consumer goods suddenly increases, prices rise without government restrictions.
Headline Inflation
Represents the overall inflation across all goods and services in an economy.
In India, it is measured by the Consumer Price Index (CPI).
Includes volatile items such as food and fuel.
Core Inflation
Measures inflation excluding volatile items such as food and fuel.
Provides a more stable measure of long-term inflation trends.
| Concept | Explanation | Example |
|---|---|---|
| Reflation | Government increases money supply/expenditure to revive economy | Great Depression, 2008 Crisis |
| Skewflation | Price rise in few goods/services faster than average inflation | Healthcare inflation higher than overall CPI |
| Open Inflation | Free market price rise due to demand > supply | Consumer goods prices rise |
| Headline Inflation | Overall CPI-based inflation including food & fuel | CPI headline numbers in India |
| Core Inflation | Inflation excluding food & fuel (stable) | India’s core CPI figures |
Prelims tips
- Reflation is temporary price rise due to government stimulus.
- Skewflation = sectoral imbalance in inflation.
- Open Inflation happens only in free market without govt. control.
- Headline inflation = overall CPI, Core inflation = CPI excluding food & fuel.
Advanced Concepts Related to Inflation
These are refined economic terms that explain hidden inflation (shrinkflation), statistical effect on inflation (base effect), gaps between demand and supply (inflationary/deflationary gap), and wage-price cycles (inflationary spiral).
Shrinkflation
Definition: Shrinkflation occurs when the size or quantity of a product decreases, but the price remains the same.
Reason: Manufacturers adopt this to offset rising production costs (raw materials, packaging, labour).
Nature: It is called 'hidden inflation' because prices look unchanged, but consumers get less product for the same money.
Consumer Impact: The per-unit cost increases without consumers noticing immediately.
Example: A chocolate bar reduced from 100g to 90g but still priced at ₹50.
Base Effect
Refers to the impact of using a previous year's index value (the 'base') on current inflation calculations.
If the base year inflation was unusually low, even a small increase in prices this year can result in high inflation percentage.
Conversely, if last year's base was high, inflation may look lower.
Example: A price index increase of 10 points can show different inflation rates depending on whether the base was 110 (higher percentage) or 200 (lower percentage).
Inflationary Gap
Arises when aggregate demand for goods and services exceeds aggregate supply at full employment level.
Denotes a situation where real GDP is higher than potential GDP.
Causes: increase in money supply, higher consumption, more government spending, high investment, or fiscal deficit.
Effect: Rising demand pushes prices up in the long run (demand-pull inflation).
Inflationary Spiral (Wage-Price Spiral)
A vicious cycle where inflation causes workers to demand higher wages.
Firms increase wages but to cover costs they increase prices further.
This fuels more inflation, and workers again demand more wages, continuing the spiral.
Example: In economies with strong labour unions, wage-price spiral is common.
Deflationary Gap
Exists when aggregate demand falls short of aggregate supply at the level of full employment.
Leads to fall in price levels and reduced economic activity.
Causes: reduced money supply, higher savings, reduced investment, or fiscal consolidation (cut in govt. spending).
Example: In recession, demand falls and factories operate below capacity, causing a deflationary gap.
| Concept | Meaning | Impact |
|---|---|---|
| Shrinkflation | Product size reduces but price same | Hidden inflation; consumers pay more unknowingly |
| Base Effect | Inflation depends on reference year (base index) | Same price rise shows different % inflation |
| Inflationary Gap | Demand > Supply at full employment | Leads to price rise (demand-pull inflation) |
| Inflationary Spiral | Wages and prices rise in a cycle | Persistent inflation and wage demands |
| Deflationary Gap | Demand < Supply at full employment | Causes price fall, unemployment and slowdown |
Prelims tips
- Shrinkflation = Hidden inflation (product size shrinks, price same).
- Base Effect explains why same increase gives different inflation rates.
- Inflationary Gap = demand > supply; Deflationary Gap = demand < supply.
- Inflationary Spiral = wage-price cycle causing persistent inflation.
Special Concepts Related to Inflation
These concepts—Inflation Tax, Inflation Accounting, and Inflation Premium—explain hidden effects of inflation on money holders, companies, and borrowers.
Inflation Tax
Definition: Inflation tax is not an actual tax collected by the government, but rather the loss of value suffered by people holding money during inflation.
Mechanism: When the government prints more money (expansionary policy), the value of existing money decreases.
Effect: People who keep cash lose purchasing power, which acts like a hidden tax.
Example: If inflation is 10%, the purchasing power of ₹100 today will become ₹90 next year. That ₹10 loss is like an inflation tax.
Inflation Accounting
Definition: The process of adjusting company profits to account for inflation.
Need: During inflation, companies’ reported profits may look higher than their actual profits because costs and asset values rise.
Mechanism: Inflation accounting ensures companies calculate 'real profits' after adjusting for the current price level.
Example: A company buys machinery at ₹10 lakh (2010). In 2022, replacement cost is ₹20 lakh. If company ignores inflation, it may show overstated profit because asset depreciation is undervalued.
Inflation Premium
Definition: The extra benefit that borrowers receive during inflation is called inflation premium.
Mechanism: Nominal interest rate (what banks charge) may look high, but after adjusting for inflation, the real cost of borrowing is lower.
Formula: Real Interest Rate = Nominal Interest Rate – Inflation Rate.
Inflation Premium = Nominal Interest Rate – Real Interest Rate.
Example: If bank charges 12% nominal interest and inflation is 7%, real interest rate is 5%. The difference (7%) is the inflation premium enjoyed by the borrower.
| Concept | Meaning | Impact |
|---|---|---|
| Inflation Tax | Loss of money’s value during inflation | Cash holders lose purchasing power |
| Inflation Accounting | Adjusting profits for inflation | Shows real profit instead of overstated profit |
| Inflation Premium | Borrower’s benefit from inflation | Borrowers repay less in real terms; lenders lose |
Prelims tips
- Inflation Tax = hidden penalty on holding cash.
- Inflation Accounting = adjusting profits for inflation; prevents overstated earnings.
- Inflation Premium = benefit to borrowers; Real Interest Rate = Nominal Rate – Inflation.
Indicators of Inflation – Producer Price Index (PPI)
Producer Price Index (PPI) measures inflation from the perspective of producers instead of consumers. It is used globally (like in OECD countries) to capture changes in prices at wholesale and production stages.
What is PPI?
The Producer Price Index (PPI) measures the change in prices of goods and services from the producer’s point of view when selling in wholesale markets.
It does not measure consumer prices but focuses on how much producers receive or pay.
PPI has two main types:
Input PPI: Calculates price changes of raw materials or commodities entering the production process.
Output PPI: Calculates price changes when goods exit the production process (wholesale level).
PPI excludes taxes on final products, trade margins, and transport costs.
India does not use PPI to measure inflation; instead, it uses WPI and CPI. But OECD nations widely use PPI.
Limitations of Wholesale Price Index (WPI)
Inherent Bias: WPI often double-counts products, leading to inaccuracies.
Trade Dynamics Ignored: WPI does not consider export and import prices.
Neglects Services: WPI excludes the service sector, which forms 55% of India’s GDP.
Not Global Standard: WPI is not aligned with international practices.
Advantages of PPI
Global Alignment: PPI matches international standards and System of National Accounts (SNA).
Wider Coverage: PPI includes multiple stages of production and also covers the service sector.
Better Real GDP Calculation: PPI serves as a more accurate deflator for calculating real GDP compared to WPI.
Challenges in Implementing PPI in India
Time-Consuming: Requires careful selection of representative samples and assigning correct weights to goods and services.
Service Identification: Difficult to identify which services should be included and how much weight they carry.
Frequency of Data: Must decide whether price data should be collected weekly or monthly.
Resource Management: Balancing timely updates with available resources is a major challenge.
| Aspect | WPI | PPI |
|---|---|---|
| Coverage | Only goods, no services | Goods + Services |
| Bias | Double-counting issues | More accurate representation |
| Use in India | Used officially | Not used yet |
| Global Alignment | Not aligned with global standards | Follows international best practices |
| Role in GDP | Less accurate deflator | Better for real GDP calculation |
Prelims tips
- WPI excludes services while PPI includes them.
- OECD nations use PPI as a standard; India still relies on WPI and CPI.
- PPI helps in better GDP deflation compared to WPI.
Wholesale Price Index (WPI)
The Wholesale Price Index (WPI) measures overall changes in prices of goods at the wholesale level, i.e., before goods reach the retail stage. It excludes services and is widely used to track inflation trends in India.
What is WPI?
WPI measures and tracks the weighted average of prices of a representative basket of wholesale goods.
Wholesale level means when goods are sold in bulk to intermediaries like retailers, secondary wholesalers, or other market professionals.
WPI does not include services. It only considers goods before they reach the consumer.
Indirect taxes are excluded in WPI, so fiscal policy changes (like changes in tax rates) have less impact on WPI-based inflation.
The current base year for WPI is 2011-12.
WPI is released by the Office of Economic Advisor, Ministry of Commerce and Industry.
Commodity Basket of WPI
WPI includes 697 commodities across various categories but does not cover services.
Prices are taken at the wholesale stage, i.e., before reaching final consumers.
Commodity basket is divided into three broad categories: Primary Articles, Fuel & Power, and Manufactured Products.
| Category | Weightage (2004-05) | Weightage (2011-12) | Remarks |
|---|---|---|---|
| Primary Articles (Food, Non-Food: cereals, fruits, vegetables, minerals) | 20.12% | 22.62% | Increased |
| Fuel & Power (coal, electricity, petrol, diesel) | 14.91% | 13.15% | Decreased |
| Manufactured Products (textiles, apparels, paper, chemicals, processed foods) | 64.97% | 64.23% | Slightly Decreased |
| Total | 100% | 100% | No Change |
Prelims tips
- WPI excludes services, only measures goods at wholesale stage.
- Current base year for WPI is 2011-12 (earlier 2004-05).
- Released by Office of Economic Advisor under Ministry of Commerce & Industry.
- WPI includes 697 commodities in three categories: Primary Articles, Fuel & Power, Manufactured Products.
Wholesale Food Price Index (WPI Food Index) & Consumer Price Index (CPI)
WPI Food Index measures inflation in wholesale food items (producer level), while CPI measures inflation at the retail consumer level (consumption point). Together, they provide a complete picture of inflation in India.
WPI Food Index
Measures inflation in food items at the producer (wholesale) level.
It is an aggregate of all food items out of 697 commodities under the WPI basket.
Weightage of WPI Food Index = 24.38%.
Published by Department for Promotion of Industry and Internal Trade (DPIIT) since 2017.
Important for monitoring food inflation before it spills into retail prices.
Significance of WPI
Helps in understanding macroeconomic (overall economy) and microeconomic (specific sector) conditions.
Provides early warning signals on inflation trends at wholesale level.
Government can use WPI to intervene before inflation reaches consumers.
Businesses, policymakers, accountants, and statisticians use it as an indexing tool for price adjustments.
Consumer Price Index (CPI)
Measures inflation at retail level – i.e., the point where consumers actually buy goods and services.
CPI is calculated for different groups, as consumption patterns vary based on residence (rural/urban) and occupation (agricultural/rural labourers, industrial workers).
Example: India publishes CPI separately for workers, rural areas, and industrial workers.
CPI is the official inflation measure used by RBI for monetary policy and inflation targeting.
Released by National Statistics Office (NSO) under Ministry of Statistics & Programme Implementation (MoSPI).
Base Year for CPI = 2012.
CPI Formula
Consumer Price Index = (Cost of basket in current year / Cost of basket in base year) × 100
| Aspect | WPI | CPI |
|---|---|---|
| Level | Wholesale (producer level) | Retail (consumer level) |
| Coverage | 697 commodities, excludes services | Goods + Services (consumer basket) |
| Publishing Agency | DPIIT, Ministry of Commerce & Industry | NSO, Ministry of Statistics & Programme Implementation |
| Base Year | 2011-12 | 2012 |
| Usage | Used for wholesale inflation trends | Used by RBI for inflation targeting |
Prelims tips
- WPI Food Index introduced in 2017 by DPIIT.
- WPI excludes services while CPI includes goods + services.
- RBI uses CPI (not WPI) for inflation targeting.
- Base Year: WPI = 2011-12, CPI = 2012.
Types of Consumer Price Index (CPI) in India
India compiles multiple types of CPI to capture inflation for different groups – workers, rural and urban population, and overall retail inflation. These indices serve different policy and administrative purposes such as wage revisions, DA calculation, and monetary policy.
| CPI Type | Base Year | Released by | Significance |
|---|---|---|---|
| CPI for Industrial Workers (CPI-IW) | 2016 | Labour Bureau (Ministry of Labour & Employment), released monthly | Used for DA (Dearness Allowance) of govt. employees, dearness relief for pensioners, wage revisions. Pay Commissions also use this index. |
| CPI for Agricultural Workers (CPI-AL) | 1986-87 | Labour Bureau, released monthly | Used for revising minimum wages of agricultural labourers in different states. |
| CPI for Rural Labourers (CPI-RL) | 1986-87 | Labour Bureau, released monthly | Used for revising minimum wages of rural labourers in different states. |
| CPI (Urban) | 2012 | National Statistics Office (NSO) | Tracks price level of goods & services consumed by urban population. |
| CPI (Rural) | 2012 | National Statistics Office (NSO) | Tracks price level of goods & services consumed by rural population. |
| CPI (Combined – Rural + Urban) | 2012 | National Statistics Office (NSO) | Official inflation measure used by RBI for monetary policy & inflation targeting. |
| Consumer Food Price Index (CFPI) | 2012 | National Statistics Office (NSO) | Measures retail price changes of food items only. Gives food inflation for rural, urban, and all-India levels. Excludes beverages, packaged meals, pan, tobacco, and intoxicants. |
| Aspect | WPI | CPI |
|---|---|---|
| Level of Tracking | Producer/Wholesale level | Consumer/Retail level |
| Coverage | 697 commodities, no services | Goods + Services (consumer basket) |
| Weightage | Higher weightage to manufactured goods | Higher weightage to food items |
| Usage in India | Used for wholesale inflation analysis | Used by RBI for inflation targeting & monetary policy |
Prelims tips
- CPI-IW is used for DA (Dearness Allowance) of government employees.
- CPI-AL & CPI-RL are used for minimum wage revisions of agricultural & rural workers.
- CPI (Combined – Rural + Urban) is the official inflation measure used by RBI.
- WPI measures wholesale inflation; CPI measures retail inflation.
Divergence between WPI, CPI and GDP Deflator
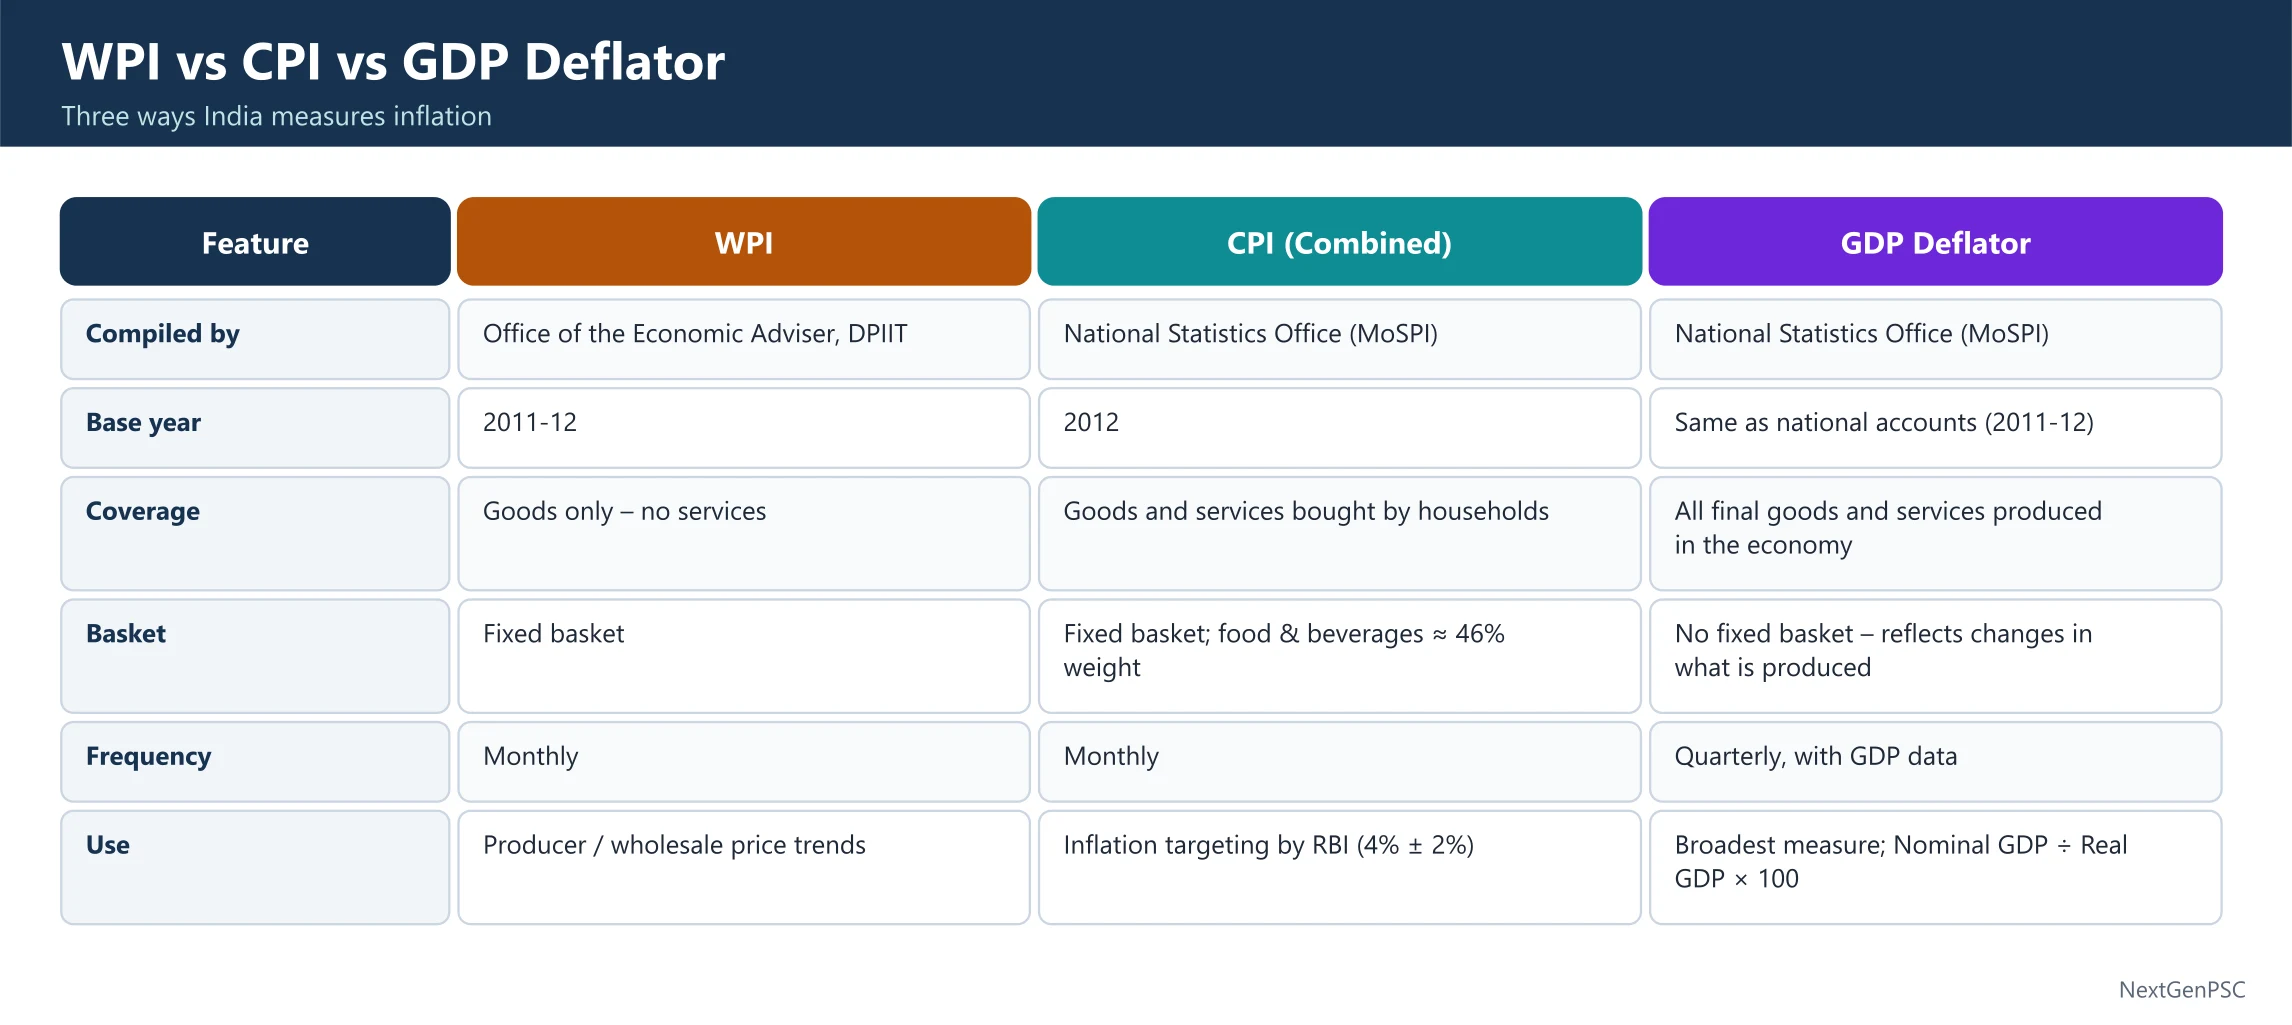
While WPI, CPI and GDP Deflator all measure inflation, they often diverge due to differences in coverage, weights, inclusion/exclusion of services, and calculation methods. CPI reflects consumer-level inflation, WPI captures wholesale-level inflation, and GDP deflator is a broad economy-wide measure.
Why WPI and CPI Diverge?
Different Weightage: WPI gives ~64% weight to manufactured goods while CPI gives higher weight to food items. So, if manufactured goods’ inflation rises, WPI increases more sharply than CPI.
Base Effect: Inflation measured against previous year’s base. A higher/favourable base may show lower inflation, causing divergence.
Taxes: CPI includes indirect taxes (like GST) while WPI does not. Thus, CPI may reflect higher inflation compared to WPI.
Example: In January 2023, divergence between CPI and WPI widened to 179 basis points (bps) from 3 bps in November 2022 due to favourable base for WPI and fall in prices of manufactured goods (major component in WPI).
GDP Deflator
GDP deflator measures inflation across the entire economy – ratio of GDP at current prices to GDP at constant prices (base year).
Formula: GDP Deflator = (GDP at Current Prices ÷ GDP at Constant Prices).
If Value > 1 → Inflation (prices higher than base year).
If Value = 1 → No change in prices (same as base year).
If Value < 1 → Deflation (prices lower than base year).
Unlike WPI and CPI, GDP deflator includes ALL domestically produced goods and services but excludes imported items.
Advantage: Comprehensive measure of inflation.
Limitation: Not used for short-term policy since data is released quarterly with GDP figures, causing time lag.
| Aspect | WPI | CPI | GDP Deflator |
|---|---|---|---|
| Level | Wholesale level (producer prices) | Retail level (consumer prices) | Overall economy-wide inflation |
| Coverage | 697 goods (no services) | Goods + Services (consumer basket) | All domestically produced goods and services |
| Inclusion of Imports | Yes | Yes | No (only domestic output) |
| Weightage | High weight to manufactured goods | High weight to food items | Implicit weights (all GDP components) |
| Publisher | Office of Economic Advisor, Ministry of Commerce | National Statistics Office (NSO) | NSO (with GDP data) |
| Frequency | Monthly | Monthly | Quarterly (with GDP release) |
Prelims tips
- CPI includes indirect taxes like GST, while WPI does not.
- WPI has higher weight for manufactured goods; CPI gives more weight to food items.
- GDP deflator is broader – includes all domestically produced goods & services, but excludes imports.
- GDP deflator = GDP (current prices) ÷ GDP (constant prices).
Measures to Control Inflation
Inflation means a continuous rise in prices of goods and services, which reduces the purchasing power of money. To control it, governments and the Reserve Bank of India (RBI) adopt supply-side, cost-side, and demand-side measures. These can be short-term (quick actions) or long-term (structural reforms).
Supply-Side Measures (Dealing with availability of goods)
Inflation can occur when there is not enough supply of goods compared to demand. To control it, government increases the supply of goods in the market.
Short-term supply-side measures:
Import goods that are in shortage in India. Example: If onion prices shoot up because of poor harvest, India imports onions from other countries to bring down prices.
Stop exports of items that are in shortage inside the country. Example: In 2022, India banned wheat exports because production was low and traders were hoarding wheat to sell abroad at higher prices.
Take strict legal action against hoarding and black marketing. Some traders artificially create scarcity to raise prices. The government can raid godowns, seize stock, and release goods into the market.
Long-term supply-side measures:
Increase production capacity in agriculture and industry so that future demand can be met smoothly.
Build better storage, cold chains, transport, and supply chains to reduce wastage and delays.
Invest in irrigation, mechanisation, and research to increase farm productivity.
Cost-Side Measures (Dealing with production costs)
Inflation sometimes happens because it becomes costly to produce goods. Example: If crude oil prices rise, transportation cost rises, and this makes all goods costlier.
Short-term cost-side measures:
Reduce indirect taxes like GST, excise duty, or customs duty to bring down production costs. Example: Government reduced excise duty on petrol and diesel in 2022 to lower transport costs.
Declare some items as 'Essential Commodities' under the Essential Commodities Act, 1955, which allows the government to fix their maximum price and prevent profiteering.
Long-term cost-side measures:
Encourage adoption of new technologies, modern machines, and energy-efficient methods to reduce overall cost of production in future.
Promote renewable energy and domestic raw materials to reduce dependence on expensive imports.
Demand-Side Measures (Reducing excess purchasing power)
Inflation also rises if too much money is chasing too few goods. Example: If people suddenly get higher salaries and loans are cheap, demand increases faster than supply.
To control this, government (via fiscal policy) and RBI (via monetary policy) reduce money supply in the economy.
Contractionary policies are used, which means making money costlier or reducing cash in people’s hands.
Logic: If people have less purchasing power, they will buy fewer goods, and prices will stop rising so fast.
Works best for non-essential goods (like cars, cement, steel) but does not help much for daily essentials (like salt, onions, rice) because people need them anyway.
| Aspect | Monetary Policy (RBI) | Fiscal Policy (Government) |
|---|---|---|
| CRR & SLR | RBI increases them → Banks must keep more reserves → Less money for loans. | Not applicable |
| Repo Rate | RBI raises repo → Loans become costlier → Borrowing reduces. | Not applicable |
| Reverse Repo Rate | Higher rate → Banks park money with RBI → Less lending. | Not applicable |
| Open Market Operations | RBI sells government bonds → Absorbs excess money. | Not applicable |
| Credit Control | RBI tells banks to restrict loans in high-inflation sectors. | Not applicable |
| Taxation | Not applicable | Raise taxes to reduce demand (for demand-pull) or cut taxes to lower costs (for cost-push). |
| Public Expenditure | Not applicable | Cut subsidies, reduce unnecessary govt. schemes, rationalise expenditure. |
| Fiscal Deficit | Not applicable | Reduce borrowing and deficit by better revenue management. |
Prelims tips
- Inflation control = mix of supply-side + demand-side + cost-side measures.
- RBI mainly controls demand-pull inflation (via repo, CRR, SLR).
- Government controls cost-push inflation (via taxes, subsidies, production incentives).
- Monetary measures work quickly but are temporary; structural reforms take longer but are permanent.
All India House Price Index (AIHPI)
The AIHPI is an indicator that tracks the changes in residential property prices across major cities in India. It is published by the Reserve Bank of India (RBI).
What is AIHPI?
The All-India House Price Index (AIHPI) measures the ups and downs in the prices of residential properties (like houses and apartments) in India over time.
It is put together and released every three months (quarterly) by the Reserve Bank of India (RBI) .
The Base Year for this index, the starting point for comparison, is 2010-11 .
How is it Calculated?
It's based on real transaction data (actual sale prices) collected from property registration offices in 10 major cities .
These cities are: Ahmedabad, Bengaluru, Chennai, Delhi, Jaipur, Kanpur, Kochi, Kolkata, Lucknow, and Mumbai.
This gives us an idea of housing inflation (how fast house prices are rising) in these key markets.
Why is AIHPI Important?
For the RBI: The real estate sector is a big part of the economy and banks give out huge home loans. If house prices suddenly crash, many loans could become bad debts, risking the stability of banks. RBI watches the AIHPI to spot these risks (like a 'housing bubble' - when prices rise too fast and unsustainably).
For the Government: It helps in making policies related to housing and city development.
For Consumers: It helps people understand price trends before deciding to buy or sell a property.
For the Economy: A rising HPI can create a 'Wealth Effect' – when homeowners feel richer because their house is worth more, they tend to spend more, boosting the economy. A falling HPI can signal an economic slowdown.
Prelims tips
- AIHPI tracks residential property prices.
- Published by: RBI (quarterly).
- Base Year: 2010-11.
- Covers 10 major cities.
Mains points
- AIHPI is a crucial tool for financial stability, as it helps RBI monitor potential housing bubbles.
- It provides insight into housing affordability and the health of the construction sector, which is a major job creator.
Fisher Effect
The Fisher Effect is an economic theory stating that the real interest rate is stable, so any change in the nominal interest rate is due to a change in the expected inflation rate.
What is the Fisher Effect?
Developed by economist Irving Fisher, this theory describes the relationship between inflation , real interest rates , and nominal interest rates .
It states that the Real Interest Rate equals the Nominal Interest Rate minus the Expected Inflation Rate .
Formula 1: Real Interest Rate = Nominal Interest Rate - Expected Inflation Rate
Rearranging this gives:
Formula 2: Nominal Interest Rate = Real Interest Rate + Expected Inflation Rate
The Core Idea
The main idea is that the Real Interest Rate (the true cost of borrowing, adjusted for inflation) is pretty stable over the long run, determined by fundamental things like how much people save and invest in the economy.
So, if lenders (like banks) expect inflation to go up, they will demand a higher Nominal Interest Rate (the rate you see advertised) to protect their purchasing power. They want to make sure they get their desired 'real' return.
Example
Imagine a bank wants to earn a Real Return of 3% on its loans.
Scenario 1: If the bank expects inflation to be 4% , it will charge a Nominal Rate of:
3% (Real) + 4% (Inflation) = 7% .
Scenario 2: If the bank now expects inflation to rise to 6% , it will adjust its Nominal Rate to:
3% (Real) + 6% (Inflation) = 9% .
The Fisher Effect explains why nominal interest rates tend to rise when inflation is high.
Prelims tips
- Fisher Effect links nominal rates, real rates, and inflation.
- Formula: Nominal Rate ≈ Real Rate + Expected Inflation.
- It assumes the real interest rate is stable.
Mains points
- The Fisher Effect is fundamental to monetary policy. Central banks (like RBI) raise nominal interest rates (like the repo rate) to combat inflation, which in turn aims to increase the real interest rate and reduce borrowing/spending.
Inflation Indexed Bonds (IIBs)
Inflation Indexed Bonds are special bonds where both the principal (original investment) and the interest payments are adjusted to protect the investor from inflation.
What are IIBs?
Inflation Indexed Bonds (IIBs) are debt instruments (like loans you give to the government) issued by the government.
Unlike regular bonds (which give a fixed interest on a fixed principal), IIBs are designed to protect an investor's money from losing value due to inflation.
How do they work?
IIBs have two key features that protect against inflation:
1. Principal Protection: The original amount (face value) of the bond is adjusted upwards based on the inflation rate (e.g., using the CPI).
2. Interest Payment: The interest (coupon) is paid on this adjusted principal. This means as inflation rises, your principal grows, and your interest payment (which is a percentage of that principal) also grows.
Example
You buy an IIB of ₹10,000 with a 2% 'real' coupon rate .
Year 1: Inflation is 8% .
Step 1 (Adjust Principal): Your principal is adjusted for inflation.
New Principal = ₹10,000 (1 + 8%) = ₹10,800 .
Step 2 (Calculate Interest): The 2% interest is paid on this new, adjusted principal.
Interest Payment = 2% of ₹10,800 = ₹216 .
(A regular bond would have paid only 2% of ₹10,000 = ₹200, and your principal would still be just ₹10,000, losing purchasing power).
Result: Your investment's principal is protected from inflation, and you earn a guaranteed real return on top.
IIBs in India
The RBI has issued IIBs in the past on behalf of the Government of India.
These bonds offer a 'real return' (a return above inflation) that is guaranteed, making them very safe for long-term investors, especially retirees worried about inflation eating away their savings.
Prelims tips
- IIBs protect both principal and interest payments from inflation.
- They provide a guaranteed 'real return', not just a nominal return.
- Issued by RBI on behalf of the government.
Mains points
- IIBs are an important tool for financial inclusion, encouraging small savers to invest in financial assets rather than unproductive assets like gold.
- They help the government by providing a stable source of borrowing and reduce the 'inflation risk premium' it might otherwise have to pay on regular bonds.
Phillips Curve, NAIRU, and Stagflation
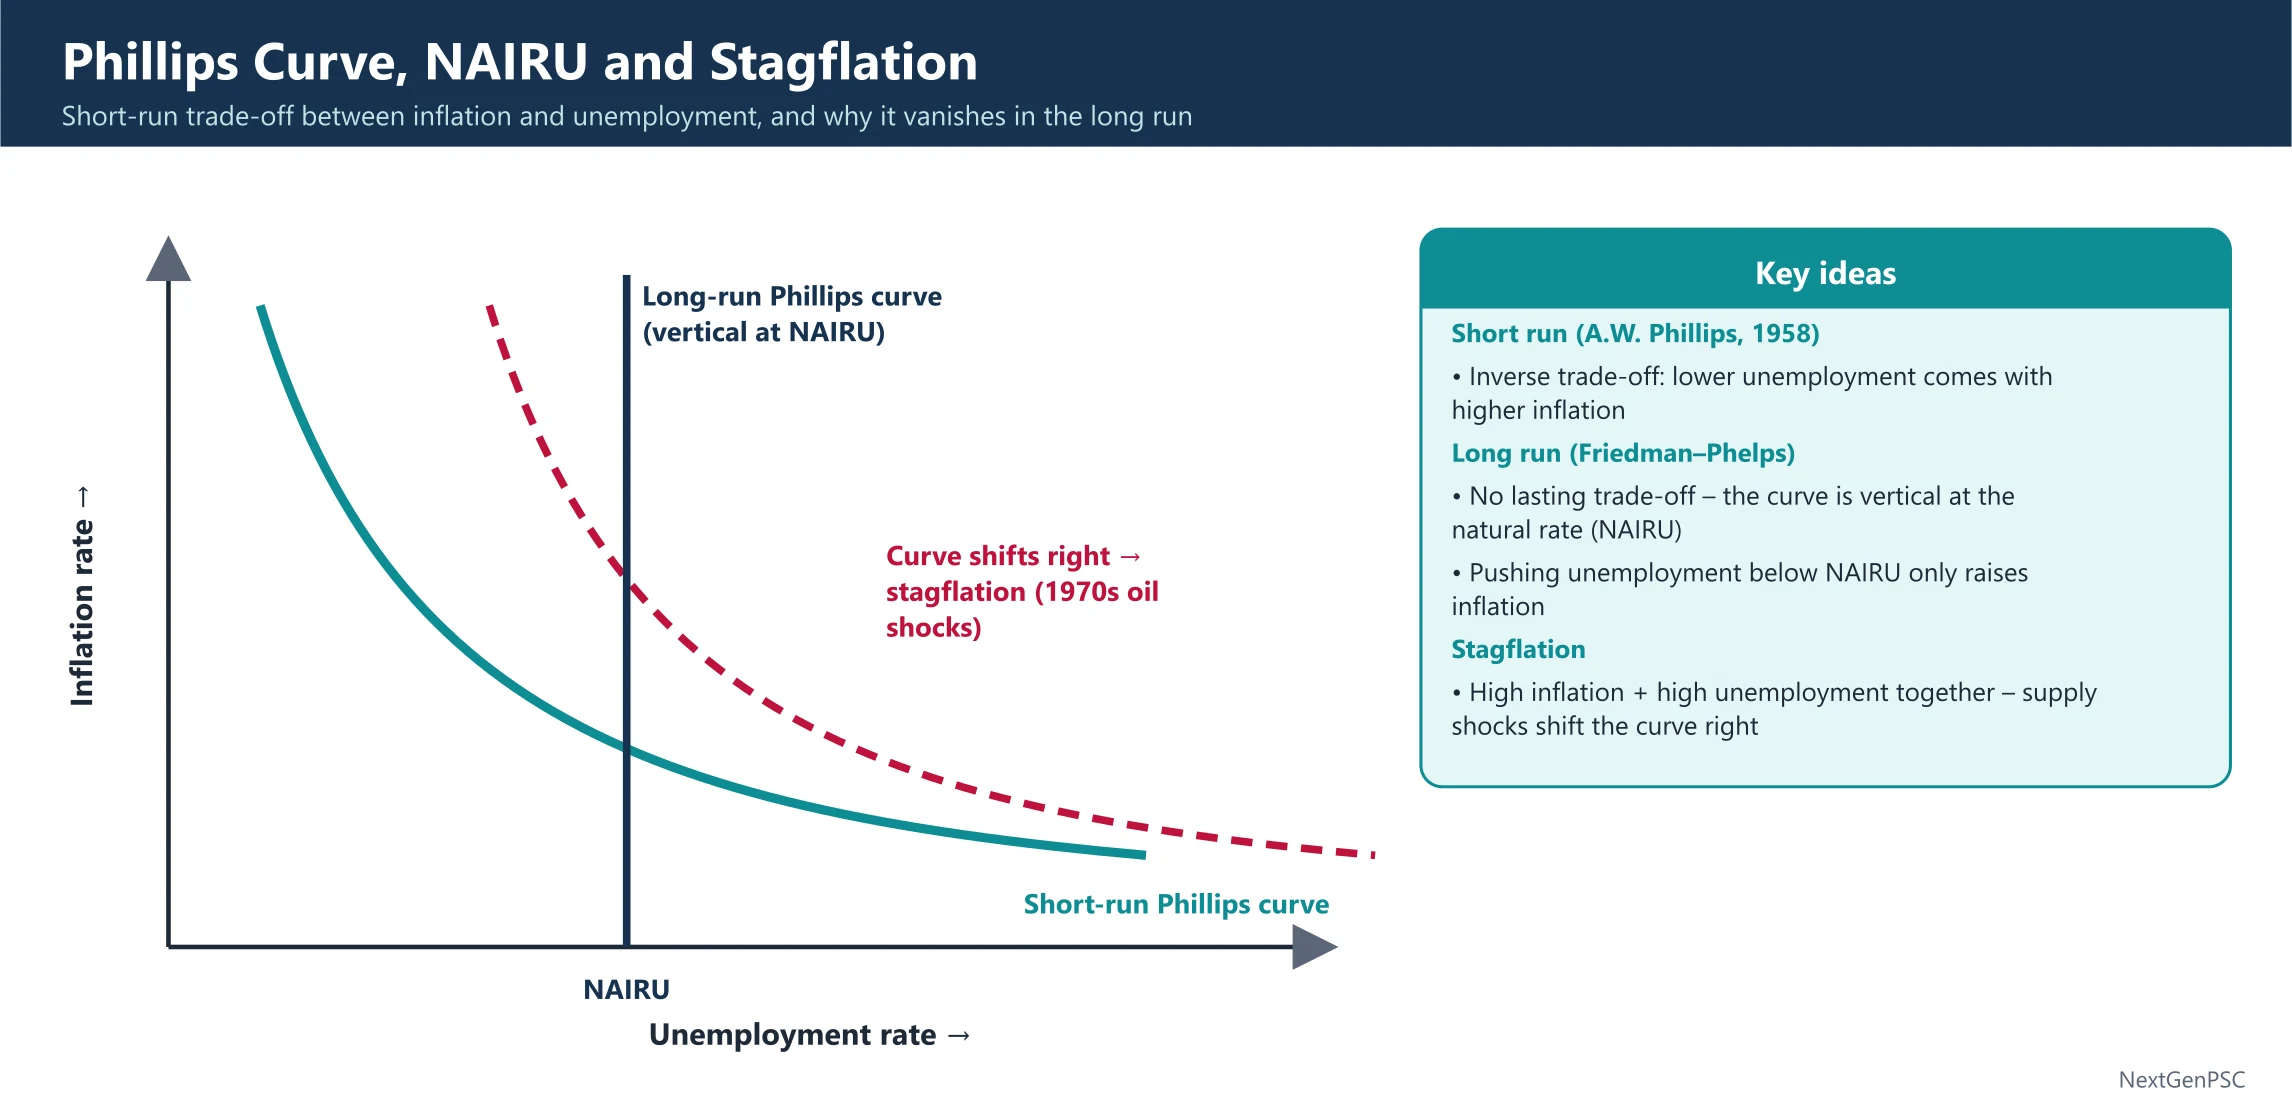
The Phillips Curve shows a short-run trade-off where lowering unemployment can lead to higher inflation. However, this relationship breaks down in 'Stagflation'—a harmful state of high inflation and high unemployment at the same time. NAIRU is the unemployment rate where inflation is stable.
1. The Phillips Curve
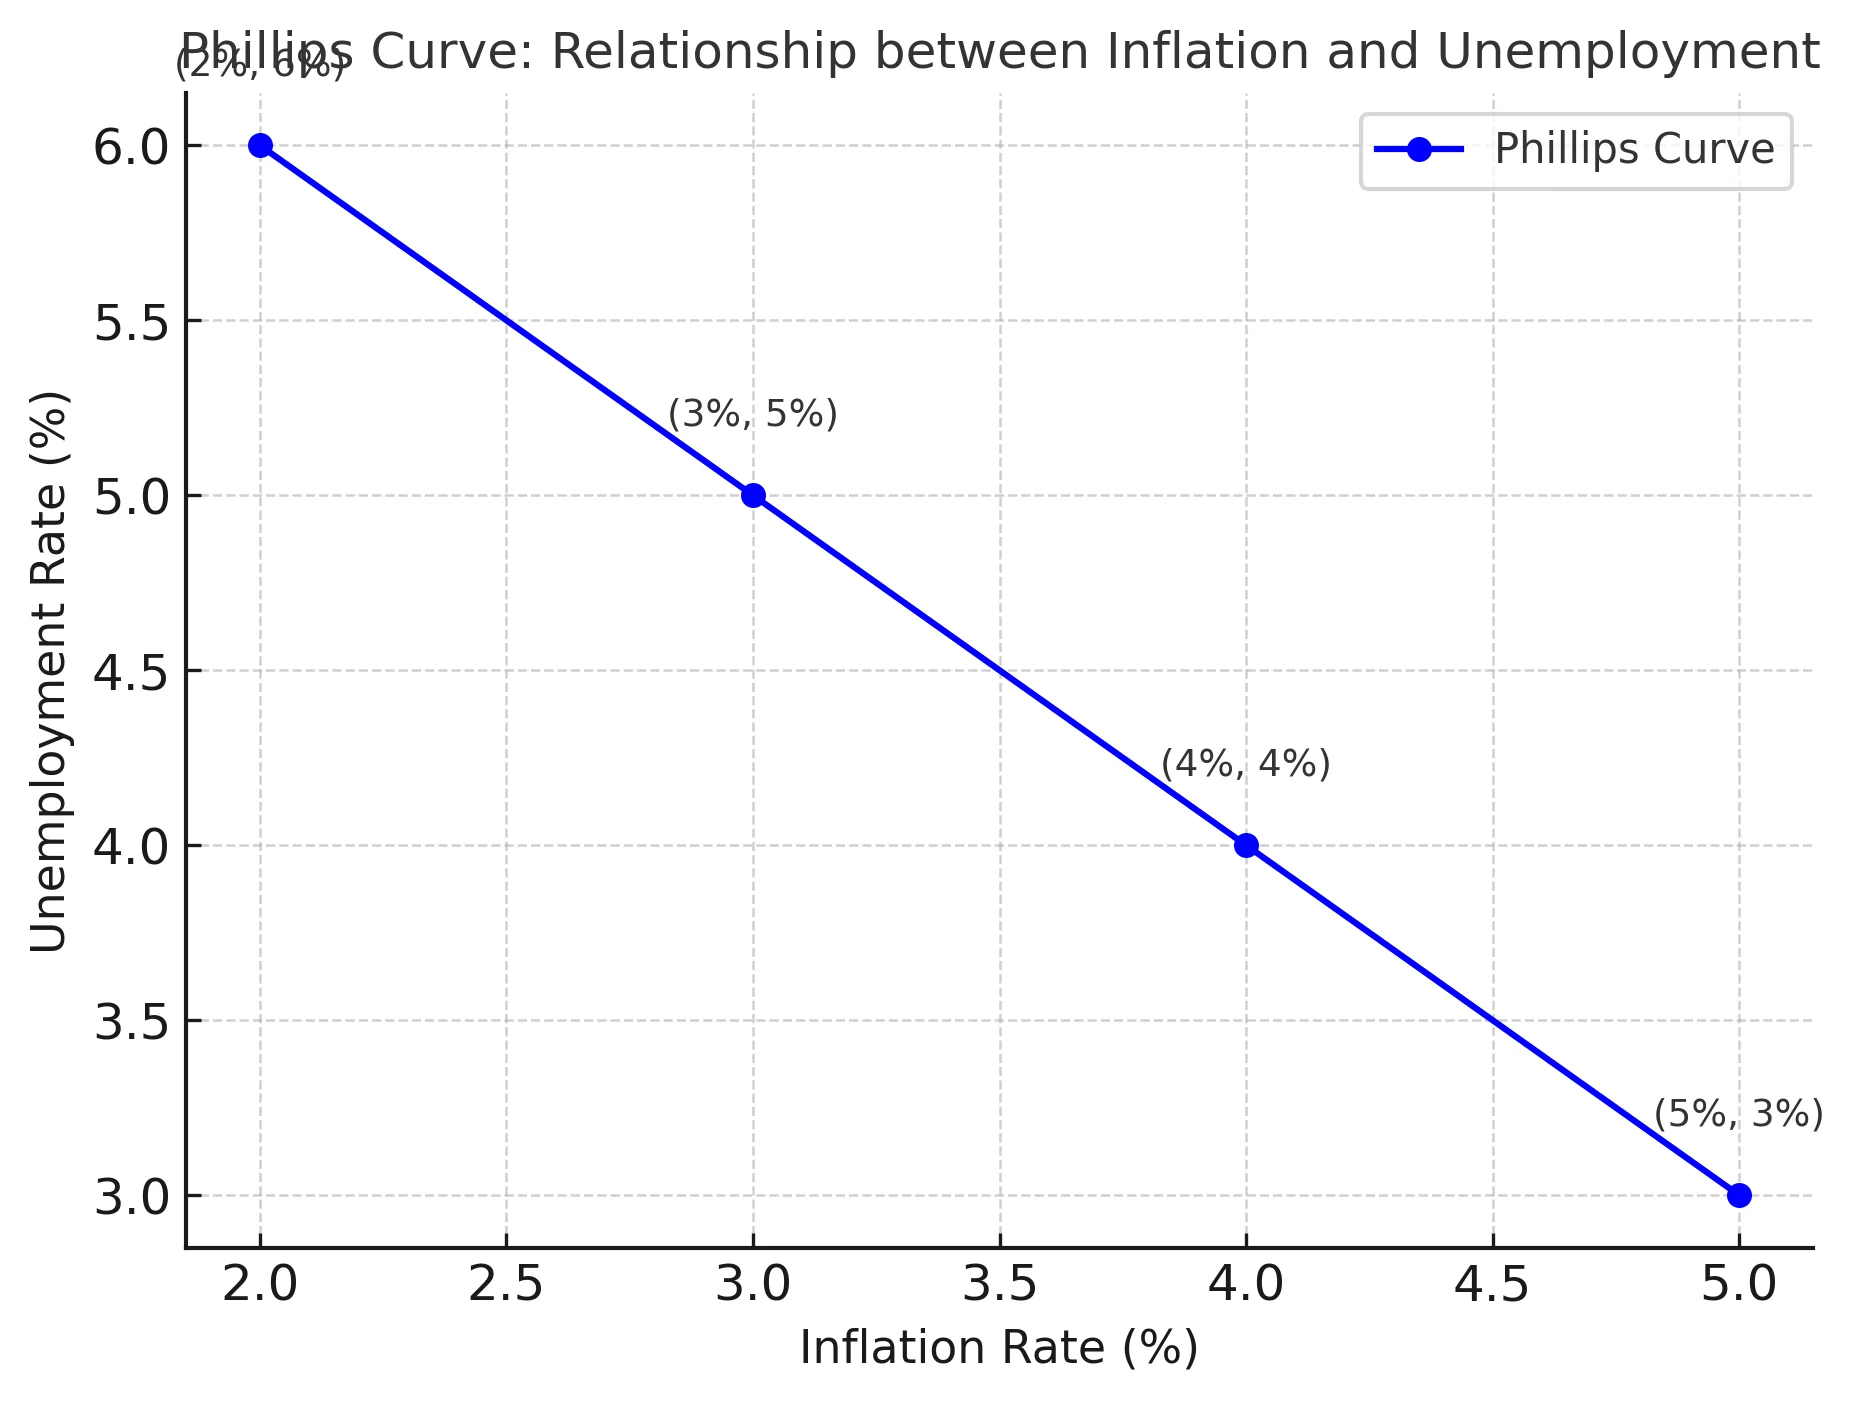
Developed by economist A.W. Phillips, this curve shows an inverse relationship between inflation and unemployment in the short run .
The Theory: When the economy is growing strongly -> companies hire more workers -> unemployment falls . With fewer available workers, existing workers can demand higher wages -> companies pass these higher wage costs onto consumers as higher prices -> inflation rises .
The Trade-off: It suggested policymakers faced a choice: they could have either (A) low unemployment with high inflation, or (B) high unemployment with low inflation.
2. Stagflation (When the Curve Breaks)
In the 1970s (during the OPEC oil crisis), this simple trade-off failed. Many countries experienced Stagflation .
Stagflation = Stagnant Growth (High Unemployment) + High Inflation.
Why did it happen? The inflation was caused by a supply shock (cost-push inflation from high oil prices), not high demand. Prices went up, but because costs were high, companies fired workers, increasing unemployment.
This proved the Phillips Curve isn't a stable, long-run tool.
3. NAIRU (Non-Accelerating Inflation Rate of Unemployment)
This is a more modern concept. NAIRU is the specific, lowest rate of unemployment that an economy can sustain without causing inflation to accelerate (speed up).
Think of it as the 'natural rate' or 'safe level' of unemployment.
How it's used:
If Unemployment > NAIRU: The economy is weak (in a slowdown). It's 'safe' for the central bank to stimulate job growth (e.g., cut interest rates) without worrying much about inflation.
If Unemployment < NAIRU: The economy is 'overheating'. Too many jobs are being created, leading to a wage-price spiral (demand-pull inflation). The central bank must raise interest rates to cool it down.
NAIRU tells policymakers how much they can push unemployment down before triggering runaway inflation.
| Concept | Unemployment | Inflation | Relationship |
|---|---|---|---|
| Phillips Curve (Short-run) | Low | High | Inverse (उलटा) |
| Phillips Curve (Short-run) | High | Low | Inverse (उलटा) |
| Stagflation | High | High | Relationship breaks (संबंध टूट जाता है) |
Prelims tips
- Phillips Curve: Short-run inverse relationship between inflation and unemployment.
- Stagflation: High inflation + High unemployment. Caused by supply shocks.
- NAIRU: The unemployment rate where inflation is stable. If unemployment goes below NAIRU, inflation accelerates.
Mains points
- Stagflation poses the worst challenge for policymakers: If they raise interest rates to fight inflation, unemployment gets worse. If they cut rates to create jobs, inflation gets worse.
- The solution to stagflation is usually supply-side reforms (making production cheaper/easier), not demand management.
- Modern central banks (like RBI) use NAIRU as a guide to set interest rates, balancing the goals of stable inflation and maximum employment.
Refined Core Inflation
Refined Core Inflation is a measure published by the RBI that is even more stable than regular 'core inflation'. It removes volatile items from the core basket itself to find the most persistent and underlying inflation trend.
Headline vs. Core Inflation (Recap)
Headline Inflation: This is the total inflation in the Consumer Price Index (CPI). It includes all items, including volatile ones like food (vegetables, pulses) and fuel (petrol, diesel). This is what affects your daily budget.
Core Inflation: This is Headline Inflation MINUS Food & Fuel items. It's considered more stable because it removes temporary price shocks.
What is Refined Core Inflation?
The RBI noticed that even within the 'Core Inflation' basket, some items were still quite volatile (their prices jumped around a lot).
Example: Gold prices, which are part of the core basket, depend heavily on global markets and speculation, not just domestic demand.
Refined Core Inflation (sometimes called 'Core-Core' or 'Trimmed Core') is a measure that further purifies core inflation by removing these additional volatile components from the core basket itself.
It represents the most stable measure of the underlying, long-term inflation trend.
Why does the RBI use it?
Monetary policy (like changing the repo rate) takes time to work (6-9 months). The RBI needs to target persistent inflation, not temporary spikes (like a sudden jump in tomato prices).
Refined Core Inflation gives the RBI the clearest signal about where long-term inflation is heading, helping them make better policy decisions and avoid overreacting to short-term noise.
Prelims tips
- Headline: All items (volatile).
- Core: Headline MINUS Food & Fuel.
- Refined Core: Core MINUS other volatile items (like gold).
- Refined Core is the most stable measure, used by RBI for policy analysis.
Mains points
- The challenge with core inflation is 'policy exclusion'. By removing food and fuel, it may ignore the inflation that affects the common person (Aam Aadmi) the most.
- However, for a central bank, targeting volatile food/fuel prices with interest rates is ineffective. Supply-side measures (by the government) are needed for food inflation, while monetary policy (by RBI) targets refined core inflation.