
Indian Economy · UPSC Notes
National Income — UPSC Economy Notes
Free, exam-focused notes for UPSC Prelims and Mains, with Prelims tips and Mains points for every topic. 25 topics.
Open in the interactive reader: bookmarks, progress tracking and read-aloud.
National Income
National Income is the total monetary value of all final goods and services produced by a country in one year. It reflects the overall economic activity, purchasing power, and standard of living, and is a key tool for economic planning and policy-making.
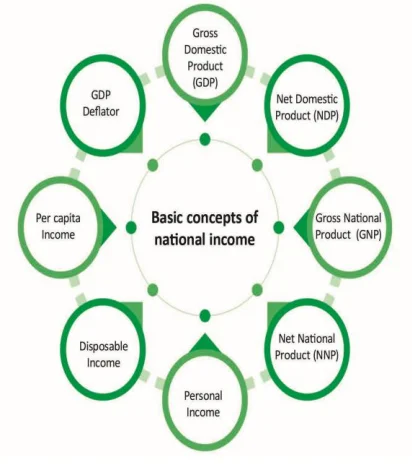
Introduction
National Income provides a comprehensive measure of the economic activities of a nation.
It indicates the purchasing power of the country and acts as an instrument of economic planning.
Used to evaluate growth, development, and performance of government policies.
Meaning of National Income
National Income = Total money value of all final goods and services produced in a country in one year.
It includes income earned by residents from production both within and outside the country.
Residents = individuals or institutions whose main economic interest lies within the country.
Example: If an Indian engineer works abroad and sends income back to India, it is included in India’s National Income.
Significance of National Income Accounting
Provides a complete measure of the nation’s economic activity.
Helps calculate per capita income, an indicator of economic welfare and living standards.
Provides statistical data for economic analysis and policy-making.
Tracks structural changes (e.g., from agriculture to industry and services).
Evaluates performance of government policies based on income growth.
Example: A rising national income signals economic growth, while a fall indicates slowdown.
Gross Domestic Product (GDP)
GDP = Total market value of all final goods and services produced within a country’s boundaries in one year.
It includes production within the country regardless of nationality of the producer.
Example: A Chinese company producing toys in India adds to India’s GDP. But if an Indian company produces toys in the US, it counts towards US GDP, not India’s.
Concept of Factor Cost and Market Price
Factor Cost (FC)
Factor cost refers to the total cost of production borne by a producer.
Includes: rent, wages, salaries, cost of capital, raw materials, entrepreneur’s profit.
Excludes: indirect taxes (since they do not contribute directly to production).
Includes: subsidies (since they reduce production cost).
Example: A factory producing textiles includes wages, raw material costs, and rent in factor cost.
Market Price (MP)
Market price = Price at which consumers buy goods in the market.
MP is derived from factor cost after adding indirect taxes (like GST) and subtracting subsidies.
Formula: MP = FC + Indirect Taxes – Subsidies.
Example: If factor cost of a good is ₹100, indirect tax is ₹20, and subsidy is ₹10 → MP = 100 + 20 – 10 = ₹110.
| Concept | Explanation |
|---|---|
| National Income | Money value of all final goods and services produced by residents in one year. |
| GDP | Market value of final goods/services produced within country, regardless of nationality. |
| Factor Cost | Total cost of production (wages, rent, interest, profit, subsidies). |
| Market Price | Price consumers pay; FC + Indirect Taxes – Subsidies. |
Prelims tips
- National Income includes only final goods and services, not intermediate goods (to avoid double counting).
- GDP is location-based, GNP is nationality-based.
- Factor cost excludes taxes, includes subsidies; Market price adds taxes, subtracts subsidies.
- Per capita income = National Income / Population; indicator of economic welfare.
Mains points
- National Income is a key tool for economic planning, measuring growth, and comparing development across nations.
- GDP measures production within geographical boundaries, while GNP includes nationality of producers.
- Factor Cost vs Market Price distinction is important for policy-making and inflation analysis.
- Helps evaluate structural shifts in economy (e.g., from agriculture to services).
- Used to assess success/failure of government policies and overall welfare of citizens.
Elements of GDP Calculation
GDP measures the total market value of all final goods and services produced within a country’s domestic territory in a given period. To calculate GDP correctly, one must include only final goods and services, define domestic territory, identify residents, and exclude transfer payments.
Final Goods and Services
Only final goods and services (purchased for consumption or final use) are counted in GDP.
Intermediate goods (used in producing final goods) are not counted separately to avoid double counting.
Example: If a burger is considered as a final product, then buns used inside the burger are not counted separately, as they are intermediate goods included in the burger’s value.
Domestic Territory
Refers to the geographical territory under the administration of a government where persons, goods, services, and capital can freely move.
Includes:
Political frontiers including territorial waters and airspace.
Indian embassies and consulates abroad (considered Indian territory).
Military bases located abroad under Indian control.
Ships and aircrafts owned and operated by Indian residents between two or more countries.
Fishing vessels, oil rigs, and natural gas rigs operated by residents in international waters with exclusive rights.
Example: An Air India aircraft flying from New York to London is part of India’s domestic territory, but a British Airways aircraft flying within India is not.
Residents
A resident is a person or institution that normally resides in a country for at least one year, with their main economic interest in that country.
Includes:
Indians working in Indian embassies abroad.
Foreign citizens living in India for more than one year (for work/business).
Excludes:
Foreigners working in Indian embassies abroad.
Officials working in international organizations like WHO, IMF in India.
Foreigners who come to India for medical treatment, study, or travel, even if they stay for more than one year.
Example: An American working in WHO’s India office is not considered an Indian resident for GDP purposes.
Transfer Payments
Transfer payments are payments received without rendering any productive service or economic activity.
They are not included in national income because they do not reflect production of goods or services.
Generally made by governments or welfare agencies to support individuals in need.
Examples: Unemployment allowances, social security benefits, pensions, scholarships, public health services.
Note: Factor incomes (like wages, rent, interest, profit) are included in GDP, but transfer payments are excluded.
| Element | Explanation |
|---|---|
| Final Goods & Services | Only final goods are counted, intermediate goods excluded to avoid double counting. |
| Domestic Territory | Geographical area + embassies + military bases + ships/aircraft operated by residents. |
| Residents | Persons/institutions with economic interest in country for ≥ 1 year. |
| Transfer Payments | Excluded from GDP since no goods/services are produced. |
Prelims tips
- GDP includes only final goods, not intermediate goods.
- Domestic territory includes embassies and military bases abroad but excludes foreign embassies in India.
- Residents = economic interest in country for at least one year; not all foreigners living in India qualify.
- Transfer payments like pensions and scholarships are excluded from GDP.
Mains points
- Final goods principle avoids double counting in GDP calculations.
- Domestic territory concept clarifies which areas and institutions are included in GDP.
- Resident definition ensures correct inclusion of incomes earned by nationals vs foreigners.
- Transfer payments are excluded as they do not reflect productive economic activity.
- These elements together ensure accuracy and comparability of GDP data across nations.
Types of GDP and Methods of Calculation
GDP (Gross Domestic Product) measures the monetary value of all final goods and services produced within a country’s domestic territory in a year. It can be measured at current prices (Nominal GDP) or constant prices (Real GDP). National income can be calculated using three approaches: production (value added), income, and expenditure methods.
Types of GDP
Nominal GDP (GDP at Current Prices)
Nominal GDP is the total monetary value of goods and services produced in a country during a financial year at market prices of that year.
It does not adjust for inflation, meaning if prices increase, GDP may look higher even if actual production has not changed.
Example: If in 2022 India produced 1000 goods at ₹10 each = ₹10,000. In 2023, the same 1000 goods are sold at ₹12 each, then GDP = ₹12,000. The rise is due to price increase, not more production.
Real GDP (GDP at Constant Prices)
Real GDP is the value of goods and services produced in a country, calculated at constant prices (base year prices).
It is adjusted for inflation to reflect actual changes in production/output.
Real GDP is considered more accurate for measuring economic growth.
Example: If 2015 is the base year, GDP of 2023 is calculated using 2015 prices to remove the effect of inflation.
Methods of GDP Calculation
National income can be measured by three approaches: Output, Income, and Expenditure.
These three methods are interlinked (Output = Income = Expenditure) because the process is circular in nature.
1. Production or Value Added Method
This method calculates GDP by summing the value added by all producers in the economy at each stage of production.
Formula: Value Added = Value of Output – Intermediate Consumption.
Example: Shyam produces orange juice for ₹100 using oranges and sugar worth ₹50. Value added = 100 – 50 = ₹50.
GDP at Current Market Price (MP) = Σ Gross Value Added (GVA) of all goods/services + Taxes – Subsidies.
GDP at Constant MP (Real GDP) = GDP at Current MP adjusted to base year prices.
2. Income Method
GDP is calculated as the sum of all factor incomes earned in production.
Includes wages and salaries, rent, interest, and profits.
Example: If a company produces ₹1,00,000 worth of goods, this value is distributed as wages to workers, rent to landowners, interest to capital providers, and profits to entrepreneurs.
3. Expenditure Method
GDP is calculated as the sum of all expenditures made on final goods and services within the country.
Components: Consumption expenditure (C) + Investment expenditure (I) + Government spending (G) + Net Exports (Exports – Imports).
Example: If households spend ₹50,000, firms invest ₹30,000, government spends ₹20,000, and net exports are ₹10,000 → GDP = 50,000 + 30,000 + 20,000 + 10,000 = ₹1,10,000.
| Type/Method | Explanation |
|---|---|
| Nominal GDP | GDP at current year prices, not adjusted for inflation. |
| Real GDP | GDP at base year prices, adjusted for inflation. |
| Production Method | GDP = Value Added (Output – Intermediate consumption). |
| Income Method | GDP = Wages + Rent + Interest + Profits. |
| Expenditure Method | GDP = Consumption + Investment + Govt. spending + Net Exports (C+I+G+(X–M)). |
Prelims tips
- Nominal GDP shows inflated value due to price rise; Real GDP is used for economic growth comparisons.
- GDP can be measured by Output, Income, and Expenditure methods – all should ideally give the same result.
- Value Added Method prevents double counting by excluding intermediate goods.
- Expenditure method formula: GDP = C + I + G + (X–M).
Mains points
- Nominal vs Real GDP distinction is crucial for analyzing inflation vs real growth.
- Production method highlights contribution of each sector to GDP.
- Income method shows how GDP is distributed among factors of production.
- Expenditure method explains demand-side components driving GDP.
- Cross-checking three methods ensures accuracy and reliability of GDP statistics.
GDP by Value Added and Income Method
In the Value Added Method, GDP is calculated by summing value added at each stage of production, but only final goods/services are included. In the Income Method, GDP is calculated as the sum of all factor incomes earned in production (wages, rent, interest, profits, and mixed income).
Goods and Services in Value Added Method
Only certain goods and services are included while calculating GDP to avoid double counting.
Included Items:
Goods and services sold in the market.
Services provided by agents (e.g., brokers, commission agents).
Imputed rent or imputed interest (when a property is self-owned and no rent is paid, estimated rent is counted).
Not Included Items:
Buying and selling of second-hand goods (since they were already counted in GDP earlier).
Transfer payments (scholarships, pensions, unemployment benefits) as they are not payments for production of goods/services.
Example: A house owner living in his own house is not paying rent to himself, but the imputed rent is included in GDP since it reflects the value of housing services.
Income Method of GDP
GDP is calculated by adding all incomes generated in the production process.
This gives GDP at Factor Cost since it considers payments to factors of production.
Factors of Production and Corresponding Incomes:
Land → Rent.
Labour → Wages & Salaries.
Capital → Interest.
Entrepreneurship → Profits.
Factor Incomes are classified into three categories:
1. Compensation to Employees: Includes wages, salaries, employer’s contribution to social security, allowances, etc.
2. Operating Surplus: Includes rent, interest, royalty, and profits (corporate tax, dividends, retained earnings).
3. Mixed Income of Self-Employed: Income of farmers, doctors, lawyers, small traders etc. who combine labour and capital.
Formula:
1. GDP at Factor Cost = Rent + Wages + Interest + Profits.
2. GDP at Factor Cost + (Indirect Taxes – Subsidies) = GDP at Market Price.
3. Adjust GDP at Market Price with base year prices to get Real GDP (GDP at Constant MP).
| Goods/Services | Included in GDP? |
|---|---|
| Goods & services sold in market | Included |
| Services by agents | Included |
| Imputed rent/interest | Included |
| Second-hand goods | Not Included |
| Transfer payments (pension, scholarships) | Not Included |
| Factor of Production | Type of Income |
|---|---|
| Land | Rent |
| Labour | Wages and Salaries |
| Capital | Interest |
| Entrepreneurship | Profits (corporate tax, dividends, retained earnings) |
| Self-employed | Mixed income (farmers, doctors, traders) |
Prelims tips
- Value Added Method excludes second-hand goods and transfer payments to avoid double counting.
- Imputed rent of self-occupied houses is included in GDP.
- Income Method formula: GDP at Factor Cost = Rent + Wages + Interest + Profits.
- Adjustment with taxes and subsidies converts Factor Cost to Market Price.
Mains points
- Value Added Method ensures GDP is calculated without duplication by considering only final goods and services.
- Income Method highlights distribution of GDP among factors of production (land, labour, capital, entrepreneurship).
- Inclusion of imputed rent ensures housing services are represented in GDP statistics.
- Exclusion of transfer payments prevents overestimation of economic activity.
- Both methods complement each other and validate GDP figures when cross-checked.
GDP by Expenditure Method
Expenditure Method calculates GDP by summing all expenditures made on final goods and services within the domestic territory in a given year. It assumes that at equilibrium, total spending (demand) = total production (supply). Formula: GDP at Market Price = C + I + G + (X – M).
Concept
Expenditure Method measures the total expenditure incurred on final goods and services produced within the country in a year.
Also called the 'Consumption and Investment Method' or 'Income Disposal Method'.
While the Value Added Method measures GDP from the producer’s side (sales), the Expenditure Method measures from the consumer’s side (purchases).
At equilibrium: Total Expenditure = Total Production.
Components of Expenditure Method
1. Consumption Expenditure (C)
Spending by individuals, households, and private firms on final goods and services.
Includes: Food, clothing, transportation, TVs, cars, medicines, etc.
Excludes: Purchase of second-hand goods, since they were already counted earlier.
Note: Construction of new houses is counted under 'Investment', not consumption.
2. Investment Expenditure (I)
Expenditure on investment goods (capital formation).
Includes: Purchase of machinery, construction of highways, dams, factories, residential property, raw materials, wages to workers, unsold inventory.
Excludes: Savings in banks, shares, and bonds, since they are only financial instruments. They are counted only when invested into capital goods.
3. Government Expenditure (G)
Spending by the government on final goods and services.
Includes: Administrative expenses, defence, law and order, salaries of government employees, infrastructure projects.
Excludes: Transfer payments like subsidies, pensions, and scholarships since they do not correspond to production. Instead, they are counted under the consumption of the beneficiary.
4. Net Exports (NX)
Net Exports = Exports (X) – Imports (M).
Exports are included as they are produced domestically for foreign consumers.
Imports are excluded since they are not produced domestically.
Example: If India exports goods worth ₹500 crore and imports worth ₹300 crore → NX = 500 – 300 = ₹200 crore.
Formula
GDP at Market Price = C + I + G + (X – M).
Current GDP is measured at market prices. To get Real GDP, it is adjusted with base year prices.
| Component | Description | Included/Excluded |
|---|---|---|
| Consumption (C) | Household spending on final goods/services | New TV, food, transport (Included); Second-hand goods (Excluded) |
| Investment (I) | Spending on capital goods | Machinery, construction (Included); Bank savings/bonds (Excluded) |
| Government (G) | Spending by govt. on goods/services | Defence, admin costs (Included); Pensions, subsidies (Excluded) |
| Net Exports (NX) | Exports – Imports | Exports (Included); Imports (Excluded) |
Prelims tips
- Formula: GDP = C + I + G + (X – M).
- Construction of new houses is counted in Investment, not Consumption.
- Transfer payments (pensions, subsidies) are excluded since they do not reflect production.
- Exports are added, imports are subtracted to avoid counting foreign production.
Mains points
- Expenditure method shows GDP from the demand side, complementing supply-side estimates.
- It highlights the relative contribution of consumption, investment, government, and trade in GDP.
- Helps policymakers identify demand-side imbalances (e.g., low investment, high imports).
- Provides insights for designing fiscal policy (govt. spending) and trade policy (exports vs imports).
- Key for understanding the structure of aggregate demand in the economy.
Other Measures of National Income
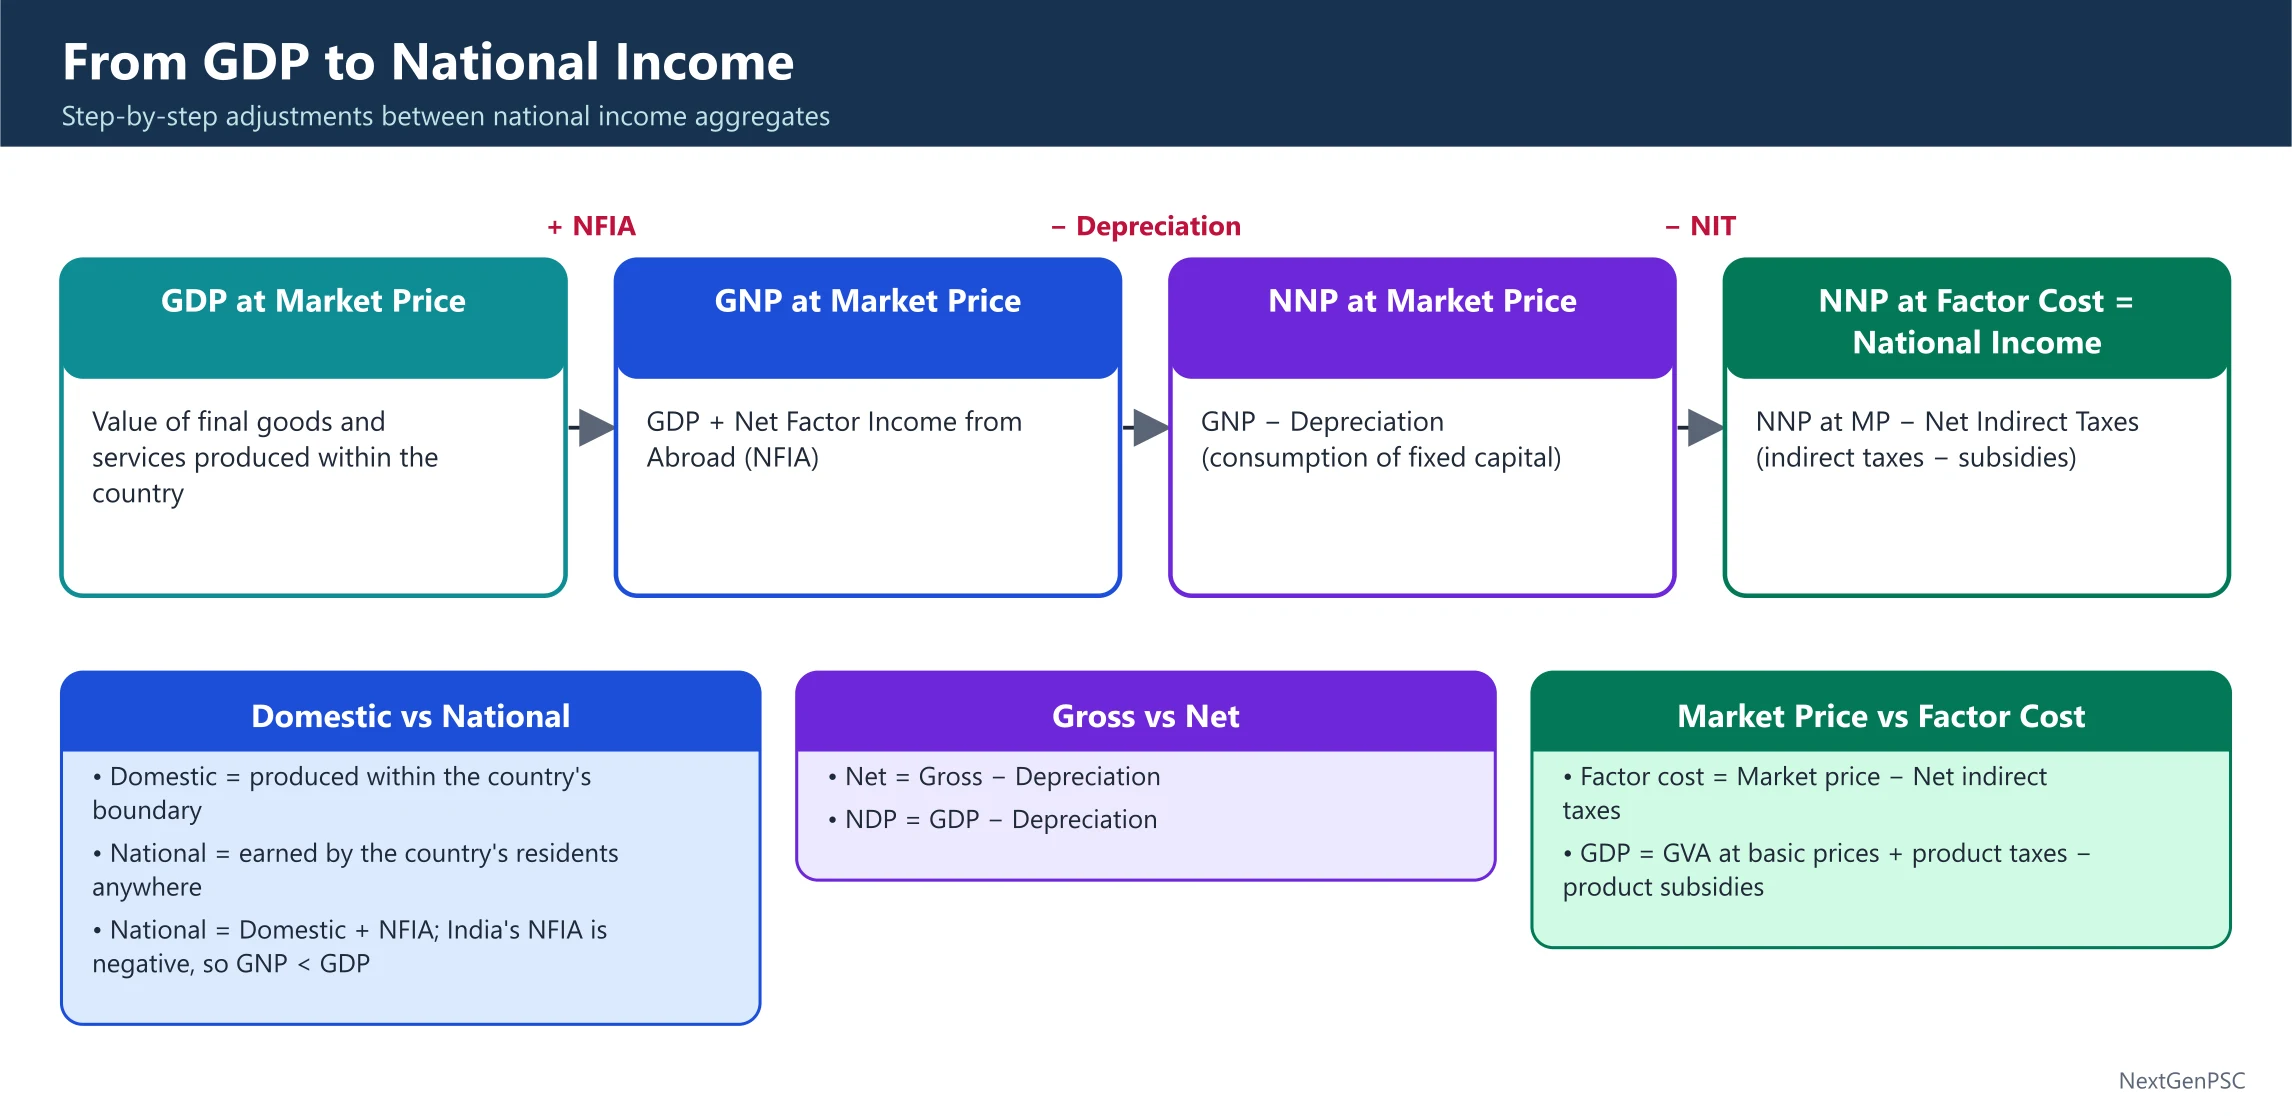
Beyond GDP, national income is measured through Net Domestic Product (NDP), Depreciation, and Gross National Product (GNP). These measures refine GDP by accounting for wear and tear of assets and by distinguishing between production within borders vs by citizens worldwide.
Net Domestic Product (NDP)
NDP is the net market value of all final goods and services produced within a country’s domestic territory in a financial year after deducting depreciation from GDP.
GDP measures gross availability of goods/services, NDP shows net availability (after accounting for wear and tear).
Formula: NDP = GDP – Depreciation.
Example: If India produces 5 cars worth ₹1,00,000 each → GDP = ₹5,00,000. If depreciation = ₹50,000, then NDP = ₹4,50,000.
Conclusion: GDP is always greater than NDP, since depreciation is always positive.
Depreciation
Depreciation = fall in value of fixed assets due to normal wear and tear, aging, or obsolescence.
Also called: Consumption of Fixed Capital, Capital Consumption Allowance, Replacement Cost.
Example: A machine worth ₹10,00,000 reduces in value by ₹1,00,000 every year due to usage. That reduction is depreciation.
Gross National Product (GNP)
GNP = total value of final goods and services produced by citizens of a country in a financial year, irrespective of where they are located.
GDP focuses on where production takes place; GNP focuses on who produces it.
Income of foreign nationals/companies in India is excluded from India’s GNP. Income of Indian citizens/companies abroad is included in India’s GNP.
Example: Google (US company) producing in India adds to India’s GDP, not India’s GNP. Wipro (Indian company) producing in the US adds to India’s GNP, not India’s GDP.
Formula: GNP = GDP + NFIA.
NFIA (Net Factor Income from Abroad) = Income earned by domestic factors abroad – Income earned by foreign factors in domestic economy.
In India, GNP is usually lower than GDP since NFIA is negative (India pays more to foreign investors than it receives).
| Measure | Definition | Formula |
|---|---|---|
| GDP | Value of goods/services produced within domestic territory. | GDP = C + I + G + (X – M) |
| NDP | GDP adjusted for depreciation (wear and tear). | NDP = GDP – Depreciation |
| GNP | Value of goods/services produced by citizens, irrespective of location. | GNP = GDP + NFIA |
Prelims tips
- GDP is always greater than NDP since depreciation is deducted in NDP.
- GDP = location-based, GNP = nationality-based.
- NFIA = Income earned by domestic residents abroad – Income earned by foreigners in domestic territory.
- In India, NFIA is negative, so GNP < GDP.
Mains points
- NDP refines GDP by accounting for depreciation, showing true net output available.
- Depreciation reflects the cost of maintaining capital stock for future production.
- GNP shifts focus from domestic territory to nationality of producers, making it useful for globalized economies.
- For developing countries like India, GNP < GDP due to large foreign investment outflows.
- These measures together provide a complete picture of economic activity and welfare.
Net National Product (NNP) & National Income
NNP is the total value of final goods and services produced by nationals of a country after deducting depreciation from GNP. When expressed at Factor Cost, NNP is also called National Income. It adjusts for indirect taxes and subsidies, giving a true measure of income available to citizens.
Net National Product (NNP)
NNP measures the value of output produced by nationals of a country, irrespective of geographical boundaries, after accounting for depreciation.
Formula: NNP = GNP – Depreciation.
Example: If GNP = ₹1000 crore and depreciation = ₹100 crore, then NNP = ₹900 crore.
NNP can be expressed at Market Price or Factor Cost:
NNP at Market Price = Value at prevailing market prices.
NNP at Factor Cost = NNP (Market Price) – Indirect Taxes + Subsidies.
NNP at Factor Cost = National Income.
National Income
National Income is the NNP at Factor Cost.
It is the best indicator of the total income earned by residents of a country.
Formula: National Income = NNP (MP) – Indirect Taxes + Subsidies.
It reflects the real income received by citizens after government interventions.
Relationship between GDP, GNP, NDP, and NNP
GNP = GDP + NFIA.
Also = NDP + Depreciation + NFIA.
NNP = GNP – Depreciation.
Also = GDP + NFIA – Depreciation.
Thus:
GDP focuses on domestic production.
GNP focuses on citizens’ production worldwide.
NDP adjusts GDP for depreciation.
NNP adjusts GNP for depreciation, giving a net measure.
Which is Better?
NDP: Useful for analyzing depreciation impact on sectors, but not for global comparison (since depreciation rates differ country to country).
NNP: Also not suitable for global comparison for the same reason.
GDP: Preferred for international comparison since it reflects total domestic production without varying depreciation adjustments.
| Measure | Definition | Formula |
|---|---|---|
| GDP | Value of goods/services within domestic territory. | GDP = C + I + G + (X – M) |
| NDP | GDP adjusted for depreciation. | NDP = GDP – Depreciation |
| GNP | Goods/services by nationals worldwide. | GNP = GDP + NFIA |
| NNP | GNP adjusted for depreciation (National Income at FC). | NNP = GNP – Depreciation |
Prelims tips
- NNP at Factor Cost = National Income.
- National Income = NNP (MP) – Indirect Taxes + Subsidies.
- GDP > NDP (since depreciation > 0).
- In India, GNP < GDP because NFIA is negative.
- For international comparison, GDP is preferred, not NDP/NNP.
Mains points
- NNP provides a refined measure of economic output by accounting for depreciation.
- National Income (NNP at Factor Cost) is the truest measure of income received by residents.
- NDP and NNP are less suitable for global comparisons due to different depreciation policies across countries.
- GDP is globally standardized and thus used for international ranking and comparisons.
- Together, these indicators help in understanding production, income distribution, and depreciation impact on economy.
Personal Income and Related Concepts
Personal Income is the total income actually received by individuals from all sources before paying direct taxes. From this, Disposable Personal Income, National Disposable Income, and Per Capita Income are derived, which indicate how much income is available for consumption, savings, and average living standards.
Personal Income (PI)
Definition: Total income received by individuals of a country from all sources before paying direct taxes (like income tax).
Derived from National Income by:
Deducting: Undistributed corporate profits (retained earnings of firms like Infosys, Wipro) and social security contributions (like PF contributions by employees).
Adding: Transfer payments (income without productive activity).
Examples (Included): Salary received by resident in India, scholarship from Government, LPG subsidy, gifts from relatives abroad.
Examples (Excluded): Salary paid to non-residents, gifts given to non-residents, undistributed corporate profits.
Formula: Personal Income = National Income – (Social Security Contributions + Undistributed Corporate Profits) + Transfer Payments.
Disposable Personal Income (DPI)
Definition: Income left with individuals after paying direct personal taxes (income tax, property tax, professional tax, etc.).
This is the amount households can actually spend or save at their discretion.
Formula: Disposable Personal Income = Personal Income – Direct Taxes.
Relation: DPI = Consumption + Saving.
Example: If A’s personal income = ₹1000, and he pays ₹100 as tax → DPI = ₹900. This is the money he can spend on food, rent, or save in bank.
National Disposable Income (NDI)
Definition: Total income (factor + non-factor) accruing to residents of a country. It represents the maximum goods and services available for use in the economy.
Includes both income earned domestically and transfer incomes received from abroad.
Example: Tata pays ₹1000 salary to A (Indian resident) + A receives ₹500 gift from relative in Dubai → NDI includes ₹1000 + ₹500 = ₹1500.
Per Capita Income (PCI)
Definition: Average income per person of a country in a particular year.
Formula: Per Capita Income = National Income ÷ Population = NNP (at Factor Cost) ÷ Population.
It is used as a key measure of economic welfare and living standards.
Example: If total National Income = ₹10,00,000 and population = 1000 → PCI = ₹1000 per person.
Limitation: PCI is an average – it does not reflect income inequality. For example, if 100 people earn ₹100 each while 1000 people earn ₹1000 each, PCI may look high (₹918.18), but inequality exists.
| Measure | Definition | Formula | Key Point |
|---|---|---|---|
| Personal Income (PI) | Total income received before paying direct taxes. | PI = NI – (Undistributed Profits + Social Security Contributions) + Transfer Payments | Includes subsidies and transfers, excludes retained earnings. |
| Disposable Personal Income (DPI) | Income left after paying direct taxes. | DPI = PI – Direct Taxes | Actual money available for spending or saving. |
| National Disposable Income (NDI) | Total factor + non-factor income of residents. | NDI = Factor Incomes + Transfer Incomes | Represents maximum goods/services available for use. |
| Per Capita Income (PCI) | Average income per person. | PCI = National Income ÷ Population | Indicator of standard of living, but ignores inequality. |
Prelims tips
- Personal Income includes transfer payments, but excludes retained corporate profits.
- Disposable Personal Income = Consumption + Savings.
- NDI shows maximum resources available in economy (factor + non-factor income).
- Per Capita Income is used for welfare comparisons but ignores inequality.
Mains points
- Personal Income and Disposable Income bridge the gap between national accounts and individual welfare.
- DPI is crucial for analyzing consumption and savings behavior in households.
- NDI provides insights into the economy’s capacity to spend and invest.
- PCI is widely used for international comparisons of living standards, but economists supplement it with inequality measures (like Gini Index).
- Together, these measures connect macro-level production with micro-level welfare.
Per Capita Income in India
Per capita income in India has grown enormously since independence, reflecting rising output and improving living standards. However, in absolute dollar terms it remains modest, and large inequalities persist across states and population groups.
According to World Bank data, India is among the world’s major economies by GDP, with a large aggregate size.
In 1950, per capita income in India was only about ₹ 265 (at then prevailing prices). Over the decades it has risen by over 500 times in nominal terms.
By 2000-01, per capita income had increased to approx ₹ 18,667. Since then, it has grown about 7 times by 2020-21, reaching around ₹ 1,28,829.
In terms of US dollars, India’s GDP per capita has also grown. For example, in 2021 it was approximately US 2,240 (current dollars).
Recent figures put India’s GDP per capita (nominal) at around US 2,396.71 (2024) and the PPP-adjusted per capita income (which accounts for cost of living) is higher.
Although the average is rising, large disparities exist across states, rural vs urban areas, and among income groups, making per capita as an average measure sometimes misleading.
| Year | Per Capita Income (₹, nominal) | Per Capita Income (US, nominal) |
|---|---|---|
| 1950 | ₹ 265 | — |
| 2000-01 | ₹ 18,667 | — |
| 2020-21 | ₹ 1,28,829 | ≈ US 1,907 (for India’s GDP per capita in 2020) |
| 2024 | — | US 2,396.71 |
Prelims tips
- Per capita income is obtained by dividing national income (or GDP) by population.
- Nominal per capita income can distort growth if inflation is high — Real per capita income is a better indicator of actual welfare.
- PPP-adjusted per capita income gives better comparison by accounting for cost of living differences.
- India’s per capita income has risen steeply over decades, but remains modest in global rankings.
Mains points
- The historical rise in India’s per capita income shows long-term economic growth but also points to large base effects in early years.
- Dollar-denominated per capita income gives perspective for international comparison but is sensitive to exchange rates.
- PPP-adjusted per capita income helps compare standards of living across countries better than nominal alone.
- State-wise and rural-urban disparities mean that high national average often conceals inequality.
- Policymakers need to combine per capita income data with measures of income distribution and poverty for a fuller picture.
Other Concepts Related to GDP
Two key concepts linked with GDP are the GDP Deflator (a measure of inflation) and Base Year (used as a reference for calculating real growth). These help economists understand how much of GDP growth is due to higher production versus rising prices.
GDP Deflator
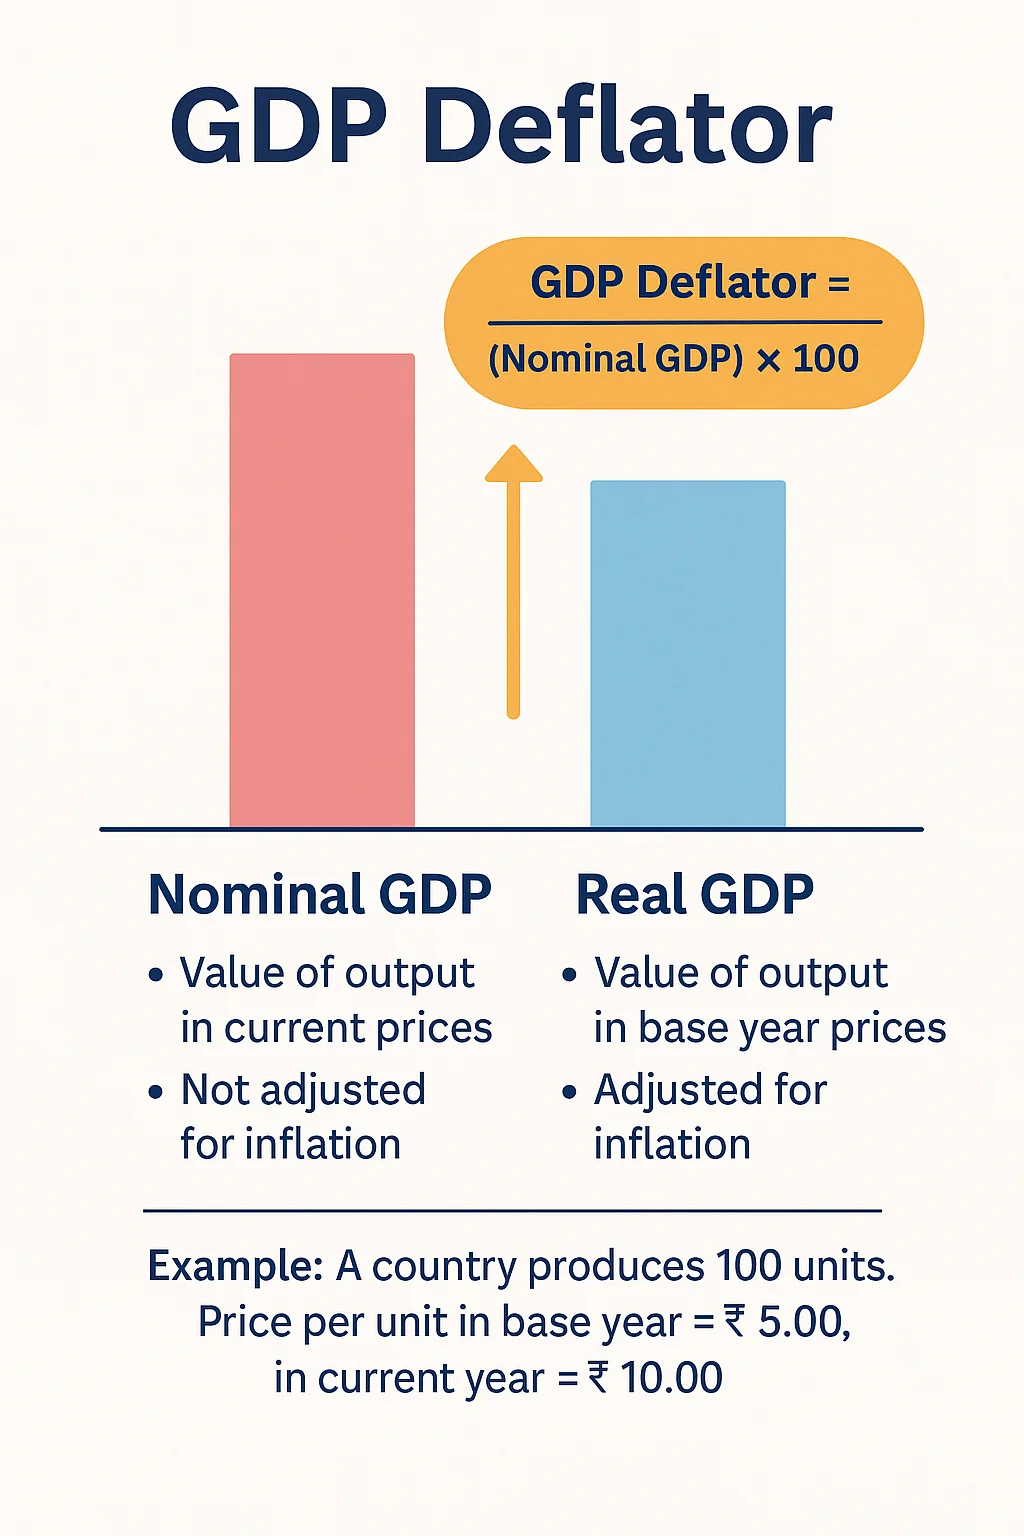
Definition: Ratio of the value of goods and services produced in the current year at current prices to the value at base year prices.
Formula: GDP Deflator = (Nominal GDP ÷ Real GDP) × 100.
Nominal GDP = GDP at current year’s prices (includes effect of inflation).
Real GDP = GDP at constant prices (base year’s prices, excludes inflation).
Example: In 2020-21, a country produces 100 units. Price per unit in 2020-21 = ₹10, while in base year 2011-12 = ₹5. Nominal GDP = 100 × 10 = ₹1000, Real GDP = 100 × 5 = ₹500. Thus, GDP Deflator = 1000 ÷ 500 × 100 = 200 (indicating prices doubled since base year).
Significance of GDP Deflator
Measures overall inflation in the economy, unlike CPI or WPI that cover only a basket of goods.
Includes prices of investment goods, government services, and exports. Excludes imports (since they are not produced domestically).
Automatically adjusts to changes in consumption patterns, new products, or structural changes in the economy.
Provides a more comprehensive picture of price changes than CPI (Consumer Price Index) or WPI (Wholesale Price Index).
Base Year
Meaning: A reference year chosen for comparing GDP values of other years.
Why needed: Without a base year, we can’t distinguish between increase in production and increase in prices.
Example: GDP in 2010 = 100 units, GDP in 2020 = 150 units. Growth = (150 – 100) ÷ 100 × 100 = 50%. Here, 2010 is the base year.
Importance: Captures new economic activities and structural changes. For example, mobile phones were not included in 1990 GDP, but they are essential after 2000s.
Periodic Change: To ensure GDP reflects current structure of economy, the base year is revised every few years.
Present Case: The current base year for GDP calculation in India is 2011-12.
Prelims tips
- GDP Deflator is broader than CPI/WPI as it covers the entire economy.
- Deflator > 100 means price rise since base year; Deflator < 100 means prices fell.
- India’s current base year for GDP is 2011-12.
Potential GDP and GDP Calculation in India
Potential GDP is the maximum sustainable level of output an economy can produce without creating inflationary pressures. In India, GDP is measured by the National Statistical Office (NSO) using GVA at basic prices (base year 2011–12), following international standards.
Potential GDP
Definition: Potential GDP is the estimate of output that the economy can produce when labor and capital are used at their maximum sustainable levels (steady growth + stable inflation).
It represents the economy’s capacity at constant inflation rate.
Output Gap: Difference between actual Real GDP and Potential GDP.
Positive Output Gap: Real GDP > Potential GDP → economy overheats → inflation rises.
Negative Output Gap: Real GDP < Potential GDP → underutilization of resources → unemployment rises.
Importance: Helps policymakers know if the economy is operating below or above sustainable capacity.
GDP Calculation in India
Agency: National Statistical Office (NSO) under Ministry of Statistics and Programme Implementation (MOSPI).
Earlier, GDP was calculated by Central Statistical Office (CSO) and National Sample Survey Office (NSSO). Both merged into NSO in 2019.
In 2015, GDP methodology updated as per UN’s System of National Accounts (SNA), 2008.
Shift from GDP at Factor Cost to GDP at Market Price.
Shift from GVA at Factor Cost to GVA at Basic Prices (Base Year: 2011–12).
GVA Sector-wise (8 sectors reported by NSO)
1. Agriculture, Forestry, and Fishing
2. Mining and Quarrying
3. Manufacturing
4. Electricity, Gas, and Water Supply
5. Construction
6. Trade, Hotels, Transport, and Communication
7. Finance, Insurance, Real Estate, and Business Services
8. Public Administration, Defence, and Other Services
Base Year Changes
Base year updated periodically to reflect new products, technology, and structural changes.
Current base year: 2011–12.
MOSPI is considering shifting base year to 2017–18.
New Changes in National Accounts (2015 revision)
Base Year: Changed from 2004–05 → 2011–12.
Growth Rate Measurement: Earlier GDP at Factor Cost → Now GDP at Market Price.
GVA: Earlier at Factor Cost → Now at Basic Prices (includes production taxes, excludes production subsidies).
Database: Earlier based on Annual Survey of Industries (ASI) + Index of Industrial Production (IIP). Now uses companies’ balance sheet data from Ministry of Corporate Affairs (MCA21 database).
Agriculture: Earlier only farm produce was counted; now livestock income also included.
| Component | Old Method | New Method |
|---|---|---|
| Base Year | 2004–05 | 2011–12 |
| Growth Measurement | GDP at Factor Cost | GDP at Market Price |
| Sectoral GVA | Factor Cost | Basic Price (includes production taxes, excludes subsidies) |
| Database | ASI + IIP | MCA21 corporate filings |
| Agricultural Income | Farm produce only | Farm + Livestock value addition |
Prelims tips
- Potential GDP shows maximum sustainable output without inflation.
- Output Gap = Real GDP – Potential GDP.
- India’s GDP is calculated by NSO under MOSPI.
- Base year for GDP in India is 2011–12 (likely to change to 2017–18).
- 2015 revision: Shift from GDP at Factor Cost to GDP at Market Price.
Mains points
- Potential GDP and output gap help assess inflationary pressures and unemployment trends.
- India’s adoption of UN SNA 2008 improved international comparability of its GDP data.
- Change from factor cost to market price aligns Indian GDP with global norms.
- Using MCA21 corporate data enhances reliability but also raises transparency debates.
- Base year revision is crucial for reflecting new industries, services, and consumption patterns.
Significance of New NAS Series & GDP–GVA Gap
The 2015 revision of India’s National Accounts Statistics (NAS) introduced major changes to align with international standards (SNA 2008). It improved coverage, data sources, and methodology, making GDP estimates more accurate and globally comparable. A key distinction is that GDP is at market prices, while GVA is at basic prices, leading to a GDP–GVA gap.
Significance of New NAS Series
Conformity with International Standards: Updated base year reflects structural changes and aligns with UN System of National Accounts (SNA, 2008).
Better Growth Measurement: New method includes production costs + product taxes – subsidies, making India’s GDP comparable with developed countries.
Sectoral Clarity: Use of GVA gives a clear breakdown of sector-wise contribution (agriculture, industry, services).
Comprehensive Database: Covers regulatory bodies like SEBI, PFRDA, IRDA, and many local organizations.
Robust Statistics: Incorporates more indicators such as consumption, employment, and enterprise performance.
Widened Dataset: Use of MCA-21 corporate filings widened the coverage to about 5 lakh non-financial companies.
Enterprise Approach: Captures headquarter services (marketing, accounting, admin) leading to higher GVA estimates.
System of National Accounts (SNA), 2008
International framework for compiling national accounts.
Provides consistency across countries to ensure comparability.
India revised NAS in 2015 to align with SNA 2008.
GDP–GVA Gap
GDP is measured at Market Prices (includes product taxes – subsidies).
GVA is measured at Basic Prices (excludes product taxes, includes production subsidies).
Thus, GDP ≠ GVA. Formula: GDP = GVA + Product Taxes – Product Subsidies.
Reasons for GDP–GVA Gap
During FY21 (COVID lockdown): Greater subsidies and lower taxes → GDP growth lagged behind GVA by 180 basis points.
During FY22 (post-lockdown recovery): Higher tax revenue and lower subsidies → GDP growth was 60 basis points higher than GVA growth.
| Aspect | GDP (Market Prices) | GVA (Basic Prices) |
|---|---|---|
| Definition | Value of goods/services at market price (includes taxes, excludes subsidies) | Value added at basic price (excludes product taxes, includes subsidies) |
| Formula | GDP = GVA + Product Taxes – Product Subsidies | GVA = GDP – Product Taxes + Product Subsidies |
| Use | Measures economy’s size including govt. taxes/subsidies impact | Shows sector-wise value addition (production-side measure) |
| Gap Causes | Changes in taxes/subsidies | Not affected directly by taxes |
Prelims tips
- GDP = GVA + Taxes – Subsidies.
- New NAS (2015) uses MCA21 database of companies.
- GDP is at market price, GVA is at basic price.
- GDP growth can be higher/lower than GVA growth depending on taxes/subsidies.
Mains points
- The new NAS series (2015) aligned India’s GDP estimates with international standards (SNA 2008).
- Expanded database (MCA21) improved coverage of private sector activities.
- GVA approach helps in sectoral analysis, while GDP captures taxes and subsidies impact.
- The GDP–GVA gap highlights how fiscal policy (taxes and subsidies) influences growth numbers.
- Accurate measurement is crucial for policymaking, budget planning, and global credibility.
Utility of GDP and GVA under Different Circumstances
GDP shows the economy from the demand/consumer side, while GVA presents it from the supply/producer side. Together, they provide a complete picture of economic performance. Policymakers, investors, and analysts use both for better decision-making.
GDP – Demand Side Indicator
GDP measures the total market value of all final goods and services produced within a country in a given period.
It presents the state of economy from the consumers’ side (demand side).
GDP helps determine whether the economy is expanding (growth) or contracting (recession).
By using income and personal consumption data, GDP is a proxy to estimate people’s standard of living.
GVA – Supply Side Indicator
GVA measures the value of goods and services produced after deducting cost of intermediate goods and raw materials.
It presents the state of economy from the producers’ or supply side.
GVA provides a true picture of economic activity, showing how much value is added by each sector.
Policymakers use GVA to identify region-wise and sector-wise performance, and to decide where incentives or stimulus are needed.
When to Use GDP vs GVA
GDP is better for understanding overall demand, consumer welfare, and economic health.
GVA is better for understanding supply-side dynamics and sectoral contributions.
Together: GDP + GVA = holistic picture of economic activity.
| Aspect | Gross Domestic Product (GDP) | Gross Value Added (GVA) |
|---|---|---|
| Definition | Market value of all final goods/services produced within domestic territory. | Value of output – Value of intermediate goods (value added at basic prices). |
| Viewpoint | Consumer/Demand side (economic health, standard of living). | Producer/Supply side (sectoral production activity). |
| Formula | GDP = GVA + Taxes – Subsidies. | GVA = GDP – Taxes + Subsidies. |
| Measurement | By Output, Income, and Expenditure methods. | By Output/Production method (sector-wise GVA). |
| Sector Focus | Whole economy as a single entity. | Sector-wise/region-wise performance (agriculture, industry, services). |
| Usefulness | To gauge overall growth, demand, consumption trends. | To analyze supply, productivity, and identify lagging sectors. |
Prelims tips
- GDP shows demand side, GVA shows supply side of economy.
- GDP = GVA + Taxes – Subsidies.
- GVA is more useful for sector-wise analysis, GDP is more useful for overall economic growth.
- Policymakers use both GDP and GVA for balanced understanding.
Mains points
- GDP is a macroeconomic indicator of overall demand and consumer welfare, while GVA gives sectoral insights into production and supply-side performance.
- Using GDP alone may hide sectoral weaknesses; GVA highlights which industries need support.
- The GDP–GVA framework ensures that both demand and supply perspectives are integrated in policymaking.
- During shocks (like COVID-19), GDP fell due to reduced demand, but GVA analysis showed which sectors (e.g., agriculture) remained resilient.
- Both indicators are complementary, not substitutes.
GDP and Welfare
GDP measures the value of goods and services produced, but welfare (well-being) depends on both economic and non-economic factors. Hence, GDP growth does not always mean higher welfare.
Meaning of Welfare
Welfare = Sense of well-being and quality of life.
Influenced by economic factors (income, consumption) and non-economic factors (law & order, environment, social peace).
GDP as Welfare Indicator
GDP = Total value of goods and services produced within a country in a year.
Distributed among people as incomes (except retained earnings).
Higher GDP → more goods & services → improved material well-being.
But GDP alone cannot fully measure welfare due to several limitations.
Limitations of GDP as Welfare Indicator
1. Distribution of GDP
If GDP growth benefits only a few, overall welfare may not rise.
Example: GDP rises but income inequality worsens → most citizens see no improvement.
2. Non-Monetary Exchanges
Many productive activities (e.g., household work by women, voluntary services) are not included in GDP.
This underestimates actual well-being.
3. Externalities
Negative externalities: Oil refinery polluting rivers increases GDP but reduces welfare.
Positive externalities: Education improves society’s welfare but is undercounted in GDP.
4. Unequal Contribution of Goods
Some goods (food, clothing, housing) directly improve welfare more than others (military, police services).
Thus, type of goods produced matters, not just quantity.
5. Negative Contribution
GDP counts harmful goods (like liquor, tobacco) same as beneficial goods.
Such products may reduce long-term welfare despite contributing to GDP.
| Aspect | GDP | Welfare |
|---|---|---|
| Definition | Value of goods & services produced in economy. | Sense of well-being (economic + non-economic). |
| Measurement | Monetary terms (market prices). | Monetary + non-monetary factors (income, health, environment). |
| Scope | Focus on production & income. | Focus on quality of life. |
| Limitation | Ignores inequality, externalities, harmful goods. | Broader measure including distribution & sustainability. |
Prelims tips
- GDP growth ≠ Welfare growth.
- Welfare depends on income distribution, externalities, type of goods, and non-monetary factors.
- GDP includes liquor, cigarettes, etc., which may reduce welfare despite contributing to GDP.
Mains points
- GDP is an important but incomplete measure of welfare.
- Rising GDP may coexist with rising inequality → welfare not improved.
- Externalities (pollution, education) distort GDP’s link with welfare.
- Human Development Index (HDI), Green GDP, and Sustainable Development Goals (SDGs) are more holistic welfare measures.
- Conclusion: GDP should be used with complementary indicators to measure welfare accurately.
GDP is not the Correct Measure of Growth
GDP measures economic production but ignores welfare, environment, unpaid work, and non-economic aspects of life. Hence, alternate measures like Green GDP and Gross National Happiness (GNH) have been proposed.
Why GDP is Not a Correct Measure of Growth
GDP measures only production and spending, not overall well-being.
Ignores unpaid work like household services, volunteering, and community contributions.
Excludes social factors like family time, equality, cultural integrity, or happiness.
Environmental degradation and loss of biodiversity are not subtracted from GDP, even if they reduce long-term welfare.
Thus, higher GDP may coexist with lower quality of life.
Alternate Measures of Growth
Green GDP
Definition: GDP adjusted for environmental costs.
Captures economic growth while accounting for environmental degradation, climate change, and biodiversity loss.
Also called Environmentally Adjusted Domestic Product.
Example: If forest destruction adds to GDP through timber sales, Green GDP subtracts the cost of deforestation.
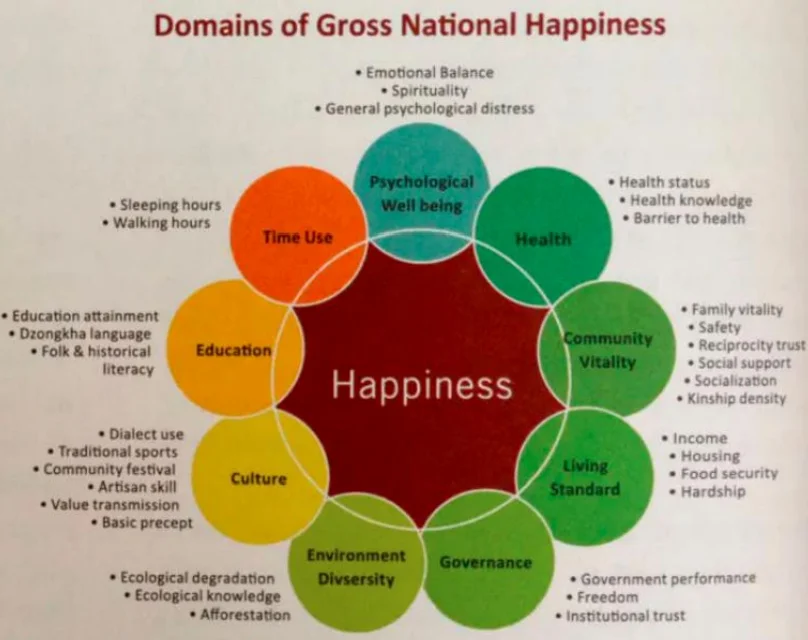
Gross National Happiness Index (GNH)
Origin: Introduced by Bhutan in the 1970s as an alternative to GDP.
Belief: True progress must include non-economic factors like happiness, equity, and sustainability.
Components: A composite index based on 33 indicators across 9 domains: Psychological well-being, Health, Education, Time use, Cultural diversity, Good governance, Community vitality, Ecological resilience, and Living standards.
Example: In health domain, GNH envisions people enjoying 26+ healthy days per month, good self-reported health, and absence of disability-related deprivation.
Significance of GNH
Promotes holistic development beyond economic growth.
Encourages policies for family integrity, gender equity, satisfying jobs, and equality.
Helps businesses measure success not just in profits but also in environmental and social contributions.
Limitations of GNH
Translating happiness into policies is difficult, sometimes producing contradictory results.
Example: During high unemployment, stigma may reduce, making unemployed people report higher happiness.
Possibility of people misreporting happiness to influence policy.
Measuring happiness of groups like sadists or psychopaths is problematic.
| Measure | Definition | Focus | Limitation |
|---|---|---|---|
| GDP | Market value of all goods and services. | Production & income. | Ignores environment, unpaid work, social well-being. |
| Green GDP | GDP adjusted for environmental costs. | Sustainable growth + environment. | Data challenges, valuation of biodiversity difficult. |
| GNH | Index of happiness & well-being (Bhutan model). | Holistic well-being, non-economic factors. | Hard to measure happiness accurately. |
Prelims tips
- Green GDP = GDP – environmental degradation cost.
- Bhutan first introduced Gross National Happiness Index (GNH).
- GNH covers 9 domains and 33 indicators.
- GDP measures output, not well-being.
Mains points
- GDP growth is not equal to welfare growth.
- Green GDP addresses sustainability by factoring in environmental costs.
- GNH offers a holistic framework including health, education, cultural values, and happiness.
- India can learn from Bhutan’s GNH to complement GDP with broader indicators.
- Conclusion: GDP should be supplemented, not replaced, with alternate measures for holistic development.
Human Development Index (HDI)
HDI is a composite index published by UNDP to measure a country's achievements in three dimensions – health, education, and standard of living. It ranks countries on a scale of 0 to 1, where higher values mean higher human development.
Introduction
Human Development Index (HDI) was introduced by UNDP in 1990 through the Human Development Report.
It provides a broader measure of development compared to GDP by including social indicators.
Components of HDI
1. Health: Measured by life expectancy at birth (average years a newborn is expected to live).
2. Education: Measured by two indicators – mean years of schooling (for adults 25+) and expected years of schooling (for children of school-entry age).
3. Standard of Living: Measured by Gross National Income (GNI) per capita adjusted by purchasing power parity (PPP, in US dollars).
Each dimension is given equal weight (1/3).
HDI score ranges between 0 (lowest human development) and 1 (highest human development).
Significance of HDI
Single Index: Provides a single measure combining health, education, and income dimensions.
Progress Tracking: Helps in monitoring socio-economic development of countries over time.
Policy Guidance: Directs focus of policymakers, NGOs, and media from economic growth to human outcomes.
Accountability Tool: Highlights contrasts – two countries with similar GNI can have different human development outcomes, raising policy questions.
Limitations of HDI
Not comprehensive – ignores gender inequality, poverty, environmental sustainability, and inequality.
High GNI may not mean better welfare if spending priorities are skewed (e.g., high military spending instead of health/education).
Limited scope for improvement in developed countries (already high life expectancy/education).
Does not capture happiness, political freedom, or cultural well-being.
| Dimension | Indicator |
|---|---|
| Health | Life expectancy at birth |
| Education | Mean years of schooling + Expected years of schooling |
| Standard of Living | GNI per capita (PPP, USD) |
Prelims tips
- HDI introduced by UNDP in 1990 Human Development Report.
- HDI = Average of three dimensions: Health, Education, Standard of Living.
- Range: 0 (low) to 1 (high).
- India’s HDI rank is published annually in UNDP Human Development Report.
Mains points
- HDI is a more holistic measure of development than GDP alone.
- Highlights importance of education, health, and income for human progress.
- Encourages governments to shift focus from economic output to human outcomes.
- Limitations: Ignores inequality, environmental issues, and happiness.
- India must improve in education and health indicators to raise its HDI ranking.
Thriving Places Index (TPI)
The Thriving Places Index (TPI), created by the Centre for Thriving Places, measures whether local conditions exist for people to live well. It focuses on fairness (equality), sustainability, and well-being, challenging the idea that progress is only about economic growth.
Introduction
GDP measures production and spending, but it ignores fairness, sustainability, and well-being.
Thriving Places Index (TPI) was created as a holistic alternative to evaluate how places support thriving lives.
Developed by the Centre for Thriving Places (UK).
Purpose of TPI
Helps answer three key questions:
1. Are we creating the right local conditions for people to thrive?
2. Are these conditions equitable so everyone can thrive?
3. Are these conditions sustainable for future generations?
Headline Elements of TPI
1. Local Conditions: Measures housing, health, education, safety, and community connections that allow people to live well day-to-day.
2. Equality: Examines whether opportunities and resources are fairly distributed across people and communities.
3. Sustainability: Focuses on environmental balance, carbon emissions, and whether development is future-friendly.
Significance
Moves beyond money: Challenges the economic-only view of progress.
Local focus: Shows differences at regional and community level rather than only at national level.
Policy tool: Helps governments and local bodies design policies for fairness, social justice, and environmental sustainability.
| Element | Focus |
|---|---|
| Local Conditions | Housing, health, education, safety, community connections |
| Equality | Fair distribution of opportunities and resources |
| Sustainability | Environment, carbon emissions, long-term balance |
Prelims tips
- Thriving Places Index (TPI) created by Centre for Thriving Places (UK).
- Focus: Local conditions, equality, sustainability.
- Challenges GDP-only view of progress.
Mains points
- GDP growth does not guarantee fairness or sustainability – TPI fills this gap.
- TPI is a localized and people-focused measure of progress.
- Encourages policies for equity, environmental balance, and thriving communities.
- Challenges conventional economics by prioritizing well-being over monetary indicators.
Effects of Economic Growth
Economic growth means an economy is producing more goods and services than before, usually measured by the increase in Real GDP . Think of it like a bigger pie. 🥧 While a bigger pie is generally good (more for everyone!), how it's made and shared matters. Growth has significant benefits (like higher incomes) but also potential downsides (like pollution or making the rich richer faster than the poor).
Positive Effects of Economic Growth (The Good Side 😊)
1. Increased Standard of Living: When the economy grows, average incomes usually rise. People can afford better food, housing, healthcare, and education. It's like getting a raise – you can buy more things you need and want.
2. Poverty Reduction: A growing economy often creates more jobs. Also, the government collects more taxes, which can be used for programs to help the poor (like food subsidies, MGNREGA, or building schools/hospitals in poor areas).
3. Higher Employment: To produce more goods and services, companies need more workers. So, economic growth usually leads to more job opportunities and lower unemployment.
4. Improved Public Services: More tax money allows the government to spend more on things everyone uses – better roads, reliable electricity, cleaner water, public transport, parks, etc.
5. Technological Advancement: Growth encourages businesses to invest in new machines and technologies to produce things more efficiently. This leads to better products and sometimes entirely new industries (like the IT boom in India).
Negative Effects of Economic Growth (The Potential Problems 😟)
1. Income Inequality: Sometimes, the benefits of growth go mostly to the rich (company owners, shareholders) while wages for workers don't rise as much. This widens the gap between the rich and poor. Think of 'jobless growth' – GDP goes up, but few new jobs are created.
2. Environmental Degradation: Producing more often means using more resources (water, minerals, wood) and creating more pollution (air, water, waste). If growth isn't 'green' or 'sustainable', it can harm the environment for future generations. 🌳➡️🏭
3. Inflation: If everyone suddenly has more money and wants to buy things (high demand), but companies can't produce goods fast enough (supply), prices will go up. This is inflation, and it reduces the purchasing power of money.
4. Social and Lifestyle Costs: A constant focus on high growth might lead people to work excessively long hours, experience more stress, and have less time for family, community, or leisure. The 'quality of life' might not improve even if income does.
| Positive Effects (Pros) | Negative Effects (Cons) |
|---|---|
| Higher incomes, better living standards | Increased income inequality |
| Poverty reduction | Environmental pollution & resource depletion |
| Lower unemployment | Risk of high inflation (overheating) |
| Improved public services (health, education) | Social costs (stress, poor work-life balance) |
Prelims tips
- Economic growth is measured by Real GDP (adjusted for inflation), not just Nominal GDP.
- Sustainable Development is the goal: growth that meets current needs without harming the environment or future generations.
- Growth that doesn't create enough jobs relative to the increase in GDP is called ' Jobless Growth '.
- When an economy grows too fast, causing high inflation, it's called ' overheating '.
Mains points
- Economic growth is necessary for lifting people out of poverty, but it's not enough on its own for overall development (health, education, equality matter too).
- The 'quality' of growth (is it inclusive? is it sustainable?) is more important than the 'quantity' (the GDP number).
- Policymakers often face a difficult choice (trade-off) between boosting growth quickly and protecting the environment or reducing inequality.
- India's experience shows both the power of growth to reduce poverty and the challenges of managing its negative side effects like inequality and environmental stress.
Stock vs Flow, Investment, and GFCF
Think of Stock like a snapshot photo 📸 – it measures something at a specific moment (e.g., your bank balance today). Flow is like a video 🎥 – it measures something over a period of time (e.g., your salary per month). Investment is a key 'flow' that builds up the 'stock' of capital (machines, buildings). Gross Fixed Capital Formation (GFCF) is how we mainly measure this investment flow in an economy.
Concept of Stock and Flow
Stock Variable:
Measured at a specific point in time.
Like asking: How much water is in the bucket right now?
Examples: A country's total debt on March 31st, the number of machines in a factory today, your total savings as of this morning.
Flow Variable:
Measured over a period of time (per hour, day, month, year).
Like asking: How much water is flowing from the tap per minute?
Examples: Your income per month, GDP (total production in a year), Investment (spending on new machines during the year), Depreciation (value lost by machines each year).
Investment
Investment means spending money to create or buy new capital goods. Capital goods are things used to produce other goods/services (factories, machines, computers, software, roads).
Since investment happens over time (e.g., a company invests ₹10 crore this year), it's a flow .
This flow adds to the total amount of capital goods available, which is a stock .
Gross Investment: The total amount spent on new capital goods in a period.
Net Investment: Gross Investment minus Depreciation. Depreciation is the value lost by old capital goods due to wear and tear or becoming outdated. Net investment shows the actual increase in the capital stock.
Example: A taxi company buys 5 new cars (Gross Investment). But 1 old car breaks down and is scrapped (Depreciation). The net addition to their fleet (Net Investment) is 4 cars.
Gross Fixed Capital Formation (GFCF)
GFCF is the main way economists measure investment in fixed assets.
It's part of the GDP calculation using the Expenditure Method (GDP = C + I + G + NX), where 'I' largely represents GFCF.
What GFCF includes:
Spending on new fixed assets like:
Machines, equipment, vehicles used for production.
Buildings (factories, offices, houses).
Infrastructure (roads, bridges, power plants).
Intangible assets like software, R&D.
What GFCF usually EXCLUDES:
'Change in Stocks/Inventories': Goods produced but not yet sold are also a form of investment, but counted separately from GFCF.
Purchase of land: Because land isn't 'produced', buying it just transfers ownership.
Spending on repairs/maintenance (usually considered intermediate consumption).
Why GFCF is Important:
It shows how much an economy is investing in its future productive capacity.
A high GFCF (as a percentage of GDP) generally suggests confidence in the economy and potential for future growth. Think of it as planting seeds 🌱 for future harvest.
| Concept | Stock (at a point in time) | Flow (over a period of time) |
|---|---|---|
| Water | Water in a lake 🌊 | Water in a river 🏞️ |
| Money | Wealth / Savings (on Jan 1st) 💰 | Income / Expenditure (per month) 💸 |
| Capital | Total machines in a factory 🏭 | Investment (new machines bought per year) 🏗️ |
Prelims tips
- Stock = Snapshot at a point in time (Wealth, Capital).
- Flow = Measured over a period (Income, GDP, Investment).
- Investment is the flow that builds the stock of capital.
- GFCF measures investment in fixed assets (machines, buildings, infra), excluding inventories and land.
- Net Investment = Gross Investment – Depreciation (wear & tear).
Mains points
- Understanding stock vs. flow is crucial. For instance, focusing only on GDP (flow) might miss underlying issues with a nation's wealth or capital stock.
- GFCF is a vital indicator of economic health. A sustained increase in GFCF is needed for long-term growth and job creation in India.
- Government policies often aim to boost GFCF, both through public investment (e.g., infrastructure projects) and by creating an environment conducive to private investment.
- A falling GFCF rate can signal economic slowdown and lack of business confidence.
GPI vs GDP: Measuring True Welfare
GDP is like counting all the money spent in a year – including money spent on good things (like education) and bad things (like cleaning up pollution). The Genuine Progress Indicator (GPI) tries to be smarter. It starts with the good spending (consumption) but then subtracts the costs of bad things (pollution, crime, inequality) and adds the value of good things GDP ignores (like volunteering or housework). GPI aims to measure if we are actually better off, not just spending more.
What GDP Measures vs. What GPI Measures
Gross Domestic Product (GDP):
Counts the market value of all final goods and services produced.
Focuses purely on economic activity. More activity = Higher GDP.
Problem: It treats destructive activities (like cutting down a forest for timber) and remedial activities (like hospital bills after a car crash) as positive contributions to the economy, simply because money was spent.
Genuine Progress Indicator (GPI):
Aims to measure sustainable economic welfare.
It asks: Is this economic activity actually making our lives better in the long run?
It uses personal consumption expenditure as a starting point (because what people consume contributes to their well-being) and then makes adjustments.
How GPI Adjusts GDP (The Additions and Subtractions)
Think of GPI = Personal Consumption + Good Things GDP Misses - Bad Things GDP Hides/Counts as Good.
GPI adds (+) value for:
Household & Volunteer Work: GDP ignores the massive value created by unpaid work like cooking, cleaning, childcare, and volunteering in the community.
Public Infrastructure: Services provided by roads, bridges, parks that improve quality of life.
GPI subtracts (-) costs for:
Social Costs: Crime (spending on police, prisons), family breakdown, loss of leisure time due to long commutes or overwork.
Environmental Costs: Air, water, and noise pollution (costs to health, cleanup), depletion of natural resources (running down forests, fisheries, fossil fuels), climate change impacts.
Defensive Expenditures: Money spent just to fix problems caused by growth (e.g., medical bills due to pollution, commuting costs). GDP counts these as gains, GPI sees them as costs.
Income Inequality: GPI assumes that an extra ₹1000 gives more benefit to a poor person than a rich person. So, if inequality increases, GPI adjusts downwards.
The GDP-GPI Divergence: A Wake-Up Call? 🤔
Often, studies show that while GDP per capita has been rising steadily in many countries for decades, GPI per capita has stagnated or even fallen since the 1970s or 80s.
What this suggests: We might be engaging in 'uneconomic growth' – where the environmental and social costs of producing more are outweighing the benefits of consuming more. We are spending more, but not necessarily getting happier or healthier, and damaging the planet in the process.
| Feature | Gross Domestic Product (GDP) | Genuine Progress Indicator (GPI) |
|---|---|---|
| Focus | Economic Activity/Output 📈 | Economic Welfare/Well-being 😊 |
| Cleaning Pollution | Adds to GDP (+) | Subtracts cost (-) |
| Household Work | Ignored (0) | Adds value (+) |
| Inequality | Ignored (0) | Reduces GPI (-) |
| Resource Depletion | Ignored (0) or Positive (+, if extraction is high) | Subtracts cost (-) |
Prelims tips
- GDP measures economic size, GPI measures economic well-being.
- GPI adjusts GDP for social (crime, inequality, unpaid work) and environmental (pollution, resource depletion) factors.
- The trend where GDP rises but GPI stagnates/falls suggests uneconomic growth .
- GPI is one of several alternative indicators trying to provide a better picture than GDP alone (others include HDI, Green GDP, Gross National Happiness).
Mains points
- GPI directly addresses many 'Limitations of National Income Accounting' by incorporating social and environmental costs/benefits.
- The GDP-GPI divergence highlights the potential conflict between pursuing pure economic growth and achieving sustainable development goals (SDGs) related to environment, equality, and well-being.
- While calculating GPI involves more estimations and data challenges than GDP, it provides a more comprehensive framework for policymakers aiming for genuine societal progress rather than just higher output numbers.
Recent Economic Trends in India
Recently, India's economy has bounced back strongly after the pandemic, becoming one of the world's fastest-growing major economies 🚀. Think of it like a strong engine pulling a train. However, this engine faces some hurdles: rising prices ( inflation ) making things expensive, the government needing to manage its borrowing ( fiscal deficit ), and ensuring the benefits of growth reach everyone, especially through job creation ( inclusive growth ).
(Note: Specific numbers change fast! This gives a general idea of recent talking points for UPSC.)
1. Growth Recovery (The 'V-Shape' Bounce Back)
After the big dip during COVID-19 lockdowns, India's GDP growth shot back up quickly. This is often called a 'V-shaped recovery'. 📉📈
What powered it? Initially, government spending on big projects like roads and bridges ( Capital Expenditure or CapEx ) gave a push. Later, people started spending more again ( private consumption ), and service industries (like IT, tourism, finance) performed well.
2. Inflation (Rising Prices) 🔥
The Problem: Prices, especially for food items, have been rising faster than desired, often going above the RBI's comfort zone (which aims for 4%, with a tolerance up to 6%).
Why? Global issues like the war in Ukraine pushed up fuel and food prices worldwide. Sometimes, unpredictable weather (like poor monsoons) affects food prices within India.
What's being done? The RBI has been increasing its key interest rate (the repo rate ) to make borrowing more expensive, hoping this will cool down spending and control prices.
3. Government Finances (Balancing the Budget)
Fiscal Deficit: This is the gap between the government's total spending and its total income (mostly taxes). During COVID, spending on relief measures increased while tax collections fell, making the deficit very large.
Current Focus: The government is now trying to reduce this gap gradually (' Fiscal Consolidation '). Good news is that tax collections (like GST and income tax) have been strong recently, helping this effort.
4. Trade and Forex (Dealing with the World)
Current Account Deficit (CAD): India usually buys more goods from other countries (imports) than it sells to them (exports). This gap is the CAD.
How it's managed: The gap is usually covered by money coming into India as investments (Foreign Direct Investment - FDI, Foreign Portfolio Investment - FPI) or money sent home by Indians working abroad ( remittances ).
Strengths: India's service exports (especially IT) are doing very well. Remittances are also high. India also keeps a large emergency fund of foreign currency ( Forex Reserves ) to handle any sudden problems.
5. Sector Performance (Which parts are growing?)
Services: Still the biggest part of the economy and the main growth engine.
Manufacturing: The government wants more things to be made in India ('Make in India'). Schemes like Production-Linked Incentives (PLI) are trying to encourage companies to set up factories here.
Agriculture: Grew steadily even during the pandemic, providing food security and supporting many livelihoods, though its growth rate is usually lower than services or industry.
Prelims tips
- A ' V-shaped ' recovery is characterized by a sharp fall followed by a quick rebound.
- Fiscal Consolidation means the government is trying to reduce its borrowing (fiscal deficit).
- CAD (Current Account Deficit) = Imports > Exports. It's financed by Capital Account inflows (like FDI).
- PLI schemes are government incentives to boost domestic manufacturing in specific sectors.
- Remittances are a major source of foreign exchange for India.
Mains points
- India's recent growth is commendable, but the challenge lies in sustaining it while managing inflation and ensuring the benefits reach the masses ( inclusive growth ).
- The global economic situation (slowdown, geopolitical risks) poses external challenges to India's growth.
- There's often debate about a ' K-shaped recovery ' – meaning different sectors or income groups are recovering at vastly different paces (e.g., formal sector doing well, informal sector struggling).
- Creating enough quality jobs for India's young population remains a central long-term challenge linked to economic trends.
Sectoral Composition of Economy
Imagine dividing all the jobs and economic activities in a country into three big buckets: Primary (getting raw stuff from nature 🌳⛏️), Secondary (making things with that stuff 🏭), and Tertiary (providing services 🧑🔧🧑🏫). The sectoral composition tells us how much each bucket contributes to the country's total income (GDP) and how many people work in each. In India, the Services bucket makes the most money, but the Agriculture bucket still has the most workers.
The Three Sectors (The Buckets 🪣)
1. Primary Sector (Agriculture & Allied Activities):
Think farming, fishing, mining, forestry. It's about taking things directly from nature.
This sector provides the raw materials for other sectors.
India Status: Contributes the smallest share to GDP (around 15-18%) but employs the largest share of the workforce (over 40%). This mismatch is a key feature of the Indian economy.
2. Secondary Sector (Industry):
Think factories making cars, clothes, steel; construction companies building houses and roads; electricity generation.
This sector transforms raw materials into finished or semi-finished goods.
India Status: Contributes a middle share to GDP (around 25-30%) and employs a middle share of the workforce. Its share hasn't grown as much as hoped.
3. Tertiary Sector (Services):
Think doctors, teachers, shopkeepers, IT professionals, bankers, drivers, government employees.
This sector provides services rather than physical goods.
India Status: Contributes the largest share to GDP (over 50%) and is the fastest-growing sector. It employs a significant, growing portion of the workforce, but often requires higher skills than agriculture.
India's Unique Structural Shift 🚶♂️➡️🚀
Most countries develop by shifting workers gradually: Agriculture → Industry → Services .
India has seen a faster shift directly from Agriculture → Services , without a large-scale industrial boom that created lots of factory jobs.
Why is this a challenge?
Many people leaving low-productivity agriculture lack the skills needed for high-productivity service jobs (like IT or finance).
The manufacturing (Secondary) sector hasn't grown enough to absorb these workers into well-paying factory jobs.
This leads to people getting stuck in low-paying service jobs (like retail) or remaining underemployed in agriculture ('disguised unemployment').
| Sector (Bucket) | Contribution to GDP (Income Share) | Share in Employment (Workers Share) |
|---|---|---|
| Primary (Nature-based) 🌳 | Smallest (~18%) | Largest (~44%) |
| Secondary (Manufacturing/Industry) 🏭 | Medium (~28%) | Medium (~25%) |
| Tertiary (Services) 🧑💻 | Largest (~54%) | Medium (~31%) |
Prelims tips
- Primary = Raw materials from nature (Agri, Mining).
- Secondary = Making things (Manufacturing, Construction).
- Tertiary = Providing services (IT, Banking, Transport, Education).
- India's GDP ranking: Services > Industry > Agriculture .
- India's Employment ranking: Agriculture > Services > Industry .
- India skipped the traditional 'Industry first' phase, leading to a structural mismatch.
Mains points
- The changing sectoral composition reflects India's economic transformation, but also highlights major challenges.
- The large share of the workforce still dependent on agriculture (despite its low GDP contribution) points to low productivity and disguised unemployment in the farm sector.
- Boosting the manufacturing sector ('Make in India', PLI) is crucial to create formal jobs for the workforce moving out of agriculture and to achieve more balanced growth.
- While the services sector drives growth, ensuring its benefits are widely shared and that it creates jobs for various skill levels is important.
Sources of Economic Growth
Where does economic growth (a bigger Real GDP pie 🥧) come from? Think of baking that bigger pie. You need more ingredients ( Inputs like workers and machines), or a better recipe/oven ( Productivity/Technology ) to bake more with the same ingredients. For UPSC, the key 'sources' are adding more/better machines ( Capital ), improving worker skills/health ( Human Capital ), and finding smarter ways to produce ( Technology ).
1. Capital Formation (More/Better Tools & Infrastructure) 🏗️
This means increasing the amount of physical capital – the man-made things used in production.
Examples: Building new factories, buying more computers and machinery, constructing better roads, ports, power grids.
How it boosts growth: A worker with a tractor can farm much more land than one with just a hand plow. Good roads help transport goods faster and cheaper. More capital generally leads to more output per worker.
Measured by: Gross Fixed Capital Formation (GFCF).
2. Human Capital Formation (Skilled & Healthy People) 🧑🎓👩⚕️
This isn't just about having more workers, but about having better workers.
Examples: Providing good education, vocational training (like ITI courses), healthcare facilities, ensuring good nutrition.
How it boosts growth: Educated and skilled workers are more productive, can use advanced technology, and come up with new ideas (innovation). Healthy workers are more energetic and take fewer sick days.
Measured by: Literacy rates, years of schooling, life expectancy, government spending on health/education.
3. Technological Progress (Smarter Ways to Do Things) 💡
This is about increasing productivity – getting more output from the same inputs (workers and machines). It's often considered the most important source for long-term, sustainable growth.
Examples: Inventing a new, faster machine; developing a more efficient farming technique (like high-yield seeds); using software to manage inventory better; improving factory layout (like assembly lines).
How it boosts growth: Technology allows us to overcome limitations, reduce waste, lower costs, and create entirely new products and services.
Measured by: Often approximated by 'Total Factor Productivity' (TFP) – the part of growth that can't be explained just by adding more capital or labor.
Other Supporting Factors
Natural Resources: Having resources like oil or fertile land can help, but aren't strictly necessary if a country uses technology and trade wisely (e.g., Japan lacks resources but is highly developed).
Good Institutions & Governance: A stable government, fair laws, protection of property, control of corruption create a safe environment for businesses to invest and innovate.
| Source | What it Increases | How (Examples) |
|---|---|---|
| Physical Capital | Quantity/Quality of Tools & Infra | More factories, better roads (GFCF) |
| Human Capital | Worker Skills & Health | Education, healthcare, training |
| Technology/Productivity | Efficiency (Output per Input) | Innovation, R&D, better management (TFP) |
Prelims tips
- Growth = More Inputs ( Capital, Labor ) + Better Use of Inputs ( Productivity/Technology/TFP ).
- GFCF reflects investment in Physical Capital .
- Education & Health build Human Capital .
- TFP (Total Factor Productivity) is the 'secret sauce' – gains in efficiency beyond just adding more inputs.
Mains points
- Historically, early growth often comes from adding capital and labor (like building factories and moving people from farms).
- However, sustained long-term growth in developed economies (and for India going forward) depends heavily on increasing productivity (TFP) through innovation and technology.
- India needs to focus on all three: boosting investment (physical capital), leveraging its young population through skills and health (human capital), and fostering an environment for innovation (technology).
- Government policies often target these sources – e.g., infrastructure spending (capital), NEP/Skill India (human capital), R&D incentives (technology).
Advance Estimates (National Income)
Advance Estimates (AE) are like the first weather forecast 🌦️ for the economy's performance in the current financial year. Released by the NSO before the year ends, they give the government an early picture of GDP growth, which is crucial for planning the next Union Budget 💰. They're based on data from the initial months and are later revised as more complete data comes in.
What are Advance Estimates?
Imagine the financial year runs from April 1st to March 31st. The NSO needs to estimate how the economy performed for the entire year even before March 31st arrives.
These early estimates are called Advance Estimates.
First Advance Estimates (FAE):
Released around January 7th .
Super important because the Finance Ministry uses these numbers to figure out expected tax revenues and plan spending for the Union Budget presented on Feb 1st.
Based on data available for about the first 7-8 months (April to Oct/Nov).
Second Advance Estimates (SAE):
Released around the end of February .
An updated version of FAE, using slightly more data (maybe up to 9-10 months).
Why Release Estimates Early?
Making the budget is like planning a household budget for next year. You need an idea of your income this year to plan realistically. The government needs the AE to estimate its 'income' (tax revenue) and plan its 'spending' for the upcoming year.
Waiting for final, confirmed data for the whole year would mean the budget gets delayed significantly.
AE allows for timely planning and policy adjustments by the government and RBI.
How are they Calculated? (Simplified)
The NSO doesn't have full data for all 12 months when making AE.
So, they use a clever method: ' Benchmark-Indicator Method '.
They look at data that comes out quickly (high-frequency indicators) for the first 7-8 months, like:
Factory output numbers (Index of Industrial Production - IIP).
Sales and profit data from big companies.
GST and Income Tax collections.
Performance of sectors like agriculture (crop estimates), railways (freight), airlines (passengers).
They see the trend in these indicators and use statistical models to project (estimate) what the performance for the full year will likely be for the entire economy.
Accuracy and Revisions
Since AE are based on incomplete data and projections, they are bound to change.
The NSO revises the estimates multiple times as more solid data flows in over the next 1-3 years.
The typical sequence is:
AE (Jan/Feb) ➡️ Provisional Estimates (May) ➡️ Revised Estimates (multiple rounds over next few years) ➡️ Final Numbers.
Think of it like refining a blurry photo 🖼️ – each revision makes the picture clearer.
Prelims tips
- Advance Estimates (AE) are the first official GDP estimates for the current financial year.
- Released by the NSO .
- FAE (First AE in Jan) is used for the Union Budget .
- They are released before the financial year ends.
- Calculated using the ' Benchmark-Indicator Method ' based on early data.
- Subject to multiple revisions later.
Mains points
- Advance Estimates play a critical role in fiscal planning and macroeconomic management by providing timely data, even if preliminary.
- Their importance lies in enabling proactive policy responses rather than reactive ones based on finalized data that arrives much later.
- Understanding the methodology (benchmark-indicator) and the revision process helps appreciate the nature and limitations of these crucial early economic signals.
The Base Effect
The Base Effect is like judging a student's improvement based only on percentage marks. If they scored 10/100 last year (very low base) and get 20/100 this year, that's a 100% improvement! 🎉 Sounds amazing, but they still failed. If they scored 90/100 last year (high base) and get 95/100 this year, that's only a ~5.5% improvement, but it's a much better performance. The base effect distorts growth rates (like GDP or inflation) simply because the starting point (the 'base' year/period) was unusually low or high.
Understanding the Math (Simple Example)
Growth Rate % = [(Current Value - Previous Value) / Previous Value] 100
The 'Previous Value' is the 'Base'.
Scenario 1: Low Base Effect (Inflated Growth %)
This happens when the 'Previous Value' was abnormally low.
Example (GDP Growth after COVID):
- GDP in 2020-21 (Lockdown Year - Low Base): Let's say ₹100 trillion.
- GDP in 2021-22 (Recovery Year): Let's say ₹110 trillion.
- Growth Rate = [(110 - 100) / 100] 100 = 10% Growth .
Looks High! But... what if a 'normal' year's GDP was ₹105 trillion before the pandemic? The 10% growth is mostly just recovering the lost ground from the terrible base year.
Scenario 2: High Base Effect (Depressed Growth %)
This happens when the 'Previous Value' was abnormally high.
Example (Inflation after a price surge):
- Inflation in 2022 (High Base due to oil shock): Let's say 8%.
- Inflation in 2023 (Prices still high, but rising slower): Let's say 5%.
- The change in inflation is negative, or the level is lower. Now compare 2024 to this.
- Inflation in 2024: Let's say 4.5%.
- Comparing 2024 to 2023 base (5%): The drop looks small.
Looks Low! But... prices might still be painfully high for consumers, even if the rate of increase has slowed down compared to the very high base year.
Why Base Effect Matters for UPSC
Critical Analysis: Don't take headline growth percentages at face value. Always consider the context of the base period.
Economic Policy: Understanding base effects helps distinguish between genuine economic momentum and statistical quirks. A high growth rate due to a low base doesn't necessarily mean the economy is booming.
Inflation Interpretation: A fall in inflation rate due to a high base doesn't always mean prices are falling – they might just be rising slower than before.
Common Trap: Be wary when comparing growth rates immediately following a crisis year (like a pandemic or major recession) – the base effect will likely be significant.
Prelims tips
- Base Effect: Statistical effect where the base value for comparison is abnormally low or high.
- Low Base → Appears High % Growth (like post-COVID GDP).
- High Base → Appears Low % Growth (like inflation cooling after a spike).
- Always question large percentage changes – could it be the base effect?
- Relevant for GDP growth, inflation (CPI/WPI), Index of Industrial Production (IIP), export growth, etc.
Mains points
- Understanding the base effect is crucial for objective analysis of economic performance, especially during volatile periods.
- It helps policymakers avoid complacency during high-growth periods driven by a low base, or unnecessary panic during low-growth periods caused by a high base.
- Analysts often look at sequential (quarter-on-quarter or month-on-month) growth, adjusted for seasonality, to get a better sense of underlying economic momentum, stripping out the base effect from year-on-year comparisons.