
Indian Economy · UPSC Notes
Poverty, Hunger and Inequality — UPSC Economy Notes
Free, exam-focused notes for UPSC Prelims and Mains, with Prelims tips and Mains points for every topic. 26 topics.
Open in the interactive reader: bookmarks, progress tracking and read-aloud.
Poverty – Concept, Dimensions and Facts
Poverty means a condition where a person or family does not have enough resources to meet basic needs like food, clothing, shelter, healthcare, and education. It is not just about lack of money, but also about lack of opportunities, security, and dignity. Eradicating poverty is a global human right and one of the Sustainable Development Goals (SDGs).
Introduction
Poverty is not just about low income but about deprivation of choices and opportunities to live a decent life.
According to the Human Development Report (1997), poverty is the denial of choices and opportunities to enjoy a basic standard of living.
Eliminating poverty is both a moral responsibility and a human right.
What is Poverty?
A social condition where a section of society cannot meet its survival needs.
UN Human Rights Council: Poverty = persistent deprivation of resources, choices, security, and power needed for adequate living and rights.
Poverty is multidimensional – includes lack of education, healthcare, and social inclusion, not just income.
Global Standard
The UN aims to end extreme poverty everywhere by 2030 (SDG Goal 1).
World Bank defines extreme poverty as living on less than 2.15 per day (International Poverty Line).
Multidimensional Poverty in India
NITI Aayog Report (2023): Poverty in India reduced from 29.17% (2013-14) to 11.28% (2022-23).
Nearly 24.82 crore people moved out of poverty in 9 years.
Largest improvements seen in Uttar Pradesh, Bihar, and Madhya Pradesh.
Global Poverty Facts
At 2.15/day line, 8.5% of the world’s population (659 million people) still live in poverty.
Poverty reduction is uneven across regions – South Asia and Sub-Saharan Africa remain most affected.
| Aspect | Details |
|---|---|
| Definition | Lack of resources to meet basic needs and dignity of life |
| UN Definition | Persistent deprivation of resources, opportunities, and rights |
| Global Standard | Extreme poverty = <2.15 per day (World Bank) |
| India’s Progress | 29.17% poor in 2013-14 → 11.28% poor in 2022-23 |
| Global Situation | 659 million poor (8.5% of world population) |
Prelims tips
- Extreme poverty = living under 2.15/day (World Bank IPL).
- SDG Goal 1 = End poverty in all forms everywhere by 2030.
- India: 24.82 crore people came out of multidimensional poverty (2013–2023).
- States with maximum poverty reduction: UP, Bihar, MP.
Mains points
- Poverty is multidimensional – not just income but access to education, health, and dignity.
- India has made significant progress in reducing poverty (NITI Aayog data).
- Global poverty is still concentrated in South Asia and Africa.
- Poverty eradication is linked to achieving SDGs, especially Goal 1 (No Poverty).
- Addressing poverty requires inclusive growth, social security, and human development investments.
Poverty – Reports, Surveys and Approaches
Different reports and surveys (NITI Aayog, Oxfam, World Bank, UN, Pew Research, etc.) give important insights into the status of poverty in India and the world. Poverty is not just about money but has multiple dimensions like capability, social inclusion, and participation.
Key Reports and Surveys on Poverty
National Multidimensional Poverty Index (NITI Aayog, 2023): Poverty reduced from 29.17% in 2013-14 to 11.28% in 2022-23; 24.82 crore people moved out of poverty. Biggest reductions: Uttar Pradesh (5.94 crore), Bihar (3.77 crore).
Oxfam Report (2023): Top 10% of Indians own 77% of the total national wealth, highlighting inequality.
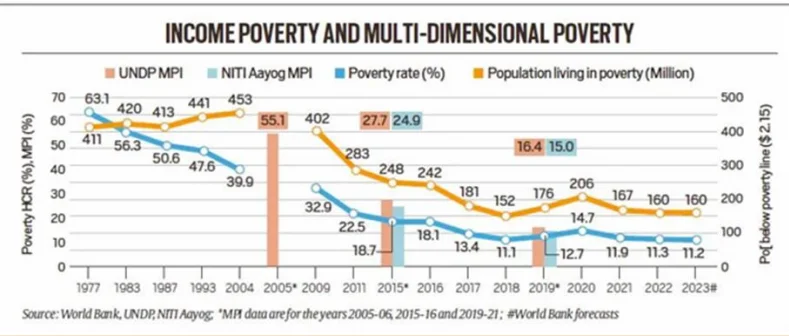
Global Multidimensional Poverty Index (2005–2021): India moved 415 million people out of poverty. Poverty incidence dropped from 55.1% to 16.4%.
World Bank (2023): Using 2.15/day line, poverty in India = 11.9%. Pandemic & recession pushed 1.4% of global population into extreme poverty.
Pew Research Report: During pandemic, India’s poor doubled from 60 million to 134 million in one year.
Household Consumption Expenditure Survey (2022-23): Rural poverty fell from 25.7% (2011-12) to 7.2% (2022-23). Urban poverty fell from 13.7% to 4.6% in same period.
Approaches to Understanding Poverty
Monetary Approach: Poverty = lack of money. Solution: increase income and employment opportunities.
Capability Approach (Amartya Sen): Poverty = lack of capabilities like education, health, nutrition. Solution: strengthen public goods and services.
Social Exclusion Approach: Poverty = exclusion from participating in society’s economic, cultural, and social life. Solution: inclusion and access to opportunities.
Participatory Approach: Poverty is understood from the perspective of the poor themselves. Solutions are tailored to local needs.
| Report/Survey | Key Findings |
|---|---|
| NITI Aayog MPI (2023) | Poverty fell to 11.28% (2022-23), 24.82 crore people lifted out |
| Oxfam Report (2023) | Top 10% hold 77% of wealth |
| Global MPI (2005-2021) | 415 million people out of poverty; incidence fell to 16.4% |
| World Bank (2023) | India poverty = 11.9% at 2.15/day line |
| Pew Research (Pandemic) | Poor doubled: 60m → 134m |
| Consumption Expenditure Survey (2022-23) | Rural poverty = 7.2%, Urban poverty = 4.6% |
| Approach | Explanation |
|---|---|
| Monetary Approach | Defines poverty as lack of money; solution = increase income/jobs |
| Capability Approach | Focus on deprivation of education, health, nutrition; solution = strengthen public goods |
| Social Exclusion Approach | Exclusion from social/economic participation; solution = inclusion & opportunities |
| Participatory Approach | Understanding poverty from perspective of the poor; solution = local, tailored interventions |
Prelims tips
- NITI Aayog MPI (2023): Poverty reduced to 11.28%, 24.82 crore people out.
- Oxfam Report: Top 10% own 77% of wealth.
- World Bank: India poverty = 11.9% at 2.15/day.
- Pew Research: Pandemic doubled poor in India.
- Approaches: Monetary, Capability (Amartya Sen), Social Exclusion, Participatory.
Mains points
- Reports show India has made significant progress in reducing poverty but inequality remains high.
- Multidimensional approach highlights education, healthcare, and social inclusion as crucial for poverty eradication.
- Pandemic highlighted vulnerability of poor populations, reversing gains.
- Oxfam report highlights wealth inequality, showing poverty is linked with unequal distribution of resources.
- Combining different approaches (monetary + capability + inclusion) is essential for effective poverty alleviation.
Types of Poverty and Categorisation of the Poor
Poverty can be understood in different forms such as absolute, relative, environmental, and collective poverty. Beyond income, it includes lack of capabilities, resources, and access to essentials. Poverty is also classified into groups like chronic poor, churning poor, and occasionally poor, based on duration and intensity.
Types of Poverty
Absolute Poverty: When people cannot meet basic needs like food, shelter, clothing. Defined by UN as severe deprivation of essentials such as food, water, sanitation, health, education. World Bank sets absolute poverty line at 2.15/day (PPP, 2017).
Relative Poverty: Poverty measured in comparison with society’s standard of living. A person may not be poor in one country but poor in another due to different living standards.
Environmental Poverty: Lack of access to environmental resources like clean water, fertile land, clean air, and healthy ecosystems. Example: Rajasthan’s Barmer district, where families fetch contaminated water from far distances.
Collective Poverty: When entire groups or communities remain poor due to systemic or historical factors. Example: Gond and Santhal tribes facing poverty due to social exclusion.
Human Poverty: Lack of basic human capabilities like literacy, nutrition, and healthcare.
Income Poverty: Lack of sufficient income to meet minimum consumption needs.
Extreme Poverty: Defined by World Bank as living on less than 1.90 per day.
Categorisation of Poor
Chronic Poor: People who are persistently poor (e.g., casual laborers).
Churning Poor: People who frequently move in and out of poverty (e.g., small farmers, seasonal workers).
Occasionally Poor: People who are usually well-off but sometimes fall into poverty (e.g., during illness, crop failure, or job loss).
Transient Poor: the churning poor and the occasionally poor together – people who move in and out of poverty, as opposed to the chronic poor.
| Aspect | Absolute Poverty | Relative Poverty |
|---|---|---|
| Definition | Lack of fixed basic necessities for survival | Income/resource inadequacy compared to societal standards |
| Measurement | Specific income threshold (e.g., 2.15/day, World Bank) | Comparative to average/median income in society |
| Focus | Survival and basic needs (food, shelter, clothing) | Disparities and inequality within society |
| Policy Implications | Provide basic services like food, shelter, health | Reduce inequality, improve overall living conditions |
| Long-term Trends | Stable unless poverty line is redefined | Changes with growth, policies, and income distribution |
Prelims tips
- Absolute poverty line (World Bank): 2.15/day (2017 PPP).
- Extreme poverty (World Bank): 1.90/day.
- Relative poverty is context-based – differs across countries.
- Environmental and collective poverty highlight resource and community-level deprivation.
- Types of poor: chronic, churning, occasionally poor.
Mains points
- Poverty is multidimensional – absolute, relative, environmental, and collective forms highlight different aspects.
- Absolute poverty focuses on survival, relative poverty on inequality.
- Environmental poverty shows link between environment and poverty (water, air, land).
- Collective poverty highlights systemic and historical exclusion.
- Categorisation of poor (chronic, churning, occasional) helps in policy targeting and designing welfare schemes.
Measuring Poverty
Poverty is measured using a 'Poverty Line', which separates poor from non-poor based on minimum income or consumption required to meet basic needs. It includes different levels of poverty and wealth, and uses indicators like Head Count Ratio, Poverty Gap, and Misery Index.
What is Poverty Line?
The poverty line is a monetary threshold (income/consumption limit) below which a person is considered poor.
It separates poor and non-poor, but within these categories there are subgroups (absolutely poor, very poor, poor; middle class, rich, very rich, absolutely rich).
It is not fixed and changes with inflation, needs, and living standards.
In India, the National Sample Survey Organization (NSSO) collects data to estimate poverty levels.
Earlier poverty lines were based on minimum calorie intake required for survival.
Minimum calorie requirement: 2,400 calories/day in rural areas and 2,100 calories/day in urban areas.
In 2011-12, the poverty line was fixed at Rs 816 per person/month in rural areas and Rs 1,000 per person/month in urban areas.
Government uses Monthly Per Capita Expenditure (MPCE) as a proxy for income to identify the poor.
Challenges in Estimation
Determining exact cost of basic needs (food, shelter, clothing) is difficult because of regional differences, inflation, and changing lifestyles.
Calorie intake alone is not enough – now nutritional quality and health standards are also considered.
Formula for Head Count Ratio (HCR)
HCR = (Number of people below poverty line ÷ Total population) × 100
Poverty Gap Index: the average shortfall of the poor's income from the poverty line (as a share of the line) – shows the depth of poverty, unlike the head-count ratio.
Squared Poverty Gap: squares each shortfall so the poorest get more weight – shows the severity of poverty and inequality among the poor.
| Indicator | Explanation / Formula |
|---|---|
| Head Count Ratio (HCR) | Percentage of population below poverty line. Formula: (Number of poor ÷ Total population) × 100 |
| Poverty Gap (PG) | Measures intensity of poverty – how far the poor are from the poverty line (depth of poverty). |
| Misery Index | Introduced by Robert Barro; sum of inflation rate + unemployment rate, showing overall economic misery. |
Prelims tips
- India’s poverty line earlier based on calorie intake (2400 rural, 2100 urban).
- 2011-12 poverty line: Rs 816/month (rural), Rs 1000/month (urban).
- HCR = (Number of poor ÷ Total population) × 100.
- HCR shows % of poor, PG shows depth of poverty.
- Misery Index = Inflation + Unemployment.
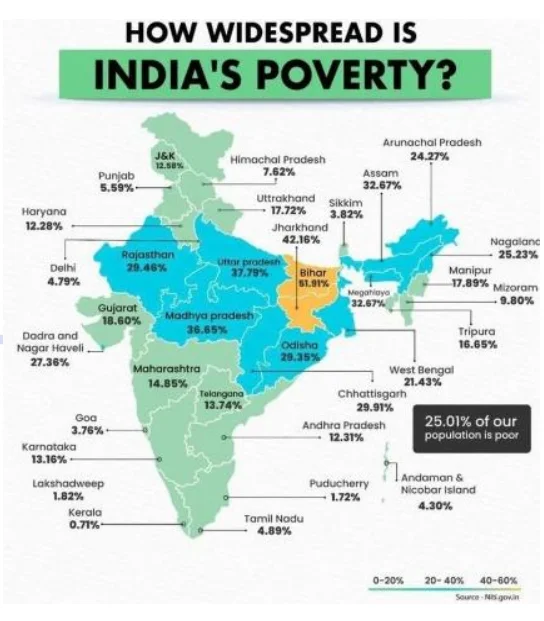
- NITI Aayog’s Multidimensional Poverty Index (2021): HCR 25.01%.
Mains points
- Poverty line is dynamic, not static – influenced by inflation, cost of living, and social standards.
- Earlier calorie-based method replaced by broader nutritional and health standards.
- HCR tells us about prevalence of poverty, while PG tells us about intensity.
- India has reduced poverty rates significantly, but still has world’s largest number of poor (160 million in 2023).
- Misery Index highlights macroeconomic distress – useful for analyzing unemployment + inflation impacts together.
Poverty Estimation in India
The process of poverty estimation in India is about finding out how many people are poor and where the poverty line should be fixed. Over the years, different experts and committees have suggested different ways to define the poverty line – some focused on minimum calories required to survive, while later committees focused on total household spending on food, health, and education. Today, poverty estimation uses consumption expenditure surveys and multidimensional poverty indicators.
Pre-Independence
Dadabhai Naoroji (1867–68)
He is called the 'Grand Old Man of India'. In his book 'Poverty and Un-British Rule in India', he gave the first estimate of poverty line.
He calculated that a person needed between ₹16 to ₹35 per year (at 1867–68 prices) to survive at a basic level.
This was the earliest attempt to put a number to poverty in India.
Bombay Plan (1944)
Prepared by leading Indian industrialists before independence.
Suggested that ₹75 per person per year should be considered the minimum income required to avoid poverty.
Post-Independence
VM Dandekar and N Rath Committee (1971)
This was the first scientific attempt to measure poverty using data from the National Sample Survey (NSS).
They said that poverty should be defined not just by money but by how much food (calories) a person can afford.
They fixed the standard at 2250 calories per person per day for both rural and urban areas.
This was a shift from earlier 'minimum needs' approach to a 'calorie intake' approach.
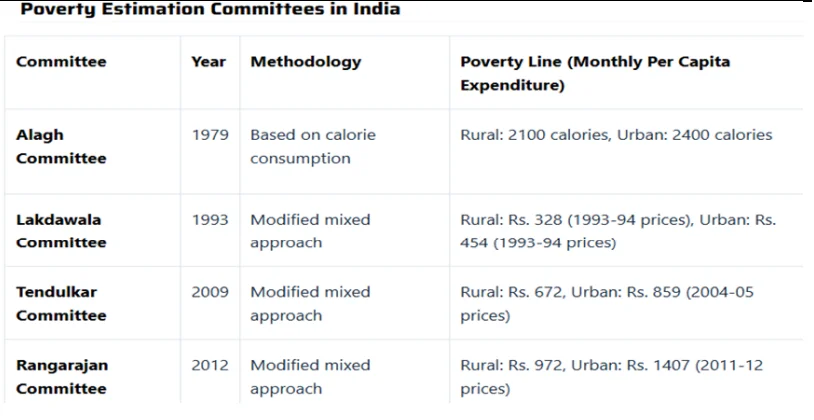
Alagh Committee (1979)
A task force set up by the Planning Commission under Y.K. Alagh.
Defined poverty line based on how much food a person eats (nutritional requirements) and the money spent on it.
Calorie norms fixed: 2400 calories/day for rural areas (because more physical work is done) and 2100 calories/day for urban areas.
These poverty lines were updated over time with inflation and changing prices.
Lakdawala Committee (1993)
Expert group chaired by Prof. D.T. Lakdawala.
Recommended continuing calorie-based method but linked it to actual spending patterns of poor households.
Introduced state-specific poverty lines (because costs vary across states).
Recommended updating poverty lines using Consumer Price Index for Agricultural Labourers (CPI-AL) in rural areas and Consumer Price Index for Industrial Workers (CPI-IW) in urban areas.
Tendulkar Committee (2009)
Formed to fix problems in earlier methods.
Problems included: using old 1973–74 baskets despite changes in lifestyle, poor adjustment of prices, and ignoring private spending on health and education.
Key recommendations:
Move away from calorie-based poverty measurement.
Use the same poverty line basket (PLB) for rural and urban India.
Include household spending on health and education.
Improve price adjustment methods (to reflect regional and time differences).
C Rangarajan Committee (2012)
Formed after criticism of the Tendulkar Committee, because people felt its poverty line was set too low.
Recommended higher poverty lines:
Daily per person expenditure: ₹32 (rural), ₹47 (urban).
Monthly per capita expenditure: ₹972 (rural), ₹1407 (urban).
This raised the official poverty line to a more realistic level compared to Tendulkar’s estimates.
Present System
All three major committees (Lakdawala, Tendulkar, Rangarajan) used per capita consumption expenditure as the main basis for measuring poverty.
NITI Aayog (earlier Planning Commission) uses NSSO data, which conducts large surveys on household consumption expenditure every 5 years.
The Ministry of Rural Development conducts Below Poverty Line (BPL) census to identify poor households for government welfare schemes.
| Committee / Person | Year | Basis of Poverty Line |
|---|---|---|
| Dadabhai Naoroji | 1867–68 | ₹16–₹35 per year per capita; basic survival estimate. |
| Bombay Plan | 1944 | ₹75 per year per capita. |
| Dandekar & Rath | 1971 | 2250 calories/day for both rural and urban areas. |
| Alagh Committee | 1979 | Calorie norms: 2400 rural, 2100 urban; consumption expenditure adjusted with inflation. |
| Lakdawala Committee | 1993 | State-specific poverty lines using CPI-AL (rural) and CPI-IW (urban). |
| Tendulkar Committee | 2009 | Shift away from calories; uniform PLB; included health and education expenses. |
| Rangarajan Committee | 2012 | Higher poverty line: ₹972 rural, ₹1407 urban (monthly). |
Prelims tips
- Dadabhai Naoroji: first poverty estimate in India (₹16–₹35 per year).
- Dandekar & Rath (1971): calorie-based poverty line (2250 calories/day).
- Alagh Committee (1979): fixed calorie norms – 2400 rural, 2100 urban.
- Lakdawala Committee (1993): state-specific poverty lines using CPI-AL & CPI-IW.
- Tendulkar Committee (2009): moved away from calorie-based method; included health & education expenses.
- Rangarajan Committee (2012): raised poverty line to ₹972 rural, ₹1407 urban per month.
Mains points
- Poverty estimation in India evolved from income-based to calorie-based, and finally to broader expenditure-based approaches.
- Committees reflect changing times, from basic survival needs to modern living standards.
- Earlier methods focused only on food and calories, but later included health and education costs.
- Criticism: Indian poverty lines often considered too low compared to real cost of living.
- Current focus is not only on money spent but also on multidimensional poverty – education, health, housing, sanitation.
Challenges in Measuring Poverty
Measuring poverty is complex because poverty is not only about income but also about lack of opportunities, insecurity, and poor living conditions. Different types of poverty, hidden emotional aspects, resource-heavy surveys, and political influence make accurate measurement difficult.
Many Faces of Poverty
Poverty is not a single concept – it exists in different forms:
Absolute Poverty: When people do not have enough to meet minimum needs like food, clothing, shelter.
Relative Poverty: When people are poor compared to others in the same society.
Extreme Poverty: When people live on less than 2.15 a day (World Bank standard).
Income Poverty: When income is below the poverty line.
Multidimensional Poverty: Looks at multiple aspects like education, health, sanitation, housing, and not just money.
The challenge is that definitions of these vary between countries, so a universal measure is difficult.
Invisible Dimensions of Poverty
Some aspects of poverty cannot be measured directly with numbers.
For example, insecurity, fear, and vulnerability are daily struggles for the poor.
Emotional aspects like anxiety about the next meal, inability to afford medicines, or fear of job loss are real but hard to capture.
Traditional income or calorie-based measures ignore these invisible dimensions.
Survey Struggles
Most poverty measurement depends on large household surveys (like NSSO in India).
Surveys are costly, time-consuming, and require trained staff.
In poor countries, lack of resources often reduces survey accuracy.
Even when surveys are done, some families may underreport or overreport income, leading to errors.
Government’s Influence
Governments often have the power to set or adjust the poverty line.
Sometimes, to show progress, governments may lower the standard of poverty line (e.g., very low income threshold).
This manipulation can make statistics look good but does not actually improve people’s living conditions.
Thus, political influence can distort poverty data.
| Challenge | Explanation |
|---|---|
| Many Faces of Poverty | Different types (absolute, relative, multidimensional); definitions vary across countries. |
| Invisible Dimensions | Fear, insecurity, and vulnerability are real but not captured by income-based data. |
| Survey Struggles | Surveys are costly, time-consuming, and sometimes inaccurate. |
| Government Influence | Poverty line can be manipulated for political gains, making statistics misleading. |
Prelims tips
- Absolute vs Relative vs Multidimensional poverty – know the difference.
- Invisible aspects like fear and insecurity are not covered by income data.
- NSSO household surveys are main source in India but have accuracy limits.
- Governments may manipulate poverty lines for political gains.
Mains points
- Measuring poverty is not only about income but also about well-being, security, and dignity.
- Global poverty lines (like World Bank’s 2.15/day) may not reflect local realities.
- Household surveys, though important, are expensive and often face underreporting issues.
- Political manipulation of poverty lines reduces credibility of poverty statistics.
- Need for multidimensional poverty indices (like NITI Aayog’s MPI in India) for accurate assessment.
Beyond Income: Multidimensional Poverty
Traditional poverty measures focused only on income, but multidimensional poverty goes beyond money. It includes health, education, housing, sanitation, electricity, and access to services. This approach provides a more complete picture of poverty and helps policymakers target different areas of deprivation.
Traditional Approach
Earlier, poverty was measured mainly by income or consumption levels.
If a family’s income was below the poverty line (say, 2.15/day as per World Bank), they were considered poor.
Problem: Income does not capture other aspects of well-being like health, education, or living conditions.
Multidimensional Poverty Approach
Recognizes that poverty is not just lack of money, but also lack of opportunities and basic services.
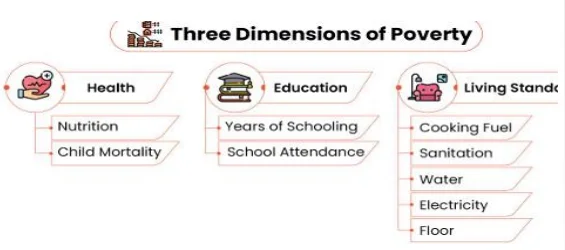
Includes multiple dimensions:
Health: nutrition, child mortality, access to healthcare.
Education: years of schooling, literacy, children attending school.
Standard of Living: clean water, sanitation, electricity, housing, cooking fuel, assets.
Purpose of Measuring Multidimensional Poverty
Gives a broader, more accurate picture of how people are deprived.
Helps identify which areas (health, education, housing, etc.) need urgent attention.
Allows governments to design specific programs – e.g., building toilets (sanitation), improving schools (education), providing electricity (standard of living).
Gives a 'human face' to poverty rather than just looking at money.
| Aspect | Traditional Poverty | Multidimensional Poverty |
|---|---|---|
| Basis | Income or consumption only | Income + health + education + living conditions |
| Focus | Money required to meet basic needs | Overall human well-being and opportunities |
| Measurement | Below or above poverty line (income) | Multiple indicators (nutrition, schooling, sanitation, electricity) |
| Limitation | Ignores health, education, services | Provides holistic picture of deprivation |
Prelims tips
- Traditional poverty measure: income/consumption only.
- World Bank poverty line: 2.15 per day (extreme poverty).
- Multidimensional Poverty Index (MPI) includes health, education, and living standards.
- NITI Aayog publishes India’s MPI using UNDP-Oxford methodology.
Mains points
- Multidimensional poverty captures multiple deprivations – not just income but also health, education, and living conditions.
- It provides a better tool for policymakers to design welfare programs.
- Helps in achieving SDG-1 (No Poverty) by addressing root causes of deprivation.
- In India, MPI highlights regional disparities (some states perform better, others worse).
- Holistic poverty measures shift the focus from survival to dignity and quality of life.
Global Multidimensional Poverty Index (MPI) and India's Status
The Global MPI, developed in 2010 by Oxford’s OPHI and UNDP, measures poverty not only by money but also by deprivations in health, education, and living conditions. It has 10 indicators and gives a score between 0 (no poverty) and 1 (highest poverty). India has made remarkable progress, with millions of people moving out of multidimensional poverty in recent years.
What is MPI?
The Multidimensional Poverty Index (MPI) was created in 2010 by OPHI (Oxford Poverty and Human Development Initiative) along with UNDP (United Nations Development Programme).
Earlier, poverty was measured only by income or money (e.g., World Bank’s 2.15/day poverty line). But this missed other important aspects of life.
MPI goes beyond income and looks at whether people are deprived in basic human needs like health, education, and standard of living.
Dimensions and Indicators
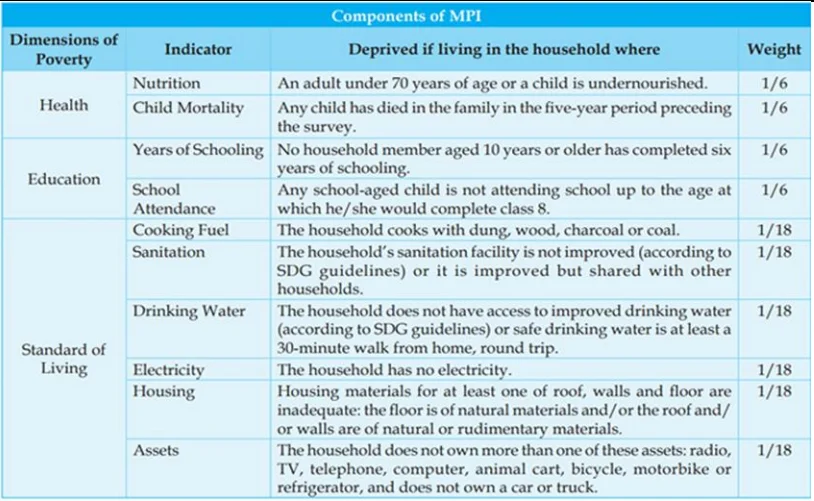
MPI is based on 3 dimensions, and each dimension has specific indicators:
Health: (1) Nutrition, (2) Child Mortality.
Education: (3) Years of Schooling, (4) School Attendance.
Standard of Living: (5) Cooking Fuel, (6) Sanitation, (7) Drinking Water, (8) Electricity, (9) Housing, (10) Assets.
If a household is deprived in one-third or more of these indicators, it is considered multidimensionally poor.
How MPI is Scored
MPI score ranges from 0 to 1.
Score = 0 → No one is poor.
Score closer to 1 → High poverty and many deprivations.
MPI also looks at two things: (1) How many people are poor, (2) How poor they are (intensity of poverty).
Limitations of MPI
Some indicators measure inputs/outputs (like years of schooling or cooking fuel) rather than actual capabilities (like quality of education).
Health data may not capture all aspects, especially malnutrition.
MPI measures poverty at household level, so differences within a family (e.g., women vs men, children vs adults) are not captured.
MPI in India
Between 2005-06 and 2015-16, poverty reduced sharply: 55.1% people were multidimensionally poor in 2005-06, which came down to 27.7% in 2015-16 (UNDP data). About 271 million people escaped poverty.
NITI Aayog’s MPI shows that poverty further declined from 24.85% to 14.96%, which means around 135 million people moved out of multidimensional poverty.
MPI Progress Report 2023 (India)
Between 2015-16 and 2019-21, 13.5 crore (135 million) Indians came out of multidimensional poverty.
Uttar Pradesh alone accounted for 3.43 crore people moving out of poverty, making it the state with the largest improvement.
At the national level, MPI poverty reduced from 24.85% to 14.96%.
MPI value (0.117 → 0.066) almost halved, meaning overall poverty burden reduced significantly.
Intensity of poverty (average deprivation faced by poor) reduced from 47% to 44%.
Districts in Madhya Pradesh, Gujarat, Uttar Pradesh, and Rajasthan showed the fastest progress.
These improvements indicate India is on track to achieve SDG Target 1.2 (reduce multidimensional poverty by half by 2030).
| Dimension | Indicators |
|---|---|
| Health | Nutrition, Child Mortality |
| Education | Years of Schooling, School Attendance |
| Standard of Living | Cooking Fuel, Sanitation, Drinking Water, Electricity, Housing, Assets |
| Year/Period | MPI % | People lifted out of poverty | MPI Value |
|---|---|---|---|
| 2005-06 | 55.1% | - | - |
| 2015-16 | 27.7% | 271 million | - |
| 2015-16 to 2019-21 | 24.85% → 14.96% | 135 million | 0.117 → 0.066 |
Prelims tips
- MPI developed in 2010 by OPHI & UNDP.
- 3 dimensions – Health, Education, Standard of Living.
- 10 indicators in total.
- India: MPI fell from 55.1% (2005-06) to 27.7% (2015-16).
- Between 2015-16 and 2019-21, 135 million Indians moved out of MPI poverty.
- Uttar Pradesh showed the largest improvement (3.43 crore people).
Mains points
- MPI captures poverty beyond income, including multiple deprivations like health, education, and living standards.
- India has halved multidimensional poverty in 15 years, lifting millions out of deprivation.
- Limitations: Household-level measurement ignores internal inequalities; some indicators measure inputs not actual well-being.
- Regional disparities remain – UP, MP, Rajasthan, Gujarat have shown major progress, but some states lag behind.
- India is on track to achieve SDG 1.2 by 2030 – reducing multidimensional poverty by half.
Global MPI 2024, National MPI (India) and Causes of Poverty
The Global Multidimensional Poverty Index (MPI) 2024 highlights that 1.1 billion people (18% of global population) live in acute poverty, with India having the largest share at 234 million. India has also developed its own National MPI through NITI Aayog, adding two extra indicators (Maternal Health and Bank Account) to reflect national priorities. Despite progress, poverty persists in India due to overpopulation, agricultural challenges, corruption, social inequalities, poor healthcare, weak infrastructure, and natural disasters.
Global MPI 2024
Developed by UNDP and OPHI, covering 112 countries.
About 1.1 billion people (18% of world population) live in acute multidimensional poverty.
India has the largest number of poor: 234 million in extreme poverty.
Countries affected by wars or conflicts show higher deprivations across all 10 MPI indicators compared to peaceful countries.
National MPI (India)
Developed by NITI Aayog, modeled on Global MPI.
Uses the same 10 indicators from Global MPI, but adds 2 extra indicators important for India:
1. Maternal Health (care for pregnant women).
2. Bank Account (financial inclusion).
Functions of National MPI:
Helps design targeted and inclusive poverty interventions.
Shows overlapping deprivations (e.g., poor health + no education + lack of sanitation).
Aids in inclusive policy-making by identifying specific needs of different groups.
Data 2023 (NITI Aayog): 14.96% of India’s population is multidimensionally poor.
Between 2005-06 and 2019-21, 415 million people in India exited multidimensional poverty (55.1% → 16.4%).
According to World Bank: In 2022-23, 145.71 million Indians were poor, and 34.4 million lived in extreme poverty.
Causes of Poverty in India
Overpopulation
With more than 1.3 billion people, resources like food, jobs, and housing are under huge pressure.
Creates unemployment and underemployment (part-time/low-paid jobs).
Leads to income instability and hunger.
Agricultural Issues
Majority still depend on traditional farming with outdated methods.
Lack of modern technology and irrigation lowers productivity.
Farmers often face debt and poverty.
Widespread Corruption
Corruption in government programs diverts funds away from poor people.
Resources for welfare and poverty alleviation are misused or wasted.
Caste-based Discrimination & Social Inequalities
Deep-rooted caste discrimination restricts access to education, jobs, and healthcare.
Marginalized communities remain trapped in poverty with fewer opportunities.
Limited Access to Healthcare
Rural areas and slums lack proper hospitals and doctors.
Families spend heavily on medical bills, often falling deeper into poverty.
Illness reduces productivity and income opportunities.
Inadequate Infrastructure
Many villages lack proper roads, transport, electricity, and internet.
Limits access to jobs, markets, education, and healthcare.
Keeps people disconnected from development opportunities.
Natural Disasters
Floods, droughts, cyclones, and pandemics hit India regularly.
Destroy crops, homes, and livelihoods.
Push affected communities back into poverty, slowing progress.
| Aspect | Global MPI | National MPI (India) |
|---|---|---|
| Year of Development | 2010 (UNDP + OPHI) | By NITI Aayog (based on Global MPI) |
| Dimensions | Health, Education, Standard of Living | Same 3 dimensions |
| Indicators | 10 indicators | 12 indicators (10 global + Maternal Health + Bank Account) |
| Purpose | Compare poverty across countries | Policy design & targeted poverty reduction in India |
| Cause | Explanation |
|---|---|
| Overpopulation | Huge pressure on resources; unemployment and underemployment. |
| Agricultural Issues | Traditional farming methods; low productivity; farmer debt. |
| Corruption | Funds for poor diverted; inefficient use of resources. |
| Caste & Inequality | Discrimination restricts access to education, jobs, health. |
| Healthcare Gaps | Lack of facilities; high medical costs push families into poverty. |
| Poor Infrastructure | Lack of roads, electricity, transport; limits opportunities. |
| Natural Disasters | Floods, droughts, cyclones destroy lives and livelihoods. |
Prelims tips
- Global MPI 2024: 1.1 billion poor, India largest (234 million).
- National MPI: 12 indicators (adds Maternal Health + Bank Account).
- India: 415 million exited multidimensional poverty (2005-06 to 2019-21).
- World Bank (2022-23): 145.71 million poor; 34.4 million extreme poor.
- Causes: Overpopulation, agriculture issues, corruption, caste, health gaps, poor infrastructure, natural disasters.
Mains points
- India has made strong progress in reducing MPI but still has the largest number of poor in the world.
- National MPI adds indicators suited to Indian context – maternal health and bank account access.
- Structural causes like overpopulation, agriculture dependence, and social inequalities keep poverty alive.
- Policy challenge: balance between economic growth, social inclusion, and disaster resilience.
- SDG Target 1.2 (halve poverty by 2030) requires faster progress, especially in lagging states and rural areas.
Consequences of Poverty, Poverty Trap and Poverty Alleviation
Poverty has serious consequences such as child labour, terrorism, crime, lack of education, and forced migration. It can also create a 'poverty trap', where people cannot escape poverty due to lack of resources and opportunities. To address these issues, governments and institutions launch poverty alleviation programs.
Consequences of Poverty
Child Labour
Poor families cannot afford to send children to school.
Children are forced to work in fields, factories, or as domestic workers.
This deprives them of education and keeps the cycle of poverty alive.
Terrorism
According to UN Secretary-General Antonio Guterres, poverty, inequality, and social exclusion act as fuel for terrorism.
Frustration, unemployment, and marginalisation create fertile ground for extremist groups.
Crimes
Lack of jobs and marginalisation often push people into theft, robbery, or violent crimes.
Example: In Pakistan, the 2022 floods worsened poverty, leading to a rise in violent crimes.
Lack of Education
UNICEF reports that 25% of children in India do not receive proper education.
Without education, chances of getting a decent job with good income are very low.
This continues the poverty cycle across generations.
Migration
Poverty forces people to move within the country (inter-state) or even across borders.
Example: In Africa’s Sahel region, where 80% live on less than 2/day, poverty drives large-scale migration.
Poverty Trap
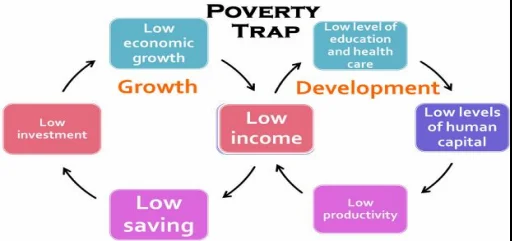
A poverty trap is a situation where people cannot escape poverty even if they try.
To break free, one needs enough money or resources (capital), but poor people often lack these.
Without capital, they cannot improve their education, healthcare, or skills → which keeps them poor.
Thus, it becomes a self-reinforcing cycle (poverty leads to more poverty).
Example: After the COVID-19 pandemic, more than 200 million people in India fell into poverty, making it harder for them to recover.
Poverty Alleviation
Poverty alleviation refers to programs and policies designed to reduce poverty.
These may include employment schemes, free healthcare, education programs, food security schemes, financial inclusion, and social welfare measures.
| Consequence | Impact |
|---|---|
| Child Labour | Children forced to work; no education; cycle of poverty continues. |
| Terrorism | Poverty fuels frustration; fertile ground for extremism. |
| Crimes | Joblessness leads to theft, robbery, and violence. |
| Lack of Education | 25% children in India not educated; low chances of employment. |
| Migration | People migrate due to extreme poverty; e.g., Sahel region in Africa. |
| Aspect | Explanation |
|---|---|
| Definition | A cycle where poor people cannot escape poverty due to lack of capital/resources. |
| Cause | Low income → no education/healthcare → low skills → low income again. |
| Example | COVID-19 pandemic pushed 200 million Indians into poverty. |
| Result | Self-reinforcing cycle of deprivation. |
Prelims tips
- UNICEF: 25% children in India do not get education.
- Antonio Guterres: Poverty + inequality fuel terrorism.
- COVID-19: Over 200 million Indians pushed into poverty.
- Poverty Trap = self-reinforcing cycle due to lack of capital/resources.
Mains points
- Poverty has wide-ranging social consequences – child labour, terrorism, crime, poor education, and migration.
- A poverty trap keeps generations stuck in deprivation despite efforts to escape.
- India needs targeted poverty alleviation programs focusing on education, jobs, healthcare, and social equality.
- COVID-19 worsened poverty traps, pushing millions back into poverty.
- Breaking poverty cycles requires multi-dimensional approaches (economic, social, health-based interventions).
Feminisation of Poverty
Feminisation of poverty refers to the growing share of women among the poor due to gender inequalities. Women face restricted access to resources, opportunities, and rights, resulting in low income, unpaid work, and higher vulnerability to poverty.
What is Feminisation of Poverty?
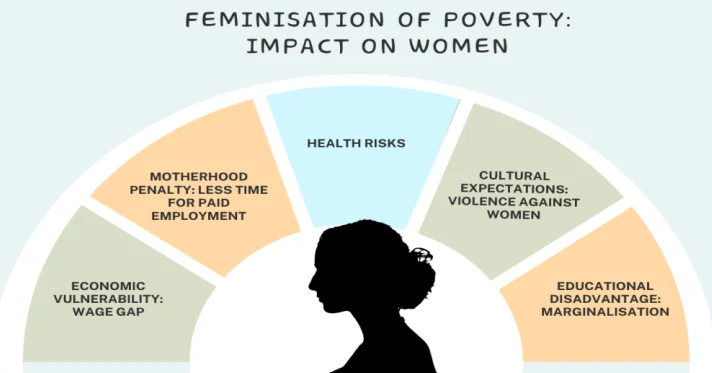
It describes how women increasingly form a large proportion of the poor population.
Causes: Gender discrimination, lower wages, unequal education opportunities, unpaid care work, lack of property rights, and social barriers.
Key Indicators
GDP Contribution: Women are 48% of India's population but contribute only 18% to GDP (NFHS).
Labour Force Participation: Female Labour Force Participation Rate (FLFPR) was only 37% in 2023 (Economic Survey).
Literacy Gap: 2011 Census shows literacy rate of women at 65.46% vs overall 74%.
Unpaid Care Work: Women's unpaid domestic and care work in India equals 15–17% of GDP, yet it is unrecognized.
Facts and Data
Globally, unpaid work by women equals 10 trillion annually (Oxfam) – 43 times Apple’s turnover.
In India, 18.3% of labour is unpaid (Economic Survey 2024).
Women’s unpaid work is valued at 3.1% of GDP; total care economy = 17% of GDP (₹34.5 lakh crores).
Women spend 7.2 hours daily on unpaid work vs men’s 2.8 hours.
Way Forward
1. Invest in Social Sectors
Expand girl’s education campaigns (e.g., Beti Bachao Beti Padhao).
Education increases earnings: Each extra year of schooling = 10% rise in income (World Bank 2018).
Improve sanitation via Swachh Bharat Abhiyan to reduce diseases and improve women’s quality of life.
2. Build Climate Resilience
Promote climate-smart agriculture (drought-resistant crops, better irrigation).
Helps protect women farmers who are highly vulnerable to climate shocks.
3. Strengthen Social Safety Nets
Improve Public Distribution System (PDS) for food security.
Use technology for better targeting so benefits reach women and marginalized groups.
4. Foster Inclusive Growth
Launch skill development programs aligned to market demand.
Implement fair wage policies and strengthen minimum wages.
Provide protection to informal workers (majority of whom are women).
Famous Quotes on Poverty
“Poverty is not an accident. Like slavery and apartheid, it is man-made and can be removed.” – Nelson Mandela
“Poverty is not just a lack of income, it is a lack of choices.” – Amartya Sen
“Poverty is the worst form of violence.” – Mahatma Gandhi
“The only way to fight poverty is with education.” – Kofi Annan
| Indicator | Data |
|---|---|
| GDP Contribution | Women: 48% of population but only 18% of GDP. |
| Labour Force Participation | Female LFPR: 37% (2023). |
| Literacy | Women: 65.46% vs total: 74% (2011 Census). |
| Unpaid Care Work | 15–17% of GDP; women spend 7.2 hrs/day vs men 2.8 hrs. |
Prelims tips
- Feminisation of poverty = rising proportion of women among the poor.
- Women contribute 18% to GDP despite being 48% of population.
- Female LFPR (2023): 37%.
- Women’s unpaid care work = ~15–17% of GDP.
- Global unpaid women’s work = 10 trillion annually (Oxfam).
Mains points
- Feminisation of poverty reflects structural gender inequalities in work, wages, and opportunities.
- Unpaid care work is undervalued and under-recognised despite its huge contribution to economy.
- Education, skill development, and inclusive policies are key to reducing women’s poverty.
- Women’s participation in labour force is critical for inclusive growth and poverty reduction.
- Need for gender-responsive budgeting and social protection schemes targeting women.
Inequality
Inequality refers to the gap between the rich and the poor in terms of income, wealth, and opportunities. While some inequality can encourage growth, extreme inequality slows down development, reduces social mobility, and causes instability.
Introduction
Thomas Piketty: 'You need some inequality for growth, but extreme inequality is detrimental as it limits mobility and captures democracy.'
Joseph Stiglitz: 'Inequality is not just moral, it is economic – it slows growth and creates instability.'
Robert Reich: 'Economic inequality is a driver of social instability.'
What is Inequality?
Inequality refers to gaps in wealth, income, or opportunities between groups or individuals in society.
It can exist in various forms: income, wealth, gender, education, rural-urban divide, and opportunities.
Data and Examples (India)
Wealth Inequality: India is among the most unequal countries; rich accumulate wealth much faster than the poor (Oxfam report).
Income Inequality: Top 1% of population gets 22.6% of national income (World Inequality Database 2022-23), higher than even the US.
Rural-Urban Divide: Rural monthly per capita expenditure = ₹3,773 vs Urban = ₹6,459 (HCE Survey 2022-23).
Gender Pay Gap: Men earn 82% of labour income vs Women 18% (World Inequality Report 2022).
Types of Inequality
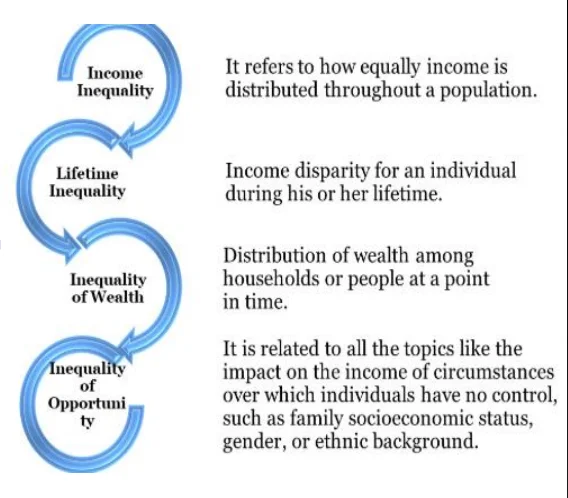
1. Income Inequality: Unequal distribution of income within a population. (Example: CEO earning 500x more than a worker).
2. Lifetime Inequality: Differences in earnings of an individual across their lifetime (e.g., unskilled worker vs skilled professional).
3. Wealth Inequality: Gap in assets like land, houses, savings, shares, etc. across households at a given time.
4. Inequality of Opportunity: Differences caused by circumstances beyond individual control (caste, gender, family background).
Note
Income Inequality: Compares disparity in incomes of top vs bottom percentiles.
Wealth Inequality: Compares disparity in wealth/assets rather than income.
Economic Inequality: Measured using the Lorenz Curve, which shows income/wealth distribution across society.
| Type | Meaning | Example |
|---|---|---|
| Income Inequality | Difference in income distribution | Top 1% earn 22.6% of national income in India |
| Lifetime Inequality | Income difference across individual’s life | Skilled engineer vs unskilled worker |
| Wealth Inequality | Gap in assets and wealth ownership | Rich own land/shares, poor have no savings |
| Opportunity Inequality | Inequality due to uncontrollable circumstances | Caste-based restrictions on jobs |
Prelims tips
- Top 1% in India earn 22.6% of national income (WID 2022-23).
- Gender gap: Men earn 82% vs Women 18% of labour income (2022).
- Rural-Urban divide: ₹3,773 (rural) vs ₹6,459 (urban) monthly expenditure (2022-23 survey).
- Lorenz Curve used to measure economic inequality.
Mains points
- Inequality is not only a moral issue but an economic challenge affecting growth and stability.
- India shows high wealth and income inequality – top 1% control disproportionate resources.
- Rural-urban divide and gender wage gaps worsen inequality.
- Lifetime and opportunity inequality limit social mobility and perpetuate poverty.
- Policies must focus on inclusive growth, redistribution, education, and reducing structural discrimination.
Measuring Inequality – Lorenz Curve
The Lorenz Curve is a graphical representation of income or wealth inequality. It compares the cumulative share of income/wealth with the cumulative share of the population. The greater the deviation from the line of equality, the higher the inequality.
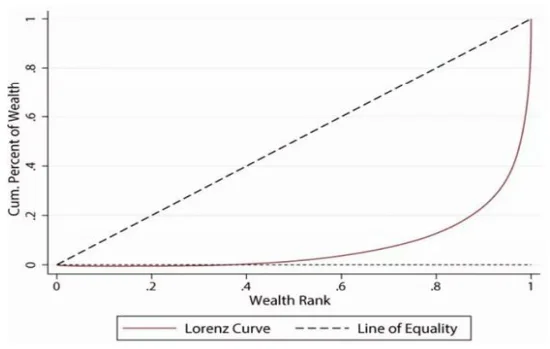
What is Lorenz Curve?
A Lorenz Curve is a commonly used tool to measure income or wealth inequality.
It shows how much of the total income/wealth is owned by cumulative percentages of the population.
Example: It can show what percentage of wealth is owned by the bottom 50% of the population compared to the top 10%.
How it Works
X-axis: Represents cumulative share of the population (sorted from poorest to richest).
Y-axis: Represents cumulative share of income/wealth owned by that share of the population.
Line of Equality (45° line): Perfect equality – every % of population earns the same % of income (e.g., bottom 10% earns 10%, bottom 50% earns 50%).
Lorenz Curve (solid line): Actual distribution of income/wealth, which usually bows below the line of equality.
The more the curve bends away from the equality line, the greater the inequality.
Relation with Gini Coefficient
The Gini coefficient is derived from the Lorenz Curve.
It measures inequality numerically from 0 to 1 (or 0% to 100%).
Gini = 0 → Perfect equality; Gini = 1 → Perfect inequality (one person owns everything).
Key Insight
Lorenz Curve helps policymakers understand how income or wealth is distributed.
It provides a visual tool to compare inequality across time and countries.
| Feature | Description |
|---|---|
| X-axis | Cumulative % of population (poorest → richest) |
| Y-axis | Cumulative % of income/wealth owned |
| Line of Equality | 45° line; perfect equality scenario |
| Lorenz Curve | Shows actual inequality; bows below equality line |
| Relation with Gini | More curve deviation = higher Gini coefficient |
Prelims tips
- Lorenz Curve shows inequality by plotting cumulative income/wealth vs cumulative population.
- Line of equality = perfect equality (45° line).
- More deviation from equality line → more inequality.
- Gini coefficient derived from Lorenz Curve.
Mains points
- Lorenz Curve is a visual tool to measure inequality in income/wealth distribution.
- It highlights deviation from perfect equality, making inequality easier to understand.
- Gini coefficient quantifies inequality using Lorenz Curve data.
- Useful for comparing inequality between countries and across time periods.
- Important for designing inclusive policies and redistributive taxation.
Gini Coefficient
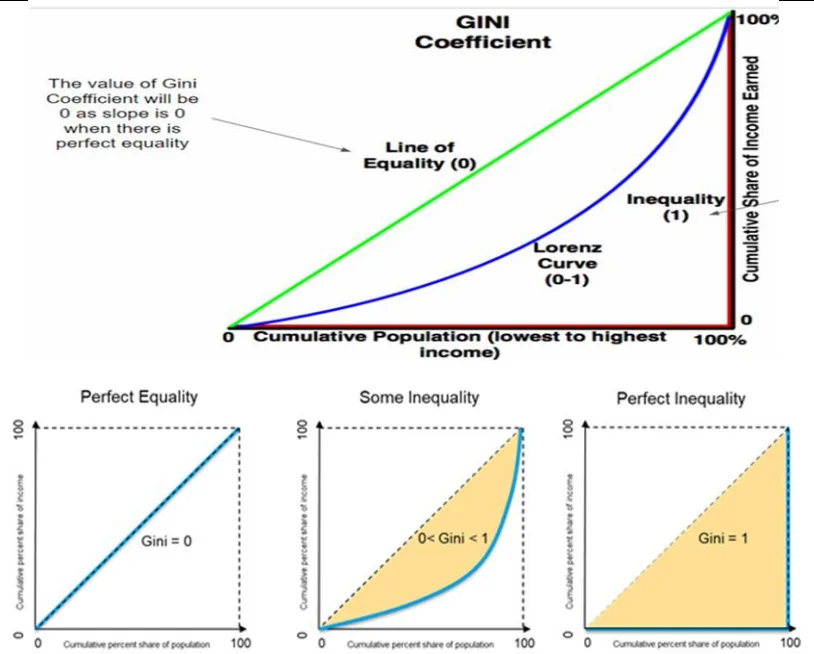
The Gini Coefficient is a statistical measure of income or wealth inequality, ranging between 0 (perfect equality) and 1 (perfect inequality). It is widely used for comparing inequality across countries and time periods.
What is Gini Coefficient?
It is a numerical value that measures inequality in income or wealth distribution.
Range: 0 → Perfect equality (everyone has the same income).
Range: 1 → Perfect inequality (one person has everything, others have nothing).
It is based on the Lorenz Curve and is often used to compare countries and periods of time.
Usually, it measures inequality after redistribution through taxes and transfers (disposable income/consumption).
Shortcomings of Gini Coefficient
1. Not Decomposable/Additive: Cannot easily separate inequality within and between groups.
2. Insensitive to Middle Transfers: Focuses more on extremes (rich vs poor) rather than income transfers in the middle.
3. Different Distributions, Same Gini: Two countries with very different distributions can have the same Gini value.
4. No Demographic Insights: Does not show inequality between subgroups (gender, caste, region).
5. Data Dependence: Depends heavily on GDP and income data, which may not always be reliable.
6. Informal Economy Ignored: Does not account for unrecorded income in informal sectors.
Key Insight
Despite its shortcomings, Gini coefficient is widely used due to its simplicity.
Helps policymakers assess inequality trends and design redistributive policies.
| Aspect | Details |
|---|---|
| Range | 0 (perfect equality) to 1 (perfect inequality) |
| Basis | Lorenz Curve |
| Used for | Income/Wealth inequality measurement |
| Strength | Simple and widely comparable across countries |
| Weakness | Does not show internal group inequality, ignores informal sector |
Prelims tips
- Gini Coefficient ranges between 0 (equality) and 1 (inequality).
- Derived from Lorenz Curve.
- Often measures inequality after taxes and transfers (disposable income).
- Limitation: Cannot capture informal sector or group-specific inequality.
Mains points
- Gini Coefficient is the most widely used global inequality measure.
- Helps compare inequality between nations and time periods.
- Its simplicity makes it popular, but it hides nuances like gender, caste, and regional inequality.
- Different distributions can have same Gini, reducing its explanatory power.
- Should be used along with other indices (Palma ratio, Atkinson index, MPI) for better policy insights.
Other Measures of Inequality
Besides the Gini coefficient, inequality can be measured using indices such as the Theil Index, Palma Ratio, Kuznets Ratio, and Hoover Index. Each provides a different perspective on income and wealth distribution.
Theil Index
Theil Index measures economic inequality by calculating the 'distance' between the actual income distribution and the ideal equal distribution.
Range: 0 → perfect equality; higher values → higher inequality.
Advantage: Decomposable – can separate inequality within and between groups.
Palma Ratio
Focuses on income disparity between top 10% earners and bottom 40% of population.
Ignores the middle 50% since their income shares are relatively stable worldwide.
Useful for highlighting the extremes of inequality.
Kuznets Ratio
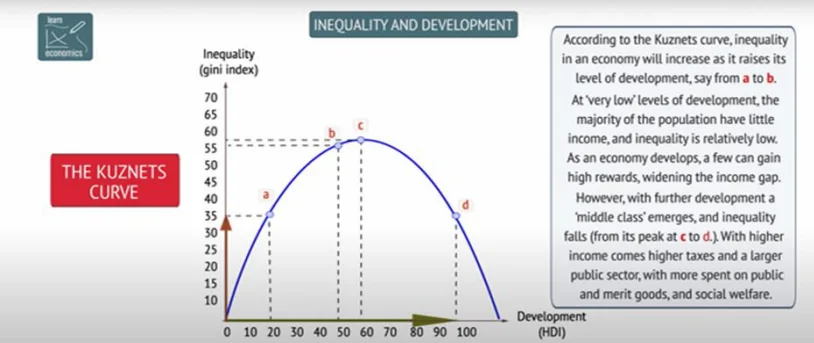
Developed by Simon Kuznets, it compares the income share of the richest x% with the poorest y%.
Forms the basis of the Kuznets Curve: inequality first rises with growth (industrialisation) and later falls as economies mature → inverted U-shape.
Shows the relationship between development and inequality.
Hoover Index
Also called Ricci-Schutz coefficient, Pietra Index, or Robin Hood Index.
Measures the proportion of income that must be redistributed to achieve equality.
Range: 0 → perfect equality; 1 → perfect inequality.
Graphically: maximum vertical distance between Lorenz Curve and equality line.
Why Multiple Measures?
Gini is popular but has limitations (cannot capture extremes or subgroup differences).
These alternative indices highlight different aspects – extremes (Palma), decomposability (Theil), development dynamics (Kuznets), and redistribution needed (Hoover).
| Measure | Range | Focus/Feature |
|---|---|---|
| Theil Index | 0 → ∞ | Decomposable; measures distance from equality |
| Palma Ratio | No fixed range | Top 10% income vs Bottom 40%; highlights extremes |
| Kuznets Ratio | No fixed range | Richest x% vs Poorest y%; linked to Kuznets Curve |
| Hoover Index | 0 → 1 | Proportion of income redistribution needed; 'Robin Hood' measure |
Prelims tips
- Theil Index = decomposable; 0 = equality, higher = inequality.
- Palma Ratio = top 10% income vs bottom 40%.
- Kuznets Ratio = richest x% vs poorest y%; forms Kuznets Curve (inverted U).
- Hoover Index = income redistribution needed; also called Robin Hood index.
Mains points
- Inequality measurement requires multiple tools beyond Gini to capture different aspects.
- Theil Index useful for decomposing inequality between regions/groups.
- Palma Ratio highlights inequality extremes, especially relevant for developing countries.
- Kuznets Ratio links inequality with economic growth patterns.
- Hoover Index shows redistribution needed to bring equality, useful for policy design.
Atkinson Index and Status of Inequality in India
The Atkinson Index, developed by Anthony Atkinson, measures inequality with sensitivity to different parts of the income distribution. In India, inequality has been rising sharply since the 1980s, with the top 1% controlling a large share of income and wealth. Reports from World Inequality Lab, Forbes, Oxfam, and SBI highlight the persistence of high inequality despite growth.
Atkinson Index
Developed by economist Anthony Barnes Atkinson.
Focus: Which parts of the income distribution contribute most to inequality.
Range: 0 → Perfect equality; 1 → Perfect inequality.
Unique feature: Shows how much of society’s income people are willing to sacrifice to achieve equality.
Useful for policy because it highlights distributional sensitivity (e.g., whether inequality is driven more by the poor, middle, or rich segments).
Status of Inequality in India
World Inequality Lab Report (1922–2023)
Inequality declined post-independence until 1980s, but rose sharply after liberalisation in 1990s.
Since 2000s, inequality has surged dramatically.
Average income grew 2.6% annually (1960–2022).
Rise of Billionaires: 1 billionaire (1990) → 52 (1991) → 162 (2011) → 200 (2024).
Top 1% Control: In 2022–23, top 1% held 22.6% of income and 40.1% of wealth.
Called “Billionaire Raj,” now more unequal than British Raj.
Forbes Billionaires List 2024
India has 200 billionaires with total wealth 954 billion.
Wealth grew 41% compared to previous year.
Oxfam India Report (2023)
Top 5% Indians own 60% of wealth.
Bottom 50% own only 3%.
From 2012–21: Top 1% gained 40% of new wealth, bottom 50% got only 3%.
Gini coefficient rose from 0.32 (1983) → 0.36 (2019).
SBI Economic Research
Signs of narrowing inequality in taxable incomes.
Tax base expanded, more people moved into higher tax brackets.
Small firms transitioned into larger businesses.
Post-pandemic: Bottom 90% consumption rose by ₹8.2 lakh crore.
Gini coefficient for taxable income improved: 0.472 (2014) → 0.402 (2022).
Female Tax Filers
Women = 15% of tax filers in India.
Higher proportions in Kerala, Tamil Nadu, Punjab, West Bengal.
| Source | Key Findings |
|---|---|
| World Inequality Lab (1922–2023) | Top 1%: 22.6% income, 40.1% wealth; rise of billionaire class. |
| Forbes 2024 | 200 billionaires; 954 billion wealth (+41% from last year). |
| Oxfam India 2023 | Top 5% hold 60% wealth; bottom 50% hold 3%; Gini 0.32 (1983) → 0.36 (2019). |
| SBI Research | Tax inequality narrowing; taxable income Gini fell 0.472 → 0.402 (2014–22). |
| Female Tax Filers | 15% women; higher in Kerala, TN, Punjab, WB. |
Prelims tips
- Atkinson Index: 0 = equality; 1 = full inequality. Shows which part of distribution drives inequality.
- World Inequality Lab (2023): Top 1% hold 22.6% income, 40.1% wealth.
- Forbes 2024: India has 200 billionaires worth 954 billion.
- Oxfam 2023: Top 5% own 60% wealth; bottom 50% only 3%.
- SBI: Taxable income Gini improved from 0.472 (2014) → 0.402 (2022).
Mains points
- Atkinson Index is useful for understanding inequality sensitivity across distribution segments.
- Inequality in India declined post-independence but surged after 1980s due to liberalisation.
- Top 1% dominate both income and wealth, creating a 'Billionaire Raj' more unequal than colonial rule.
- Contrasting findings: Oxfam highlights worsening wealth inequality, while SBI suggests narrowing income inequality among taxpayers.
- Policy challenge: address extreme wealth concentration while sustaining growth.
Inequality in India – Causes, Consequences and Way Forward
Inequality in India is shaped by unemployment, inflation, weak tax systems, agrarian disparities, gender gaps, and global shocks. It results in social conflicts, poor development indicators, and weak public services. While steps like progressive taxation, social security, and digital inclusion have been taken, stronger reforms in wages, education, health, and wealth taxation are needed.
Causes of Inequality in India
Unemployment and Underemployment: Large sections of the workforce are either jobless or working in low-paying, unproductive jobs. Economic growth has not created enough jobs for all, linking poverty, unemployment, and inequality together.
Inflation: Rising prices hurt the poor more. While profits may rise for businesses, wage earners—especially in the unorganised sector—struggle as their real income (purchasing power) falls.
Tax Evasion: High tax rates in the past encouraged tax evasion and black money, concentrating income among a few and fueling inequality.
Regressive Taxation: Indirect taxes (like GST, excise duty) affect the poor more because they spend a larger share of their income on consumption.
Green Revolution Strategy: Benefited rich farmers with land and technology, while landless labourers and marginal farmers remained poor, deepening rural inequality.
Gender and Social Inequalities: Women, lower castes, and minorities face systemic discrimination, leading to fewer opportunities in education, jobs, and income.
Consequences of Inequality
Social Conflict: Rising inequality triggers social tensions. Example: caste-based reservation demands by Jaats, Marathas, and Patels often turn violent.
Ethnic and Religious Tensions: Minority groups may feel excluded, leading to demands for autonomy or separatism.
Low Development Indicators: High inequality correlates with poor health and education outcomes – high infant mortality, low literacy, low per capita income.
Neglect of Public Services: Rich people rely on private hospitals and schools, leaving public services underfunded and poor in quality for the rest.
Challenges in Addressing Inequality
Low Female Labour Force Participation: Women often leave the workforce due to lack of education, early marriage, and family responsibilities.
Weak Coverage of Schemes: Many welfare schemes fail to reach the poorest, leading to high out-of-pocket spending on health and education.
Global Uncertainties: Shocks like COVID-19 and the Russia-Ukraine war increase inflation and widen inequality.
High Informal Sector Employment: Nearly 80–90% of workers are in informal jobs with no job security or benefits, leading to low wages.
Skewed Economic Growth: Certain regions and industries benefit more (IT, big cities), while rural and small-scale sectors lag behind.
Steps Taken to Reduce Inequality
Progressive Taxation: Higher income groups are taxed more than lower-income groups.
Land Reforms: Redistribution of surplus land after independence aimed at reducing rural inequality (though implementation was weak in many states).
Social Security Measures: Schemes like pensions, subsidised grains under PDS, and employment schemes like MGNREGA.
Jan Dhan–Aadhaar–Mobile (JAM) Trinity: Enabled financial inclusion, direct benefit transfers, and reduced leakages.
Minimum Wage Revisions: Periodically updated to protect low-income workers.
Free Education and Health Services: Offered by the government, though quality remains a concern.
World Bank Shared Prosperity Goal (2013): Focuses on increasing incomes of the poorest 40% along with ending extreme poverty.
Way Forward
Wealth and Super Tax: Tax the ultra-rich (billionaires and multimillionaires) to redistribute wealth more fairly.
Raise Minimum Wages: Especially in the informal sector (e.g., gig workers) to ensure decent living conditions.
Invest in Education and Health: Allocate at least 6% of GDP to education and 2.5% to healthcare for equitable development.
Reduce Exclusion Errors: Use digital platforms and JAM to ensure welfare benefits reach the intended poor.
Balanced Growth: Focus on lagging regions and sectors to reduce regional and rural-urban inequality.
| Aspect | Details |
|---|---|
| Causes | Unemployment, inflation, tax evasion, regressive taxation, green revolution imbalance, gender and social discrimination |
| Consequences | Social conflict, ethnic/religious tensions, poor development indicators, neglect of public services |
| Challenges | Low female participation, poor scheme coverage, global shocks, informal employment, skewed growth |
| Steps Taken | Progressive taxes, land reforms, PDS, pensions, JAM trinity, minimum wages, free health and education |
| Way Forward | Wealth tax, higher minimum wages, more education & health spending, reduce errors in schemes |
Prelims tips
- Causes of inequality in India: unemployment, inflation, regressive taxation, Green Revolution, gender and caste discrimination.
- Consequences include social conflict, poor health & education, and neglect of public services.
- JAM trinity (Jan Dhan, Aadhaar, Mobile) helps reduce leakages and improve inclusion.
- World Bank (2013): Shared prosperity = income growth of bottom 40%.
Mains points
- Unemployment, inflation, weak taxation, and rural disparities are structural causes of inequality in India.
- It results in social unrest, poor health and education indicators, and weak public services.
- Key challenges include low female participation, informal sector dominance, and global shocks.
- Steps like progressive taxation, JAM trinity, land reforms, and PDS exist but are not enough.
- Way forward requires wealth taxes, higher wages, more spending on health and education, and better delivery of schemes.
Hunger in India
Hunger means food deprivation – consuming less than 1,800 calories a day. Malnutrition includes both undernutrition (too little food/nutrients) and overnutrition (too much unhealthy food). According to UN reports, more than 1 billion Indians cannot afford a healthy diet, and India ranks poorly on global hunger indices. The government, however, disputes some international findings, arguing they are based on weak data.
Introduction
Hunger = food deprivation or undernourishment, defined as less than 1,800 calories a day per person.
Malnutrition = both undernutrition (not enough food/nutrients) and overnutrition (too much unhealthy food).
UN Hunger Report: Hunger refers to severe food insecurity – when people go entire days without food due to lack of money, food, or resources.
UN Food Security Report (2023): About 74.1% of Indians (1.04 billion people) could not afford a healthy diet in 2021.
India’s undernourished population estimated at 16.6% (2020–22). For comparison: Bangladesh = 66%, Pakistan = 82%, Iran = 30%, China = 11%, Russia = 2.6%, US = 1.2%, UK = 0.4%.
Government of India disputes FAO’s 16.6% estimate, arguing it was based on a very small sample (3,000 people, 8 questions).
India also rejected its Global Hunger Index ranking (111 out of 125), calling it methodologically flawed and biased.
Why Hunger is a Problem
Hunger is not just about lack of food but about lack of access to healthy and nutritious food.
It leads to stunting, wasting, and underweight children, weakening future generations.
It reduces productivity, worsens poverty, and increases inequality.
| Index/Report | Findings |
|---|---|
| Global Hunger Index (2023) | India ranked 111/125; about 190 million hungry people. |
| UNICEF Report | 181 million children under 5 suffering from severe child food poverty. |
| India’s Multidimensional Poverty Index | Poverty fell from 29.17% (2013-14) to 11.28% (2022-23); 248 million people exited poverty. |
| NFHS-5 | Child malnutrition: stunting (35.5%), wasting (7.7%), underweight (32.1%). |
| FAO – State of Food Security & Nutrition (SOFI) | Hunger reduced from 233.9 million (2020–22) to 194.6 million (2021–23); 39.3 million exited hunger. |
Prelims tips
- Hunger = less than 1,800 calories/day; Malnutrition = undernutrition + overnutrition.
- India GHI 2023 rank: 111/125.
- NFHS-5 child malnutrition: stunting 35.5%, wasting 7.7%, underweight 32.1%.
- SOFI 2023: Hunger in India reduced by 39.3 million between 2020–22 and 2021–23.
Mains points
- Hunger is a multidimensional problem – not just lack of food but lack of access to affordable, nutritious diets.
- India has one of the largest undernourished populations despite high food production.
- Reports show mixed results – some highlight improvement (SOFI, MPI), others show poor rankings (GHI).
- Government disputes international hunger rankings due to methodological issues.
- Addressing hunger requires nutrition-sensitive policies, better public distribution, and investment in health and education.
Types and Causes of Hunger
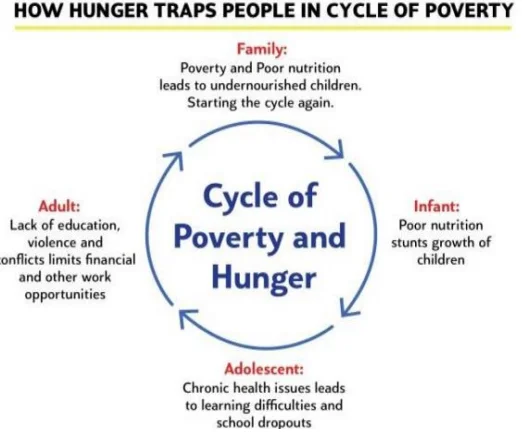
Hunger can be acute (sudden and severe), chronic (long-term undernourishment), or hidden (lack of essential vitamins and minerals). In India, hunger is caused not by lack of food production but by poverty, leakages, wastage, social inequality, poor sanitation, climate change, and weak safety nets.
Types of Hunger
Acute Hunger: Severe food deprivation caused by sudden crises such as natural disasters, wars, or conflicts. Example: In 2024, WFP estimated that 12.9 million Syrians (over half the population) are suffering from hunger due to ongoing conflict.
Chronic Hunger: Long-term undernourishment, where a person continuously consumes less food than needed. Often linked with poverty and lack of access to nutritious diets.
Hidden Hunger: A condition where people eat enough calories but lack essential vitamins and minerals like iron, zinc, vitamin A, or vitamin D. This leads to poor health, low immunity, and stunted growth despite having enough food.
Causes of Hunger
Poverty: The main cause of hunger. People may not afford nutritious food even though India produces enough grain. Example: FAO estimates 194 million Indians go to bed hungry every day.
Social Cleavages and Gender Inequality: Women and girl children often eat last and least in families. Example: NFHS-4 reported that 53% of Indian women suffer from anaemia due to poor nutrition.
Leakages in Food Distribution: Corruption and inefficiencies in schemes like PDS mean food often gets siphoned away by middlemen before reaching the poor.
Food Wastage: Large amounts of food rot in storage or are wasted. Example: Between 2011–2017, about 62,000 tonnes of food grains were wasted in FCI warehouses.
Climate Change: Rising temperatures, droughts, and floods damage crops and reduce food availability. Example: In 2021, wheat crops in Madhya Pradesh were badly affected.
Inadequate Social Safety Nets: Weak welfare systems fail to protect the poor in times of crisis. Example: 65% of health expenses in India are 'out-of-pocket', pushing families deeper into poverty.
Poor Sanitation and Hygiene: Illnesses like diarrhoea from unsafe water and poor sanitation reduce the body's ability to absorb nutrients, worsening malnutrition. Example: Children in households with poor toilets often suffer from repeated illness and malnutrition.
| Category | Explanation |
|---|---|
| Acute Hunger | Sudden, severe hunger due to disasters/conflicts (e.g., Syria). |
| Chronic Hunger | Long-term undernourishment linked to poverty. |
| Hidden Hunger | Lack of essential vitamins and minerals despite food availability. |
| Poverty | Main cause – lack of purchasing power despite surplus food production. |
| Social Inequality | Women and girl children eat less, leading to anaemia and malnutrition. |
| Leakages | Corruption in schemes like PDS prevents food reaching poor. |
| Wastage | Food rots in storage; 62,000 tonnes wasted (2011–17). |
| Climate Change | Crop losses due to drought, floods, rising temperatures. |
| Weak Safety Nets | Out-of-pocket health expenses push poor into deeper poverty. |
| Poor Sanitation | Diseases reduce nutrient absorption, worsening malnutrition. |
Prelims tips
- Types of hunger: Acute (disasters/conflict), Chronic (long-term poverty), Hidden (vitamin/mineral deficiency).
- FAO: 194 million Indians go to bed hungry daily.
- NFHS-4: 53% women anaemic.
- FCI: 62,000 tonnes food grains wasted (2011–17).
- Out-of-pocket health expenses = 65% in India.
Mains points
- Hunger is multidimensional – it can be sudden (acute), long-term (chronic), or invisible (hidden micronutrient deficiencies).
- India’s hunger problem is linked more to poverty, inequality, and poor systems than to lack of food production.
- Leakages, wastage, and weak safety nets worsen food insecurity.
- Climate change and poor sanitation add new layers to the hunger problem.
- Solutions require addressing poverty, fixing PDS, reducing wastage, improving health/sanitation, and creating stronger social protection systems.
Impact of Climate Change on Food Security and Nutrition
Climate change worsens hunger and food insecurity by damaging crops, reducing nutritional quality, and increasing food prices. Extreme weather, sea level rise, water scarcity, and higher temperatures threaten both food availability and food safety. This results in malnutrition, micronutrient deficiencies, and stunted growth among vulnerable populations.
Global Situation
According to the World Bank, the number of people facing acute food insecurity rose from 135 million in 2019 to 345 million across 82 countries by June 2022.
Main reasons: COVID-19 pandemic, Russia-Ukraine war, supply chain disruptions, and rising food prices.
Climate change acts as a 'threat multiplier', worsening food insecurity in all vulnerable regions.
Impacts of Climate Change on Food Security
Disrupted Food Production:
Extreme Weather Events: Droughts, floods, heatwaves destroy crops and livestock. Example: Indian farmers dependent on rainfall face crop failure due to erratic monsoons.
Sea Level Rise: Saltwater intrusion makes coastal farmlands infertile. Example: In Bangladesh, rising seas reduce rice production.
Reduced Nutritional Quality: Higher CO2 boosts growth but lowers protein and mineral content in wheat, rice, and other staples, reducing their nutritional value.
Water Scarcity: Changing rainfall patterns and glacier melt affect irrigation, cutting down agricultural yields.
Food Safety Threats: Warmer temperatures increase foodborne pathogens like Salmonella, leading to more cases of food poisoning.
Micronutrient Deficiencies: Decline in essential vitamins and minerals in food crops reduces diet quality, causing hidden hunger.
Child Stunting: Malnutrition caused by inadequate intake and poor quality food leads to stunted growth and weak immunity in children.
| Impact | Explanation |
|---|---|
| Disrupted Food Production | Extreme weather (droughts, floods, heatwaves) and sea level rise reduce agricultural yields. |
| Reduced Nutritional Quality | High CO2 lowers protein and minerals in crops. |
| Water Scarcity | Unpredictable rainfall and less irrigation water reduce farm output. |
| Food Safety Risks | Higher temperatures allow foodborne pathogens to thrive. |
| Micronutrient Deficiency | Less vitamins and minerals in food worsen hidden hunger. |
| Stunted Growth | Poor nutrition during childhood reduces physical and cognitive growth. |
Prelims tips
- World Bank: Food insecurity rose from 135M (2019) to 345M (2022) due to war, COVID-19, and climate change.
- Extreme weather → crop failure, sea level rise → salinization of farmland.
- Higher CO2 reduces protein/minerals in wheat, rice.
- Foodborne illnesses rise with higher temperatures.
- Stunting = poor growth in children due to malnutrition.
Mains points
- Climate change directly threatens food security through reduced crop yields, water scarcity, and crop damage from extreme events.
- Indirectly, it reduces nutritional value of food and increases risks of micronutrient deficiency.
- It worsens hidden hunger and child stunting, deepening intergenerational poverty.
- Food safety is also at risk as higher temperatures increase foodborne pathogens.
- Adaptation requires climate-resilient agriculture, better irrigation, nutrition-focused policies, and stronger global cooperation.
Malnutrition
Malnutrition means poor nutrition – it can be due to not eating enough (calorie or protein hunger), eating the wrong kind of food, or lacking essential vitamins and minerals (micronutrient deficiency). In India, malnutrition persists despite surplus food production, due to poor distribution, weak schemes, and social inequalities.
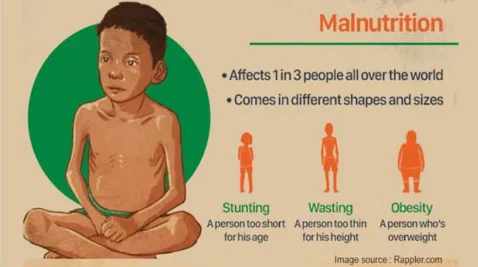
Types of Malnutrition
Calorific Deficiency: India produces enough foodgrains, but poor allocation, leakages in distribution, and underutilised budgets result in people not getting enough calories.
Protein Hunger: Pulses and eggs are key protein sources. However, budget allocation for pulses is low, and eggs are missing from Mid-Day Meal schemes in many states, reducing children's protein intake.
Micronutrient Deficiency (Hidden Hunger): Lack of vitamins and minerals such as iron, vitamin A, iodine, zinc, etc. This is common among women (especially during pregnancy) and children due to poor diet and disease.
Impacts of Malnutrition
On Individuals:
Mental and Physical Impact: Affects brain development, IQ, bones, muscles, and organs. Example: Ethiopian study showed stunted children had lower IQ in adulthood.
Weak Immunity: Malnourished children are more prone to infections and higher risk of death. WHO says malnutrition increases child deaths from preventable diseases.
On Society:
Multi-Generational Cycle: Malnourished mothers give birth to underweight babies, creating a cycle of malnutrition. UNICEF: Malnutrition causes 45% of global child deaths.
On Economy:
GDP Loss: India loses up to 4% of GDP and 8% of productivity due to child malnutrition.
Disease Burden: Malnutrition (child + maternal) accounts for 15% of India’s total disease burden. Example: A Bangladesh study linked stunting in childhood to higher diabetes risk in adulthood.
| Category | Explanation/Impact |
|---|---|
| Calorific Deficiency | Poor distribution of surplus foodgrains → not enough calories. |
| Protein Hunger | Low intake of pulses/eggs → weak muscle and child growth. |
| Micronutrient Deficiency | Lack of vitamins/minerals like iron, zinc, iodine. |
| Individual Impact | Weak IQ, low immunity, poor physical growth. |
| Societal Impact | Cycle of undernourishment; 45% of child deaths linked to malnutrition. |
| Economic Impact | 4% GDP loss, 8% productivity loss; 15% of disease burden. |
Prelims tips
- Types of malnutrition: Calorie deficiency, Protein hunger, Micronutrient deficiency (hidden hunger).
- UNICEF: Malnutrition causes 45% of child deaths globally.
- India loses 4% GDP and 8% productivity due to child malnutrition.
- NFHS data shows high levels of stunting, wasting, and underweight children.
Mains points
- Malnutrition persists in India despite food surplus due to poor distribution and weak welfare schemes.
- It includes calorie deficiency, protein hunger, and hidden hunger (micronutrients).
- Impacts are multidimensional – individual (low IQ, weak immunity), societal (intergenerational cycle), and economic (GDP/productivity loss).
- Addressing malnutrition requires better PDS, inclusion of protein (pulses, eggs), micronutrient supplementation, and awareness.
- Nutrition-sensitive policies are key to breaking the cycle of poverty and undernourishment.
Consequences of Hunger
Hunger leads to serious consequences such as micronutrient deficiencies, poor child health (stunting, wasting, zero-food children), weakened immunity, and long-term economic losses. It creates an intergenerational cycle where malnourished mothers give birth to undernourished children, deepening poverty.
Micronutrient Deficiencies
Around 2 billion people globally suffer from lack of essential vitamins and minerals (iron, iodine, zinc, vitamin A, vitamin D, folate, B12).
Women’s Health: Long-term poor diet causes anaemia and hidden hunger, especially during pregnancy and lactation.
Children: Nutritional deficiencies contribute to child deaths. In India, nearly 50–60% of preschool children and women are anaemic.
Immune System Weakness: Deficiency reduces the body’s ability to fight diseases, increasing child and maternal mortality.
Soil Quality: Continuous farming without replenishment depletes soil nutrients like zinc, iron, and boron, worsening hidden hunger.
Measures to Address Micronutrient Deficiency
Micronutrient-enriched fertilizers (e.g., foliar application, agronomic biofortification).
Soil regeneration to restore natural fertility and nutrient bioavailability.
Projects like PRADAN’s Green Transformation Pathways improving iron in crops in MP and Jharkhand.
Bio-fertilizers enriched with iron (e.g., ICAR experiment using iron sulphate in rice increased iron levels in milled rice).
Best Practice: Brazil’s ‘Fome Zero’ (Zero Hunger, 2003) improved food security, access to services, and opportunities for the poor.
Zero-Food Children in India
State-wise Problem: Uttar Pradesh (28.4%), Bihar (14.2%), Maharashtra (7.1%), Rajasthan (6.5%), MP (6%) = 2/3rd of total zero-food children.
Stunting and Wasting: As of Dec 2023, among 89.1 million children under 6 years, 36% were stunted, 17% underweight, 6% wasted (Poshan Tracker).
Economic Loss: Malnourished children have reduced earning capacity as adults, impacting GDP and national productivity.
Intergenerational Cycle: Malnourished mothers → underweight babies → repeated cycle of poverty and hunger.
| Aspect | Explanation/Example |
|---|---|
| Women’s Health | Deficiency of iron, folate, vitamin B12 leads to anaemia & hidden hunger. |
| Children | 50–60% preschool kids anaemic; nutrition deficiency contributes to child deaths. |
| Immunity | Weak immunity, higher child & maternal mortality. |
| Soil Quality | Nutrient depletion in soil (zinc, iron, boron) worsens hidden hunger. |
| Zero-Food Children | UP, Bihar, Maharashtra, Rajasthan, MP account for 2/3rd cases. |
| Child Malnutrition | 36% stunted, 17% underweight, 6% wasted (Poshan Tracker 2023). |
| Economic Impact | Reduced earning capacity; national GDP loss; cycle of poverty continues. |
Prelims tips
- WHO: Nearly 2 billion people face micronutrient deficiencies globally.
- India: 50–60% preschool children and women are anaemic.
- States with most zero-food children: UP, Bihar, Maharashtra, Rajasthan, MP.
- Poshan Tracker 2023: 36% stunted, 17% underweight, 6% wasted children.
- Brazil’s Fome Zero (2003) is a model for tackling hunger & poverty.
Mains points
- Hunger leads to micronutrient deficiencies, hidden hunger, weak immunity, and higher child/maternal mortality.
- Zero-food children problem concentrated in UP, Bihar, Maharashtra, Rajasthan, and MP.
- Child malnutrition (stunting, wasting, underweight) reduces future earning potential, perpetuating poverty.
- Soil nutrient depletion worsens hidden hunger; biofortification and soil regeneration are solutions.
- Global best practice: Brazil’s Fome Zero shows hunger requires multidimensional approach (food + services + opportunities).
Global Hunger Index (GHI) and Hunger & SDG 2
The Global Hunger Index (GHI) is an international tool that measures hunger levels in countries based on four indicators: undernourishment, child stunting, child wasting, and child mortality. In 2024, India ranked 105th out of 127 countries with a score of 27.3, which places it in the 'serious hunger' category. Hunger is closely linked to SDG 2 (Zero Hunger), where India has made progress in food production and coverage under NFSA but still struggles with malnutrition.
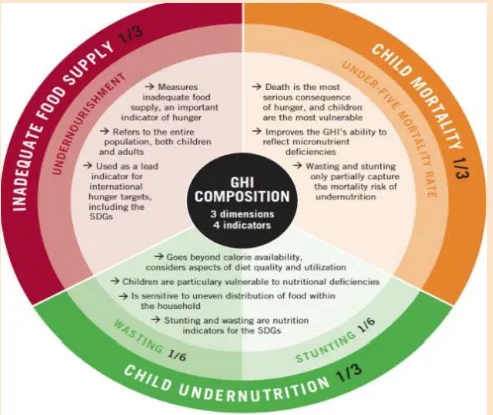
India’s Rank and Score
In 2024, India ranked 105th out of 127 countries with a score of 27.3 (serious category).
Key statistics for India:
Undernourishment: 13.7% of people do not get enough calories daily.
Child Stunting: 35.5% of children under 5 are too short for their age, showing chronic malnutrition.
Child Wasting: 18.7% of children under 5 are too thin for their height (highest in the world), showing acute malnutrition.
Child Mortality: 2.9% of children die before the age of 5, partly due to poor nutrition and unhealthy environment.
In 2023, India was ranked 111th out of 125 countries.
How GHI is Calculated?
GHI uses four equally important measures:
Undernourishment (1/3 weight): % of population with insufficient calorie intake.
Child Stunting (1/6 weight): % of children under 5 with low height for age.
Child Wasting (1/6 weight): % of children under 5 with low weight for height.
Child Mortality (1/3 weight): % of children dying before age 5.
Criticism by Indian Government
The government says GHI uses 'wrong measures of hunger'.
3 out of 4 indicators are related only to children, so they do not represent the entire population.
The undernourishment indicator is based on a very small sample survey of only 3000 people, which is not enough for a country of 1.4 billion people.
Hunger and SDG 2 (Zero Hunger)
India moved from 'Aspirant' category (poor performance) in 2020-21 to 'Performer' category in 2023-24 in the SDG India Index.
NFSA, 2013: 99.01% beneficiaries are now covered under the National Food Security Act, which provides subsidized food grains.
Agricultural Productivity: Rice and wheat yield improved from 2995 kg/ha in 2018-19 to 3052 kg/ha in 2021-22.
Farmers’ Income: Agriculture Gross Value Added (GVA) per worker increased from ₹0.71 lakh (2018-19) to ₹0.86 lakh (2022-23).
Publishers and indicators: GHI is published by Concern Worldwide and Welthungerhilfe (IFPRI was a co-publisher in earlier editions). It combines four indicators – undernourishment, child stunting, child wasting and under-five mortality.
| Indicator | Weight in GHI | India’s Status (2024) |
|---|---|---|
| Undernourishment | 1/3 | 13.7% population calorie-deficient |
| Child Stunting | 1/6 | 35.5% children under 5 stunted |
| Child Wasting | 1/6 | 18.7% children under 5 wasted (highest globally) |
| Child Mortality | 1/3 | 2.9% under-5 deaths |
Prelims tips
- GHI has 4 indicators: Undernourishment, Child Stunting, Child Wasting, Child Mortality.
- India’s wasting rate (18.7%) is the highest in the world.
- India’s rank in GHI 2024 = 105th out of 127, Score = 27.3 (Serious).
- India’s NFSA, 2013 covers 99% of beneficiaries.
- India has moved from 'Aspirant' to 'Performer' in SDG 2 category in 2023-24.
Mains points
- Despite food surplus, India continues to face a serious hunger crisis with very high rates of child malnutrition.
- Government criticizes GHI for flawed methodology, but NFHS and other national surveys also confirm high malnutrition rates.
- Hunger and malnutrition are barriers to achieving SDG 2 (Zero Hunger) by 2030.
- India has improved agricultural productivity and expanded NFSA coverage but struggles with ensuring dietary diversity and balanced nutrition.
- Policy priority must shift from food quantity to food quality and nutrition security.
Measures to Tackle Hunger and Food Security in India
Hunger in India is not just about food shortage, but also about access, nutrition, and affordability. The government, civil society, and global organisations have introduced programmes like PDS, NFSA 2013, ICDS, Mid-Day Meal, and the World Food Programme. NITI Aayog has also proposed strategies to improve nutrition. These steps aim to ensure that no person sleeps hungry and every citizen gets a balanced and nutritious diet.
Key Measures to Tackle Hunger
Social Welfare Programs: Investment in food subsidies and welfare schemes to support the poor (e.g., Public Distribution System).
Healthcare Access: Affordable healthcare reduces medical expenses, freeing more money for food (e.g., Ayushman Bharat, Matritva Sahyog Yojana).
Employment Opportunities: Skill training, literacy, and self-employment improve income and food security (e.g., PM-SVANidhi, Aajeevika Mission).
Civil Society Participation: NGOs like Akshaya Patra help in delivering mid-day meals to children.
Decentralisation: Empowering local governments for last-mile delivery (e.g., One Nation One Ration Card for migrants).
National Food Security Act (NFSA), 2013
Objective: Ensure food and nutritional security across the life cycle by providing subsidized foodgrains at affordable prices.
Coverage: 75% of rural and 50% of urban population, i.e., nearly two-thirds of India’s total population.
Entitlements: Each eligible person receives 5 kg foodgrains/month at Rs. 3 (rice), Rs. 2 (wheat), Rs. 1 (coarse grains).
Antyodaya Anna Yojana: Poorest households receive 35 kg foodgrains/month.
Beneficiaries: Identified by states, based on central government targets.
Special Provisions: Pregnant women, lactating mothers, and children (6 months–14 years) get free meals under ICDS & Mid-Day Meal schemes; maternity benefits of Rs. 6,000 are also provided.
World Food Programme (WFP)
Provides emergency food assistance, rehabilitation, and development aid.
Focuses mainly on conflict-affected countries (2/3 of its work).
Works with FAO (sustainable agriculture policies) and IFAD (rural financing).
Mission: Ensure access to food, improve nutrition, and support SDGs.
Recognition: Awarded Nobel Peace Prize 2020 for combating hunger and preventing its use as a weapon of war.
NITI Aayog’s Strategy for New India @75 (Nutrition)
State Flexibility: States should adapt nutrition schemes to local needs within the National Nutrition Mission (Poshan Abhiyaan).
Independent Audits: Annual independent audits of nutrition programmes.
Integrated Action Plans: District-level plans combining health, nutrition, and sanitation.
Local Accountability: Role of Panchayats, PDS, and health departments in implementation.
Programme Refinement: Focus on first 1000 days of a child’s life, ASHA visits, and home-based counselling.
Targeted Vaccinations: Rotavirus and Pneumococcal vaccines in high-risk districts.
Food Fortification: Mandatory fortification of staple foods, bio-fortification research to fight hidden hunger (micronutrient deficiency).
| Programme/Measure | Objective | Example |
|---|---|---|
| PDS | Provide subsidised food to poor | Rice at ₹3, Wheat at ₹2 |
| NFSA, 2013 | Ensure food and nutrition security | Covers 67% of population |
| Healthcare Schemes | Reduce expenses, free resources for food | Ayushman Bharat |
| Employment Schemes | Improve income, self-reliance | PM-SVANidhi, Aajeevika Mission |
| NGO Role | Support government in food delivery | Akshaya Patra Mid-Day Meal |
| Global Support | International aid and SDG focus | World Food Programme (WFP) |
Prelims tips
- NFSA, 2013 covers 75% rural and 50% urban population (~67% total population).
- Each person entitled to 5kg grains/month; AAY families get 35kg/month.
- WFP won Nobel Peace Prize 2020 for combating hunger in conflict areas.
- Akshaya Patra is an NGO that supports Mid-Day Meal Scheme.
- NITI Aayog strategy: first 1000 days of child’s life critical for nutrition.
Mains points
- India has surplus food but access, affordability, and nutrition remain problems.
- NFSA is a landmark law covering two-thirds of India’s population with subsidised grains.
- WFP and global cooperation play an important role in hunger reduction, especially during conflicts.
- NITI Aayog strategy stresses decentralisation, targeted nutrition, and food fortification.
- Way forward: Strengthen healthcare, diversify diets, reduce leakages in PDS, and focus on nutrition security rather than just food quantity.
Human Development Index (HDI)
The Human Development Index (HDI) is a tool that measures a country's overall achievement in its social and economic dimensions, not just its wealth. It was created to emphasize that people and their capabilities should be the ultimate criteria for assessing a country's development, not just economic growth.
What is the Human Development Index (HDI)?
Who created it? Developed by Pakistani economist Mahbub ul Haq in 1990, with contributions from Indian economist Amartya Sen.
Who publishes it? It is published annually by the United Nations Development Programme (UNDP) as part of the Human Development Report (HDR).
What it does: It ranks countries into four tiers of human development (Very High, High, Medium, Low) based on a composite score.
The Score: The HDI is a number between 0 (lowest development) and 1 (highest development).
The Three Key Dimensions of HDI
The HDI combines three basic dimensions of human development:
1. A Long and Healthy Life (Health):
Indicator: Life expectancy at birth.
Why: A long life is a basic value and is indicative of good healthcare, nutrition, and public safety.
2. Knowledge (Education):
Indicators (two are used):
Expected years of schooling: The number of years a child starting school today is expected to complete.
Mean years of schooling: The average number of years of education adults (aged 25+) have actually completed.
Why: Education is key to having choices, getting a good job, and participating in society.
3. A Decent Standard of Living (Income):
Indicator: Gross National Income (GNI) per capita (at Purchasing Power Parity - PPP).
Why: Income is not an end in itself, but it is the means to acquire basic needs like food, shelter, and other choices.
India's Performance (HDI Report 2023-24)
Rank: India was ranked 134th out of 193 countries.
Score: 0.644 (placing it in the 'Medium' human development category).
Improvement: India's score has shown steady improvement over the decades (e.g., it was 0.434 in 1990).
Key Stats for India: Life expectancy (67.7 years), Expected schooling (12.6 years), Mean schooling (6.57 years), GNI per capita (6,951).
HDI vs. GDP
GDP per capita measures only a country's economic output per person.
HDI provides a broader picture by including health and education.
A country can have a high GDP per capita but a low HDI if it fails to invest its wealth in health and education for its people.
| Dimension | Indicator | What it Measures |
|---|---|---|
| Health (स्वास्थ्य) | Life expectancy at birth | How long and healthy people live |
| Education (शिक्षा) | Expected years of schooling & Mean years of schooling | Access to knowledge and level of education |
| Standard of Living (जीवन स्तर) | GNI per capita (PPP) | Ability to purchase basic goods and services |
Prelims tips
- HDI is published by UNDP (not World Bank).
- Developed by Mahbub ul Haq (Amartya Sen contributed).
- Three Dimensions: Health, Education, Standard of Living.
- Indicators: Life Expectancy, Expected & Mean Years of Schooling, GNI per capita (PPP).
- India's Rank (2023-24 Report): 134 with a score of 0.644 (Medium development).
Mains points
- HDI provides a more holistic measure of development than GDP, focusing on human capabilities.
- India's consistent improvement in HDI score reflects progress in health, education, and income over decades.
- However, India's rank (134) indicates that progress is slow compared to other nations, and significant challenges remain in improving education quality and health outcomes.
- Limitations: HDI is an average and does not capture inequality (for which IHDI is used), gender gaps (GII), or environmental sustainability.
Public Distribution System: Evolution, Leakages and Reforms
India's Public Distribution System (PDS) is one of the world's largest food-safety nets. It moved from a universal system to Targeted PDS (1997) and then to a legal entitlement under the National Food Security Act, 2013. Since January 2024 foodgrains under NFSA are free under PM Garib Kalyan Anna Yojana for five years, while reforms like end-to-end computerisation and One Nation One Ration Card have reduced leakages.
1. Evolution
1940s: Rationing during World War II and the Bengal famine (1943).
1960s: FCI (1965) and the Agricultural Prices Commission set up; PDS expanded with Green Revolution surpluses.
1992: Revamped PDS for backward and hilly areas.
1997: Targeted PDS—different prices for BPL and APL households.
2000: Antyodaya Anna Yojana for the poorest (35 kg per family per month).
2013: NFSA—up to 75% rural and 50% urban population covered; 5 kg per person per month.
2020: PMGKAY gave additional free grain during COVID-19; from 2023–24 NFSA grain itself became free (extended for five years from 1 January 2024).
2. How the System Works
Centre procures, stores and transports grain to state depots; states identify beneficiaries, issue ration cards and run Fair Price Shops.
3. Problems
Leakages: The Shanta Kumar Committee (2015) estimated leakage of about 46% (based on 2011-12 data); later surveys show it has fallen in many states.
Exclusion and inclusion errors: Deserving households left out; ineligible ones included; outdated beneficiary lists based on 2011 Census population.
Authentication failures with biometric ePoS.
Nutrition: Focus on rice and wheat; low protein and micronutrients.
Storage losses and high economic cost of FCI operations.
4. Reforms
End-to-end computerisation, digitised ration cards seeded with Aadhaar, ePoS at shops.
One Nation One Ration Card (ONORC): National portability, especially for migrants; operational across all states/UTs.
Fortified rice through PDS and other schemes.
DBT in lieu of grain: Piloted in Chandigarh, Puducherry and parts of Dadra & Nagar Haveli (2015).
Diversification: Some states add pulses, oil and millets (e.g. Chhattisgarh, Tamil Nadu, Kerala).
5. Cash vs Kind Debate
Cash: Lower leakage and cost, choice for households. Kind: Protects against inflation, ensures food reaches women and children, supports procurement. Evidence suggests choice and local context matter.
| Year | Change |
|---|---|
| 1965 | Food Corporation of India set up |
| 1997 | Targeted PDS (BPL/APL) |
| 2000 | Antyodaya Anna Yojana |
| 2013 | National Food Security Act |
| 2020 | PMGKAY (COVID-19); ONORC rollout |
| 2024 | Free NFSA grain for five years |
Prelims tips
- PDS is jointly run: Centre procures and allocates, states distribute.
- NFSA covers up to 75% rural and 50% urban population.
- AAY households get 35 kg per family per month; priority households 5 kg per person.
- ONORC enables beneficiaries to draw rations from any fair price shop in India.
- Shanta Kumar Committee (2015) dealt with restructuring of FCI.
Mains points
- The PDS proved its value during COVID-19 by preventing mass hunger, showing the importance of a robust safety net.
- Technology has cut leakages, but exclusion through authentication failures needs offline fallbacks and grievance redress.
- Beneficiary lists based on 2011 population exclude many; updated data and dynamic inclusion are needed.
- Moving from calorie security to nutrition security requires pulses, millets, oils and fortified foods in the basket.
- Free grain raises fiscal costs and may weaken targeting; periodic review and better targeting can balance welfare and sustainability.
Did you know?
- Chhattisgarh's PDS reforms in the late 2000s (de-privatising ration shops, computerisation) became a national model.
- Tamil Nadu has run a near-universal PDS for decades.
- The Supreme Court's 'Right to Food' case (PUCL v. Union of India, from 2001) turned mid-day meals and PDS entitlements into legal rights before the NFSA.