
Indian Economy · UPSC Notes
Planning in India — UPSC Economy Notes
Free, exam-focused notes for UPSC Prelims and Mains, with Prelims tips and Mains points for every topic. 17 topics.
Open in the interactive reader: bookmarks, progress tracking and read-aloud.
Planning in India – Meaning, Process & Pre-Independence Blueprints
Economic planning means thinking ahead and organizing resources to meet clear goals for growth and welfare within a set time. In India, planning combines goal-setting (what), strategy (how), resource use (with what), and implementation/monitoring (by whom, when). Before independence, several influential blueprints—Visvesvaraya Plan, Congress/NPC Plan, Bombay Plan, Gandhian Plan, People’s Plan, and Sarvodaya Plan—shaped India’s later Five-Year Plans.
What is Planning? (Simple)
Planning = deciding goals, choosing actions, arranging resources (money, people, materials), and tracking results within a time limit.
It is a process, not a one-time event; plans can change when needs or conditions change.
Good planning needs well-defined goals, clear priorities, and optimum (best possible) use of available resources.
Economic Plan – Basic Idea
An economic plan is a set of specific economic targets (e.g., growth, jobs, inflation control, poverty reduction) to be achieved in a given period with a stated strategy.
Comprehensive plan: covers most or all sectors (agriculture, industry, services, infrastructure, social sectors).
Partial plan: focuses on a part/sector (e.g., only agriculture or only industry or only public sector).
Two Approaches to Planning
Sectoral planning: Government programmes for each sector—agriculture, irrigation, manufacturing, power, construction, transport, communication, social infrastructure (health, education), and services.
Regional planning: Reducing regional imbalances by targeting backward districts/states, improving connectivity, and placing industries where jobs are needed.
Steps in the Planning Process (Government View)
1) Choose social objectives (equity, employment, growth, price stability).
2) Set measurable targets (e.g., 7% growth, X million jobs, Y% poverty reduction).
3) Design strategy & programs (policies, schemes, budgets, timelines).
4) Allocate resources (funds, land, human resources; centre–state sharing).
5) Implement, coordinate & monitor (ministries, states, local bodies; dashboards/MIS).
6) Evaluate & course-correct (mid-term reviews; learnings feed next plan).
Why Plan at All? (Beginner Logic)
Markets alone may not provide public goods (roads, basic health/education).
To correct inequalities and ensure balanced regional development.
To use scarce resources efficiently and avoid duplication/wastage.
To align day-to-day spending with long-term national goals.
| Plan / Year | Who / Source | Core Idea | Focus Areas | Why It Mattered |
|---|---|---|---|---|
| Visvesvaraya Plan (1934) | M. Visvesvaraya, 'Planned Economy of India' | Democratic capitalism; rapid industrialisation; double national income in ~10 years | Heavy industry, productivity, modern management | First systematic blueprint; stressed efficiency & industry-led growth |
| Congress / NPC Plan (1938; reports 1948-49) | National Planning Committee chaired by J. L. Nehru | Comprehensive national plan; state guidance with social objectives | All major sectors; long-term development | Placed planning at centre of nation-building discourse |
| Bombay Plan (1944-45) | 8 leading industrialists: JRD Tata, GD Birla, et al. | Growth needs strong state intervention & regulation; big public investment | Infrastructure, heavy industry, social services | Remarkable: business leaders asking for state-led planning & welfare |
| Gandhian Plan (1944) | Sriman Narayan Agarwal (Gandhian thought) | Decentralised, village-centric economy; small & cottage industries | Agriculture, khadi, rural crafts; self-reliant villages | Counter-vision to heavy-industry bias; emphasised sustainability & dignity of labour |
| People’s Plan (1945) | M. N. Roy | Marxist socialist approach; guarantee basic necessities to all | Employment, food, health, housing | Inspired later common minimum programmes (UF 1990s; UPA 2004) |
| Sarvodaya Plan (1950) | Jayaprakash Narayan; inspired by Gandhi & Vinoba | Sarvodaya (welfare of all), trusteeship, community action | Agri & agri-based small industries, land reforms, minimal foreign dependence | Reinforced decentralised, participatory planning and rural self-reliance |
Prelims tips
- Planning = process + goals + resource optimisation + monitoring.
- Comprehensive vs Partial plans: coverage of sectors is the key difference.
- Sectoral vs Regional planning: sector programmes vs reducing regional imbalance.
- Dadabhai Naoroji (1878) advocated economic planning ideas in 'Poverty in India'.
- Match the plan & proposer: Visvesvaraya (1934), NPC/Nehru (1938), Bombay Plan (1944-45), Gandhian Plan (1944), People’s Plan (1945), Sarvodaya Plan (1950).
Mains points
- Indian planning blends growth with equity: pre-independence blueprints offered competing visions—state-led heavy industry vs decentralised village economy.
- Bombay Plan’s call for strong state role shows elite consensus for public investment in early development.
- Gandhian/Sarvodaya strands emphasised sustainability, local self-reliance, and labour-intensive livelihoods—relevant for inclusive, green growth today.
- Effective planning requires robust centre–state–local coordination, realistic targets, credible data, and mid-course corrections.
- Modern planning (post-Planning Commission) relies on outcome-based monitoring (NITI Aayog), cooperative federalism, and SDG alignment.
Major Objectives and Types of Economic Planning in India
Economic planning in India was designed to address socio-economic challenges like poverty, unemployment, inequality, and underdevelopment. It aims at achieving growth, modernisation, self-reliance, and social justice. Over time, planning evolved into different models—democratic vs totalitarian, centralised vs decentralised, directive vs indicative, financial vs physical, functional vs structural, comprehensive vs partial—each reflecting different approaches to organising and managing resources.
Major Objectives of Economic Planning
Economic Growth: Sustained rise in production, national income, and per capita income. Every Five-Year Plan set clear growth targets.
Poverty Alleviation: Numerous schemes (IRDP, MGNREGA, PMGKY, etc.) aimed to reduce poverty, as India historically had the largest number of poor in the world.
Employment Generation: Linked directly to poverty reduction. Plans encouraged labour-intensive industries, rural works, and self-employment programmes.
Controlling Inequality: Planning tried to narrow the gap between rich and poor, urban and rural, through redistribution policies, land reforms, subsidies, and progressive taxation.
Self-Reliance: Not isolation, but avoiding dependence. India encouraged domestic industry and agriculture while engaging in trade on equal footing.
Modernisation: Transforming agriculture with modern inputs (HYV seeds, irrigation, mechanisation) and adopting new technologies in industries.
Social Justice & Equality: Ensuring fair distribution of prosperity without caste, gender, or class discrimination.
Reducing Regional Disparities: Backward area programmes and special focus on underdeveloped states/regions to reduce imbalances.
Types of Economic Planning – Comparative Models
Democratic vs Totalitarian
Democratic Planning: Consultative; people, states, and private sector participate. Parliament can approve or modify plans. Example: India.
Totalitarian Planning: Entirely state-controlled; production, distribution, consumption dictated. Example: Soviet Union model.
Centralised vs Decentralised
Centralised: Single national authority designs and controls plan ('planning from above').
Decentralised: Local bodies frame plans according to local needs, without excessive central interference ('planning from below').
Planning by Direction vs Inducement
By Direction: State authority orders targets and execution (command model).
By Inducement: State uses fiscal/monetary tools (tax breaks, subsidies, incentives) to influence private choices.
Indicative vs Imperative
Indicative: Seen in mixed economies; state sets broad goals but leaves freedom to private sector (France, India after liberalisation).
Imperative: Binding targets with compulsory implementation; no consumer sovereignty. Example: China under Mao.
Financial vs Physical Planning
Financial Planning: Resources allocated in money terms (budgets, investments).
Physical Planning: Focus on real goods/resources like steel, machines, labour.
Functional vs Structural Planning
Functional: Solve immediate economic difficulties without changing system (short-term relief).
Structural: Involves deep socio-economic changes like land reforms, industrial restructuring.
Comprehensive vs Partial
Comprehensive: Covers all sectors, coordinates entire economy (India’s Five-Year Plans).
Partial: Limited to specific sectors, e.g., agricultural plans, industrial policies.
| Type | Description | Example |
|---|---|---|
| Democratic | Participatory, consultative; parliament oversight | India |
| Totalitarian | Central authority controls all activities | Soviet Union |
| Centralised | Controlled by a national planning authority | India’s early 5YPs |
| Decentralised | Local bodies plan for local needs | Kerala People’s Plan |
| By Direction | Targets ordered by state authority | USSR model |
| By Inducement | Use of subsidies, fiscal tools | Indian mixed economy |
| Indicative | Broad goals, private freedom | France, India post-1991 |
| Imperative | Rigid, compulsory targets | China (pre-reforms) |
| Financial | Resource allocation in money terms | Budgets |
| Physical | Resource allocation in real goods | Steel, coal, manpower plans |
| Functional | Solves short-term economic difficulties | Crisis-management plans |
| Structural | Deep changes in socio-economic structure | Land reforms |
| Comprehensive | All sectors covered | Five-Year Plans |
| Partial | Only some sectors covered | Agriculture-focused plans |
Prelims tips
- Objectives of planning: Growth, poverty reduction, employment, equity, self-reliance, modernisation, regional balance.
- Differentiate between centralised vs decentralised, directive vs inducement, indicative vs imperative.
- First mention of planning: Visvesvaraya (1934), Nehru’s NPC (1938).
- India’s planning is democratic, mixed, and mostly indicative after 1991.
Mains points
- Economic planning in India aimed to combine growth with social justice, unlike purely capitalist or socialist models.
- Focus was on removing poverty, unemployment, inequality, and regional imbalances.
- Planning models show a spectrum: from centralised to decentralised, directive to inducement, indicative to imperative.
- Shift after 1991: from centralised directive to more indicative and participatory planning with market alignment.
- Challenges: ensuring efficiency, inclusion, realistic targets, and reducing bureaucratic rigidities.
Central Planning in India – Central Plans & Early Five-Year Plans
Central Plans are nationwide plans formulated and funded by the Union Government. India used three major central plan instruments: Five-Year Plans, the Twenty-Point Programme, and MPLAD. Among these, Five-Year Plans were the backbone of India’s development strategy—setting goals, choosing sectors to prioritise, allocating resources, and tracking outcomes.
What are Central Plans?
Meaning: Union (Central) Government designs, funds, and implements plans for the whole country.
Major Instruments: (1) Five-Year Plans (core development blueprints), (2) Twenty-Point Programme (anti-poverty & welfare thrust), (3) MPLAD (local area works via MPs).
Five-Year Plans – Quick Primer
Why: To rebuild the economy, raise growth, reduce poverty/unemployment/inequality, modernise agriculture & industry, and ensure balanced regional development.
Who designed: Planning Commission of India (till 2014).
How: Set targets → choose strategy & sectors → allocate money → implement → monitor → review.
First Five-Year Plan (1951–56)
Vision: Rebuild a newly independent nation; stabilise the economy.
Focus: Agriculture, irrigation, power (to curb foodgrain inflation after large imports).
Model base: Harrod–Domar (savings → investment → growth), with Indian adaptations.
Notable institutions/outcomes: Start of IITs (five IITs planned/established as apex technical institutes); UGC set up; Department of Agriculture expanded research, model farms, and extension.
Growth achieved: ~3.6% (above target in a difficult starting phase).
Second Five-Year Plan (1956–61)
Focus: Rapid industrialisation—heavy industries & capital goods (machines that make machines).
Model base: Mahalanobis model (P. C. Mahalanobis) prioritising capital goods to build long-run capacity.
Challenges: Closed-economy constraints ⇒ food & capital shortages, foreign exchange crisis.
Major outcomes: Large steel plants at Bhilai, Durgapur, Rourkela; big hydro-power; TIFR & Atomic Energy Commission strengthened; higher coal output; new rail lines in the North-East.
Targets vs results: Growth ~4.27%; national income target was +25% but achieved ~20%; per-capita income up ~8%.
Third Five-Year Plan (1961–66) – ‘Gadgil Yojana’
Focus: Agriculture (especially wheat) + industry to move towards food self-sufficiency.
Strategic thinking: Influenced by ideas of John Sandy & Sukhamoy Chakravarty; Deputy Chairman D. R. Gadgil (hence ‘Gadgil Yojana’).
Shocks & setbacks: 1962 Indo–China war, 1965 Indo–Pakistan war, severe drought/famine (1965–66).
Impact: Resources diverted to defence; plan missed targets.
Growth achieved: ~2.84%.
Plan Holidays / Three Annual Plans (1966–69)
Why ‘annual plans’: Weak finances, low morale after 1962–65 conflicts, and agriculture crisis.
Emphasis: Agriculture with a new strategy (high-yielding varieties, inputs)—the Green Revolution begins to take shape.
External step: First-time borrowing from IMF; rupee devaluation (1966) to support exports.
Fourth Five-Year Plan (1969–74)
Strategy: Gadgil strategy—growth with stability and self-reliance.
Context & features: Rising double-digit inflation; high fiscal deficit; non-plan subsidies ballooned; policy tilt to nationalisation and tighter controls (e.g., 14 banks nationalised in 1969); Green Revolution picked up.
Growth achieved: ~3.33%.
Fifth Five-Year Plan (1974–79)
Prepared by: D. D. Dhar.
Focus: Poverty removal (Garibi Hatao), employment, self-reliance; tame inflation.
Key initiatives: Minimum Needs Programme, National Highway System (launch year); Twenty-Point Programme (1975); RBI given a stronger role in inflation control; wage–price policy to protect workers.
Growth achieved: ~4.8%.
Criticisms: Rising regional & socio-economic disparities; evidence of governance decay (politician–bureaucrat–criminal nexus).
Termination: Ended one year early (1978) by the Janata Party government (which replaced the Congress that launched it).
| Plan (Years) | Primary Focus | Model/Strategy | Key Institutions/Outcomes | Growth |
|---|---|---|---|---|
| I (1951–56) | Agriculture, irrigation, power | Harrod–Domar | IITs start, UGC set up, agri research & extension | ~3.6% |
| II (1956–61) | Heavy industry, capital goods | Mahalanobis | Bhilai/Durgapur/Rourkela steel, hydro, TIFR, AEC, coal & NE rail | ~4.27% |
| III (1961–66) | Food self-sufficiency + industry | Gadgil orientation; Sandy–Chakravarty ideas | Agriculture push (wheat), but wars & drought hit targets | ~2.84% |
| Annual Plans (1966–69) | Agriculture rescue; exports | Crisis mgmt; Green Revolution start | IMF borrowing; 1966 rupee devaluation | — |
| IV (1969–74) | Growth + stability + self-reliance | Gadgil strategy | 14 banks nationalised; Green Revolution deepens | ~3.33% |
| V (1974–79) | Garibi Hatao, jobs, self-reliance | D. D. Dhar framework | MNP, NH system, 20-Point (1975), RBI inflation role | ~4.8% (ended early) |
Prelims tips
- Central Plans = Five-Year Plans + 20-Point Programme + MPLAD.
- 1st Plan: agriculture focus; Harrod–Domar; ~3.6% growth; IITs/UGC.
- 2nd Plan: Mahalanobis; heavy industry; 3 steel plants; ~4.27%.
- 3rd Plan: agriculture + industry; wars (1962, 1965) + drought; ~2.84%.
- Plan Holidays (1966–69): IMF borrowing; 1966 rupee devaluation; Green Revolution starts.
- 4th Plan: bank nationalisation (1969); inflation/fiscal stress; ~3.33%.
- 5th Plan: Garibi Hatao, 20-Point (1975), MNP; ~4.8%; ended early in 1978.
Mains points
- Five-Year Plans moved from agriculture stabilisation (I) to heavy industry build-up (II), then back to food security under shocks (III, Annual Plans), and to self-reliance plus welfare (IV–V).
- Mahalanobis emphasis on capital goods created long-term industrial capacity but short-run consumer goods shortages and FX stress.
- Green Revolution’s genesis lies between the Annual Plans and IV Plan; it stabilised foodgrain output but raised regional disparities.
- Bank nationalisation (1969) reoriented credit toward priority sectors; inflation management and fiscal prudence remained persistent challenges.
- Early planning built core institutions (IITs, UGC, TIFR) alongside large basic-industry projects—laying foundations for later growth.
Central Planning (1978–2017): Rolling Plan to Twelfth Five-Year Plan
After the early Five-Year Plans, India’s central planning moved through the Rolling Plan, the reform years of the 6th–8th Plans, consolidation in the 9th–10th, ‘inclusive growth’ in the 11th, and ‘inclusive & sustainable growth’ in the 12th. The period saw major shifts: from rigid five-year blueprints to flexible rolling targets, from state-led industry to liberalisation, and from input targets to measurable outcomes.
Rolling Plan (1978–80) – What & Why (Simple)
What changed: Instead of fixing targets for a full five years, the government updated the plan every year to respond to new realities.
Three layers (flexible): (1) Annual plan (firm for the current year), (2) Medium-term rolling plan (about 3 years; updated annually), (3) Longer perspective (5–10+ years; broad direction).
Why it mattered: Could revise targets, projections, and allocations as prices, harvests, and finances changed—overcoming the rigidity of fixed five-year plans.
Politics: Launched by Janata Party (as 1978–83 sixth plan), but abandoned in 1980 when Congress returned and issued a new 6th Plan.
Sixth Plan (1980–85) – Reorientation & Early Liberalisation
Big idea: Move away from strict Nehruvian socialism; start modernisation and selective liberalisation.
Focus: Raise national income, modern tech, reduce poverty & unemployment, family planning for population control.
Institutional milestone: NABARD created on 12 July 1982 (Shivaraman Committee) for agriculture & rural development finance.
Outcome: Growth ~5.7% vs target 5.2% (outperformed).
Seventh Plan (1985–90) – Productivity & Jobs with ‘Social Justice’
Focus: Higher productivity in economy & industry (tech upgradation), more foodgrains, employment with social justice; support democratic decentralisation.
Stress fractures: By the end, external financing on hard terms and costly imports pushed BoP and fiscal deficits to unsustainable levels.
Outcome: Growth ~6% vs target 5% (beat target, but macro imbalances rose).
Annual Plans (1990–92) – Crisis Bridge & Reforms Launchpad
Context: Eighth Plan could not start due to worsening economy and political flux.
Thrust: Maximise employment and push social transformation under two Annual Plans aligned to the 8th Plan approach.
Historic shift: Liberalisation–Privatisation–Globalisation (LPG) reforms initiated (1991) to address BoP crisis and revive growth.
Eighth Plan (1992–97) – Reform Era Consolidation
First deep review of decades-old macro policies.
Core suggestions: Redefine the state’s role, give bigger role to private sector, invest in infrastructure, check non-plan spend & fiscal deficits, rationalise subsidies, decentralise planning, and promote co-operative federalism.
Policy tone: Modernisation of industry and gradual opening of the economy to correct deficits and external debt.
Outcome: Growth ~6.8% vs target 5.6% (strong over-achievement).
Ninth Plan (1997–2002) – Social Sectors & Fiscal Discipline
Backdrop: Global Asian Financial Crisis → domestic slowdown.
Social push: Emphasis on Basic Minimum Services (BMS) with extra central assistance: safe drinking water, primary health, universal primary education, housing for shelter-less poor, nutrition for children, village connectivity, stronger PDS.
Fiscal consolidation (first priority): Cut revenue deficit, rationalise subsidies/wages/pensions, levy user charges for economic services (power, transport), decentralise execution via States & PRIs.
Outcome (mixed): Plan growth ~5.4% vs target 6.5%; average annual growth ~6.7% during the period.
Tenth Plan (2002–07) – Monitorable Targets & Regional Balance
Focus: Reduce poverty ratio, generate gainful, high-quality employment, and reduce gender gaps in literacy & wages.
Approach: Regional (not just sectoral) thrust to narrow regional inequalities; Twenty-Point Programme active.
Innovation: First time ‘monitorable targets’ for 11 development indicators set for Centre and States.
Outcome: Poverty down by 5 percentage points (target met); growth ~7.6% vs target 8%.
Eleventh Plan (2007–12) – ‘Inclusive Growth’
Architect: C. Rangarajan.
Goals: Skill development; raise agri growth to 4% (achieved ~3.7%); reduce Total Fertility Rate to 2.1.
Headwinds: High inflation (>6%) → tighter credit, lower investment; stronger rupee squeezed exports; costlier food & oil (fuel subsidies burdened budget).
Outcome: Growth ~8% vs target 10% (good, but below ambition).
Twelfth Plan (2012–17) – ‘Inclusive & Sustainable Growth’
Targets (illustrative): Overall growth 9% (agri 4%); create 50 million non-farm jobs; power for all villages; safe drinking water for 50% rural population; banking access for 90% households; reduce child malnutrition (0–3 yrs); expand higher education access.
Poverty: Aim to cut poverty by 10 percentage points during the Plan (context: 29.8% BPL at end-2009–10).
Orientation: Outcomes + sustainability + inclusion (jobs, services, nutrition, human capital).
| Plan/Period | Core Focus | Key Actions/Institutions | Outcome (Growth) |
|---|---|---|---|
| Rolling Plan (1978–80) | Flexibility; annual updating | 3-tier: annual, medium (≈3y), long perspective | — |
| Sixth (1980–85) | Income, modernisation, poverty/jobs, family planning | NABARD (1982) | ~5.7% (target 5.2%) |
| Seventh (1985–90) | Productivity, tech upgrade, foodgrains, jobs with justice | Decentralisation push; but BoP/fiscal stress | ~6% (target 5%) |
| Annual Plans (1990–92) | Employment & social transformation | LPG reforms begin (1991) | — |
| Eighth (1992–97) | Redefine state role; infra; subsidy/fiscal reform; decentralise | Modernise industry; gradual opening | ~6.8% (target 5.6%) |
| Ninth (1997–2002) | BMS social services; fiscal consolidation | User charges; PRIs; stronger PDS | ~5.4% (plan) | ~6.7% avg/yr |
| Tenth (2002–07) | Poverty↓, quality jobs, gender gaps↓; regional balance | Monitorable targets (11 indicators) | ~7.6% (target 8%) |
| Eleventh (2007–12) | Inclusive growth; skills; agri 4%; TFR 2.1 | Faced inflation/strong INR/oil shock | ~8% (target 10%) |
| Twelfth (2012–17) | Inclusive & sustainable; services access | 50M non-farm jobs; power/water/banking; nutrition; HE | Target 9% (contextual outcomes) |
Prelims tips
- Rolling Plan = annual updating + medium-term rolling + long perspective; flexibility over fixed 5-year targets.
- NABARD set up in 1982 (Sixth Plan) for agri–rural development finance.
- LPG reforms launched during Annual Plans 1990–92; consolidation in Eighth Plan.
- Ninth Plan: Basic Minimum Services + fiscal consolidation (revenue deficit, subsidies, user charges).
- Tenth Plan introduced ‘monitorable targets’ for 11 indicators.
- Eleventh: ‘Inclusive growth’; Twelfth: ‘Inclusive & sustainable growth’ with service-access targets.
- Eleventh Plan (2007–12) theme: 'Towards Faster and More Inclusive Growth'; Twelfth Plan (2012–17): 'Faster, More Inclusive and Sustainable Growth' – the last Five-Year Plan.
Mains points
- Rolling Plan introduced necessary flexibility; later plans re-balanced between growth, stability, and inclusion as macro conditions shifted.
- Sixth–Eighth Plans mark the policy pivot from statism to liberalisation, while protecting social priorities.
- Ninth–Tenth Plans brought fiscal discipline and measurable governance through monitorable targets.
- Eleventh–Twelfth foregrounded inclusion, human development, and sustainability alongside growth.
- Lesson: resilient planning blends flexibility (rolling reviews), fiscal prudence, sectoral modernisation, and measurable outcomes.
Twenty-Point Programme (TPP) & MPLAD Scheme
The Twenty-Point Programme (1975, restructured later) was a central poverty alleviation and rural quality-of-life initiative, while the MPLADS (1993) scheme empowers Members of Parliament to recommend development projects in their constituencies. Both aimed to improve basic services, but faced criticisms on effectiveness, misuse, and conflict with democratic principles.
Twenty-Point Programme (TPP)
Launch & Evolution: First launched in July 1975 by Prime Minister Indira Gandhi. It was restructured in 1982, 1986, and again in 2006 (TPP-2006) to align with changing priorities and the UPA’s National Common Minimum Programme (NCMP).
Objective: Improve the quality of life of people, especially the poor and vulnerable. Aimed at direct attack on rural poverty.
Key Areas: Poverty alleviation, employment generation in rural areas, housing, education, family welfare, health, and environmental protection.
Implementation: Coordinated monitoring of central and state schemes under one umbrella.
Criticism/Decline: By 2015, the Ministry of Statistics and Programme Implementation (MOSPI) advised to wind up the programme, saying it had outlived its utility.
Member of Parliament Local Area Development Scheme (MPLADS)
Launch & Nature: Started in December 1993. It is a Central Sector Scheme (fully funded by Union Government).
Fund Allocation: Each MP is given ₹5 crore annually, released in two installments of ₹2.5 crore. Funds are meant for creating durable community assets in drinking water, education, health, sanitation, roads, etc.
Implementation:
District Magistrate (DM) is the nodal officer. He/she sanctions projects, gets work executed, and ensures maintenance of assets.
Lok Sabha MPs recommend works in their constituencies.
Rajya Sabha MPs recommend works in any district of their state.
Nominated MPs can recommend works in one state of their choice.
Criticisms of MPLADS
1. Separation of Powers:
MPs (legislators) taking part in executive work goes against democratic principle of separation of powers.
Though officially MPs only 'recommend', in practice district authorities rarely oppose them.
2. Misuse & Low Utilisation:
Many MPs did not fully utilise funds. In 16th Lok Sabha (2014–19), 93.5% MPs failed to use entire allocation.
Utilisation varied widely across states (49–90%).
3. Implementation Issues:
78% of projects were for existing assets, contrary to guideline of creating new durable assets.
Substandard works due to less material use; excess payments to contractors.
Delays: In 57% cases, work orders not issued on time (should be within 45 days).
Poor record-keeping; hard to verify existence of some assets.
4. Corruption & Favouritism:
Critics allege MPs use funds to reward opinion makers, influencers, and favoured contractors.
In some cases, contractors are relatives or close allies of MPs.
5. Against Decentralisation:
Panchayati Raj leaders argue such funds should go directly to local self-government bodies instead of MPs.
| Aspect | Twenty-Point Programme (TPP) | MPLADS |
|---|---|---|
| Launch | 1975 (restructured 1982, 1986, 2006) | 1993 |
| Nature | Centrally monitored poverty-alleviation umbrella | Central Sector Scheme; direct MP recommendations |
| Focus | Rural poverty, employment, health, housing, education | Durable community assets (water, roads, schools, health) |
| Funding | Part of central/state scheme budgets | ₹5 crore per MP per year (2 installments) |
| Criticism | Became outdated; phased out in 2015 | Misuse, corruption, conflict with separation of powers, low utilisation |
Prelims tips
- TPP launched in 1975 by Indira Gandhi; restructured 1982, 1986, 2006.
- TPP aimed at ‘direct attack’ on rural poverty.
- MPLADS launched in 1993; each MP gets ₹5 crore annually for local development.
- District Magistrate implements MPLADS projects.
- ARC criticised MPLADS as violating separation of powers.
Mains points
- TPP pioneered integrated monitoring of poverty schemes, but became outdated with evolving programme structures.
- MPLADS raised accountability issues as MPs directly influenced execution of works, blurring legislative–executive lines.
- While both aimed at grassroots development, decentralisation advocates argue funds should go directly to PRIs for true participatory planning.
- Lesson: Central schemes must balance empowerment, accountability, and local autonomy to remain effective.
Critical Evaluation of the Planning Process in India
India’s planning built core capacity (infrastructure, industry, irrigation, human capital) but struggled with weak long-term perspective, regional imbalance, over-centralisation, job-poor strategies, PSU dominance, and an industry-first bias over agriculture. Post-1991 reforms and the 73rd/74th Amendments nudged planning toward decentralisation, private participation, outcome-based monitoring, and inclusion—yet gaps remain in data quality, local finance, accountability, and execution.
Overview
Planning aimed to coordinate resources, set priorities, and deliver growth with equity. Over seven decades, it created capacity but often missed on balanced, job-rich, locally responsive development.
Lack of ‘Perspective’ in Planning
Evaluation gap: For the first several decades, India lacked a robust, independent national statistical and evaluation culture. Federal complexity delayed data, so plans were input-driven rather than evidence-driven.
Short-termism: Political uncertainty and resource constraints led to a focus on short-term targets. Long-term goals existed on paper but had weak follow-through and mid-course corrections.
Failure to Promote Balanced Regional Development
Allocation distortions: Political bargaining and varying state capacity produced uneven fund flows and project execution, entrenching regional disparities.
Recent course-correction: Backward and ‘aspirational’ districts have been prioritised, but sustained financing, capacity building, and independent monitoring remain essential.
Highly Centralised Planning
Top-down bias: Despite the National Development Council and multi-level planning rhetoric, decision-making stayed centre-heavy; local priorities were under-represented.
Post-73rd/74th shift: Panchayats and Urban Local Bodies gained constitutional status, yet weak fiscal devolution, staffing, and planning support keep local planning in its infancy.
Lopsided Employment Strategy
Capital-intensive tilt: Since the Second Plan, heavy industry and PSUs raised output but had low employment elasticity; large job needs were unmet.
Policy pivot: Reforms pushed agriculture-linked industries, MSMEs, agro-exports, and a shift from wage employment to self-employment, but skills, informality, and women’s LFPR remain bottlenecks.
Excessive Emphasis on PSUs
Monopoly & fiscal strain: Dominant PSUs in many sectors reduced competition; losses led to price hikes/cross-subsidies and fiscal burdens.
Reforms: Disinvestment, competition policy, and clearer strategic vs non-strategic classifications have improved incentives, yet PSU governance reform is uneven.
Agriculture Overshadowed by Industry
Time/resource bias: Plans highlighted agriculture but allocated more attention and resources to industry/PSUs, depressing farm incomes and spurring rural-urban migration.
Needed focus: Irrigation, storage/logistics, diversification, processing, risk management, and farmer producer organisations (FPOs) for stable, higher farm incomes.
What Improved
Institutions (IITs/UGC), core infrastructure, Green Revolution gains.
Outcome dashboards, JAM/DBT, GIS monitoring; more district-level targeting.
Persistent Gaps
Timely granular data and independent impact evaluation.
Cooperative federalism in practice: predictable untied funds and performance-linked transfers.
Last-mile capacity: project management, procurement, social audit, maintenance.
| Aspect | Strengths (What Worked) | Weaknesses (What Fell Short) |
|---|---|---|
| Capacity Creation | Steel, power, dams, roads; IIT/UGC; Green Revolution | Maintenance gaps; time/cost overruns; uneven access |
| Growth Quality | Industrial base; services surge post-1991 | Jobless/low-job growth; MSME constraints |
| Equity & Regions | Targeted welfare, DBT/JAM; focus on aspirational districts | Regional imbalance persisted; urban slums/tribal areas lag |
| Governance | Shift to outcome dashboards; GIS monitoring | Over-centralisation; weak local finance/cadre; thin evaluation culture |
| Agriculture | Input support, MSP cereals, irrigation expansion | Low value-addition/diversification; volatile farm incomes |
| PSUs & Markets | Strategic capacity, nation-building | Monopolies, inefficiency, fiscal burdens; uneven PSU reform |
Prelims tips
- Core critiques: perspective gap, regional imbalance, over-centralisation, capital-intensive/job-poor strategy, PSU dominance, agriculture overshadowed.
- 73rd/74th Amendments intended decentralised planning; success hinges on fiscal devolution and local capacity.
- Post-1991 shift: disinvestment, competition policy, outcome-based monitoring, DBT/JAM.
- Balanced growth requires formula-based transfers + capacity support to lagging regions.
Mains points
- Institutionalise perspective planning: a rolling 10–15-year vision with legally mandated five-year outcome frameworks and mid-term reviews.
- Deepen cooperative federalism: predictable untied grants, performance-linked transfers, real-time transparency portals across Centre-State-Local tiers.
- Empower local bodies: fiscal devolution, staffed planning cadres, district data observatories, mandatory social audits and asset maintenance norms.
- Jobs-first policy mix: MSMEs, labour-intensive manufacturing, services exports, care economy; raise women’s LFPR via childcare/safety/skilling.
- Agriculture to value-chains: post-harvest infra, FPOs, processing, diversified MSP/price-risk tools, climate-smart tech.
- PSU reform clarity: strategic vs non-strategic map, time-bound restructuring, independent boards, competition-neutral regulation.
- Make evaluation bite: open data, geo-tagging, third-party impact studies tied to fund release and course corrections.
Multi-level Planning in India
Multi-level Planning (MLP) means planning is not only done at the Centre; it happens at every tier—nation, state, district, block and village—with each level both guiding the level below and learning from the level above. It aims to make plans locally relevant, faster to execute, and more accountable through function sharing, fiscal and administrative decentralisation, and people’s participation.
Overview (Simple)
Multi-level Planning = planning by all tiers of government/administration, not just the Centre. India recognises five stages: National → State → District → Block → Panchayat/Village.
Centralised planning = plan is designed at the national level; lower levels mainly implement. In MLP, lower levels prepare their own plans which are then integrated upward; higher-level plans give a framework downward.
It encourages direct people’s participation, better targeting, and use of local resources.
Why Multi-level Planning?
India is diverse: needs of a tribal hamlet, hill district, and metro ward differ sharply.
Local governments know local assets, risks, priorities better (water sources, roads, schools, livelihoods).
Faster feedback: issues can be fixed at the nearest tier instead of waiting for central corrections.
Principles of MLP (Made Easy)
Function sharing: Clearly divide who does what (Centre: big infra/policy; State: sector programmes; District/Block/Panchayat: local works & delivery).
Financial decentralisation: Give funds, tax powers, and predictable grants to lower tiers so they can actually execute their plans.
Administrative decentralisation: Give staff, technical cells, and procurement powers at local levels (engineers, planners, accountants).
Public participation: Gram Sabha/ward meetings to choose works, social audit to check delivery.
Nesting/integration: Village plans aggregate to block → district → state → national plans (bottom-up), while national/state priorities guide lower tiers (top-down).
How India Adopted MLP
Late 1950s–60s: States demanded right to plan; by mid-1960s, districts began preparing plans.
1992 onward: 73rd/74th Constitutional Amendments gave Panchayats/Urban Local Bodies constitutional status—formal push to decentralised planning.
Today India recognises a five-stage MLP pipeline.
The Five Levels – Roles in Plain English
1) National/Central: Sets macro vision (growth, inclusion, climate), finances flagship schemes, frames standards; (earlier via Planning Commission, now via NITI-style guidance & Union ministries).
2) State: Adapts national priorities to state needs; makes five-year/medium-term state plans; runs departments (health, education, irrigation).
3) District: Integrates block/ULB plans; balances rural–urban needs; runs district-level schemes via DM/Zila Parishad.
4) Block: Micro-planning unit under district; identifies beneficiaries, supervises works, supports Panchayats; ideal for targeting and convergence.
5) Panchayat/Village/ULB: Prepares village/ward plans through Gram Sabha/ward committees; executes small works (water, streets, sanitation, anganwadi upkeep), monitors services.
Special Local Planning Variants
Village-level planning for everyday amenities and livelihoods.
Hill area planning for slope stability, roads, horticulture, disaster risk.
Tribal area planning for land/forest rights, minor forest produce, hostels, health outreach.
What Works Well in MLP
Plans match local realities; better identification of target groups.
Optimal use of local resources (material, labour, land).
Higher ownership & accountability when people select and monitor works.
Criticisms/Challenges (Why It Often Falls Short)
Weak integration: Ideally, village → block → district → state should fit like puzzle pieces. In practice, each tier often drafts plans in silos, so duplication or gaps occur.
Financial constraints: States/PRIs/ULBs often lack funds or timely releases, so only centrally funded items move; own-source revenues are small.
Lower-tier capacity: Many local bodies lack engineers, planners, accountants, IT systems; procurement and maintenance are weak.
People’s participation gaps: Gram Sabhas/ward meetings may be thinly attended or dominated by a few; social audits not regular.
Simple Fixes / Good Practices
Clear devolution: Notify and follow activity maps—who plans, who implements, who maintains.
Predictable finance: Formula-based untied grants + timely scheme releases; strengthen local revenue (property tax, user charges).
Capacity: District/Block Planning Cells with engineers, planners, data analysts; training for Panchayat/ULB functionaries.
Digital integration: One planning portal that aggregates village → block → district plans with GIS maps and geo-tagged assets.
Deep participation: Scheduled Gram Sabhas/ward sabhas with quorum; inclusive outreach (women, SC/ST, differently-abled, migrants).
Convergence: Map all scheme funds (rural jobs, water, health, roads) to the same village plan to avoid overlaps and fill gaps.
| Level | Core Role | Typical Works/Decisions |
|---|---|---|
| National/Central | Macro vision, funding, standards, flagship schemes | National policies, big infra, inter-state issues |
| State | Adapt national goals; allocate across departments/regions | State sector plans, health/education/irrigation priorities |
| District | Aggregate block/ULB plans; ensure balance | District roads, hospitals, school upgradation, land records |
| Block | Targeting, supervision, tech support to Panchayats | Beneficiary lists, work estimates, convergence of schemes |
| Panchayat/Village/ULB | Micro-works, O&M, local monitoring | Handpumps, drains, streets, streetlights, anganwadi repair |
| Principle | Meaning | Beginner Hint |
|---|---|---|
| Function sharing | Clear division of duties across tiers | कौन योजना बनाएगा/कौन कार्य करेगा |
| Financial decentralisation | Funds & revenue powers devolved downward | पैसा बिना अधिकार = योजना काग़ज़ पर |
| Administrative decentralisation | Staff/skills/procurement at local tiers | इंजीनियर/लेखा/आईटी टीम चाहिए |
| Public participation | Gram/ward sabhas, social audit | लोग चुनें, लोग देखें |
| Nesting/integration | Bottom-up aggregation + top-down guidance | नीचे की ज़रूरतें + ऊपर की नीति = फिट |
Prelims tips
- Five-stage MLP: National → State → District → Block → Panchayat/Village/ULB.
- Core principles: function sharing, financial & administrative decentralisation, public participation, nesting/integration.
- 73rd/74th Amendments provide constitutional backing for decentralised planning.
- Block = key micro-planning unit (from Community Development Programme era).
Mains points
- MLP’s promise is local relevance and accountability, but it needs predictable untied finance, capable local cadres, and digital plan integration to work.
- Bottom-up plans must actually aggregate upward; mandate a single digital pipeline with GIS maps and geo-tagged assets.
- Devolution should be rule-based (activity maps), not discretion-based; otherwise plans remain siloed and under-funded.
- Strengthen Gram/ward sabhas and social audits to improve project selection, quality, and maintenance.
- Promote convergence: line departments should align their budgets to the same district/block/village plan to avoid duplication and fill gaps.
Decentralised Planning in India
Decentralised planning means decisions about development are taken closer to the people—by local governments (Panchayats/Urban Local Bodies) with community participation. It aims to make plans more relevant, faster to execute, and accountable by sharing functions, funds, and functionaries across tiers, especially after the 73rd/74th Constitutional Amendments.
Overview (Beginner-friendly)
What it is: A planning process where power to plan and decide is shared across levels—village/ward, block, district, state and Centre—so that local needs shape local projects.
Why it matters: Local bodies know their own issues (water, roads, schools, livelihoods) best; they can prioritise quickly and monitor execution closely.
Key shift: Central/state planning is extra-constitutional, but after the 73rd/74th Amendments, local planning by Panchayats/Urban Local Bodies has constitutional backing (with reservations for women and SC/ST).
How Decentralised Planning Emerged (India’s journey)
Multi-level planning struggled with top-down control, weak integration, and poor local finance. This pushed reforms to legally empower local governments (73rd/74th CAA).
Today: Village/Ward plans → aggregate into Block → District → State. District Planning Committees (DPCs) integrate rural (Panchayats) and urban (ULBs) plans.
Core Ideas in Simple Terms
Function sharing: Who plans, who executes, who maintains (clear role split).
Funds: Predictable grants + local revenue powers so plans aren’t stuck on paper.
Functionaries: Staff and technical cells (engineers, planners, accountants, data/IT).
Participation: Gram/ward sabhas decide priorities; social audit checks quality.
Integration: Bottom-up aggregation with top-down guidance (policies/standards).
Advantages (with easy examples)
1) Participatory Democracy: People help decide local works (e.g., toilets, streetlights). Under Swachh Bharat (Grameen), villages choose sanitation priorities via Gram Sabhas.
2) Social Inclusion: Reservations ensure women, SC/ST, and marginalised groups are represented in decision-making; their needs enter the plan.
3) Diversification of Ideas: Different voices (youth, farmers, traders) produce well-rounded plans; Gram Sabha approval anchors Gram Panchayat Development Plans (GPDPs).
4) Better Resource Use: Locals map water bodies, commons, and skills to pick cost-effective projects (e.g., nature-based coastal protection; “One District, One Product”).
5) Improved Work Culture: Top tiers focus on policy; local tiers gain ownership and motivation—leading to faster problem-solving.
6) Crisis Response: During health or disaster events, local governments manage lockdowns, food/medicine delivery, quarantine, relief—being the first point of contact.
Typical Planning Flow (Rural & Urban)
Village/Ward: Needs list through Gram/Ward Sabha → prioritised micro-works.
Block: Consolidates village/ward lists; checks technical feasibility; aligns schemes.
District: DPC integrates Panchayat + ULB plans; balances rural–urban needs.
State: Provides policy, standards, funds; monitors outcomes.
Centre: Sets national goals/flagships; issues guidelines; devolves funds.
Common Challenges (and why they happen)
1) Integration across tiers: Plans made in silos (village/block/district) don’t always fit; duplication and gaps emerge.
2) Managing Information: Lots of data (census, surveys, participatory maps). Gram Panchayats often lack staff/IT to manage, analyse, and use this data.
3) Legal & Administrative Framework: Activity-maps (who does what) unclear; overlapping mandates cause delays.
4) Weak Capacity & Finance: Limited engineers, accountants, planners; delayed fund releases; small own-source revenues.
5) Participation Gaps: Gram/Ward Sabhas may be thinly attended; social audits irregular; elite capture can skew priorities.
Practical Fixes / Good Practices
Notify and enforce clear activity-maps (plan–execute–maintain).
Assured, formula-based untied grants + timely scheme releases; strengthen property tax/user charges (for ULBs) and local revenues (for Panchayats).
Build District/Block Planning Cells (engineering, procurement, M&E, data/GIS).
Single digital planning portal: geo-tag assets; integrate funds from all schemes; avoid overlaps.
Mandatory, well-notified Gram/Ward Sabhas with inclusion (women, SC/ST, PwD, migrants); regular social audits and public dashboards.
Convergence: Align MGNREGS, water, health, roads, livelihoods to the same local plan.
Key Institutions/Processes
District Planning Committee (DPC): Constitutional body to combine rural and urban plans at district level.
GPDP/CDP (City Development Plan): Standard formats to capture local needs, projects, budgets, timelines, and monitoring indicators.
The ‘3Fs’: Functions, Funds, Functionaries—must move together for real decentralisation.
| Year/Body | What it proposed/changed |
|---|---|
| 1951–56 (1st Plan) | Community Development Blocks → multi-tier approach idea |
| 1957 (Balwant Rai Mehta) | Village/Block/District Panchayats recommended |
| 1967 (ARC) | Local variations + resources; area-specific planning |
| 1969 (Planning Commission) | Detailed district plan guidelines; annual/medium/perspective plans |
| 1978 (M.L. Dantwala) | Block-level planning → link between village & district |
| 1983–84 (RBI/CSS) | Strengthen district plan & district credit plan |
| 1984 (Hanumantha Rao) | Devolution of functions, funds, finances; district planning bodies |
| 1985 (GVK Rao) | District Panchayat to manage rural development programmes |
| 1992 (73rd/74th CAA) | Constitutional status to PRIs/ULBs; DPCs for plan integration |
| Tier | Role | Examples |
|---|---|---|
| Village/Ward | Identify needs; micro-works; monitoring | Handpumps, drains, Anganwadi repair |
| Block | Consolidate village/ward plans; tech/estimates; convergence | Beneficiary lists, estimates, scheme mapping |
| District (DPC) | Integrate rural + urban plans; prioritise & budget | District roads, PHCs, markets, bus stands |
| State | Standards, sector policies, funds, oversight | State schemes, guidelines, capacity support |
| Centre | National vision, flagship funding, norms | Jal Jeevan, SBM, PMGSY, health/education missions |
Prelims tips
- 73rd (PRIs) & 74th (ULBs) Amendments: constitutionalised local planning; created DPCs to integrate rural–urban plans.
- 3Fs = Functions, Funds, Functionaries—devolution must move together.
- GPDP (rural) and City Development Plans (urban) are standard local planning instruments.
- DPC is key to aggregate village/ward → block → district plans.
Mains points
- Institutionalise clear activity-maps and rule-based fiscal devolution so that responsibilities and funds match at each tier.
- Build professional planning capacity at District/Block (engineering, procurement, M&E, GIS/data) and support Panchayats/ULBs.
- Adopt a single digital pipeline: village/ward to district plans; geo-tag assets; publish progress dashboards for transparency.
- Make Gram/Ward Sabhas regular, inclusive, and binding; strengthen social audits and maintenance norms.
- Ensure convergence: align line-department budgets and flagship schemes to the same locally prepared plans to reduce duplication and fill gaps.
Bodies Associated with Planning in India – Planning Commission (1950–2014)
The Planning Commission was set up by a Union Cabinet resolution on March 15, 1950 as an extra-constitutional, advisory body to steer India’s planned development. Chaired by the Prime Minister with a full-time Deputy Chairman (cabinet rank), it assessed resources, set priorities, prepared Five-Year Plans, and worked with the National Development Council (NDC) for approval and coordination. Over time it was criticised for centralisation, delays, and weak federal accommodation.
Overview
Creation: Union Cabinet Resolution, 15 March 1950; not created by the Constitution or an Act of Parliament.
Nature: Extra-constitutional and advisory, but highly influential in economic policy and public investment.
Leadership: Prime Minister as Chair; a full-time Deputy Chair (cabinet rank) as the executive head; members/advisers heading key sectors.
Relationship with NDC: National Development Council (NDC) functioned as the governing/approval forum, bringing Centre and States together to discuss and endorse plan strategies.
Core Objectives (Beginner-friendly)
Raise standard of living by efficiently using national resources.
Prepare short-, mediumand long-term plans (Five-Year Plans, Annual Plans).
Determine inter-sectoral and inter-regional priorities and align public investment accordingly.
Assess existing resources and recommend ways to augment scarce resources (domestic saving, taxation, external aid).
How It Worked (Simple Steps)
1) Resource Assessment: Gather data on population, income, savings, production, imports/exports, etc.
2) Priority Setting: Identify focus areas (e.g., agriculture, heavy industry, infrastructure, social sectors).
3) Plan Drafting: Prepare Five-Year Plan targets, strategies, and programme allocations.
4) Consultation & Approval: Discuss with ministries and States; present to NDC for broad approval.
5) Implementation & Review: Ministries/States implement; Commission monitored progress and suggested course correction.
Achievements (in simple words)
Provided a coherent national roadmap in a resource-scarce, newly independent economy.
Helped set up core industries (steel, power), large dams/irrigation, and human capital institutions (IITs, UGC).
Enabled Green Revolution-era planning, and later poverty alleviation programmes.
Key Issues/Criticisms (Made Easy)
Extra-constitutional ‘super-cabinet’ feel: Not a constitutional/statutory body, yet exercised large influence—raising federal concerns.
Centralised, ‘one-size-fits-all’ approach: States felt their diverse needs were under-reflected; bottom-up inputs were weaker.
Bureaucratic dominance: Deputed civil servants occupied pivotal planning roles, sometimes crowding out domain experts.
Delays in policy/plans: Heavy reliance on committees and protracted consultations meant plans/updates often missed timelines.
Political pressures: Plan allocations and priorities sometimes reflected political expediency rather than expert analysis.
Why These Issues Matter (For Beginners)
Centralisation can slow decisions and reduce local fit.
Weak state voice can worsen regional imbalance.
Delays mean projects cost more and deliver late benefits.
Political distortions can misallocate scarce public funds.
Evolution & Legacy (Very Brief)
Dominant planning anchor from 1950–2014 shaping public investment and national priorities.
Its strengths (national coordination) and weaknesses (centralisation/delays) informed later moves toward greater federal consultation, outcomes focus, and decentralisation.
| Aspect | Details |
|---|---|
| Legal status | Extra-constitutional, created by Union Cabinet Resolution (15 March 1950) |
| Head | Prime Minister (Chairperson) |
| Executive head | Full-time Deputy Chair (cabinet rank), plus Members/Advisers |
| Core functions | Assess resources, set priorities, prepare Five-Year Plans, allocate outlays, monitor |
| NDC link | NDC discussed/approved plan strategies; Centre–State coordination |
| Strengths | National coordination, resource focus, institution/infra building |
| Key criticisms | Centralisation, slow/delayed policy, political pressures, bureaucratic dominance |
Prelims tips
- Established by Union Cabinet Resolution on 15 March 1950 (not by Constitution/Act).
- PM = Chair; full-time Deputy Chair with cabinet rank led execution.
- Advisory body but very influential; NDC was the forum for Centre–State plan approval.
- Mandate: assess resources, set priorities, prepare Five-Year Plans, monitor outcomes.
- Critiques: centralised, extra-constitutional ‘super-cabinet’, delays, political influence.
Mains points
- Evaluate how an extra-constitutional advisory body amassed policy influence and what that meant for federalism and accountability.
- Discuss trade-offs between national coordination (scale, coherence) and local fit (state autonomy, responsiveness).
- Analyse implementation delays and committee-centrism and their effects on cost overruns and project outcomes.
- Suggest reforms that keep national strategy but strengthen state role, outcome monitoring, and independent evaluation.
NITI Aayog (2015–Present)
NITI Aayog, or the National Institution for Transforming India, was established in 2015 as the government’s premier policy think tank to replace the Planning Commission. Unlike the Planning Commission, which followed a centralised command economy model, NITI Aayog focuses on cooperative and competitive federalism, evidence-based policymaking, and providing strategic advice to both the Centre and States. It is an executive body, not a constitutional or statutory institution.
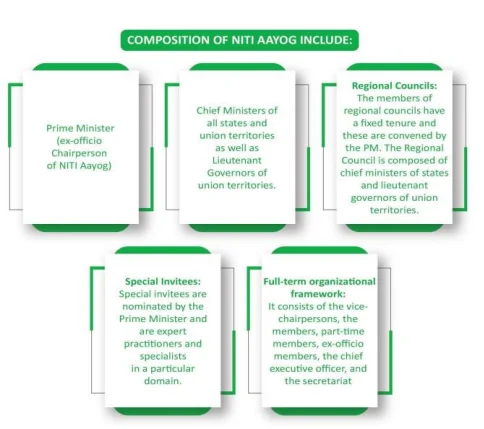
Background
During the Planning Commission era (1950–2014), India faced weaker implementation, poor monitoring, and delays in project execution.
The Planning Commission worked well in a command economy structure, but became outdated after liberalisation, privatisation, and globalisation (LPG reforms of 1991).
With the shift toward cooperative federalism (Centre + States working together) and competitive federalism (States competing to perform better), a new body was required that gave States a greater role.
India needed a policy think tank to give evidence-based advice rather than dictate expenditure and projects.
Thus, NITI Aayog was created on 1 January 2015 through an executive resolution of the Union Cabinet.
About NITI Aayog
Full name: National Institution for Transforming India (NITI Aayog).
Nature: Executive body (like Planning Commission, not statutory or constitutional).
Mandate: Provides strategic, technical, and policy advice to the Union and State governments.
Role: Acts as the think tank of the government, focusing on innovation, entrepreneurship, and long-term development strategies.
Objectives of NITI Aayog (Beginner-friendly)
Promote Cooperative Federalism → Build partnership between Centre and States, ensuring joint decision-making.
Encourage Competitive Federalism → Push States to compete with each other on reforms, ease of doing business, health, education, etc.
Develop mechanisms for bottom-up planning → Start from the village level, aggregate at block, district, state, and then national level.
Ensure inclusive growth → Pay attention to vulnerable groups such as poor households, tribals, women, and children who may not equally benefit from GDP growth.
Encourage collaboration with think tanks and academic/research organisations in India and abroad to bring best practices.
Build a knowledge and innovation ecosystem through experts, professionals, and entrepreneurs.
Key Difference from Planning Commission
Planning Commission: Allocated funds, worked in a top-down manner, controlled projects.
NITI Aayog: Provides advice, prepares indices and reports, evaluates performance, encourages reforms, but does not allocate funds.
| Aspect | Planning Commission | NITI Aayog |
|---|---|---|
| Year Established | 1950 | 2015 |
| Legal Status | Extra-constitutional, executive | Executive body (not statutory/constitutional) |
| Head | Prime Minister (Chair) | Prime Minister (Chair) |
| Role | Formulate and allocate plans; fund allocation | Policy think tank; advisory role, no fund allocation |
| Approach | Top-down, centralised | Bottom-up, cooperative + competitive federalism |
| Focus | Resource allocation, production targets | Strategic advice, reforms, innovation, SDGs |
Prelims tips
- NITI Aayog was created on 1 January 2015, replacing the Planning Commission.
- It is an executive body – neither constitutional nor statutory.
- Focus: cooperative and competitive federalism, strategic policy advice.
- Unlike Planning Commission, it does not allocate funds.
Mains points
- Discuss why Planning Commission became outdated in the liberalisation era and why NITI Aayog was necessary.
- Examine how NITI Aayog promotes cooperative and competitive federalism.
- Evaluate its effectiveness as a think tank in driving innovation, reforms, and sustainable development goals.
- Critically analyse the limitation of NITI Aayog since it lacks fund allocation powers compared to the Planning Commission.
Major Achievements of NITI Aayog
Since its creation in 2015, NITI Aayog has moved away from the top-down, fund-allocating approach of the Planning Commission. Instead, it has focused on outcome-based monitoring, cooperative and competitive federalism, innovation promotion, and providing evidence-based advice. Its initiatives have covered education, health, water, agriculture, innovation, digital payments, and more, making it a central think tank for India’s developmental journey.
Measuring State Performance and Indices
NITI Aayog introduced indices to track annual progress of States in key social sectors like health, education, and water.
This nudges states into healthy competition, sharing best practices and innovations.
Examples: School Education Quality Index, State Health Index, Composite Water Management Index, SDG Index, India Innovation Index, Export Competitiveness Index.
SATH-E (Sustainable Action for Transforming Human Capital in Education)
Launched in 2017 to create role model states in school education.
Jharkhand, Odisha, and Madhya Pradesh were selected.
Achievements: Learning enhancement programmes, teacher training, school governance reforms, accountability measures, and school consolidation.
Aspirational Districts Programme
Covers 117 backward districts of India.
Focus on health, education, agriculture, skill development, infrastructure.
UNDP praised it as a global example of localised governance for SDGs.
Reform of CPSEs (Public Sector Enterprises)
NITI Aayog recommended strategic disinvestment in multiple PSUs.
More than 30 CPSEs approved for disinvestment by the Cabinet Committee on Economic Affairs.
National and International Collaborations
NITI collaborates with think tanks, academia, and global institutions through conferences, workshops, and joint research.
Programmes: SAMAVESH (knowledge sharing), Champions of Change (industry–government dialogue).
E-Amrit portal launched as a one-stop guide for electric vehicles in collaboration with the UK government.
Long-term Vision and Action Agenda
Instead of Five-Year Plans, NITI Aayog prepared:
15-year Vision Document (till 2030).
7-year Strategy Document (2017–24).
3-year Action Agenda (2017–20).
Agricultural Reforms
Drafted Model Agricultural Land Leasing Act (2016) to secure tenant and landowner rights.
Prepared Model APMC Act 2.0 for agricultural marketing reforms.
Launched Agriculture Marketing and Farmer Friendly Reforms Index to push States toward reforms.
Digital Payments Revolution
Promoted cashless economy through awareness, advocacy, and incentives.
Constituted Committee of Chief Ministers on Digital Payments (2016).
Launched incentive schemes: Lucky Grahak Yojana and Digi Dhan Vyapar Yojana, benefiting 16 lakh consumers and merchants with ₹256 crore rewards.
Atal Innovation Mission (AIM)
To promote innovation and entrepreneurship.
Atal Tinkering Labs established in schools to foster scientific temper among students.
Atal Incubation Centres (AICs) funded with ₹10 crore each to promote start-ups and entrepreneurs.
| Initiative | Description/Outcome |
|---|---|
| State Indices | Introduced Health, Education, Water, SDG, Innovation indices for state ranking |
| SATH-E | Education reforms in Jharkhand, Odisha, Madhya Pradesh |
| Aspirational Districts | 117 districts improved using multi-stakeholder local governance |
| CPSE Reforms | Strategic disinvestment of 30+ PSUs recommended |
| Global Partnerships | E-Amrit portal, SAMAVESH, Champions of Change |
| Vision Documents | 15-year Vision, 7-year Strategy, 3-year Action Agenda |
| Agriculture Reforms | Model Land Leasing Act, Model APMC Act, Reform Index |
| Digital Payments | Lucky Grahak Yojana & Digi Dhan Vyapar Yojana |
| Atal Innovation Mission | Tinkering Labs in schools, Incubation Centres for start-ups |
Prelims tips
- Aspirational Districts Programme covers 117 districts.
- SATH-E focused on education reforms in 3 states: Jharkhand, Odisha, MP.
- E-Amrit portal created for Electric Vehicles with UK support.
- Atal Innovation Mission includes Tinkering Labs and Incubation Centres.
Mains points
- Critically analyse how NITI Aayog shifted focus from fund allocation to evidence-based policymaking.
- Evaluate the Aspirational Districts Programme as a model for inclusive development.
- Discuss how NITI Aayog promotes innovation through Atal Innovation Mission.
- Assess NITI’s role in promoting digital payments and transparent financial practices.
Criticisms of NITI Aayog and Role of Economic Advisory Council (EAC-PM)
While NITI Aayog was envisioned as a dynamic think-tank for policy innovation, it has often been criticized for acting more like a mouthpiece of the government rather than an independent advisory body. In contrast, the Economic Advisory Council to the Prime Minister (EAC-PM) functions as a more neutral body providing independent economic advice.
Criticisms of NITI Aayog
Lack of Independence: Instead of maintaining a neutral advisory role, NITI Aayog has often been accused of showering uncritical praise on government-sponsored schemes and projects.
Becoming a Mouthpiece: Many experts argue that it has lost its intellectual integrity and acts more as an implementer of government projects rather than as an independent think tank.
Weak Policy Influence: It has not been able to influence key policy decisions with long-term impact such as Demonetisation or the implementation of GST.
Failure in State Participation: One of its mandates was to enhance participation of states in policy-making, but critics point out that it has not listened adequately to state demands.
Public Participation Missing: The body was expected to involve civil society and the public in economic policy formation, which has not materialised significantly.
Limited Implementation Role: Even the Prime Minister has remarked that NITI Aayog has not sufficiently driven flagship schemes like Swachh Bharat Mission, Make in India, and Smart City projects at the state level.
No Investment Influence: Unlike the Planning Commission, NITI Aayog does not have any control over fund allocation or the power to influence private and public investments.
Conclusion on NITI Aayog
While NITI Aayog is functioning, it is not moving at the required pace.
Needs to focus more on implementation and monitoring rather than just recommendations.
Should also act as a reform advisory body, warning the government about the consequences of poor implementation and policy gaps.
Economic Advisory Council to the Prime Minister (EAC-PM)
Nature: Independent, non-constitutional, and non-statutory body set up in September 2017 with a two-year term (replacing the earlier PMEAC).
Administrative Link: Functions with NITI Aayog as its nodal agency for logistics, planning, and budgeting.
Purpose: Advises the Prime Minister directly on key economic issues like inflation, growth, industrial output, and microfinance from a neutral perspective.
Functions of EAC-PM
Highlights major economic challenges to the Government of India from an unbiased viewpoint.
Provides recommendations on macroeconomic issues such as fiscal management, employment, monetary policy, and growth strategies.
Terms of Reference
Analyse any issue referred by the Prime Minister and provide advisory notes.
Can take up issues on its own (suo-motu) or on reference by the PM or any concerned authority.
Provides reports, recommendations, and policy inputs to address short-term crises and long-term structural reforms.
| Aspect | NITI Aayog | EAC-PM |
|---|---|---|
| Nature | Executive body, advisory think tank | Independent, non-constitutional body |
| Established | 2015 (replacing Planning Commission) | 2017 (replacing PMEAC) |
| Role | Advises on policy, cooperative federalism, indices, reforms | Advises PM directly on economic issues |
| Criticism | Seen as mouthpiece of Govt, weak independence | Considered more neutral, issue-based |
| Power | No fund allocation or investment control | Advisory only, no implementation role |
Prelims tips
- NITI Aayog established in 2015; EAC-PM reconstituted in 2017.
- NITI Aayog criticised for lack of independence.
- EAC-PM functions under NITI Aayog for administrative support.
- EAC-PM is non-constitutional and purely advisory.
Mains points
- Critically examine the shortcomings of NITI Aayog in acting as an independent policy think-tank.
- Evaluate whether NITI Aayog has succeeded in enhancing cooperative federalism.
- Discuss the importance of EAC-PM in providing unbiased economic advice.
- Suggest reforms for NITI Aayog to enhance its credibility and effectiveness.
Economic Reforms in India (1991 and After)
The economic reforms of 1991 marked a turning point in India's economic history. Facing a severe balance of payments crisis, India shifted from a state-controlled, centrally planned economy to a more open, market-oriented system. These reforms were based on three pillars – Liberalisation, Privatisation, and Globalisation (LPG).
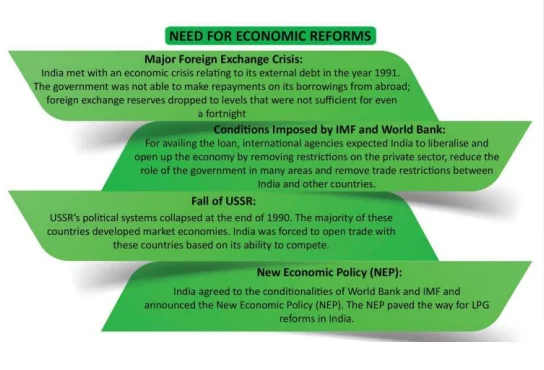
Overview of Economic Reforms
Introduced in July 1991 by then Finance Minister Dr. Manmohan Singh under Prime Minister P.V. Narasimha Rao.
The aim was to reduce government control, remove unnecessary restrictions, and make the economy more competitive globally.
Inspired by IMF and World Bank conditionalities for bailout assistance during economic crisis.
Focused on reducing fiscal deficit, increasing exports, encouraging private investment, and integrating India with the global economy.
Liberalisation (उदारीकरण)
Liberalisation means removing government restrictions and regulations to allow greater freedom to private enterprises.
It reduced the dominance of 'License-Permit-Quota Raj' that had controlled Indian industries for decades.
Major Measures under Liberalisation
1. Deregulation of Industrial Sector
Before 1991: Industrial licensing was required for almost all industries. Entrepreneurs needed government permission to start, expand, or close a business.
After 1991: Licensing abolished for most industries except for hazardous chemicals, alcohol, explosives, tobacco, aerospace, and pharmaceuticals.
2. Public vs. Private Sector
Before 1991: Private sector was restricted in many areas; only public sector could operate in core industries.
After 1991: Private sector allowed in most sectors except atomic energy and railways. (Even railways now exploring private participation).
3. Small-Scale Industry Reservations
Before 1991: Many goods were reserved for production only by small-scale industries (SSI).
After 1991: Gradual dereservation of items, allowing larger firms to produce them for efficiency and competitiveness.
4. Price Controls
Before 1991: Government fixed prices of many industrial products.
After 1991: Market forces allowed to determine prices in most industries, reducing state intervention.
Significance of Liberalisation
Encouraged competition and efficiency in industries.
Increased foreign investment and global integration.
Reduced bureaucratic delays and corruption linked to licenses.
Marked the transition from a 'command economy' to a 'market economy'.
| Aspect | Before 1991 | After 1991 |
|---|---|---|
| Industrial Licensing | Required for almost all industries | Abolished except for select industries (e.g., alcohol, explosives, pharma) |
| Private Sector Role | Restricted in many industries | Allowed in most industries except atomic energy & railways |
| Small-Scale Industries | Many goods reserved for SSI | Gradual dereservation, larger firms allowed |
| Price Control | Government-fixed prices | Prices determined by market forces |
Prelims tips
- 1991 reforms introduced LPG – Liberalisation, Privatisation, Globalisation.
- Industrial Licensing abolished for most industries after 1991.
- Private sector entry allowed in almost all industries except atomic energy and railways.
- 1991 reforms led by Dr. Manmohan Singh under PM P.V. Narasimha Rao.
Mains points
- Analyse the impact of 1991 liberalisation reforms on India’s industrial growth.
- Discuss how the end of License-Permit-Quota Raj transformed Indian entrepreneurship.
- Examine challenges that still exist despite liberalisation, such as regulatory hurdles and inequality.
- Assess how liberalisation contributed to India’s integration with the global economy.
Economic Reforms in India – Key Sectoral Reforms (Post-1991)
After the 1991 crisis, India introduced wide-ranging reforms in multiple sectors such as industry, finance, taxation, foreign exchange, trade, and investment. The focus was to increase efficiency, reduce government control, promote private participation, and integrate India into the global economy.
Deregulation of Industrial Sector
Before 1991: Industrial licensing applied to almost every industry. Entrepreneurs needed government approval to start, close, or expand a business, and many industries were reserved for the public sector or small-scale sector.
After 1991: Licensing abolished for most industries except for alcohol, cigarettes, hazardous chemicals, explosives, aerospace, electronics, and pharmaceuticals.
Private sector allowed in almost all industries except atomic energy and railways (railways are now partly open to private players).
Many goods reserved for small-scale industries were dereserved.
Price control in many industries was removed, and market forces were allowed to determine prices.
Financial Sector Reforms
Financial sector includes banks, stock exchanges, investment banks, and forex markets.
RBI’s role changed from 'controller' to 'facilitator'.
Private sector and foreign banks allowed to operate in India.
Banks that met certain criteria could open new branches without RBI approval.
Foreign Institutional Investors (FIIs) such as mutual funds, pension funds, and merchant bankers were allowed to invest in Indian markets.
Tax Reforms
Direct taxes (income tax, corporate tax) were reduced to encourage compliance and discourage tax evasion.
Corporate tax rates, which were very high earlier, were gradually lowered.
Simplification of procedures and rationalisation of rates to improve compliance.
Foreign Exchange Reforms
In 1991, rupee was devalued to boost exports and attract foreign exchange.
India adopted a 'managed floating exchange rate system' where exchange rates are largely determined by demand and supply in the market.
Trade and Investment Policy Reforms
Aimed at making Indian industries competitive and efficient by attracting foreign investment and technology.
Before 1991: Imports were tightly controlled through high tariffs and licensing. This reduced efficiency and slowed industrial growth.
After 1991:
Quantitative restrictions on imports and exports were dismantled.
Tariff rates on imports were reduced.
Import licensing was abolished except for hazardous and environmentally sensitive industries.
Export duties removed to promote Indian goods in global markets.
| Aspect | Before 1991 | After 1991 |
|---|---|---|
| Industrial Licensing | Required for almost every industry | Abolished except for select industries |
| Private Sector Role | Not allowed in many industries | Allowed in most industries (railways, atomic energy reserved) |
| Small-Scale Industries | Many goods reserved for SSI | Most dereserved, larger firms allowed |
| Price Control | Government fixed prices | Market determined prices |
Prelims tips
- Industrial licensing abolished in 1991 for most industries.
- RBI’s role shifted from regulator to facilitator after reforms.
- Rupee devalued in 1991 to address balance of payments crisis.
- Import licensing abolished except for hazardous industries.
Mains points
- Critically examine how deregulation of industries reduced the 'License Raj'.
- Analyse the impact of financial sector reforms on Indian banking and capital markets.
- Discuss how foreign exchange reforms helped India integrate with global trade.
- Evaluate the role of trade reforms in improving competitiveness of Indian industries.
Privatisation and Globalisation in India
Privatisation refers to transferring ownership or management of government enterprises to private hands, often through disinvestment or strategic sale. Globalisation is the process of increasing interdependence and integration of economies, societies, and cultures across borders. Both processes became central features of India's economic reforms after 1991.
Privatisation
Meaning: Transfer of ownership/management of government-owned companies to the private sector. Also called de-nationalisation.
Modes of Privatisation:
1. Withdrawal of government from ownership and management of PSUs.
2. Outright sale of PSUs.
Disinvestment: Selling part of government equity in PSUs to the public.
Strategic Disinvestment: Selling majority or full stake of PSUs by the government.
Rationale behind Privatisation:
Improve efficiency and performance of PSUs.
Bring financial discipline and modernisation.
Attract foreign investment (FDI).
Reduce government interference and grant autonomy to management.
Issues with Privatisation:
No reservation policy in private sector → employment challenge for SCs, STs, and OBCs.
Criticised for nepotism, inequality, and gender bias.
Private sector focuses on profit, not welfare. Example: During COVID-19, private hospitals charged very high rates, burdening patients.
Globalisation
Meaning: Process of creating interconnected networks that transcend economic, social, and geographical boundaries. It is making the world borderless.
Role of Liberalisation in Globalisation:
Reduction of import duties.
Encouragement of foreign direct investment (FDI).
Technology transfer agreements with foreign firms.
Impacts of Globalisation:
Greater integration of Indian economy with global markets.
Faster technology adoption and access to foreign capital.
Increased competition in Indian markets.
Generations of Economic Reforms
First Generation Reforms (1991–2000):
Public Sector Reforms: Disinvestment, corporatisation, steps to make PSUs profitable.
Private Sector Promotion: De-reservation, de-licensing, removal of MRTP limit, simplified environmental laws.
External Sector Reforms: Removal of quantitative import restrictions, adoption of floating exchange rate, current account convertibility, FDI permission.
Financial Sector Reforms: Changes in banking, capital market, insurance, and mutual funds.
Tax Reforms: Lowering of tax rates, simplification of tax structure, measures to reduce tax evasion.
| Aspect | Privatisation | Globalisation |
|---|---|---|
| Meaning | Transfer of ownership/management from govt to private sector | Integration of economies and societies beyond borders |
| Process | Disinvestment, strategic sale of PSUs | FDI, foreign technology, trade liberalisation |
| Objective | Improve efficiency, reduce govt role | Increase global interdependence, attract investment |
| Concerns | Equity, employment, profit focus | Cultural homogenisation, market dependence |
Prelims tips
- Privatisation = disinvestment or strategic sale of PSUs.
- Globalisation supported by liberalisation measures like lower import duties and FDI.
- First generation reforms focused on public sector, private sector, external sector, finance, and taxation.
Mains points
- Critically examine whether privatisation has improved efficiency of PSUs.
- Discuss challenges privatisation poses for social justice and employment equity.
- Analyse the role of globalisation in integrating Indian economy with world markets.
- Evaluate first generation reforms and their long-term impact on Indian growth trajectory.
Second to Fourth Generation Economic Reforms in India
Economic reforms in India progressed in stages after 1991. Second-generation reforms (2000 onwards) focused on dismantling price controls, improving PSUs, and reforming government institutions. Third-generation reforms (2002–07) emphasized inclusive growth and strengthening Panchayati Raj institutions. Fourth-generation reforms (post-2014) highlighted digitisation and IT-enabled governance. These reforms collectively impacted GDP growth, employment, agriculture, industry, fiscal balances, and foreign trade.
Second Generation Reforms (2000 onwards)
Factor Market Reforms: Dismantling Administered Price Mechanism (APM) in petroleum, sugar, fertilisers, and drugs. Now only LPG, kerosene, and urea remain under APM.
Public Sector Reforms: Greater autonomy to PSUs, strategic disinvestment, international tie-ups, and greenfield ventures.
Government Reforms: Shift from 'controller' to 'facilitator'; emphasis on fiscal consolidation, tax devolution to states, and social sector spending.
Third Generation Reforms (2002–07)
Focused on inclusive growth and empowering Panchayati Raj Institutions.
Aim: Ensure that growth benefits reach all sectors including public, private, and corporate entities.
Stronger emphasis on delivery of public goods and services.
Fourth Generation Reforms (2014 onwards)
Though unofficial, this phase refers to IT-enabled reforms.
Major focus: Digital governance, e-services, JAM Trinity (Jan Dhan-Aadhaar-Mobile), UPI, and online delivery of welfare schemes.
Digitisation linked reforms are considered to strengthen transparency, efficiency, and public service delivery.
Impact of Economic Reforms
GDP Growth: GDP growth rose from 5.6% (1980–91) to 6.4% (1992–2000) and 8.2% (2007–2012), driven largely by services sector.
Employment: GDP growth was not matched by job creation; 'jobless growth' became a concern.
Foreign Investment & Forex Reserves: FDI inflows grew from 100 million (1990–91) to 85 billion (2021–22). Forex reserves increased from 6 billion (1991) to 570 billion (2022).
Agriculture: Growth declined; public investment in irrigation, roads, and research reduced. WTO policies exposed farmers to import competition. Focus shifted to cash crops for exports, pressuring food grain prices.
Industry: Slowed down due to cheaper imports, poor infrastructure investment, and limited access to developed country markets due to non-tariff barriers.
Disinvestment: Government set annual targets (₹65,000 crore in 2022–23, ₹51,000 crore in 2023–24). Critics argue funds offset fiscal deficits rather than building PSUs or social infrastructure.
Fiscal Balances: Tariff reductions and tax incentives reduced government revenues, limiting social spending.
Foreign Trade: Exports increased, but imports grew faster, creating trade imbalances.
| Generation | Key Focus | Period |
|---|---|---|
| First Generation | Public sector, private sector, external sector, finance, tax reforms | 1991–2000 |
| Second Generation | Factor markets, PSU autonomy, governance reforms | 2000 onwards |
| Third Generation | Inclusive growth, Panchayati Raj empowerment | 2002–07 |
| Fourth Generation | Digital reforms, IT-enabled governance | 2014 onwards |
Prelims tips
- Second generation reforms dismantled Administered Price Mechanism (APM) in most commodities.
- Third generation reforms linked to inclusive growth and active Panchayati Raj role.
- Fourth generation reforms emphasised digital governance like JAM Trinity and UPI.
- Economic reforms boosted GDP but led to 'jobless growth'.
Mains points
- Evaluate the effectiveness of second-generation reforms in balancing subsidy cuts with growth.
- Critically assess the impact of WTO-related policies on Indian agriculture.
- Analyse why GDP growth has not translated into proportional employment growth.
- Discuss the role of digital reforms under fourth-generation changes in improving governance.
Hindu Rate of Growth
The 'Hindu Rate of Growth' is a term, often used critically, to describe the low average annual growth rate of India's economy before the 1991 liberalisation, which was approximately 3.5% to 4% from the 1950s to the 1980s. This slow pace was attributed to the state-controlled, mixed economy model of that era.
What is the 'Hindu Rate of Growth'?
Definition: It refers to the period from the 1950s to the 1980s when India's GDP growth stubbornly remained low, averaging around 3.5% per year, while its per capita income growth was even lower, at about 1.3%.
Who Coined It? The term was coined by Indian economist Professor Raj Krishna in 1978.
Why this Name? The name 'Hindu' does not have a religious meaning. Professor Krishna used it sarcastically to suggest that the low growth rate was so persistent and unchangeable, it seemed like it was part of India's social fabric or fate (like the Hindu belief in karma), rather than a result of specific economic policies.
Why was Growth so Slow (1950-1980)?
The slow growth was a direct consequence of the pre-1991 planning model:
1. Dominance of Public Sector: The government ran most major industries (steel, banking, aviation), many of which were inefficient and unprofitable.
2. License-Permit-Quota Raj: Heavy government control (License Raj) made it extremely difficult for private companies to start, expand, or innovate. Getting permissions took years.
3. Inward-Looking Policy (Import Substitution): India focused on producing everything domestically and heavily restricted imports through high tariffs. This protected domestic firms but made them inefficient and uncompetitive globally.
4. Low Private Investment: High taxes and complex regulations discouraged private entrepreneurs and foreign investors.
5. Low Efficiency: Lack of competition meant there was no pressure on companies (both public and private) to improve quality or reduce costs.
Breaking the Cycle
This period of low growth finally ended with the LPG (Liberalisation, Privatisation, Globalisation) reforms of 1991.
After 1991, the License Raj was dismantled, the private sector was encouraged, and foreign investment was welcomed.
As a result, India's GDP growth rate accelerated significantly, averaging 6-8% in the following decades, thus breaking free from the 'Hindu Rate of Growth'.
Recent Context (Controversy)
The term sometimes reappears in debates. For example, former RBI Governor Raghuram Rajan mentioned concerns about India potentially returning to this low-growth phase due to certain policy choices, sparking public discussion.
Prelims tips
- Hindu Rate of Growth: Refers to low ~3.5% average GDP growth in India from 1950s-1980s.
- Term coined by economist Raj Krishna in 1978.
- It is not a religious term; it sarcastically implied growth was 'fated' to be low.
- Caused by: License Raj, dominance of inefficient PSUs, and import substitution policies.
- Ended with the 1991 LPG reforms.
Mains points
- The 'Hindu Rate of Growth' illustrates the limitations of India's early state-led, inward-looking development model.
- While the model built some industrial base, it stifled efficiency, competition, and innovation, leading to decades of slow progress.
- The shift to LPG reforms in 1991 was a direct response to the failure of this model to generate adequate growth or resources.
- Understanding this period is crucial to appreciate why India embraced market-oriented reforms.