
Economics Playlist
18 chapters • 0 completed
Introduction to Economics
10 topics
National Income
17 topics
Inclusive growth
15 topics
Inflation
21 topics
Money
15 topics
Banking
38 topics
Monetary Policy
15 topics
Investment Models
9 topics
Food Processing Industries
9 topics
Taxation
28 topics
Budgeting and Fiscal Policy
24 topics
Financial Market
34 topics
External Sector
37 topics
Industries
21 topics
Land Reforms in India
16 topics
Poverty, Hunger and Inequality
24 topics
Planning in India
16 topics
Unemployment
17 topics
Chapter 11: Budgeting and Fiscal Policy
Chapter TestBudgeting and Fiscal Policy
The Budget is the government’s annual financial statement, presented under Article 112 of the Constitution. It contains estimates of income (receipts) and expenditure (spending) for the coming financial year. It guides resource allocation, reflects government priorities, and requires approval of Parliament. The Union Budget is a legal tool for efficient use of scarce resources.
The Budget is the government’s annual financial statement, presented under Article 112 of the Constitution. It contains estimates of income (receipts) and expenditure (spending) for the coming financial year. It guides resource allocation, reflects government priorities, and requires approval of Parliament. The Union Budget is a legal tool for efficient use of scarce resources.
Budget and Fiscal Policy – Key Aspects
| Aspect | Details |
|---|---|
| Definition | Annual Financial Statement (Article 112) – estimates of receipts and expenditure |
| Prepared by | Budget Division, Department of Economic Affairs, Ministry of Finance |
| Evolution | Earlier two budgets (Railway + General), merged in 2017 into one Union Budget |
| Approval Process | Demands for Grants → Appropriation Bill → Finance Bill |
| Funds | Consolidated Fund of India and Public Account of India |
Mains Key Points
Prelims Strategy Tips
Objective and Types of Budget
The Budget is not only a financial statement but also a tool for planning, allocation of resources, and ensuring legislative control over government spending. It can be of different types – balanced, surplus, deficit, zero-based, and performance-based – depending on how revenue and expenditure are managed.
The Budget is not only a financial statement but also a tool for planning, allocation of resources, and ensuring legislative control over government spending. It can be of different types – balanced, surplus, deficit, zero-based, and performance-based – depending on how revenue and expenditure are managed.
Types of Budget – At a Glance
| Type of Budget | Description | Usefulness |
|---|---|---|
| Balanced Budget | Expenditure = Revenue | Shows financial discipline |
| Surplus Budget | Revenue > Expenditure | Useful in controlling inflation |
| Deficit Budget | Expenditure > Revenue | Can promote growth if spent on development |
| Zero-Based Budget | Starts from scratch, every expense justified | Improves efficiency, avoids waste |
| Performance Budget | Links spending with outcomes | Improves accountability and prioritization |
Mains Key Points
Prelims Strategy Tips
Outcome, Participatory, and Gender Budgeting
These are modern approaches to budgeting that go beyond just spending money. Outcome Budgeting links spending with actual results, Participatory Budgeting involves citizens directly in deciding priorities, and Gender Budgeting ensures that women’s needs are specifically addressed in financial planning.
These are modern approaches to budgeting that go beyond just spending money. Outcome Budgeting links spending with actual results, Participatory Budgeting involves citizens directly in deciding priorities, and Gender Budgeting ensures that women’s needs are specifically addressed in financial planning.
Types of Modern Budgeting
| Type | Meaning | Example/Impact |
|---|---|---|
| Outcome Budget | Links money spent with measurable results and outcomes. | Health Ministry funding tied to reducing Infant Mortality. |
| Participatory Budget | Citizens directly decide local budget priorities. | Pune’s ward-level citizen budgeting. |
| Gender Budget | Analyzes spending for promoting gender equality. | Funds allocated to women’s health, education, and welfare schemes. |
Mains Key Points
Prelims Strategy Tips
Implementation of Gender Budgeting in India
Gender Budgeting in India was officially introduced in Union Budget 2005-06. It focuses on ensuring that women benefit directly from public spending. It divides allocations into women-specific schemes (100% for women) and pro-women schemes (where at least 30% of allocation is for women). Over time, India has significantly increased its gender budget, reflecting the government’s emphasis on women-led development.
Gender Budgeting in India was officially introduced in Union Budget 2005-06. It focuses on ensuring that women benefit directly from public spending. It divides allocations into women-specific schemes (100% for women) and pro-women schemes (where at least 30% of allocation is for women). Over time, India has significantly increased its gender budget, reflecting the government’s emphasis on women-led development.
Structure of Gender Budget in India
| Part | Description | Examples |
|---|---|---|
| Part A | 100% allocation for women-specific schemes | Widow Pension, Girls’ Hostel, Maternity Benefits |
| Part B | At least 30% allocation for women (Pro-women schemes) | Mid-Day Meal, Rural Livelihoods Mission, Biogas Programme |
Mains Key Points
Prelims Strategy Tips
Components of a Budget
The Government Budget is broadly divided into two accounts – Revenue Account and Capital Account. Revenue Account deals with one-way transactions such as taxes and salaries, while Capital Account deals with two-way transactions such as borrowings and asset creation. Budget receipts are further classified into Capital Receipts (which create liabilities or reduce assets) and Revenue Receipts.
The Government Budget is broadly divided into two accounts – Revenue Account and Capital Account. Revenue Account deals with one-way transactions such as taxes and salaries, while Capital Account deals with two-way transactions such as borrowings and asset creation. Budget receipts are further classified into Capital Receipts (which create liabilities or reduce assets) and Revenue Receipts.
Components of Budget Accounts
| Account | Nature | Examples |
|---|---|---|
| Revenue Account | One-way transactions (no repayment) | Taxes collected, Salaries paid |
| Capital Account | Two-way transactions (liability or asset creation) | Borrowings, Infrastructure investment |
Types of Capital Receipts
| Type | Nature | Examples |
|---|---|---|
| Debt Capital Receipts | Creates liability; must be repaid | Internal borrowings (RBI, public, savings), External borrowings (IMF, World Bank) |
| Non-Debt Capital Receipts | No liability; no repayment needed | Disinvestment proceeds, Loan recovery |
Mains Key Points
Prelims Strategy Tips
Budget Receipts and Expenditure
Government receipts are broadly classified into Capital Receipts (Debt and Non-Debt) and Revenue Receipts (Tax and Non-Tax). Government expenditure is divided into Capital and Revenue Expenditure. This classification helps in understanding how the government earns and spends money, and whether it is for asset creation or routine administration.
Government receipts are broadly classified into Capital Receipts (Debt and Non-Debt) and Revenue Receipts (Tax and Non-Tax). Government expenditure is divided into Capital and Revenue Expenditure. This classification helps in understanding how the government earns and spends money, and whether it is for asset creation or routine administration.
Classification of Receipts
| Type | Nature | Examples |
|---|---|---|
| Debt Capital Receipts | Liability; must be repaid | Borrowings from RBI, public, IMF, World Bank |
| Non-Debt Capital Receipts | No repayment liability | Disinvestment, recovery of loans |
| Tax Revenue Receipts | Collected through taxes | Income Tax, Corporate Tax, GST |
| Non-Tax Revenue Receipts | Non-tax income sources | Dividends, fees, fines, interest on loans |
Classification of Expenditure
| Type | Nature | Examples |
|---|---|---|
| Revenue Expenditure | Recurring expenses; no asset creation | Salaries, pensions, subsidies, interest payments |
| Capital Expenditure | Asset creation or liability reduction | Infrastructure projects, loan repayments |
Mains Key Points
Prelims Strategy Tips
Capital Expenditure
Capital expenditure refers to government spending that creates assets or reduces liabilities. It includes infrastructure building, purchase of assets, loans to states, and repayment of loans. Unlike revenue expenditure, capital expenditure brings long-term benefits such as improved productivity, private investment attraction, and sustainable growth.
Capital expenditure refers to government spending that creates assets or reduces liabilities. It includes infrastructure building, purchase of assets, loans to states, and repayment of loans. Unlike revenue expenditure, capital expenditure brings long-term benefits such as improved productivity, private investment attraction, and sustainable growth.
Examples of Capital Expenditure
| Type of Spending | Examples |
|---|---|
| Infrastructure | Roads, bridges, airports, railways |
| Assets | Land, machinery, government buildings |
| Investments | Shares, equity in companies |
| Loans | Loans to states and foreign governments |
| Repayment | Repaying government borrowings |
Mains Key Points
Prelims Strategy Tips
Budget Deficit and its Types
A budget deficit occurs when the government’s total expenditure exceeds its total receipts. It indicates that the government is spending more than it earns. There are different types of budget deficits such as Revenue Deficit, Effective Revenue Deficit, and Fiscal Deficit. Each type highlights different aspects of imbalance between government income and expenditure.
A budget deficit occurs when the government’s total expenditure exceeds its total receipts. It indicates that the government is spending more than it earns. There are different types of budget deficits such as Revenue Deficit, Effective Revenue Deficit, and Fiscal Deficit. Each type highlights different aspects of imbalance between government income and expenditure.
Types of Budget Deficit – Key Comparison
| Type | Definition | Formula | Key Implication |
|---|---|---|---|
| Revenue Deficit | Excess of revenue expenditure over revenue receipts | RE – RR | Indicates dissaving, borrowing needed for consumption |
| Effective Revenue Deficit | Revenue deficit minus grants used for capital assets | RD – Grants for capital assets | Shows 'true' deficit after excluding productive grants |
| Fiscal Deficit | Total expenditure minus total receipts (excluding borrowings) | TE – (RR + Non-debt CR) | Indicates overall borrowing needs and debt trap risk |
Mains Key Points
Prelims Strategy Tips
Primary Deficit, Monetised Deficit and FRBM Act, 2003
Primary Deficit measures the excess of current year’s expenditure over receipts excluding past interest payments, Monetised Deficit shows how much of deficit is financed by RBI’s money printing, and the FRBM Act, 2003 aims to control fiscal deficit and ensure financial discipline in India.
Primary Deficit measures the excess of current year’s expenditure over receipts excluding past interest payments, Monetised Deficit shows how much of deficit is financed by RBI’s money printing, and the FRBM Act, 2003 aims to control fiscal deficit and ensure financial discipline in India.
Comparison of Primary Deficit, Monetised Deficit and FRBM Act
| Concept | Definition | Formula / Rule | Key Implication |
|---|---|---|---|
| Primary Deficit | Excess of current expenditure over receipts (excluding past interest payments) | Fiscal Deficit – Interest Payments | Shows how much borrowing is for fresh spending, not past interest |
| Monetised Deficit | Part of deficit financed directly by RBI | Borrowings from RBI + Govt. balance drawdown | Represents money printing; can cause inflation |
| FRBM Act, 2003 | Law for fiscal discipline and deficit control | Limit FD to 3% of GDP; Debt: Centre 40%, Total 60% | Ensures sustainable borrowing with flexibility during crises |
Mains Key Points
Prelims Strategy Tips
Fiscal Responsibility and Budget Management (FRBM) Act, 2003 — with 2024-25 Update
The FRBM Act aims to bring financial discipline by reducing deficits and debt. In FY 2024-25, India achieved a fiscal deficit of 4.8% of GDP, aligning with revised targets. The journey towards FRBM targets continues with updated metrics.
The FRBM Act aims to bring financial discipline by reducing deficits and debt. In FY 2024-25, India achieved a fiscal deficit of 4.8% of GDP, aligning with revised targets. The journey towards FRBM targets continues with updated metrics.
Comparison of Key Fiscal Indicators: FY 2023-24, FY 2024-25, FY 2025-26 (Projected)
| Indicator | FY 2023-24 (Actual / BE) | FY 2024-25 (Revised / Actual) | FY 2025-26 (Target / BE) |
|---|---|---|---|
| Fiscal Deficit (% of GDP) | 5.9% (BE) | 4.8% (RE) :contentReference[oaicite:26]{index=26} | 4.4% (Target) :contentReference[oaicite:27]{index=27} |
| Revenue Deficit (% of GDP) | 1.8% (BE) | 1.9% (RE) :contentReference[oaicite:28]{index=28} | 1.5% (Target) :contentReference[oaicite:29]{index=29} |
| Primary Deficit (% of GDP) | 1.4% (BE) | 1.3% (RE) :contentReference[oaicite:30]{index=30} | 0.8% (Target) :contentReference[oaicite:31]{index=31} |
| Central Govt Debt-to-GDP | — | ~56.1% (Projected) :contentReference[oaicite:32]{index=32} | — |
FRBM Act – Key Aspects
| Aspect | Details |
|---|---|
| Year of Enactment | 2003 |
| Main Objective | Ensure fiscal discipline, reduce deficits, and promote transparency |
| Targets | Fiscal deficit 3% of GDP, Debt-to-GDP ratio Centre 40%, States 20% |
| Amendments | 2004, 2012, 2015, 2018 (major changes in targets and timelines) |
| Escape Clause | Allows deviation in case of war, crisis, economic slowdown |
| NK Singh Committee | Recommended debt-to-GDP as anchor, Fiscal Council, strict limits on borrowing |
Mains Key Points
Prelims Strategy Tips
Deficit Financing (India) — History, Methods, Pros & Cons
Deficit financing means meeting the government’s excess spending (expenditure > receipts) by using outside resources. India historically used central bank money creation (till 1997) and now mainly uses borrowing (market loans, small savings, external loans) and temporary cash support via Ways and Means Advances (WMA).
Deficit financing means meeting the government’s excess spending (expenditure > receipts) by using outside resources. India historically used central bank money creation (till 1997) and now mainly uses borrowing (market loans, small savings, external loans) and temporary cash support via Ways and Means Advances (WMA).
Timeline & Tools of Deficit Financing in India
| Phase/Tool | What It Meant | Impact/Risk | Today’s Status |
|---|---|---|---|
| Ad-hoc Treasury Bills (Pre-1997) | RBI directly funded govt by creating money | Higher money supply, inflation risk; weak monetary autonomy | Abolished in 1997 |
| Ways & Means Advances (WMA) | Short-term, capped overdraft from RBI to manage cash gaps | Bridges timing mismatch; not for long-term funding | Active—rules/caps apply |
| Internal Borrowing (G-Secs, T-Bills) | Market loans from banks, funds, households | Large borrowings may crowd out private sector | Primary source |
| Small Savings/Provident Funds | Household savings mobilised via schemes | Higher cost than market at times; stable base | Supplementary source |
| External Borrowing | Loans in foreign currency from multilaterals/markets | FX risk; global cycles matter; can diversify | Limited share, used prudently |
| Disinvestment/Asset Monetisation | Sell/lease govt assets to raise non-debt receipts | Market-timing risk; execution complexity | Used to reduce borrowing need |
Key Terms at a Glance
| Term | Plain Meaning | Why It Matters |
|---|---|---|
| Fiscal Deficit | Spending minus non-borrowed receipts | Equals net borrowing need |
| Primary Deficit | Fiscal deficit minus interest payments | Shows current policy gap excluding past debt costs |
| Monetised Deficit | Increase in RBI credit to govt | Inflation risk; now constrained |
| Crowding Out | Govt borrowing pushes up interest rates | Private loans become costlier |
| WMA | Short-term RBI overdraft to govt | Smoothens cash timing; not for long-term |
Mains Key Points
Prelims Strategy Tips
Monetization of Deficit
Monetization of deficit means financing the government’s fiscal deficit by printing new money (non-debt financing) rather than borrowing, so that public debt does not rise. In practice, this involves the central bank (RBI in India) creating money to meet government expenditure. It can be done either directly (RBI prints money and buys bonds directly from government) or indirectly (RBI buys bonds from secondary market via Open Market Operations).
Monetization of deficit means financing the government’s fiscal deficit by printing new money (non-debt financing) rather than borrowing, so that public debt does not rise. In practice, this involves the central bank (RBI in India) creating money to meet government expenditure. It can be done either directly (RBI prints money and buys bonds directly from government) or indirectly (RBI buys bonds from secondary market via Open Market Operations).
Direct vs Indirect Monetisation
| Aspect | Direct Monetisation | Indirect Monetisation (OMO) |
|---|---|---|
| Who decides money supply? | Government decides (borrowing need) | RBI decides (monetary policy) |
| Market Involvement | No – RBI buys directly from govt | Yes – RBI buys from investors in secondary market |
| Risk of Inflation | High, uncontrolled by RBI | Moderate, controlled by RBI |
| Status in India | Stopped in 1997, allowed only in emergencies | Regular tool of monetary policy |
| Impact on RBI Independence | Reduced | Maintained |
Mains Key Points
Prelims Strategy Tips
Impact of Deficit Financing & Public Debt
Deficit financing refers to covering government expenditure by printing new money or borrowing, which can cause inflation, affect investments, increase inequalities but also support capital formation. Public debt is the total amount borrowed by the government, both internal and external, to meet its expenditure needs. While classical economists opposed it, Keynes argued that debt-financed spending can generate employment and growth.
Deficit financing refers to covering government expenditure by printing new money or borrowing, which can cause inflation, affect investments, increase inequalities but also support capital formation. Public debt is the total amount borrowed by the government, both internal and external, to meet its expenditure needs. While classical economists opposed it, Keynes argued that debt-financed spending can generate employment and growth.
Public Debt – Sources and Nature
| Type | Details |
|---|---|
| Internal Debt | Borrowed within country via bonds, treasury bills, savings funds, financial institutions. |
| External Debt | Borrowed from World Bank, IMF, IDA, IFC etc., repayable in foreign currency. |
| Short-term | Treasury bills (less than 1 year). |
| Long-term | Government bonds and State Development Loans (SDLs). |
Mains Key Points
Prelims Strategy Tips
Different Aspects of Public Debt
Public debt is a double-edged sword. On one hand, it helps finance infrastructure, education, health, and technology, thereby supporting economic growth. On the other, excessive debt can fuel inflation, burden future generations with taxes, and reduce private investment. India’s debt-to-GDP ratio remains lower than global averages, showing resilience, though fiscal prudence is essential.
Public debt is a double-edged sword. On one hand, it helps finance infrastructure, education, health, and technology, thereby supporting economic growth. On the other, excessive debt can fuel inflation, burden future generations with taxes, and reduce private investment. India’s debt-to-GDP ratio remains lower than global averages, showing resilience, though fiscal prudence is essential.
Public Debt – Pros and Cons
| Aspect | Details |
|---|---|
| Positive Impact | Funds infrastructure, education, health; creates jobs; improves technology and skills; strengthens forex reserves. |
| Negative Impact | Causes inflation; burdens future taxpayers; risks sovereignty with external loans; crowds out private investment. |
India vs Global Debt-to-GDP Ratios
| Country | Debt-to-GDP Ratio |
|---|---|
| India | 170% (2021) |
| United States | 264% |
| United Kingdom | 257% |
| France | 345% |
| Japan | 426% |
| China | 295% |
| Global Average | 248% |
Mains Key Points
Prelims Strategy Tips
Reasons for Higher Public Debt in India and Sustainability Measures
India’s public debt is high due to factors like bank recapitalisation, low tax-to-GDP ratio, and loopholes in the tax system. To ensure debt sustainability, India must privatise loss-making PSUs, improve tax collection through GST expansion, adopt public-private partnerships, and invest in infrastructure and human capital. The FRBM Act sets a long-term target of reducing debt-to-GDP ratio to 60% (40% Centre + 20% States).
India’s public debt is high due to factors like bank recapitalisation, low tax-to-GDP ratio, and loopholes in the tax system. To ensure debt sustainability, India must privatise loss-making PSUs, improve tax collection through GST expansion, adopt public-private partnerships, and invest in infrastructure and human capital. The FRBM Act sets a long-term target of reducing debt-to-GDP ratio to 60% (40% Centre + 20% States).
Reasons for Higher Public Debt in India
| Reason | Explanation |
|---|---|
| Bank Recapitalisation | ₹80,000 crore recapitalisation bonds in 2017–18 raised debt levels. |
| Low Tax-to-GDP Ratio | Tax-to-GDP ratio is around 10–11%, much lower than global peers. |
| Imperfect Tax System | High tax evasion due to loopholes reduces revenue collection. |
Debt-to-GDP Ratio Targets (FRBM Act)
| Entity | Target Ratio |
|---|---|
| Central Government | 40% of GDP |
| State Governments | 20% of GDP |
| Combined (Centre + States) | 60% of GDP |
Mains Key Points
Prelims Strategy Tips
Recent Changes in Indian Budgeting
In recent years, India has made important changes to the budgeting process such as advancing the Union Budget presentation to February 1 and merging the separate Railway Budget with the Union Budget. These reforms aim to improve efficiency, speed up infrastructure projects, and present a holistic financial picture of the government.
In recent years, India has made important changes to the budgeting process such as advancing the Union Budget presentation to February 1 and merging the separate Railway Budget with the Union Budget. These reforms aim to improve efficiency, speed up infrastructure projects, and present a holistic financial picture of the government.
Recent Budgeting Reforms – Pros and Cons
| Reform | Advantages | Disadvantages |
|---|---|---|
| Advancement of Budget (2017) | Eliminates Vote on Account; More time for states; Faster project execution | Incomplete revenue/expenditure data; Uncertain monsoon impact |
| Merger of Railway Budget (2017–18) | Holistic financial picture; Better resource allocation; No dividend burden on Railways | Railways may lose commercial nature; Revenue cuts if budget shortfalls occur |
Mains Key Points
Prelims Strategy Tips
Ending of Plan and Non-Plan Classification in Budgeting
From 2017–18, the Government of India ended the distinction between Plan and Non-Plan expenditure. All expenditure is now classified as either Revenue or Capital spending. This reform was aimed at simplifying budgeting, improving transparency, and linking expenditure more directly to outcomes.
From 2017–18, the Government of India ended the distinction between Plan and Non-Plan expenditure. All expenditure is now classified as either Revenue or Capital spending. This reform was aimed at simplifying budgeting, improving transparency, and linking expenditure more directly to outcomes.
Shift from Plan/Non-Plan to Revenue/Capital
| Old Classification | New Classification | Issues Resolved |
|---|---|---|
| Plan Expenditure | Capital Expenditure | Removes bias, tracks asset creation |
| Non-Plan Expenditure | Revenue Expenditure | Removes misconception of 'non-developmental' spending |
Mains Key Points
Prelims Strategy Tips
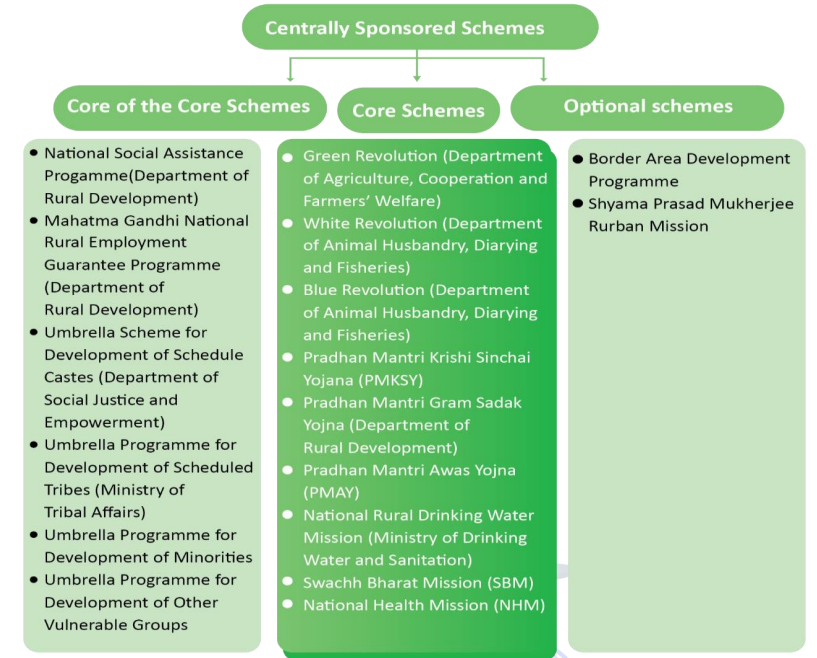
Rationalisation of Centrally Sponsored Schemes (CSS)
Centrally Sponsored Schemes (CSS) are those schemes where both the Central Government and the State Governments share the cost of implementation. They aim to supplement the efforts of state governments, ensure uniform development across regions, and address issues that fall under the State List but need central support. Rationalisation means reducing duplication, categorising schemes into Core, Core of Core, and Optional, and ensuring better cooperation under the spirit of Cooperative Federalism.
Centrally Sponsored Schemes (CSS) are those schemes where both the Central Government and the State Governments share the cost of implementation. They aim to supplement the efforts of state governments, ensure uniform development across regions, and address issues that fall under the State List but need central support. Rationalisation means reducing duplication, categorising schemes into Core, Core of Core, and Optional, and ensuring better cooperation under the spirit of Cooperative Federalism.
Centrally Sponsored Schemes – Classification
| Category | Details | Examples |
|---|---|---|
| Core Schemes | Joint Centre-State schemes under National Development Agenda | PM Gram Sadak Yojana, Green Revolution |
| Core of Core | Fully funded by Centre, focus on social protection & inclusion | Umbrella Scheme for SCs, Minorities |
| Optional Schemes | States can choose; lump sum funds allocated | Border Area Development Programme |
Mains Key Points
Prelims Strategy Tips
Rationalisation of Centrally Sponsored Schemes (CSS)
Centrally Sponsored Schemes (CSS) are programmes designed by the Central Government but implemented by States. Over the years, their number grew very large, leading to duplication, overlapping responsibilities, and wastage of money. To fix this, different committees (like the Chaturvedi Committee) and the 15th Finance Commission recommended reducing, merging, and simplifying these schemes. Recent Union Budgets have rationalised schemes into fewer umbrella schemes, so that resources are used more effectively and benefits reach people faster.
Centrally Sponsored Schemes (CSS) are programmes designed by the Central Government but implemented by States. Over the years, their number grew very large, leading to duplication, overlapping responsibilities, and wastage of money. To fix this, different committees (like the Chaturvedi Committee) and the 15th Finance Commission recommended reducing, merging, and simplifying these schemes. Recent Union Budgets have rationalised schemes into fewer umbrella schemes, so that resources are used more effectively and benefits reach people faster.
Rationalisation of CSS – Major Milestones
| Year/Committee | Recommendation/Action |
|---|---|
| 2014 – Chaturvedi Committee | Reduce 147 schemes to 66 to remove duplication |
| 2015 – NITI Aayog Sub-Group | Suggested dividing CSS into Core, Core of Core, and Optional |
| 2018 – Samagra Shiksha | Merged 3 education schemes into one integrated scheme |
| 2022–23 Budget | 130 schemes rationalised into 65 umbrella schemes |
| 15th Finance Commission | Minimum budget threshold and discontinuation of small schemes |
Mains Key Points
Prelims Strategy Tips
Central Sector Schemes (CSS) vs Centrally Sponsored Schemes (CSSs)
Central Sector Schemes are fully funded and implemented by the Union Government, while Centrally Sponsored Schemes are funded partly by the Centre and partly by the States, but implemented by State Governments. This division is based on the Union List and State List subjects of the Indian Constitution.
Central Sector Schemes are fully funded and implemented by the Union Government, while Centrally Sponsored Schemes are funded partly by the Centre and partly by the States, but implemented by State Governments. This division is based on the Union List and State List subjects of the Indian Constitution.
Central Sector vs Centrally Sponsored Schemes
| Aspect | Central Sector Schemes | Centrally Sponsored Schemes |
|---|---|---|
| Funding | 100% by Union Government | Shared by Centre and States (60:40, 80:20, 90:10) |
| Implementation | By Union Government ministries/agencies | By State Governments/agencies |
| Scope | Union List subjects (defence, telecom, atomic energy) | State List subjects (health, education, rural jobs) |
| Classification | No subcategories | Core, Core of Core, Optional |
| Examples | BharatNet, Namami Gange, Stand Up India | MGNREGA, PM Gram Sadak Yojana, Mid-Day Meal Scheme |
Mains Key Points
Prelims Strategy Tips
Public Financial Management System (PFMS)
PFMS is a web-based financial management platform developed by the Controller General of Accounts (CGA) under the Ministry of Finance. It was created to track fund flows, ensure real-time reporting, and enable transparency in the use of public money, especially for government schemes. It is a key part of the Government of India’s Digital India initiative.
PFMS is a web-based financial management platform developed by the Controller General of Accounts (CGA) under the Ministry of Finance. It was created to track fund flows, ensure real-time reporting, and enable transparency in the use of public money, especially for government schemes. It is a key part of the Government of India’s Digital India initiative.
PFMS – Key Aspects
| Aspect | Details |
|---|---|
| Launched | 2009, expanded in 2013 |
| Developed by | Controller General of Accounts (CGA), Ministry of Finance |
| Purpose | Tracking fund flow, direct benefit transfers, real-time monitoring |
| Technology | Web-based system integrated with banks' Core Banking Solutions |
| Recent Reform | SNA Dashboard (2022) for CSS fund monitoring |
Mains Key Points
Prelims Strategy Tips
Fiscal Policy
Fiscal policy refers to the use of government spending, taxation, and borrowing to influence the economy. It is a key tool for managing economic growth, controlling inflation, reducing inequalities, and stabilising the balance of payments. In India, fiscal policy has been shaped by both developmental goals and the need for macroeconomic stability.
Fiscal policy refers to the use of government spending, taxation, and borrowing to influence the economy. It is a key tool for managing economic growth, controlling inflation, reducing inequalities, and stabilising the balance of payments. In India, fiscal policy has been shaped by both developmental goals and the need for macroeconomic stability.
Difference between Fiscal Policy and Monetary Policy
| Aspect | Fiscal Policy | Monetary Policy |
|---|---|---|
| Authority | Government of India (Ministry of Finance) | Reserve Bank of India (RBI) |
| Main Tools | Taxes, Government spending, Borrowings | Repo rate, CRR, SLR, Open Market Operations |
| Focus | Growth, inequality reduction, fiscal balance | Inflation control, money supply, credit stability |
| Time Frame | Medium to long-term impact | Short to medium-term impact |
| Nature | Political decisions through budget | Technical/economic decisions by RBI |
Mains Key Points
Prelims Strategy Tips
Types of Fiscal Policy
Fiscal Policy refers to the use of government spending and taxation to influence a nation's economy. It is mainly of three types: Expansionary, Contractionary, and Neutral. These policies are used to manage growth, employment, and inflation.
Fiscal Policy refers to the use of government spending and taxation to influence a nation's economy. It is mainly of three types: Expansionary, Contractionary, and Neutral. These policies are used to manage growth, employment, and inflation.
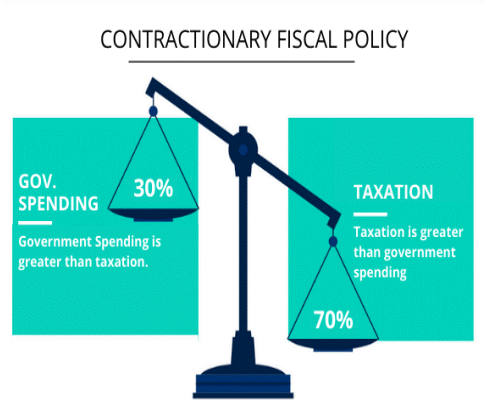
Types of Fiscal Policy – Key Aspects
| Type | Explanation | Objective |
|---|---|---|
| Expansionary | Govt increases spending and reduces taxes. | Boost growth, demand, and jobs. |
| Contractionary | Govt reduces spending or increases taxes. | Control inflation and reduce demand. |
| Neutral | Govt spends equal to its revenue from taxes. | Maintain balance in economy. |
Mains Key Points
Prelims Strategy Tips
Cyclicality of Fiscal Policy
Cyclicality of fiscal policy refers to how government adjusts its spending and taxation according to the ups and downs of the economy. It can be counter-cyclical (moving against the cycle to stabilize economy) or pro-cyclical (moving with the cycle, which may worsen fluctuations).
Cyclicality of fiscal policy refers to how government adjusts its spending and taxation according to the ups and downs of the economy. It can be counter-cyclical (moving against the cycle to stabilize economy) or pro-cyclical (moving with the cycle, which may worsen fluctuations).
Cyclicality of Fiscal Policy – Key Aspects
| Type | Explanation | Impact |
|---|---|---|
| Counter-cyclical | Moves against economic trend; spends more in recessions, less in booms. | Stabilizes economy; reduces unemployment & inflation swings. |
| Pro-cyclical | Moves with economic trend; spends more in booms, less in recessions. | Worsens fluctuations; increases risks of high inflation & unemployment. |
Mains Key Points
Prelims Strategy Tips
Chapter Complete!
Ready to move to the next chapter?