
Economics Playlist
18 chapters • 0 completed
Introduction to Economics
10 topics
National Income
17 topics
Inclusive growth
15 topics
Inflation
21 topics
Money
15 topics
Banking
38 topics
Monetary Policy
15 topics
Investment Models
9 topics
Food Processing Industries
9 topics
Taxation
28 topics
Budgeting and Fiscal Policy
24 topics
Financial Market
34 topics
External Sector
37 topics
Industries
21 topics
Land Reforms in India
16 topics
Poverty, Hunger and Inequality
24 topics
Planning in India
16 topics
Unemployment
17 topics
Chapter 16: Poverty, Hunger and Inequality
Chapter TestPoverty – Concept, Dimensions and Facts
Poverty means a condition where a person or family does not have enough resources to meet basic needs like food, clothing, shelter, healthcare, and education. It is not just about lack of money, but also about lack of opportunities, security, and dignity. Eradicating poverty is a global human right and one of the Sustainable Development Goals (SDGs).
Poverty means a condition where a person or family does not have enough resources to meet basic needs like food, clothing, shelter, healthcare, and education. It is not just about lack of money, but also about lack of opportunities, security, and dignity. Eradicating poverty is a global human right and one of the Sustainable Development Goals (SDGs).
Poverty – Key Aspects
| Aspect | Details |
|---|---|
| Definition | Lack of resources to meet basic needs and dignity of life |
| UN Definition | Persistent deprivation of resources, opportunities, and rights |
| Global Standard | Extreme poverty = <$2.15 per day (World Bank) |
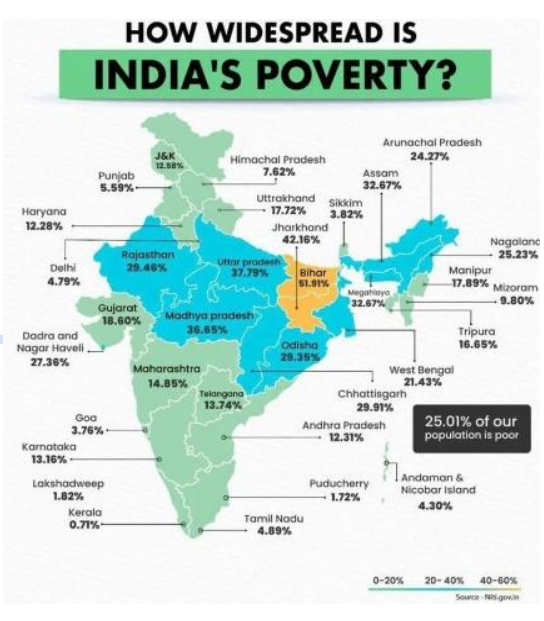
| India’s Progress | 29.17% poor in 2013-14 → 11.28% poor in 2022-23 |
| Global Situation | 659 million poor (8.5% of world population) |
Mains Key Points
Prelims Strategy Tips
Poverty – Reports, Surveys and Approaches
Different reports and surveys (NITI Aayog, Oxfam, World Bank, UN, Pew Research, etc.) give important insights into the status of poverty in India and the world. Poverty is not just about money but has multiple dimensions like capability, social inclusion, and participation.
Different reports and surveys (NITI Aayog, Oxfam, World Bank, UN, Pew Research, etc.) give important insights into the status of poverty in India and the world. Poverty is not just about money but has multiple dimensions like capability, social inclusion, and participation.
Major Reports and Surveys on Poverty
| Report/Survey | Key Findings |
|---|---|
| NITI Aayog MPI (2023) | Poverty fell to 11.28% (2022-23), 24.82 crore people lifted out |
| Oxfam Report (2023) | Top 10% hold 77% of wealth |
| Global MPI (2005-2021) | 415 million people out of poverty; incidence fell to 16.4% |
| World Bank (2023) | India poverty = 11.9% at $2.15/day line |
| Pew Research (Pandemic) | Poor doubled: 60m → 134m |
| Consumption Expenditure Survey (2022-23) | Rural poverty = 7.2%, Urban poverty = 4.6% |
Approaches to Understanding Poverty
| Approach | Explanation |
|---|---|
| Monetary Approach | Defines poverty as lack of money; solution = increase income/jobs |
| Capability Approach | Focus on deprivation of education, health, nutrition; solution = strengthen public goods |
| Social Exclusion Approach | Exclusion from social/economic participation; solution = inclusion & opportunities |
| Participatory Approach | Understanding poverty from perspective of the poor; solution = local, tailored interventions |
Mains Key Points
Prelims Strategy Tips
Types of Poverty and Categorisation of the Poor
Poverty can be understood in different forms such as absolute, relative, environmental, and collective poverty. Beyond income, it includes lack of capabilities, resources, and access to essentials. Poverty is also classified into groups like chronic poor, churning poor, and occasionally poor, based on duration and intensity.
Poverty can be understood in different forms such as absolute, relative, environmental, and collective poverty. Beyond income, it includes lack of capabilities, resources, and access to essentials. Poverty is also classified into groups like chronic poor, churning poor, and occasionally poor, based on duration and intensity.
Difference Between Absolute Poverty and Relative Poverty
| Aspect | Absolute Poverty | Relative Poverty |
|---|---|---|
| Definition | Lack of fixed basic necessities for survival | Income/resource inadequacy compared to societal standards |
| Measurement | Specific income threshold (e.g., $2.15/day, World Bank) | Comparative to average/median income in society |
| Focus | Survival and basic needs (food, shelter, clothing) | Disparities and inequality within society |
| Policy Implications | Provide basic services like food, shelter, health | Reduce inequality, improve overall living conditions |
| Long-term Trends | Stable unless poverty line is redefined | Changes with growth, policies, and income distribution |
Mains Key Points
Prelims Strategy Tips
Measuring Poverty
Poverty is measured using a 'Poverty Line', which separates poor from non-poor based on minimum income or consumption required to meet basic needs. It includes different levels of poverty and wealth, and uses indicators like Head Count Ratio, Poverty Gap, and Misery Index.
Poverty is measured using a 'Poverty Line', which separates poor from non-poor based on minimum income or consumption required to meet basic needs. It includes different levels of poverty and wealth, and uses indicators like Head Count Ratio, Poverty Gap, and Misery Index.
Indicators of Poverty Measurement
| Indicator | Explanation / Formula |
|---|---|
| Head Count Ratio (HCR) | Percentage of population below poverty line. Formula: (Number of poor ÷ Total population) × 100 |
| Poverty Gap (PG) | Measures intensity of poverty – how far the poor are from the poverty line (depth of poverty). |
| Misery Index | Introduced by Robert Barro; sum of inflation rate + unemployment rate, showing overall economic misery. |
Mains Key Points
Prelims Strategy Tips
Poverty Estimation in India
The process of poverty estimation in India is about finding out how many people are poor and where the poverty line should be fixed. Over the years, different experts and committees have suggested different ways to define the poverty line – some focused on minimum calories required to survive, while later committees focused on total household spending on food, health, and education. Today, poverty estimation uses consumption expenditure surveys and multidimensional poverty indicators.
The process of poverty estimation in India is about finding out how many people are poor and where the poverty line should be fixed. Over the years, different experts and committees have suggested different ways to define the poverty line – some focused on minimum calories required to survive, while later committees focused on total household spending on food, health, and education. Today, poverty estimation uses consumption expenditure surveys and multidimensional poverty indicators.
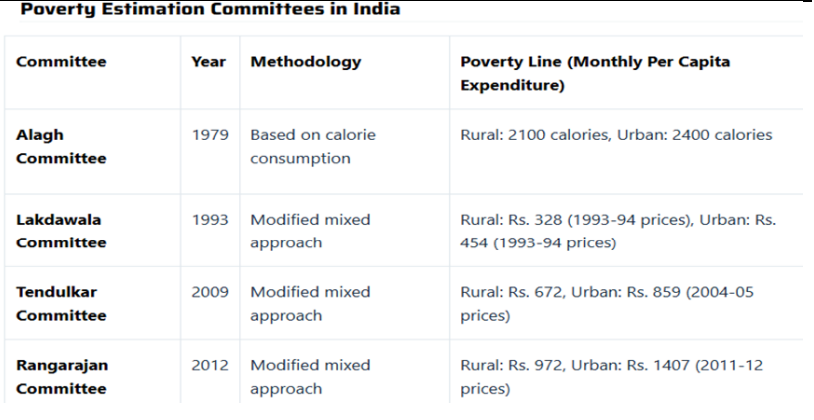
Poverty Estimation Committees in India
| Committee / Person | Year | Basis of Poverty Line |
|---|---|---|
| Dadabhai Naoroji | 1867–68 | ₹16–₹35 per year per capita; basic survival estimate. |
| Bombay Plan | 1944 | ₹75 per year per capita. |
| Dandekar & Rath | 1971 | 2250 calories/day for both rural and urban areas. |
| Alagh Committee | 1979 | Calorie norms: 2400 rural, 2100 urban; consumption expenditure adjusted with inflation. |
| Lakdawala Committee | 1993 | State-specific poverty lines using CPI-AL (rural) and CPI-IW (urban). |
| Tendulkar Committee | 2009 | Shift away from calories; uniform PLB; included health and education expenses. |
| Rangarajan Committee | 2012 | Higher poverty line: ₹972 rural, ₹1407 urban (monthly). |
Mains Key Points
Prelims Strategy Tips
Challenges in Measuring Poverty
Measuring poverty is complex because poverty is not only about income but also about lack of opportunities, insecurity, and poor living conditions. Different types of poverty, hidden emotional aspects, resource-heavy surveys, and political influence make accurate measurement difficult.
Measuring poverty is complex because poverty is not only about income but also about lack of opportunities, insecurity, and poor living conditions. Different types of poverty, hidden emotional aspects, resource-heavy surveys, and political influence make accurate measurement difficult.
Key Challenges in Measuring Poverty
| Challenge | Explanation |
|---|---|
| Many Faces of Poverty | Different types (absolute, relative, multidimensional); definitions vary across countries. |
| Invisible Dimensions | Fear, insecurity, and vulnerability are real but not captured by income-based data. |
| Survey Struggles | Surveys are costly, time-consuming, and sometimes inaccurate. |
| Government Influence | Poverty line can be manipulated for political gains, making statistics misleading. |
Mains Key Points
Prelims Strategy Tips
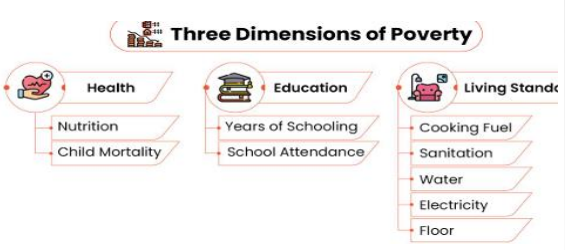
Beyond Income: Multidimensional Poverty
Traditional poverty measures focused only on income, but multidimensional poverty goes beyond money. It includes health, education, housing, sanitation, electricity, and access to services. This approach provides a more complete picture of poverty and helps policymakers target different areas of deprivation.
Traditional poverty measures focused only on income, but multidimensional poverty goes beyond money. It includes health, education, housing, sanitation, electricity, and access to services. This approach provides a more complete picture of poverty and helps policymakers target different areas of deprivation.
Traditional vs Multidimensional Poverty
| Aspect | Traditional Poverty | Multidimensional Poverty |
|---|---|---|
| Basis | Income or consumption only | Income + health + education + living conditions |
| Focus | Money required to meet basic needs | Overall human well-being and opportunities |
| Measurement | Below or above poverty line (income) | Multiple indicators (nutrition, schooling, sanitation, electricity) |
| Limitation | Ignores health, education, services | Provides holistic picture of deprivation |
Mains Key Points
Prelims Strategy Tips
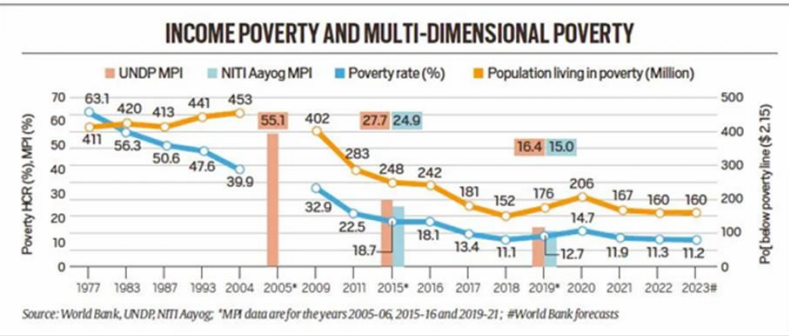
Global Multidimensional Poverty Index (MPI) and India's Status
The Global MPI, developed in 2010 by Oxford’s OPHI and UNDP, measures poverty not only by money but also by deprivations in health, education, and living conditions. It has 10 indicators and gives a score between 0 (no poverty) and 1 (highest poverty). India has made remarkable progress, with millions of people moving out of multidimensional poverty in recent years.
The Global MPI, developed in 2010 by Oxford’s OPHI and UNDP, measures poverty not only by money but also by deprivations in health, education, and living conditions. It has 10 indicators and gives a score between 0 (no poverty) and 1 (highest poverty). India has made remarkable progress, with millions of people moving out of multidimensional poverty in recent years.
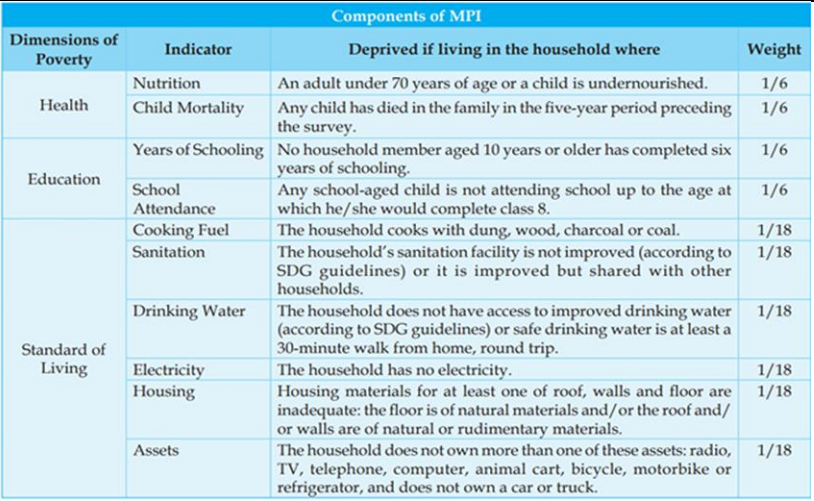
Global MPI: Dimensions and Indicators
| Dimension | Indicators |
|---|---|
| Health | Nutrition, Child Mortality |
| Education | Years of Schooling, School Attendance |
| Standard of Living | Cooking Fuel, Sanitation, Drinking Water, Electricity, Housing, Assets |
India's MPI Progress Over Time
| Year/Period | MPI % | People lifted out of poverty | MPI Value |
|---|---|---|---|
| 2005-06 | 55.1% | - | - |
| 2015-16 | 27.7% | 271 million | - |
| 2015-16 to 2019-21 | 24.85% → 14.96% | 135 million | 0.117 → 0.066 |
Mains Key Points
Prelims Strategy Tips
Global MPI 2024, National MPI (India) and Causes of Poverty
The Global Multidimensional Poverty Index (MPI) 2024 highlights that 1.1 billion people (18% of global population) live in acute poverty, with India having the largest share at 234 million. India has also developed its own National MPI through NITI Aayog, adding two extra indicators (Maternal Health and Bank Account) to reflect national priorities. Despite progress, poverty persists in India due to overpopulation, agricultural challenges, corruption, social inequalities, poor healthcare, weak infrastructure, and natural disasters.
The Global Multidimensional Poverty Index (MPI) 2024 highlights that 1.1 billion people (18% of global population) live in acute poverty, with India having the largest share at 234 million. India has also developed its own National MPI through NITI Aayog, adding two extra indicators (Maternal Health and Bank Account) to reflect national priorities. Despite progress, poverty persists in India due to overpopulation, agricultural challenges, corruption, social inequalities, poor healthcare, weak infrastructure, and natural disasters.
Global vs National MPI (India)
| Aspect | Global MPI | National MPI (India) |
|---|---|---|
| Year of Development | 2010 (UNDP + OPHI) | By NITI Aayog (based on Global MPI) |
| Dimensions | Health, Education, Standard of Living | Same 3 dimensions |
| Indicators | 10 indicators | 12 indicators (10 global + Maternal Health + Bank Account) |
| Purpose | Compare poverty across countries | Policy design & targeted poverty reduction in India |
Major Causes of Poverty in India
| Cause | Explanation |
|---|---|
| Overpopulation | Huge pressure on resources; unemployment and underemployment. |
| Agricultural Issues | Traditional farming methods; low productivity; farmer debt. |
| Corruption | Funds for poor diverted; inefficient use of resources. |
| Caste & Inequality | Discrimination restricts access to education, jobs, health. |
| Healthcare Gaps | Lack of facilities; high medical costs push families into poverty. |
| Poor Infrastructure | Lack of roads, electricity, transport; limits opportunities. |
| Natural Disasters | Floods, droughts, cyclones destroy lives and livelihoods. |
Mains Key Points
Prelims Strategy Tips
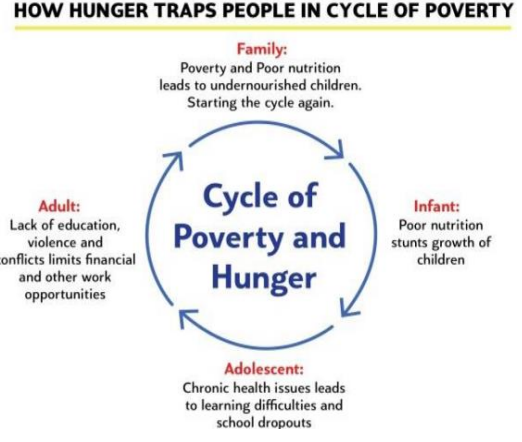
Consequences of Poverty, Poverty Trap and Poverty Alleviation
Poverty has serious consequences such as child labour, terrorism, crime, lack of education, and forced migration. It can also create a 'poverty trap', where people cannot escape poverty due to lack of resources and opportunities. To address these issues, governments and institutions launch poverty alleviation programs.
Poverty has serious consequences such as child labour, terrorism, crime, lack of education, and forced migration. It can also create a 'poverty trap', where people cannot escape poverty due to lack of resources and opportunities. To address these issues, governments and institutions launch poverty alleviation programs.
Consequences of Poverty
| Consequence | Impact |
|---|---|
| Child Labour | Children forced to work; no education; cycle of poverty continues. |
| Terrorism | Poverty fuels frustration; fertile ground for extremism. |
| Crimes | Joblessness leads to theft, robbery, and violence. |
| Lack of Education | 25% children in India not educated; low chances of employment. |
| Migration | People migrate due to extreme poverty; e.g., Sahel region in Africa. |
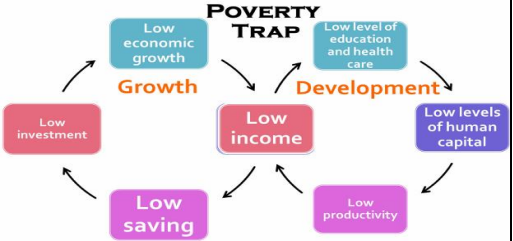
Poverty Trap Explained
| Aspect | Explanation |
|---|---|
| Definition | A cycle where poor people cannot escape poverty due to lack of capital/resources. |
| Cause | Low income → no education/healthcare → low skills → low income again. |
| Example | COVID-19 pandemic pushed 200 million Indians into poverty. |
| Result | Self-reinforcing cycle of deprivation. |
Mains Key Points
Prelims Strategy Tips
Feminisation of Poverty
Feminisation of poverty refers to the growing share of women among the poor due to gender inequalities. Women face restricted access to resources, opportunities, and rights, resulting in low income, unpaid work, and higher vulnerability to poverty.
Feminisation of poverty refers to the growing share of women among the poor due to gender inequalities. Women face restricted access to resources, opportunities, and rights, resulting in low income, unpaid work, and higher vulnerability to poverty.
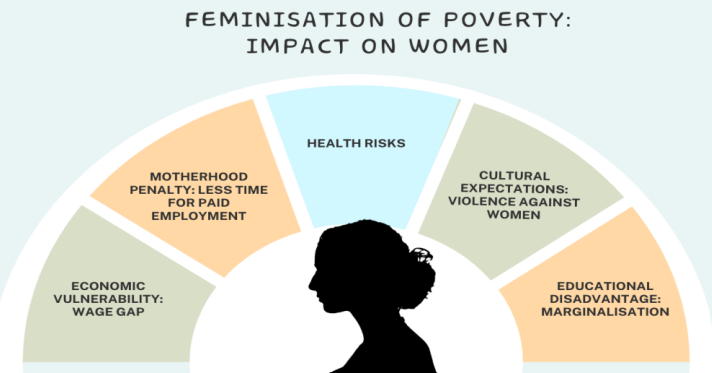
Indicators of Feminisation of Poverty in India
| Indicator | Data |
|---|---|
| GDP Contribution | Women: 48% of population but only 18% of GDP. |
| Labour Force Participation | Female LFPR: 37% (2023). |
| Literacy | Women: 65.46% vs total: 74% (2011 Census). |
| Unpaid Care Work | 15–17% of GDP; women spend 7.2 hrs/day vs men 2.8 hrs. |
Mains Key Points
Prelims Strategy Tips
Inequality
Inequality refers to the gap between the rich and the poor in terms of income, wealth, and opportunities. While some inequality can encourage growth, extreme inequality slows down development, reduces social mobility, and causes instability.
Inequality refers to the gap between the rich and the poor in terms of income, wealth, and opportunities. While some inequality can encourage growth, extreme inequality slows down development, reduces social mobility, and causes instability.
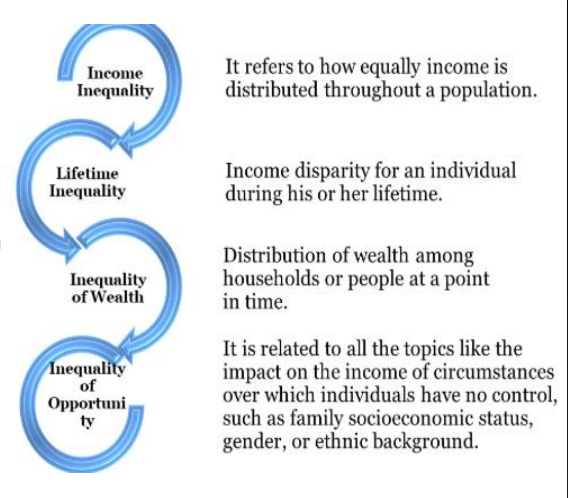
Types of Inequality
| Type | Meaning | Example |
|---|---|---|
| Income Inequality | Difference in income distribution | Top 1% earn 22.6% of national income in India |
| Lifetime Inequality | Income difference across individual’s life | Skilled engineer vs unskilled worker |
| Wealth Inequality | Gap in assets and wealth ownership | Rich own land/shares, poor have no savings |
| Opportunity Inequality | Inequality due to uncontrollable circumstances | Caste-based restrictions on jobs |
Mains Key Points
Prelims Strategy Tips
Measuring Inequality – Lorenz Curve
The Lorenz Curve is a graphical representation of income or wealth inequality. It compares the cumulative share of income/wealth with the cumulative share of the population. The greater the deviation from the line of equality, the higher the inequality.
The Lorenz Curve is a graphical representation of income or wealth inequality. It compares the cumulative share of income/wealth with the cumulative share of the population. The greater the deviation from the line of equality, the higher the inequality.
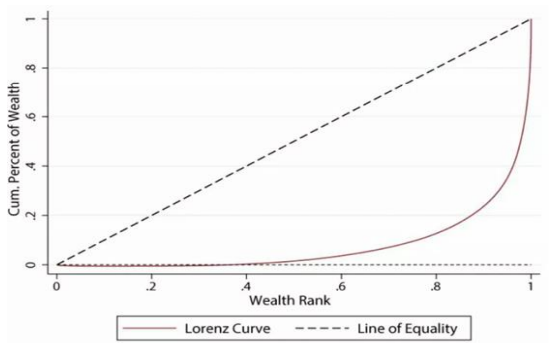
Lorenz Curve – Key Features
| Feature | Description |
|---|---|
| X-axis | Cumulative % of population (poorest → richest) |
| Y-axis | Cumulative % of income/wealth owned |
| Line of Equality | 45° line; perfect equality scenario |
| Lorenz Curve | Shows actual inequality; bows below equality line |
| Relation with Gini | More curve deviation = higher Gini coefficient |
Mains Key Points
Prelims Strategy Tips
Gini Coefficient
The Gini Coefficient is a statistical measure of income or wealth inequality, ranging between 0 (perfect equality) and 1 (perfect inequality). It is widely used for comparing inequality across countries and time periods.
The Gini Coefficient is a statistical measure of income or wealth inequality, ranging between 0 (perfect equality) and 1 (perfect inequality). It is widely used for comparing inequality across countries and time periods.
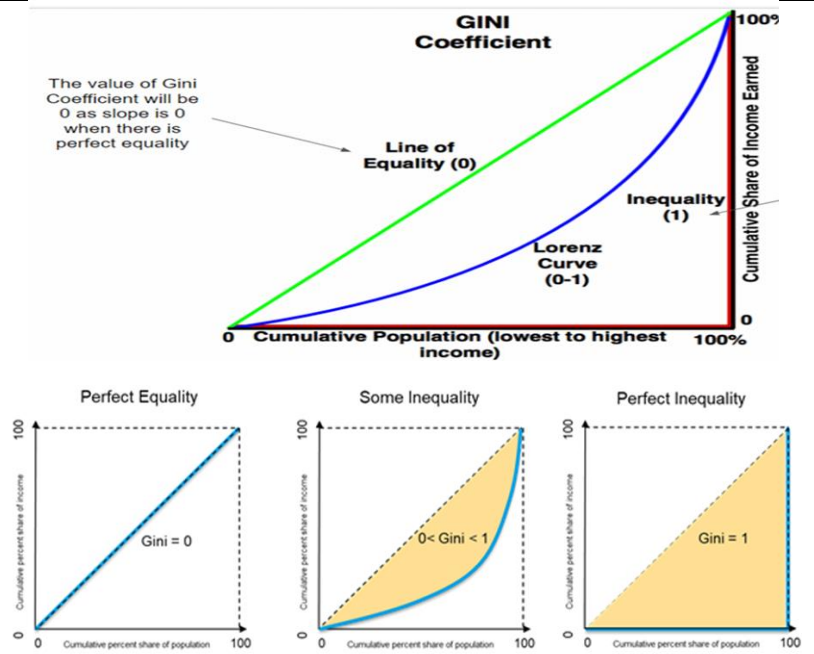
Gini Coefficient – Key Aspects
| Aspect | Details |
|---|---|
| Range | 0 (perfect equality) to 1 (perfect inequality) |
| Basis | Lorenz Curve |
| Used for | Income/Wealth inequality measurement |
| Strength | Simple and widely comparable across countries |
| Weakness | Does not show internal group inequality, ignores informal sector |
Mains Key Points
Prelims Strategy Tips
Other Measures of Inequality
Besides the Gini coefficient, inequality can be measured using indices such as the Theil Index, Palma Ratio, Kuznets Ratio, and Hoover Index. Each provides a different perspective on income and wealth distribution.
Besides the Gini coefficient, inequality can be measured using indices such as the Theil Index, Palma Ratio, Kuznets Ratio, and Hoover Index. Each provides a different perspective on income and wealth distribution.
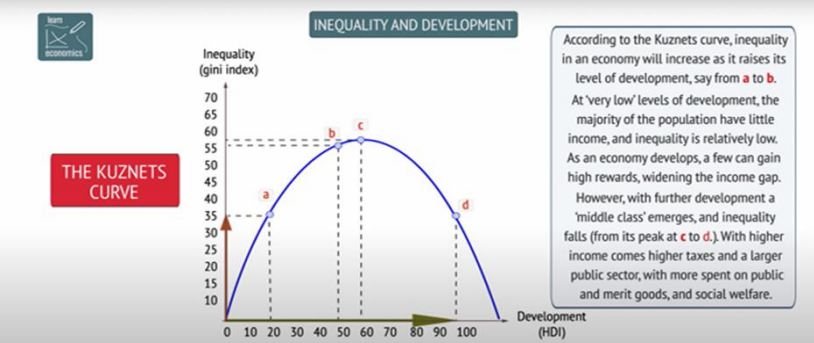
Comparison of Inequality Measures
| Measure | Range | Focus/Feature |
|---|---|---|
| Theil Index | 0 → ∞ | Decomposable; measures distance from equality |
| Palma Ratio | No fixed range | Top 10% income vs Bottom 40%; highlights extremes |
| Kuznets Ratio | No fixed range | Richest x% vs Poorest y%; linked to Kuznets Curve |
| Hoover Index | 0 → 1 | Proportion of income redistribution needed; 'Robin Hood' measure |
Mains Key Points
Prelims Strategy Tips
Atkinson Index and Status of Inequality in India
The Atkinson Index, developed by Anthony Atkinson, measures inequality with sensitivity to different parts of the income distribution. In India, inequality has been rising sharply since the 1980s, with the top 1% controlling a large share of income and wealth. Reports from World Inequality Lab, Forbes, Oxfam, and SBI highlight the persistence of high inequality despite growth.
The Atkinson Index, developed by Anthony Atkinson, measures inequality with sensitivity to different parts of the income distribution. In India, inequality has been rising sharply since the 1980s, with the top 1% controlling a large share of income and wealth. Reports from World Inequality Lab, Forbes, Oxfam, and SBI highlight the persistence of high inequality despite growth.
Inequality in India – Key Data
| Source | Key Findings |
|---|---|
| World Inequality Lab (1922–2023) | Top 1%: 22.6% income, 40.1% wealth; rise of billionaire class. |
| Forbes 2024 | 200 billionaires; $954 billion wealth (+41% from last year). |
| Oxfam India 2023 | Top 5% hold 60% wealth; bottom 50% hold 3%; Gini 0.32 (1983) → 0.36 (2019). |
| SBI Research | Tax inequality narrowing; taxable income Gini fell 0.472 → 0.402 (2014–22). |
| Female Tax Filers | 15% women; higher in Kerala, TN, Punjab, WB. |
Mains Key Points
Prelims Strategy Tips
Inequality in India – Causes, Consequences and Way Forward
Inequality in India is shaped by unemployment, inflation, weak tax systems, agrarian disparities, gender gaps, and global shocks. It results in social conflicts, poor development indicators, and weak public services. While steps like progressive taxation, social security, and digital inclusion have been taken, stronger reforms in wages, education, health, and wealth taxation are needed.
Inequality in India is shaped by unemployment, inflation, weak tax systems, agrarian disparities, gender gaps, and global shocks. It results in social conflicts, poor development indicators, and weak public services. While steps like progressive taxation, social security, and digital inclusion have been taken, stronger reforms in wages, education, health, and wealth taxation are needed.
Causes and Consequences of Inequality
| Aspect | Details |
|---|---|
| Causes | Unemployment, inflation, tax evasion, regressive taxation, green revolution imbalance, gender and social discrimination |
| Consequences | Social conflict, ethnic/religious tensions, poor development indicators, neglect of public services |
| Challenges | Low female participation, poor scheme coverage, global shocks, informal employment, skewed growth |
| Steps Taken | Progressive taxes, land reforms, PDS, pensions, JAM trinity, minimum wages, free health and education |
| Way Forward | Wealth tax, higher minimum wages, more education & health spending, reduce errors in schemes |
Mains Key Points
Prelims Strategy Tips
Hunger in India
Hunger means food deprivation – consuming less than 1,800 calories a day. Malnutrition includes both undernutrition (too little food/nutrients) and overnutrition (too much unhealthy food). According to UN reports, more than 1 billion Indians cannot afford a healthy diet, and India ranks poorly on global hunger indices. The government, however, disputes some international findings, arguing they are based on weak data.
Hunger means food deprivation – consuming less than 1,800 calories a day. Malnutrition includes both undernutrition (too little food/nutrients) and overnutrition (too much unhealthy food). According to UN reports, more than 1 billion Indians cannot afford a healthy diet, and India ranks poorly on global hunger indices. The government, however, disputes some international findings, arguing they are based on weak data.
Hunger in India – Key Reports and Findings
| Index/Report | Findings |
|---|---|
| Global Hunger Index (2023) | India ranked 111/125; about 190 million hungry people. |
| UNICEF Report | 181 million children under 5 suffering from severe child food poverty. |
| India’s Multidimensional Poverty Index | Poverty fell from 29.17% (2013-14) to 11.28% (2022-23); 248 million people exited poverty. |
| NFHS-5 | Child malnutrition: stunting (35.5%), wasting (7.7%), underweight (32.1%). |
| FAO – State of Food Security & Nutrition (SOFI) | Hunger reduced from 233.9 million (2020–22) to 194.6 million (2021–23); 39.3 million exited hunger. |
Mains Key Points
Prelims Strategy Tips
Types and Causes of Hunger
Hunger can be acute (sudden and severe), chronic (long-term undernourishment), or hidden (lack of essential vitamins and minerals). In India, hunger is caused not by lack of food production but by poverty, leakages, wastage, social inequality, poor sanitation, climate change, and weak safety nets.
Hunger can be acute (sudden and severe), chronic (long-term undernourishment), or hidden (lack of essential vitamins and minerals). In India, hunger is caused not by lack of food production but by poverty, leakages, wastage, social inequality, poor sanitation, climate change, and weak safety nets.
Types of Hunger and Causes
| Category | Explanation |
|---|---|
| Acute Hunger | Sudden, severe hunger due to disasters/conflicts (e.g., Syria). |
| Chronic Hunger | Long-term undernourishment linked to poverty. |
| Hidden Hunger | Lack of essential vitamins and minerals despite food availability. |
| Poverty | Main cause – lack of purchasing power despite surplus food production. |
| Social Inequality | Women and girl children eat less, leading to anaemia and malnutrition. |
| Leakages | Corruption in schemes like PDS prevents food reaching poor. |
| Wastage | Food rots in storage; 62,000 tonnes wasted (2011–17). |
| Climate Change | Crop losses due to drought, floods, rising temperatures. |
| Weak Safety Nets | Out-of-pocket health expenses push poor into deeper poverty. |
| Poor Sanitation | Diseases reduce nutrient absorption, worsening malnutrition. |
Mains Key Points
Prelims Strategy Tips
Impact of Climate Change on Food Security and Nutrition
Climate change worsens hunger and food insecurity by damaging crops, reducing nutritional quality, and increasing food prices. Extreme weather, sea level rise, water scarcity, and higher temperatures threaten both food availability and food safety. This results in malnutrition, micronutrient deficiencies, and stunted growth among vulnerable populations.
Climate change worsens hunger and food insecurity by damaging crops, reducing nutritional quality, and increasing food prices. Extreme weather, sea level rise, water scarcity, and higher temperatures threaten both food availability and food safety. This results in malnutrition, micronutrient deficiencies, and stunted growth among vulnerable populations.
Climate Change Impacts on Food Security
| Impact | Explanation |
|---|---|
| Disrupted Food Production | Extreme weather (droughts, floods, heatwaves) and sea level rise reduce agricultural yields. |
| Reduced Nutritional Quality | High CO2 lowers protein and minerals in crops. |
| Water Scarcity | Unpredictable rainfall and less irrigation water reduce farm output. |
| Food Safety Risks | Higher temperatures allow foodborne pathogens to thrive. |
| Micronutrient Deficiency | Less vitamins and minerals in food worsen hidden hunger. |
| Stunted Growth | Poor nutrition during childhood reduces physical and cognitive growth. |
Mains Key Points
Prelims Strategy Tips
Malnutrition
Malnutrition means poor nutrition – it can be due to not eating enough (calorie or protein hunger), eating the wrong kind of food, or lacking essential vitamins and minerals (micronutrient deficiency). In India, malnutrition persists despite surplus food production, due to poor distribution, weak schemes, and social inequalities.
Malnutrition means poor nutrition – it can be due to not eating enough (calorie or protein hunger), eating the wrong kind of food, or lacking essential vitamins and minerals (micronutrient deficiency). In India, malnutrition persists despite surplus food production, due to poor distribution, weak schemes, and social inequalities.
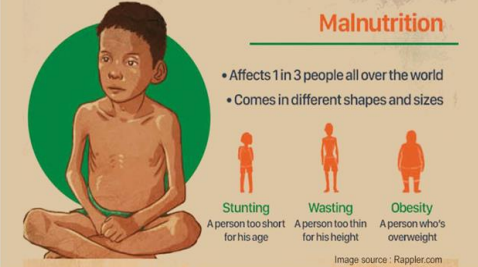
Types and Impacts of Malnutrition
| Category | Explanation/Impact |
|---|---|
| Calorific Deficiency | Poor distribution of surplus foodgrains → not enough calories. |
| Protein Hunger | Low intake of pulses/eggs → weak muscle and child growth. |
| Micronutrient Deficiency | Lack of vitamins/minerals like iron, zinc, iodine. |
| Individual Impact | Weak IQ, low immunity, poor physical growth. |
| Societal Impact | Cycle of undernourishment; 45% of child deaths linked to malnutrition. |
| Economic Impact | 4% GDP loss, 8% productivity loss; 15% of disease burden. |
Mains Key Points
Prelims Strategy Tips
Consequences of Hunger
Hunger leads to serious consequences such as micronutrient deficiencies, poor child health (stunting, wasting, zero-food children), weakened immunity, and long-term economic losses. It creates an intergenerational cycle where malnourished mothers give birth to undernourished children, deepening poverty.
Hunger leads to serious consequences such as micronutrient deficiencies, poor child health (stunting, wasting, zero-food children), weakened immunity, and long-term economic losses. It creates an intergenerational cycle where malnourished mothers give birth to undernourished children, deepening poverty.
Consequences of Hunger – Key Aspects
| Aspect | Explanation/Example |
|---|---|
| Women’s Health | Deficiency of iron, folate, vitamin B12 leads to anaemia & hidden hunger. |
| Children | 50–60% preschool kids anaemic; nutrition deficiency contributes to child deaths. |
| Immunity | Weak immunity, higher child & maternal mortality. |
| Soil Quality | Nutrient depletion in soil (zinc, iron, boron) worsens hidden hunger. |
| Zero-Food Children | UP, Bihar, Maharashtra, Rajasthan, MP account for 2/3rd cases. |
| Child Malnutrition | 36% stunted, 17% underweight, 6% wasted (Poshan Tracker 2023). |
| Economic Impact | Reduced earning capacity; national GDP loss; cycle of poverty continues. |
Mains Key Points
Prelims Strategy Tips
Global Hunger Index (GHI) and Hunger & SDG 2
The Global Hunger Index (GHI) is an international tool that measures hunger levels in countries based on four indicators: undernourishment, child stunting, child wasting, and child mortality. In 2024, India ranked 105th out of 127 countries with a score of 27.3, which places it in the 'serious hunger' category. Hunger is closely linked to SDG 2 (Zero Hunger), where India has made progress in food production and coverage under NFSA but still struggles with malnutrition.
The Global Hunger Index (GHI) is an international tool that measures hunger levels in countries based on four indicators: undernourishment, child stunting, child wasting, and child mortality. In 2024, India ranked 105th out of 127 countries with a score of 27.3, which places it in the 'serious hunger' category. Hunger is closely linked to SDG 2 (Zero Hunger), where India has made progress in food production and coverage under NFSA but still struggles with malnutrition.
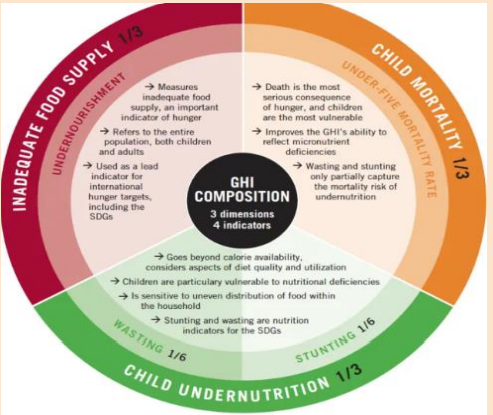
Global Hunger Index – Indicators and Weights
| Indicator | Weight in GHI | India’s Status (2024) |
|---|---|---|
| Undernourishment | 1/3 | 13.7% population calorie-deficient |
| Child Stunting | 1/6 | 35.5% children under 5 stunted |
| Child Wasting | 1/6 | 18.7% children under 5 wasted (highest globally) |
| Child Mortality | 1/3 | 2.9% under-5 deaths |
Mains Key Points
Prelims Strategy Tips
Measures to Tackle Hunger and Food Security in India
Hunger in India is not just about food shortage, but also about access, nutrition, and affordability. The government, civil society, and global organisations have introduced programmes like PDS, NFSA 2013, ICDS, Mid-Day Meal, and the World Food Programme. NITI Aayog has also proposed strategies to improve nutrition. These steps aim to ensure that no person sleeps hungry and every citizen gets a balanced and nutritious diet.
Hunger in India is not just about food shortage, but also about access, nutrition, and affordability. The government, civil society, and global organisations have introduced programmes like PDS, NFSA 2013, ICDS, Mid-Day Meal, and the World Food Programme. NITI Aayog has also proposed strategies to improve nutrition. These steps aim to ensure that no person sleeps hungry and every citizen gets a balanced and nutritious diet.
Key Programmes and Measures for Hunger Reduction
| Programme/Measure | Objective | Example |
|---|---|---|
| PDS | Provide subsidised food to poor | Rice at ₹3, Wheat at ₹2 |
| NFSA, 2013 | Ensure food and nutrition security | Covers 67% of population |
| Healthcare Schemes | Reduce expenses, free resources for food | Ayushman Bharat |
| Employment Schemes | Improve income, self-reliance | PM-SVANidhi, Aajeevika Mission |
| NGO Role | Support government in food delivery | Akshaya Patra Mid-Day Meal |
| Global Support | International aid and SDG focus | World Food Programme (WFP) |
Mains Key Points
Prelims Strategy Tips
Chapter Complete!
Ready to move to the next chapter?