
Economics Playlist
18 chapters • 0 completed
Introduction to Economics
10 topics
National Income
17 topics
Inclusive growth
15 topics
Inflation
21 topics
Money
15 topics
Banking
38 topics
Monetary Policy
15 topics
Investment Models
9 topics
Food Processing Industries
9 topics
Taxation
28 topics
Budgeting and Fiscal Policy
24 topics
Financial Market
34 topics
External Sector
37 topics
Industries
21 topics
Land Reforms in India
16 topics
Poverty, Hunger and Inequality
24 topics
Planning in India
16 topics
Unemployment
17 topics
Chapter 13: External Sector
Chapter TestExternal Sector and Balance of Payments (BOP)
The external sector of an economy deals with a country’s interactions with the rest of the world through exports, imports, capital flows, and dealings with global financial institutions. The Balance of Payments (BOP) records all international transactions of a country, showing whether it is in surplus or deficit. Understanding this helps assess economic health and currency stability.
The external sector of an economy deals with a country’s interactions with the rest of the world through exports, imports, capital flows, and dealings with global financial institutions. The Balance of Payments (BOP) records all international transactions of a country, showing whether it is in surplus or deficit. Understanding this helps assess economic health and currency stability.
Balance of Payments – Key Aspects
| Aspect | Details |
|---|---|
| Definition | Record of a country’s economic transactions with rest of the world over a year |
| Nature | Double-entry system; inflows = credit, outflows = debit |
| Formula | Current Account + Capital Account + Financial Account + Balancing Item = 0 |
| Status | Indicates surplus (exports > imports) or deficit (imports > exports) |
| Importance | Shows economic health, currency trends, and policy needs |
Mains Key Points
Prelims Strategy Tips
Current Account of Balance of Payments (BOP)
The Current Account of BOP records trade in goods, services, income, and unilateral transfers. It shows how much a country earns or spends in its day-to-day transactions with the rest of the world. A surplus means exports and inflows are greater than imports and outflows, while a deficit means the opposite.
The Current Account of BOP records trade in goods, services, income, and unilateral transfers. It shows how much a country earns or spends in its day-to-day transactions with the rest of the world. A surplus means exports and inflows are greater than imports and outflows, while a deficit means the opposite.
Components of Current Account
| Component | Description | Examples |
|---|---|---|
| Visible Trade | Trade in physical goods | Exports of cars, imports of oil, gold |
| Invisible Trade | Trade in services | Banking, shipping, IT, tourism, medical tourism |
| Unilateral Transfers | One-way transfers with no return | Remittances, gifts, foreign aid, donations |
| Investment Income | Earnings from assets and investments abroad | Profits, dividends, interest |
Mains Key Points
Prelims Strategy Tips
Foreign Capital Inflows: FDI, FPI & ECBs
Foreign capital inflows are crucial for India's growth. They come in different forms such as Foreign Direct Investment (FDI), Foreign Portfolio Investment (FPI), and External Commercial Borrowings (ECBs). While FDI involves long-term investment with management participation, FPI is short-term and volatile, and ECBs are loans borrowed from foreign lenders.
Foreign capital inflows are crucial for India's growth. They come in different forms such as Foreign Direct Investment (FDI), Foreign Portfolio Investment (FPI), and External Commercial Borrowings (ECBs). While FDI involves long-term investment with management participation, FPI is short-term and volatile, and ECBs are loans borrowed from foreign lenders.
Comparison of FDI, FPI and ECB
| Aspect | FDI | FPI | ECB |
|---|---|---|---|
| Definition | Long-term investment with management participation | Short-term investment in shares/bonds (no control) | Loan taken by Indian entities from foreign lenders |
| Threshold | More than 10% equity | Up to 10% equity | Loan with minimum 3 years maturity |
| Nature | Stable, long-term capital | Volatile, speculative ‘hot money’ | Debt obligation |
| Control | Involves influence/control in company’s policies | No control, only financial returns | No control, borrower must repay loan |
| Examples | Walmart acquiring Flipkart, Hindustan Unilever | Foreign investors buying Indian stocks | Foreign bank loans, bonds, export credits |
Mains Key Points
Prelims Strategy Tips
Official Reserve Assets Account
The Official Reserve Assets Account records changes in a nation’s official reserves held by its central bank. These reserves include gold, foreign currencies, Special Drawing Rights (SDRs), and the country’s position in the IMF. It helps balance deficits and surpluses in the Current and Capital Accounts.
The Official Reserve Assets Account records changes in a nation’s official reserves held by its central bank. These reserves include gold, foreign currencies, Special Drawing Rights (SDRs), and the country’s position in the IMF. It helps balance deficits and surpluses in the Current and Capital Accounts.
Official Reserve Assets – Key Elements
| Element | Description |
|---|---|
| Gold Stock | Value of gold reserves held by central bank |
| Foreign Currencies | Holdings of major convertible currencies like USD, Euro, Yen |
| Special Drawing Rights (SDRs) | IMF-created international reserve asset |
| IMF Position | Net position of a country in the IMF (quota minus drawings) |
Mains Key Points
Prelims Strategy Tips
Deficits of Current and Capital Account
A deficit in Current or Capital Account occurs when outflows are greater than inflows. Current Account Deficit (CAD) reflects the imbalance between imports, exports, and factor incomes, while Capital Account deficit shows insufficient inflow of foreign investments or borrowings to finance the CAD. Persistent deficits indicate economic vulnerability.
A deficit in Current or Capital Account occurs when outflows are greater than inflows. Current Account Deficit (CAD) reflects the imbalance between imports, exports, and factor incomes, while Capital Account deficit shows insufficient inflow of foreign investments or borrowings to finance the CAD. Persistent deficits indicate economic vulnerability.
Current Account Deficit (CAD) – Key Points
| Aspect | Details |
|---|---|
| Definition | Gap between inflows and outflows of goods, services, income & transfers |
| Formula | CAD = (Exports – Imports) + Net Transfers + Net Income from Abroad |
| Difference from BOT | BOT = Goods & services only; CAD = BOT + Income + Transfers |
| Largest Component | Trade Deficit (Imports > Exports) |
| India’s Average | -2.2% of GDP in past decade |
| Recent Data | Q2FY23: CAD = US$ 36.4 bn (4.4% of GDP) |
Mains Key Points
Prelims Strategy Tips
Issues Related to India’s Current Account Deficit (CAD)
India’s CAD is heavily influenced by imports of crude oil and gold. Both commodities form a major part of India’s import basket, and their price volatility directly impacts trade balance, inflation, forex reserves, and currency stability. The government has taken several measures to reduce dependence on oil and gold imports.
India’s CAD is heavily influenced by imports of crude oil and gold. Both commodities form a major part of India’s import basket, and their price volatility directly impacts trade balance, inflation, forex reserves, and currency stability. The government has taken several measures to reduce dependence on oil and gold imports.
Major Issues Impacting India’s CAD
| Issue | Impact on CAD | Government Measures |
|---|---|---|
| Oil Imports | Largest import item; rising prices increase import bill, CAD, inflation, pressure on forex reserves | Liberalization of oil sector, PSC/HELP/NELP policies, Ethanol Blending (E20 target by 2025) |
| Gold Imports | High demand increases trade deficit; 2012–13 CAD at 4.8% GDP; weakens rupee | Gold Monetization Scheme, Sovereign Gold Bonds, higher customs duty |
Mains Key Points
Prelims Strategy Tips
Factors Causing Current Account Deficit (CAD) and Its Impacts
CAD arises when imports of goods, services, and payments exceed exports and inflows. It can be caused by exchange rate appreciation, high economic growth, inflation, lack of competitiveness, and low investment levels. A large CAD has both short-term and long-term consequences for growth, currency stability, and investor confidence.
CAD arises when imports of goods, services, and payments exceed exports and inflows. It can be caused by exchange rate appreciation, high economic growth, inflation, lack of competitiveness, and low investment levels. A large CAD has both short-term and long-term consequences for growth, currency stability, and investor confidence.
Factors and Impacts of CAD
| Factor | Effect on CAD |
|---|---|
| Exchange Rate Appreciation | Cheaper imports, reduced exports, CAD widens |
| Economic Growth | Higher demand → increased imports |
| High Inflation | Exports less competitive, imports cheaper |
| Decline in Competitiveness | Exports lose share in global markets |
| Low Investment | Exports limited to raw goods, low value addition |
Impacts of Large CAD
| Impact | Description |
|---|---|
| Short-run Growth | Foreign capital inflows temporarily boost growth |
| Weakening of Demand | Investors doubt returns → reduced asset demand |
| Currency Depreciation | CAD increases demand for forex → rupee weakens |
| Costlier Imports | Depreciation makes essential imports costlier |
| Flight of Capital | Instability leads to foreign investor exit |
| Depleted Forex Reserves | Central Bank defends rupee → reserves fall |
Mains Key Points
Prelims Strategy Tips
Measures to Handle Current Account Deficit (CAD) & Related Trade Concepts
Current Account Deficit can be managed through a mix of boosting exports, reducing non-essential imports, stabilizing currency, and ensuring sufficient capital inflows. Concepts like Balance of Trade (BOT), Trade Surplus, and Trade Deficit help understand CAD in detail. CAD is broader than BOT as it also includes services, transfers, and income from abroad.
Current Account Deficit can be managed through a mix of boosting exports, reducing non-essential imports, stabilizing currency, and ensuring sufficient capital inflows. Concepts like Balance of Trade (BOT), Trade Surplus, and Trade Deficit help understand CAD in detail. CAD is broader than BOT as it also includes services, transfers, and income from abroad.
Comparison – BOT, Trade Deficit, CAD, BOP
| Aspect | BOT | Trade Deficit | CAD | BOP |
|---|---|---|---|---|
| Definition | Exports – Imports of goods | Imports > Exports (goods/services) | Trade deficit + income + transfers | All economic transactions with world |
| Coverage | Only goods | Goods & services | Goods, services, income, transfers | Goods, services, income, capital |
| Nature | Partial trade measure | Negative BOT | Overall external imbalance | Complete picture of external sector |
| Example | India exports ₹100 vs imports ₹120 | Imports ₹200 vs exports ₹150 | BOT deficit + negative remittances | India’s annual BOP statistics |
Mains Key Points
Prelims Strategy Tips
Balance of Capital Account and Capital Account Deficit
The Capital Account is balanced when inflows of foreign investments, loans, and asset sales equal the outflows of repayments, foreign investments, and asset purchases. A surplus means more inflows than outflows, while a deficit means more outflows than inflows. A Capital Account Deficit shows net investment moving abroad but may also mean domestic entities acquire valuable foreign assets.
The Capital Account is balanced when inflows of foreign investments, loans, and asset sales equal the outflows of repayments, foreign investments, and asset purchases. A surplus means more inflows than outflows, while a deficit means more outflows than inflows. A Capital Account Deficit shows net investment moving abroad but may also mean domestic entities acquire valuable foreign assets.
Capital Account Balance and Deficit – Key Points
| Aspect | Details |
|---|---|
| Balance | Inflows = Outflows (neutral situation) |
| Surplus | Inflows > Outflows; helps finance CAD |
| Deficit | Outflows > Inflows; net capital moving abroad |
| Example of Deficit | Indian company acquiring a European steel giant |
| Impact | Deficit reduces forex reserves but increases ownership of foreign assets |
Mains Key Points
Prelims Strategy Tips
Basic BOP Accounting Rule and Equilibrium in Balance of Payments
Balance of Payments (BOP) records all international transactions of a country. Credits (surplus) arise when foreign exchange flows into the country (exports, borrowings, FDI inflows), while debits (deficit) occur when foreign exchange flows out (imports, loan repayments, outward investments). Equilibrium in BOP means inflows = outflows, while disequilibrium occurs when there is persistent deficit or surplus.
Balance of Payments (BOP) records all international transactions of a country. Credits (surplus) arise when foreign exchange flows into the country (exports, borrowings, FDI inflows), while debits (deficit) occur when foreign exchange flows out (imports, loan repayments, outward investments). Equilibrium in BOP means inflows = outflows, while disequilibrium occurs when there is persistent deficit or surplus.
Equilibrium vs Disequilibrium in BOP
| Condition | Explanation | Effect |
|---|---|---|
| Equilibrium | Exports + inflows = Imports + outflows | Foreign exchange demand = supply |
| Deficit (Disequilibrium) | Payments > Receipts (Debit > Credit) | Corrected by using forex reserves or attracting inflows |
| Surplus (Disequilibrium) | Exports > Imports (Receipts > Payments) | Increases forex reserves, may boost domestic growth |
Mains Key Points
Prelims Strategy Tips
Measures to Correct Balance of Payments (BoP) Disequilibrium
When a country’s Balance of Payments (BoP) is in disequilibrium (persistent deficit or surplus), corrective steps are required. These steps can be automatic adjustments (like price, interest rate, income, and capital flows) or deliberate government measures (like devaluation, exchange controls, monetary policies, trade measures). The aim is to restore stability between inflows and outflows of foreign exchange.
When a country’s Balance of Payments (BoP) is in disequilibrium (persistent deficit or surplus), corrective steps are required. These steps can be automatic adjustments (like price, interest rate, income, and capital flows) or deliberate government measures (like devaluation, exchange controls, monetary policies, trade measures). The aim is to restore stability between inflows and outflows of foreign exchange.
Measures to Correct BoP Disequilibrium
| Type | Examples | Effect |
|---|---|---|
| Automatic Measures | Price, Interest Rate, Income, Capital Flows | Work naturally without govt. intervention |
| Deliberate Measures – Devaluation | Currency depreciation | Boosts exports, reduces imports |
| Deliberate Measures – Forex Controls | Govt controls forex transactions | Restricts unnecessary imports |
| Deliberate Measures – Monetary | Credit control, inflation control | Makes domestic goods competitive |
| Deliberate Measures – Trade | Tariffs, subsidies, quotas | Encourages exports, discourages imports |
| Deliberate Measures – Gold Monetization | Mobilise idle gold | Reduces gold imports |
Mains Key Points
Prelims Strategy Tips
Balance of Payments (BoP) and the Central Bank
The Central Bank plays a crucial role in managing the Balance of Payments (BoP). It uses foreign exchange reserves to cover deficits and purchases forex during surpluses. These official reserve transactions help maintain external stability, currency value, and money supply balance. Additionally, the RBI uses sterilisation to prevent inflation caused by excess money supply from forex interventions.
The Central Bank plays a crucial role in managing the Balance of Payments (BoP). It uses foreign exchange reserves to cover deficits and purchases forex during surpluses. These official reserve transactions help maintain external stability, currency value, and money supply balance. Additionally, the RBI uses sterilisation to prevent inflation caused by excess money supply from forex interventions.
Role of Central Bank in BoP
| Scenario | Central Bank Action | Impact |
|---|---|---|
| BoP Deficit | Sells forex reserves | Reduces reserves, lowers money supply |
| BoP Surplus | Buys forex reserves | Increases reserves, raises money supply |
| Capital Inflows (FDI/FPI) | Buys dollars, releases rupees | Prevents rupee appreciation, raises liquidity |
| Sterilisation | Absorbs excess rupee liquidity via bonds/MSS | Controls inflation, stabilises economy |
Mains Key Points
Prelims Strategy Tips
Balance of Payments (BoP) Crisis of 1991 in India
India’s BoP crisis of 1991 was triggered by rising oil prices due to the Gulf War, collapse of the USSR (reducing exports), and unsustainable external borrowing. Foreign reserves fell to levels covering just 2–3 weeks of imports. To avoid default, India pledged 67 tons of gold and borrowed from the IMF. This crisis led to the historic 1991 economic reforms.
India’s BoP crisis of 1991 was triggered by rising oil prices due to the Gulf War, collapse of the USSR (reducing exports), and unsustainable external borrowing. Foreign reserves fell to levels covering just 2–3 weeks of imports. To avoid default, India pledged 67 tons of gold and borrowed from the IMF. This crisis led to the historic 1991 economic reforms.
Macroeconomic Indicators of 1991 Crisis
| Indicator | 1989–90 | 1990–91 |
|---|---|---|
| Trade Deficit | ₹12,400 crore | ₹16,900 crore |
| Current Account Deficit | ₹11,350 crore | ₹17,350 crore |
| CAD/GDP Ratio | 2.3% | 3.1% |
| Forex Reserves (Dec) | ₹5,277 crore | ₹2,152 crore |
| Import Cover | 2 years (1989) | 2.5 months (1991) |
Mains Key Points
Prelims Strategy Tips
Steps Taken by India to Overcome BoP Crisis (Post-1991)
After the 1991 Balance of Payments crisis, India adopted a comprehensive reform strategy covering fiscal discipline, exchange rate liberalisation, trade reforms, industrial policy changes, public sector restructuring, and support from IMF and World Bank. These steps led to stabilisation of the external sector and paved the way for Liberalisation, Privatisation, and Globalisation (LPG) reforms.
After the 1991 Balance of Payments crisis, India adopted a comprehensive reform strategy covering fiscal discipline, exchange rate liberalisation, trade reforms, industrial policy changes, public sector restructuring, and support from IMF and World Bank. These steps led to stabilisation of the external sector and paved the way for Liberalisation, Privatisation, and Globalisation (LPG) reforms.
Key Measures to Overcome 1991 BoP Crisis
| Measure | Explanation |
|---|---|
| Fiscal & Monetary Discipline | Controlled demand, reduced fiscal deficit, inflation control |
| Exchange Rate Reform | Unified Exchange Rate System (1993), market-determined rupee |
| Trade Reform | 20% rupee devaluation, reduced tariffs, export promotion |
| Public Sector Reform | FDI liberalisation, more autonomy for PSEs |
| Industrial Policy Reform | End of licensing, eased supply constraints, private participation |
| IMF Bailout | $220 million emergency loan to prevent default |
| World Bank Structural Loan | $500 million loan linked with reforms in trade, finance, taxation, public enterprises |
Mains Key Points
Prelims Strategy Tips
Foreign Exchange Market and Exchange Rate
The Foreign Exchange Market (FEM or Forex Market) is a global marketplace where currencies of different countries are bought and sold. The exchange rate is the price of one currency in terms of another, determined by demand and supply of foreign currencies. This system allows international trade, travel, and financial transactions to function smoothly.
The Foreign Exchange Market (FEM or Forex Market) is a global marketplace where currencies of different countries are bought and sold. The exchange rate is the price of one currency in terms of another, determined by demand and supply of foreign currencies. This system allows international trade, travel, and financial transactions to function smoothly.
Demand and Supply of Foreign Exchange
| Aspect | Details |
|---|---|
| Demand for Forex | Imports, foreign gifts/remittances, buying foreign assets |
| Effect of High Forex Price on Demand | Imports costly → demand decreases |
| Supply of Forex | Exports, foreign investments in India (FDI, FPI) |
| Effect of High Forex Price on Supply | Exports rise → supply increases |
Mains Key Points
Prelims Strategy Tips
Exchange Rate Systems
Exchange rate systems are the rules by which a country manages the value of its currency in relation to foreign currencies. Broadly, they can be fixed (government sets the value), floating (market decides the value), or managed floating (a mix of both, with occasional government intervention). Each system has its own advantages, disadvantages, and real-world applications.
Exchange rate systems are the rules by which a country manages the value of its currency in relation to foreign currencies. Broadly, they can be fixed (government sets the value), floating (market decides the value), or managed floating (a mix of both, with occasional government intervention). Each system has its own advantages, disadvantages, and real-world applications.
Comparison of Exchange Rate Systems
| System | Key Feature | Example |
|---|---|---|
| Fixed Exchange Rate | Currency value set by government, pegged to gold or another currency | China (Yuan peg) |
| Floating Exchange Rate | Currency value decided by demand & supply in market | US Dollar, Euro |
| Managed Floating | Market decides, but central bank intervenes occasionally | India’s Rupee (RBI interventions) |
Mains Key Points
Prelims Strategy Tips
Types of Exchange Rates
Exchange rates can be understood in different forms depending on whether they are nominal, real, or based on market/government changes. Key types include NEER, REER, devaluation, depreciation, revaluation, and appreciation. These concepts help us understand how strong or weak a currency is and how it impacts trade, imports, exports, and competitiveness.
Exchange rates can be understood in different forms depending on whether they are nominal, real, or based on market/government changes. Key types include NEER, REER, devaluation, depreciation, revaluation, and appreciation. These concepts help us understand how strong or weak a currency is and how it impacts trade, imports, exports, and competitiveness.
Devaluation vs Depreciation
| Aspect | Devaluation | Depreciation |
|---|---|---|
| Meaning | Official lowering of currency value | Market-driven fall in value |
| Circumstances | By government or central bank | By demand-supply forces |
| Exchange Rate System | Fixed exchange rate system | Floating exchange rate system |
| Frequency | Occasional, government decision | Daily, market changes |
| Example | Govt reduces 10 units = $1 to 20 units = $1 | ₹70 per $1 falls to ₹80 per $1 |
Mains Key Points
Prelims Strategy Tips
Purchasing Power Parity (PPP) & Foreign Exchange Reserves
Purchasing Power Parity (PPP) is the idea that in the long run, currencies adjust so that the same basket of goods costs the same in every country when priced in a common currency. Forex reserves are foreign assets (like dollars, gold, SDRs) held by the RBI to stabilize the Rupee, meet external obligations, and build confidence in the economy.
Purchasing Power Parity (PPP) is the idea that in the long run, currencies adjust so that the same basket of goods costs the same in every country when priced in a common currency. Forex reserves are foreign assets (like dollars, gold, SDRs) held by the RBI to stabilize the Rupee, meet external obligations, and build confidence in the economy.
PPP vs Nominal Exchange Rate
| Aspect | PPP Exchange Rate | Nominal Exchange Rate |
|---|---|---|
| Definition | Rate at which same basket of goods costs the same across countries | Actual market rate quoted by banks, airports, TV |
| Adjustment | Adjusted for price differences and inflation | Not adjusted for inflation |
| Use | Compare living standards, poverty line, competitiveness | Used for real-time currency trading, travel, remittances |
| Example | If apple costs ₹100 in India and $2 in USA → $1 = ₹50 | $1 = ₹82 (market rate in 2023) |
Mains Key Points
Prelims Strategy Tips
Global Exchange Rate Management System
The global exchange rate management system has evolved over time – from the Gold Standard (1880–1914), to competitive devaluations and trade wars between World War I and II, and finally to the Bretton Woods System after 1944. These systems tried to stabilize currencies, promote trade, and avoid crises, but each had strengths and weaknesses.
The global exchange rate management system has evolved over time – from the Gold Standard (1880–1914), to competitive devaluations and trade wars between World War I and II, and finally to the Bretton Woods System after 1944. These systems tried to stabilize currencies, promote trade, and avoid crises, but each had strengths and weaknesses.
Comparison of Global Exchange Rate Systems
| System | Period | Key Features | Limitations |
|---|---|---|---|
| Gold Standard | 1880–1914 | Currency linked to gold; automatic BoP correction | Growth limited by gold supply |
| Interwar Period | 1914–1939 | Independent policies; competitive devaluations | Trade wars, Great Depression |
| Bretton Woods | 1944 onwards | Currencies pegged to USD, USD pegged to gold | US dominance, reliance on dollar and gold |
Mains Key Points
Prelims Strategy Tips
Triffin Dilemma and Special Drawing Rights (SDRs)
The Triffin Dilemma explains the conflict faced when a national currency (like the US Dollar) also serves as the world's reserve currency. To provide global liquidity, the US needed to run deficits, but those same deficits reduced confidence in the dollar. To address this, the IMF created Special Drawing Rights (SDRs) as an artificial reserve asset. The dilemma eventually led to the collapse of the Bretton Woods system in 1971.
The Triffin Dilemma explains the conflict faced when a national currency (like the US Dollar) also serves as the world's reserve currency. To provide global liquidity, the US needed to run deficits, but those same deficits reduced confidence in the dollar. To address this, the IMF created Special Drawing Rights (SDRs) as an artificial reserve asset. The dilemma eventually led to the collapse of the Bretton Woods system in 1971.
Triffin Dilemma and SDRs – Key Points
| Concept | Explanation |
|---|---|
| Triffin Dilemma | Conflict between US domestic stability and global liquidity needs under Bretton Woods. |
| Impact | Too few dollars → global shortage; too many dollars → loss of trust in dollar. |
| Collapse | 1971 Nixon Shock → suspension of dollar-gold convertibility → collapse of Bretton Woods. |
| SDRs | Introduced in 1967 by IMF as artificial reserve asset ('Paper Gold'). |
| Current Role | SDRs supplement reserves, but US Dollar remains dominant. |
Mains Key Points
Prelims Strategy Tips
Exchange Rate Management in India
India’s exchange rate policy has evolved significantly since independence. From a fixed par value under the Bretton Woods system, India shifted to pegged regimes, then adopted a Liberalised Exchange Rate Management System (LERMS) in 1992, followed by a Unified Exchange Rate System (UERS) in 1993. Today, India follows a managed float system under FEMA, where market forces determine the exchange rate but RBI intervenes to control volatility.
India’s exchange rate policy has evolved significantly since independence. From a fixed par value under the Bretton Woods system, India shifted to pegged regimes, then adopted a Liberalised Exchange Rate Management System (LERMS) in 1992, followed by a Unified Exchange Rate System (UERS) in 1993. Today, India follows a managed float system under FEMA, where market forces determine the exchange rate but RBI intervenes to control volatility.
Evolution of India’s Exchange Rate System
| Period/System | Key Features |
|---|---|
| 1947–1971 (Par Value) | Rupee fixed to gold (4.15 grains). Bretton Woods system. |
| 1971–1992 (Pegged) | Rupee pegged to basket of currencies (Dollar/Pound). |
| 1992 (LERMS) | Partial convertibility. 40% forex surrendered at official rate, 60% at market rate. |
| 1993 (UERS) | Unified market-determined rate. Rupee devalued ~35%. |
| 2000 onwards (FEMA) | Managed float system. Market-determined with RBI intervention. |
Mains Key Points
Prelims Strategy Tips
Factors Determining Exchange Rates
Exchange rates (the value of one currency compared to another) are influenced by many factors such as inflation, interest rates, trade balance, debt, recession, speculation, and income levels. In the long run, the Purchasing Power Parity (PPP) theory explains adjustments in exchange rates based on the law of one price.
Exchange rates (the value of one currency compared to another) are influenced by many factors such as inflation, interest rates, trade balance, debt, recession, speculation, and income levels. In the long run, the Purchasing Power Parity (PPP) theory explains adjustments in exchange rates based on the law of one price.
Key Factors Affecting Exchange Rates
| Factor | Impact on Exchange Rate |
|---|---|
| Inflation | Low inflation → stronger currency; High inflation → weaker currency. |
| Interest Rates | Higher rates attract investment → currency appreciates. |
| Current Account Deficit | Higher deficit → demand for forex → currency depreciates. |
| Public Debt | High debt → inflation → depreciation. |
| Recession | Lower interest rates reduce foreign inflows → depreciation. |
| Speculation | Positive expectations → appreciation; Negative expectations → depreciation. |
| Income Levels | Higher domestic income → more imports → depreciation. Higher foreign income → more exports → appreciation. |
Mains Key Points
Prelims Strategy Tips
Currency Convertibility
Currency convertibility refers to the ease with which one country’s currency can be exchanged for another nation’s currency or gold. It may apply to current account transactions (like trade, travel, remittances) or capital account transactions (like investments, property purchases). India has full current account convertibility but only partial capital account convertibility.
Currency convertibility refers to the ease with which one country’s currency can be exchanged for another nation’s currency or gold. It may apply to current account transactions (like trade, travel, remittances) or capital account transactions (like investments, property purchases). India has full current account convertibility but only partial capital account convertibility.
Types of Rupee Convertibility
| Type | Meaning | Status in India |
|---|---|---|
| Current Account Convertibility | Freedom to exchange currency for trade, services, remittances, travel, etc. | Fully Convertible (since 1994) |
| Capital Account Convertibility | Freedom to exchange currency for investments, property, and financial assets abroad. | Partially Convertible (with restrictions) |
Mains Key Points
Prelims Strategy Tips
Foreign Trade
Foreign trade means buying and selling of goods and services between different countries. It helps economic growth by bringing capital goods, creating competition, improving resource allocation, and reducing poverty through more openness. India’s foreign trade policy (2015–20 and onwards) has introduced schemes to promote exports of goods, services, agriculture, and digital trade facilitation.
Foreign trade means buying and selling of goods and services between different countries. It helps economic growth by bringing capital goods, creating competition, improving resource allocation, and reducing poverty through more openness. India’s foreign trade policy (2015–20 and onwards) has introduced schemes to promote exports of goods, services, agriculture, and digital trade facilitation.
India’s Foreign Trade Policy – Key Features
| Feature | Details |
|---|---|
| Policy Framework | Guidelines set by DGFT for imports and exports. |
| FTP 2015–20 | Introduced MEIS and SEIS schemes for goods and services exports. |
| Infrastructure Support | TIES scheme for export infrastructure; Logistics Division created. |
| Agri-Export Support | Agriculture Export Policy 2018, TMA scheme for freight assistance. |
| Digitalisation | Common Digital Platform for Certificate of Origin to utilise FTAs. |
| Localisation | Districts as Export Hubs for localised product-based exports. |
Mains Key Points
Prelims Strategy Tips
Foreign Trade Policy, 2023
India’s Foreign Trade Policy (FTP) 2023 marks a shift from an incentive-based framework to a remission and facilitation-based system. It focuses on duty refunds, collaboration among states and exporters, ease of doing business, and promoting India in emerging areas like manufacturing, pharma, and e-commerce.
India’s Foreign Trade Policy (FTP) 2023 marks a shift from an incentive-based framework to a remission and facilitation-based system. It focuses on duty refunds, collaboration among states and exporters, ease of doing business, and promoting India in emerging areas like manufacturing, pharma, and e-commerce.
Foreign Trade Policy 2023 – Key Features
| Feature | Details |
|---|---|
| Shift in Approach | From incentive-based to remission/facilitation-based system. |
| Process Automation | Digital, IT-enabled schemes and reduced fees for MSMEs. |
| Towns of Export Excellence | 43 towns including 4 new (Faridabad, Mirzapur, Moradabad, Varanasi). |
| Recognition of Exporters | 2-star exporters to train newcomers under mentorship model. |
| District Export Hubs | District Export Promotion Committees to create Export Action Plans. |
| SCOMET Policy | Aligning India with global export controls and treaties. |
Mains Key Points
Prelims Strategy Tips
Export Credit Guarantee Corporation (ECGC) and Export Promotion Schemes
ECGC, SEZs, and schemes like MEIS, RoDTEP, AAS, DFIA, and PLI are key government initiatives to promote exports. They provide risk insurance, tax relief, duty-free imports, and production incentives to boost India’s foreign trade and competitiveness.
ECGC, SEZs, and schemes like MEIS, RoDTEP, AAS, DFIA, and PLI are key government initiatives to promote exports. They provide risk insurance, tax relief, duty-free imports, and production incentives to boost India’s foreign trade and competitiveness.
Export Promotion Schemes – At a Glance
| Scheme | Objective |
|---|---|
| ECGC | Credit risk insurance for exporters and banks. |
| SEZ | Tax-free zones to promote exports and jobs. |
| MEIS | Duty credit rewards for merchandise exports (now discontinued). |
| RoDTEP | Refund of hidden taxes to exporters. |
| AAS | Duty-free imports of raw materials (pre-export). |
| DFIA | Duty-free imports of raw materials (post-export). |
| PLI | Incentives on incremental domestic production and sales. |
Mains Key Points
Prelims Strategy Tips
NIRYAT Portal, TIES Scheme and Trade Settlement in Rupee
India has introduced initiatives like the NIRYAT portal, TIES scheme, and rupee-based trade settlement to promote transparency, build export infrastructure, and reduce dependency on foreign currencies like the US dollar. These steps aim to strengthen India’s foreign trade system and make INR more globally acceptable.
India has introduced initiatives like the NIRYAT portal, TIES scheme, and rupee-based trade settlement to promote transparency, build export infrastructure, and reduce dependency on foreign currencies like the US dollar. These steps aim to strengthen India’s foreign trade system and make INR more globally acceptable.
Key Initiatives for Strengthening Foreign Trade
| Initiative | Objective/Benefit |
|---|---|
| NIRYAT Portal | Provides real-time data on exports/imports and commodity groups. |
| TIES Scheme | Builds export-related infrastructure (labs, ports, warehouses, SEZs). |
| Rupee Trade Settlement | Enables INR-based trade, reduces forex risk, and supports sanctioned-country trade. |
Mains Key Points
Prelims Strategy Tips
India’s Trends in Import and Export (2024-25)
In FY 2024-25, India’s total exports (merchandise + services) are estimated at USD 820.93 billion, while total imports are estimated at USD 915.19 billion, leading to an overall trade deficit of about USD 94.26 billion. Merchandise exports were USD 437.42 billion and merchandise imports USD 720.24 billion. Services exports rose strongly to USD 387.54 billion. Non-petroleum exports also recorded growth. Exports in July 2025 crossed USD 68 billion, imports touched nearly USD 80 billion, widening the monthly deficit to about USD 11.72 billion. (Sources: PIB, Ministry of Commerce, Wikipedia)
In FY 2024-25, India’s total exports (merchandise + services) are estimated at USD 820.93 billion, while total imports are estimated at USD 915.19 billion, leading to an overall trade deficit of about USD 94.26 billion. Merchandise exports were USD 437.42 billion and merchandise imports USD 720.24 billion. Services exports rose strongly to USD 387.54 billion. Non-petroleum exports also recorded growth. Exports in July 2025 crossed USD 68 billion, imports touched nearly USD 80 billion, widening the monthly deficit to about USD 11.72 billion. (Sources: PIB, Ministry of Commerce, Wikipedia)
India’s Trade Summary 2024-25
| Indicator | Value (USD Billion) |
|---|---|
| Merchandise Exports | 437.42 |
| Merchandise Imports | 720.24 |
| Services Exports | 387.54 |
| Services Imports | 198.72 |
| Total Exports (Merch + Service) | 820.93 |
| Total Imports (Merch + Service) | 915.19 |
| Trade Deficit | -94.26 |
Mains Key Points
Prelims Strategy Tips
Top Commodities & Partners in India’s Trade (2024-25)
In 2024-25, India’s exports were still dominated by petroleum products, gems & jewellery, pharmaceuticals, electronics and engineering goods. On the import side, mineral fuels, electrical machinery, and precious metals were leading. The USA, UAE, China and Netherlands remained among top trade partners.
In 2024-25, India’s exports were still dominated by petroleum products, gems & jewellery, pharmaceuticals, electronics and engineering goods. On the import side, mineral fuels, electrical machinery, and precious metals were leading. The USA, UAE, China and Netherlands remained among top trade partners.
Top Exports & Imports – FY 2024-25 (Estimated)
| Category | Exports / Imports |
|---|---|
| Petroleum Products | Top export |
| Gems & Jewellery | Among top exports |
| Pharmaceuticals | Strong export performer |
| Electronic Goods | Important export item |
| Engineering Goods | Export category |
| Mineral Fuels & Oils | Leading import item |
| Precious Metals | High-value import item |
| Machinery & Computers | Major import category |
| Organic Chemicals | Import & export flow |
| Textiles / Garments | Important export goods |
Top Trade Partners 2024-25 (Exports & Imports)
| Direction | Top Partner(s) |
|---|---|
| Exports | USA, UAE, Netherlands, China, UK |
| Imports | China, UAE, USA, Russia, Saudi Arabia |
Trade Agreements
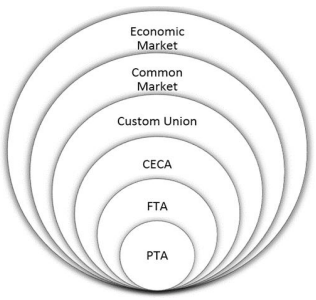
Trade agreements are formal arrangements between countries that reduce trade barriers like tariffs and quotas, and sometimes include investment protections. They can be bilateral (two countries) or multilateral (many countries), and can range from simple preferential access to full economic unions with shared policies.
Trade agreements are formal arrangements between countries that reduce trade barriers like tariffs and quotas, and sometimes include investment protections. They can be bilateral (two countries) or multilateral (many countries), and can range from simple preferential access to full economic unions with shared policies.
Types of Trade Agreements – Key Aspects
| Type | Explanation | Example |
|---|---|---|
| PTA | Tariffs reduced on some goods only | APTA |
| FTA | Most tariffs and restrictions removed | India–ASEAN FTA |
| Customs Union | Free trade + common external tariff | GCC |
| Common Market | Free trade + movement of goods, services, labour | MERCOSUR |
| Economic Union | Common market + harmonized economic policies | EU |
| Economic & Monetary Union | Economic union + single currency | Eurozone |
Mains Key Points
Prelims Strategy Tips
Trade Facilitation Agreement (TFA), UNCTAD, and GSTP
These are important international agreements and organizations that aim to simplify global trade processes, integrate developing countries into the world economy, and promote trade among developing nations.
These are important international agreements and organizations that aim to simplify global trade processes, integrate developing countries into the world economy, and promote trade among developing nations.
Key Aspects of TFA, UNCTAD, and GSTP
| Agreement/Organisation | Year | Objective | India’s Role |
|---|---|---|---|
| TFA | 2017 (WTO) | Simplify trade and customs procedures | Ratified in 2016 |
| UNCTAD | 1964 (UN) | Integrate developing countries into world economy | Active member, uses UNCTAD reports |
| GSTP | 1989 | Promote preferential trade among developing countries | Signed and ratified São Paulo Protocol |
Mains Key Points
Prelims Strategy Tips
Trade Barriers
Trade barriers are government-imposed restrictions on international trade. They can be tariffs (taxes on imports/exports) or non-tariff measures like quotas, licences, sanctions, or standards. While they aim to protect domestic industries, economists believe they often harm productivity, innovation, and global integration.
Trade barriers are government-imposed restrictions on international trade. They can be tariffs (taxes on imports/exports) or non-tariff measures like quotas, licences, sanctions, or standards. While they aim to protect domestic industries, economists believe they often harm productivity, innovation, and global integration.
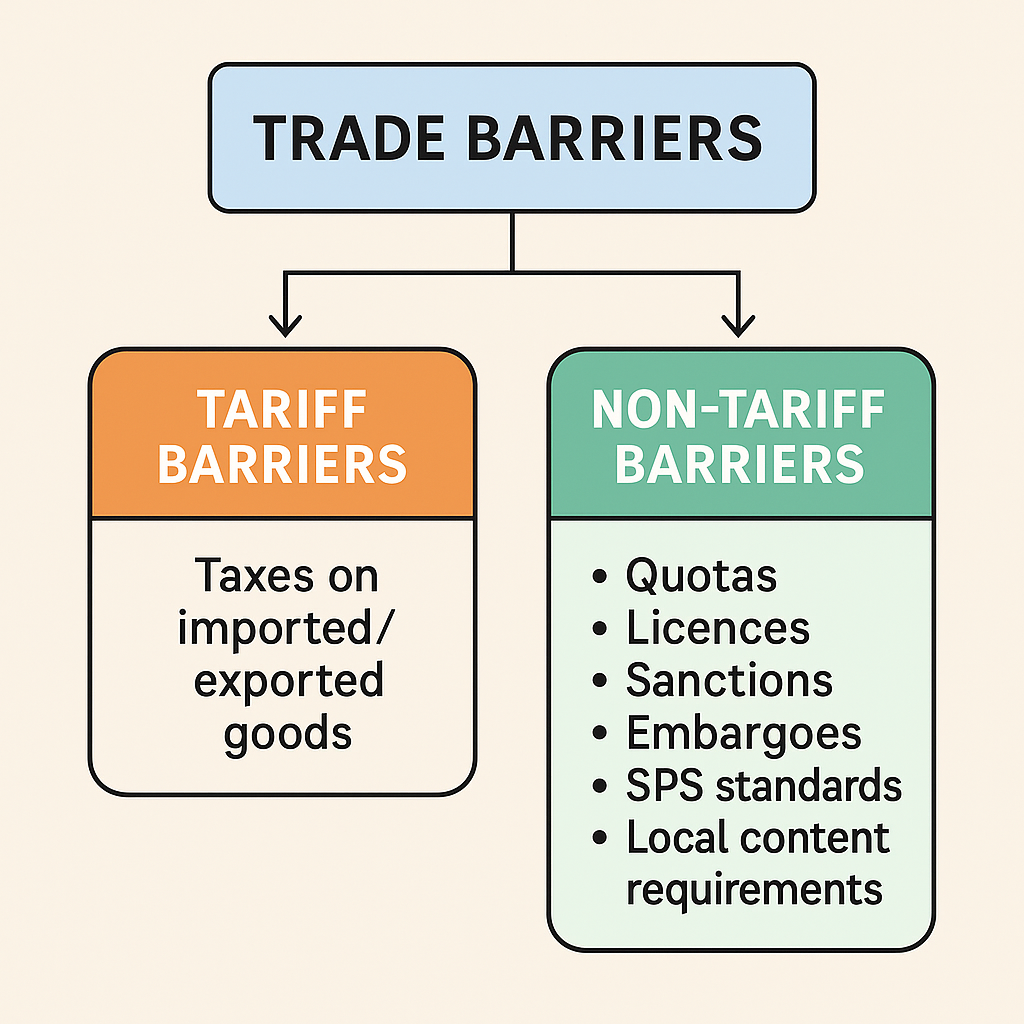
Types of Trade Barriers
| Type | Description | Example |
|---|---|---|
| Tariff Barrier | High taxes on imports/exports | US steel tariff 2018 |
| Licences | Only licensed importers allowed | Restricted items imports |
| Quotas | Limits on quantity traded | 10% coal import limit |
| Embargoes | Complete ban on trade | Trade ban with certain nations |
| Sanctions | Restrictions to punish/control | Freezing trade operations |
| SPS Standards | Health and safety rules | Food safety import rules |
| Local Content Requirement | Part of product must be domestic | JNNSM Solar Mission |
Mains Key Points
Prelims Strategy Tips
India and Trade Agreements
India has entered into multiple trade agreements such as Free Trade Agreements (FTAs), Comprehensive Economic Cooperation Agreements (CECPA), and regional trade pacts like SAFTA and APTA. These agreements aim to reduce tariffs, simplify trade, and promote economic cooperation with partner nations.
India has entered into multiple trade agreements such as Free Trade Agreements (FTAs), Comprehensive Economic Cooperation Agreements (CECPA), and regional trade pacts like SAFTA and APTA. These agreements aim to reduce tariffs, simplify trade, and promote economic cooperation with partner nations.
Key Trade Agreements of India
| Agreement | Members/Partners | Focus |
|---|---|---|
| India-Mauritius CECPA | India & Mauritius | Goods, Services, Investment |
| India-UAE CEPA | India & UAE | Oil, Gems, Textiles, Services |
| India-Australia ECTA | India & Australia | Agriculture, IT, Minerals |
| SAFTA | SAARC nations | Free Trade in South Asia |
| APTA | Bangladesh, China, India, Korea, Lao PDR, Sri Lanka, Mongolia | Preferential Tariff Reductions |
| RCEP | ASEAN + China, Japan, SK, Aus, NZ | Mega trade pact (India opted out) |
Mains Key Points
Prelims Strategy Tips
Foreign Investment in India: Regulations (विदेशी निवेश नियमावली)
Foreign investment simply means money that comes from outside India and is invested in Indian businesses, industries, or assets. It can come from foreign companies, foreign individuals, or Indians living abroad (NRIs). India has made its foreign investment policy more flexible over time to attract more global capital, create jobs, improve infrastructure, and boost economic growth while ensuring national security.
Foreign investment simply means money that comes from outside India and is invested in Indian businesses, industries, or assets. It can come from foreign companies, foreign individuals, or Indians living abroad (NRIs). India has made its foreign investment policy more flexible over time to attract more global capital, create jobs, improve infrastructure, and boost economic growth while ensuring national security.
Foreign Investment Regulations – Key Aspects
| Aspect | Details |
|---|---|
| FIPB | Old approval body for FDI (abolished in 2017 to simplify process) |
| FIFP | Single-window online portal for FDI applications |
| Liberalised Sectors | Construction, Real Estate, Aviation, Retail, Power, E-commerce |
| 2020 Policy | Border countries need Govt. approval; Pakistan has extra restrictions |
Mains Key Points
Prelims Strategy Tips
Protectionism and Currency Manipulation in World Trade
Protectionism means government policies that restrict imports and promote domestic industries, while currency manipulation refers to deliberate government actions to influence the exchange value of their currency. Both distort global trade, reduce efficiency, and create instability. For India, they lead to inflation, rising import costs, pressure on exports, widening current account deficit, and slower growth.
Protectionism means government policies that restrict imports and promote domestic industries, while currency manipulation refers to deliberate government actions to influence the exchange value of their currency. Both distort global trade, reduce efficiency, and create instability. For India, they lead to inflation, rising import costs, pressure on exports, widening current account deficit, and slower growth.
Effects of Protectionism and Currency Manipulation on India
| Factor | Impact on India |
|---|---|
| Inflation | Higher import costs → consumers pay more, real GDP falls |
| Industries | Reduced exports (textiles, pharma, jewellery, IT); job losses |
| Current Account Deficit | Intermediate goods costly → CAD widens, rupee weakens |
Mains Key Points
Prelims Strategy Tips
Quantitative Easing (QE) and External Commercial Borrowings (ECBs)
Quantitative Easing is when a central bank buys financial assets to inject money into the economy, making loans cheaper and stimulating growth. External Commercial Borrowings (ECBs) are loans that Indian companies take from foreign sources to fund business activities, usually at cheaper rates than domestic loans.
Quantitative Easing is when a central bank buys financial assets to inject money into the economy, making loans cheaper and stimulating growth. External Commercial Borrowings (ECBs) are loans that Indian companies take from foreign sources to fund business activities, usually at cheaper rates than domestic loans.
QE and ECBs – Key Aspects
| Aspect | Quantitative Easing (QE) | External Commercial Borrowings (ECB) |
|---|---|---|
| Meaning | Central bank buys assets to increase money supply | Indian companies borrow from foreign lenders |
| Purpose | Stimulate domestic growth and jobs | Finance expansion and new projects |
| Nature | Monetary policy tool | Loan (must be repaid with interest) |
| Impact | Affects domestic and global markets | Adds to external debt; cheaper funding |
| Difference from FDI | Not applicable | FDI gives ownership, ECB is only a loan |
Mains Key Points
Prelims Strategy Tips
Duties Related to Trade – Countervailing and Anti-Dumping Duties
When imports harm domestic industries due to subsidies or artificially low prices, governments impose special duties. Countervailing Duties are applied to neutralize foreign subsidies, while Anti-Dumping Duties counter unfairly low-priced imports.
When imports harm domestic industries due to subsidies or artificially low prices, governments impose special duties. Countervailing Duties are applied to neutralize foreign subsidies, while Anti-Dumping Duties counter unfairly low-priced imports.
Countervailing vs Anti-Dumping Duty
| Aspect | Countervailing Duty (CVD) | Anti-Dumping Duty (ADD) |
|---|---|---|
| Reason | Imposed to counter subsidies given by exporting country | Imposed to stop dumping (selling below normal value) |
| Purpose | Level the playing field for domestic producers | Protect domestic industries from artificially cheap imports |
| Impact | Neutralizes unfair subsidy advantage | Stops destruction of local industries |
| Example | China’s subsidized electronics in India | Chinese aluminium & chemicals in India (2021) |
Mains Key Points
Prelims Strategy Tips
Chapter Complete!
Ready to move to the next chapter?