
Economics Playlist
18 chapters • 0 completed
Introduction to Economics
10 topics
National Income
17 topics
Inclusive growth
15 topics
Inflation
21 topics
Money
15 topics
Banking
38 topics
Monetary Policy
15 topics
Investment Models
9 topics
Food Processing Industries
9 topics
Taxation
28 topics
Budgeting and Fiscal Policy
24 topics
Financial Market
34 topics
External Sector
37 topics
Industries
21 topics
Land Reforms in India
16 topics
Poverty, Hunger and Inequality
24 topics
Planning in India
16 topics
Unemployment
17 topics
Chapter 4: Inflation
Chapter TestInflation
Inflation is a sustained rise in the general price level of goods and services over time. It reduces the purchasing power of money and affects economic stability.
Inflation is a sustained rise in the general price level of goods and services over time. It reduces the purchasing power of money and affects economic stability.
Types of Inflation
| Type | Explanation | Example |
|---|---|---|
| Demand-Pull Inflation | When demand > supply, prices rise. | Festive demand for gold raises prices. |
| Cost-Push Inflation | When production costs increase, prices rise. | Rise in crude oil increases transport cost. |
| Imported Inflation | Due to rising prices of imports. | Global crude oil price rise impacts India. |
| Structural Inflation | Supply bottlenecks and inefficiencies. | Crop failure causes food inflation. |
| Inflationary Expectations | Future price rise expectations push current demand. | Consumers hoard goods expecting price hike. |
Mains Key Points
Prelims Strategy Tips
Demand-side Causes of Inflation
Inflation can arise when aggregate demand exceeds aggregate supply in an economy. Factors like higher disposable income, government expenditure, cheap credit, deficit financing, rising exports, and repayment of debt increase demand, pushing prices upward.
Inflation can arise when aggregate demand exceeds aggregate supply in an economy. Factors like higher disposable income, government expenditure, cheap credit, deficit financing, rising exports, and repayment of debt increase demand, pushing prices upward.
Demand-side Factors of Inflation
| Factor | Impact on Demand | Inflation Effect |
|---|---|---|
| Disposable Income | More household spending | Higher prices due to demand-pull effect |
| Public Expenditure | Govt projects increase demand | Higher input and service prices |
| Cheap Money Policy | More borrowing & investment | Demand-pull + Cost-push inflation |
| Deficit Financing | Govt borrows/prints money | Excess money supply = inflation |
| Increase in Exports | Domestic supply falls, exporters earn more | Domestic price rise |
| Repayment of Debt | Public gets more cash | Higher aggregate demand |
Mains Key Points
Prelims Strategy Tips
Types of Inflation (Based on Rate/Speed of Price Rise)
Inflation can be classified based on the speed of rise in prices—from mild creeping inflation to dangerous hyperinflation. The rate determines its impact on the economy, ranging from positive demand stimulation to complete economic collapse.
Inflation can be classified based on the speed of rise in prices—from mild creeping inflation to dangerous hyperinflation. The rate determines its impact on the economy, ranging from positive demand stimulation to complete economic collapse.
Types of Inflation by Speed
| Type | Rate of Price Rise | Impact |
|---|---|---|
| Creeping | Up to 2% annually | Boosts demand, favourable |
| Walking/Trotting | 3–9% annually | Hoarding tendency, demand rises |
| Galloping | 20–200% annually | Unstable economy, capital flight |
| Hyperinflation | Thousands–millions % annually | Collapse of currency, barter system returns |
Mains Key Points
Prelims Strategy Tips
Causes and Effects of Hyperinflation
Hyperinflation occurs when money supply grows uncontrollably without corresponding economic growth. It erodes trust in currency, fuels speculative hoarding, and can collapse the financial system.
Hyperinflation occurs when money supply grows uncontrollably without corresponding economic growth. It erodes trust in currency, fuels speculative hoarding, and can collapse the financial system.
Hyperinflation: Causes vs Effects
| Causes | Effects |
|---|---|
| Excessive money printing | Currency loses value; people shift to foreign currency |
| Large fiscal deficits | Savings destroyed; banks stop lending |
| Loss of trust in money | Hoarding of durable goods; inflation spiral |
| War or political crisis | Collapse of economy; barter system returns |
Mains Key Points
Prelims Strategy Tips
Deflation and Disinflation
Deflation = sustained fall in prices (negative inflation), harmful to economy. Disinflation = slowdown in inflation rate, not harmful.
Deflation = sustained fall in prices (negative inflation), harmful to economy. Disinflation = slowdown in inflation rate, not harmful.
Deflation vs Disinflation
| Aspect | Deflation | Disinflation |
|---|---|---|
| Price Trend | Prices fall (negative inflation) | Prices rise but at slower rate |
| Inflation Sign | Negative inflation (e.g., -2%) | Positive inflation (e.g., 10% → 8%) |
| Impact | Harmful: causes slowdown, unemployment | Not harmful: signals stability |
| Consumer Behaviour | Postpone spending, increase saving | Spend normally; no fear of falling prices |
| Debt Burden | Increases real value of debt | No impact on real debt |
Mains Key Points
Prelims Strategy Tips
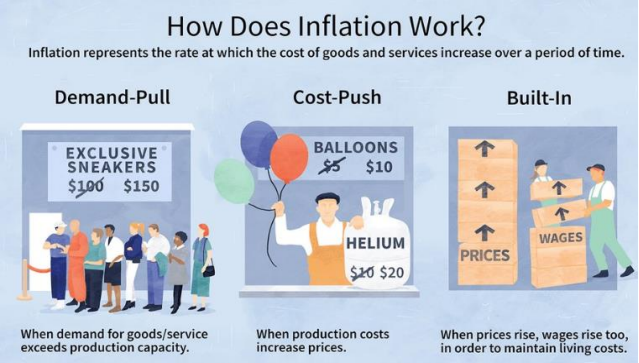
Demand-Pull Inflation
Occurs when demand for goods and services exceeds supply ('too much money chasing too few goods'). It is demand-driven price rise.
Occurs when demand for goods and services exceeds supply ('too much money chasing too few goods'). It is demand-driven price rise.
Key Features of Demand-Pull Inflation
| Aspect | Description |
|---|---|
| Definition | Inflation caused by demand > supply |
| Famous Phrase | 'Too much money chasing too few goods' |
| Causes | High money supply, government spending, tax cuts, rising demand |
| Impact | Rising prices, wage-price spiral, overheating of economy |
| Example | Book bidding, economic boom-driven inflation |
Mains Key Points
Prelims Strategy Tips
Cost-Push Inflation & Structural Inflation
Cost-push inflation occurs when rising production costs (wages, raw materials, taxes) push prices upward. Structural inflation arises from bottlenecks and inefficiencies in supply chains, common in developing economies like India.
Cost-push inflation occurs when rising production costs (wages, raw materials, taxes) push prices upward. Structural inflation arises from bottlenecks and inefficiencies in supply chains, common in developing economies like India.
Difference Between Cost-Push and Structural Inflation
| Aspect | Cost-Push Inflation | Structural Inflation |
|---|---|---|
| Definition | Price rise due to higher production costs | Price rise due to bottlenecks & weak infrastructure |
| Nature | Short to medium term (supply shock) | Long-term & chronic (systemic weakness) |
| Causes | Rupee depreciation, higher wages, raw material cost, taxes | Poor roads, storage, markets, inefficient supply chain |
| Example | Crude oil price rise → transport cost inflation | Apples ₹1000 at farm → ₹2000 at retail due to bottlenecks |
Mains Key Points
Prelims Strategy Tips
Effects of Inflation (Detailed)
Inflation not only raises prices but also reshapes how money works in daily life. It affects how much we can buy, how loans and debts are settled, how people save or invest, and how banks decide interest rates. These effects can be good in short term but harmful in long run if inflation remains high.
Inflation not only raises prices but also reshapes how money works in daily life. It affects how much we can buy, how loans and debts are settled, how people save or invest, and how banks decide interest rates. These effects can be good in short term but harmful in long run if inflation remains high.
Effects of Inflation Expanded View
| Aspect | Impact | Everyday Example |
|---|---|---|
| Purchasing Power | Money buys fewer goods | Milk costs ₹40 → ₹50 in a year |
| Creditors vs Debtors | Borrowers gain, lenders lose | Loan repayment worth less in real terms |
| Savings | Short-run ↑, Long-run ↓ | People shift from bank FDs to gold |
| Interest Rates | Banks raise both deposit & lending rates | Home loan becomes expensive when repo rate ↑ |
Effects of Inflation on Lending, Investment, Expenditure, Employment, Wages
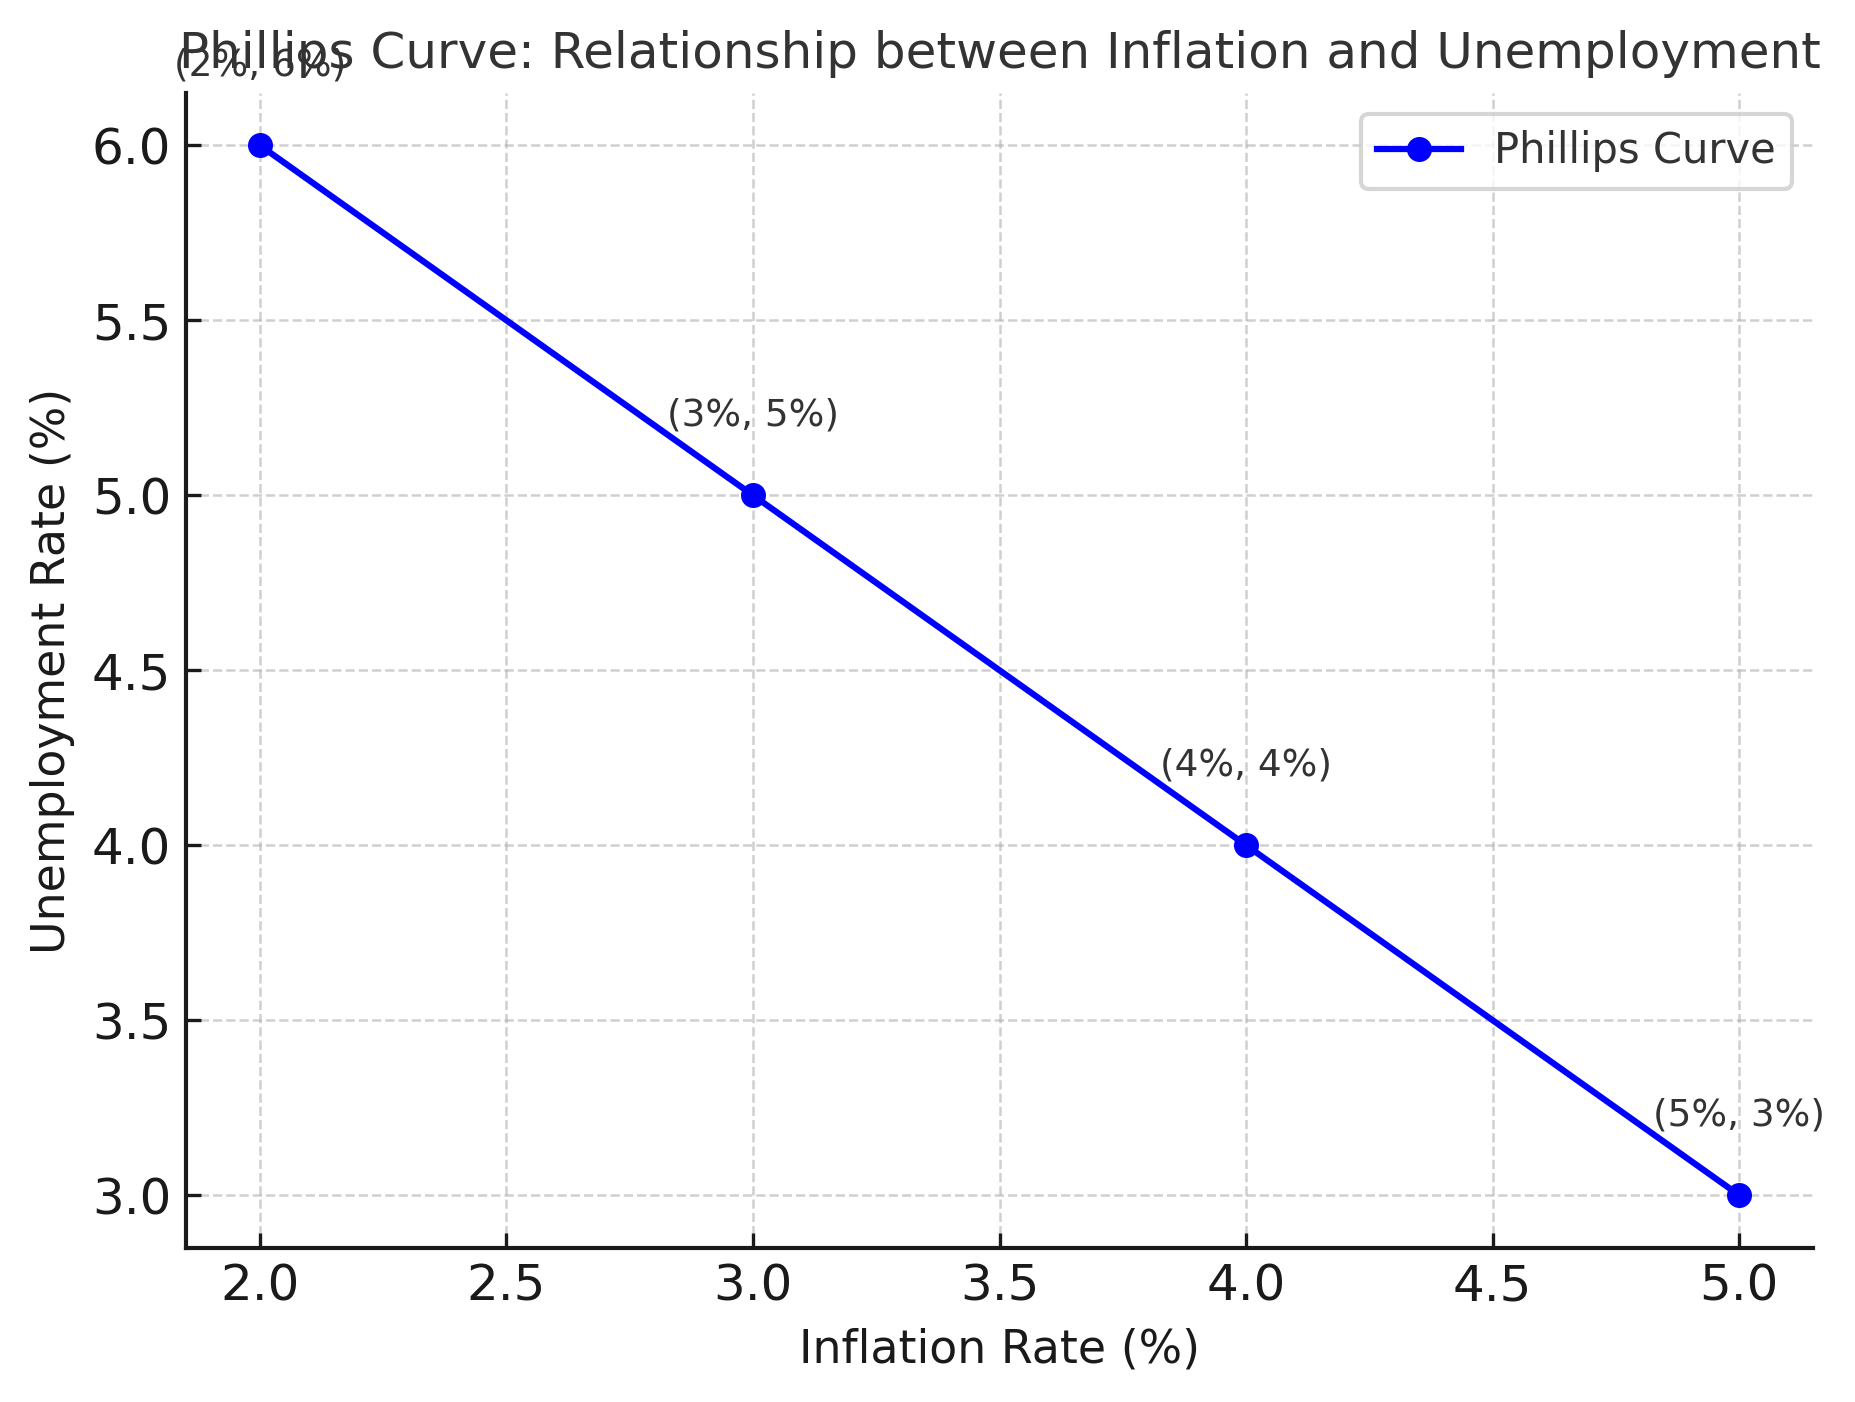
Inflation influences almost every aspect of an economy: credit availability, business investment, consumer spending, employment levels, and even people's wages. Mild inflation can stimulate economic activity in the short run, but persistently high inflation distorts incentives, reduces real incomes, and dampens growth in the long run.
Inflation influences almost every aspect of an economy: credit availability, business investment, consumer spending, employment levels, and even people's wages. Mild inflation can stimulate economic activity in the short run, but persistently high inflation distorts incentives, reduces real incomes, and dampens growth in the long run.
Inflation Effects on Key Economic Areas
| Aspect | Short-run (Mild Inflation) | Long-run (High Inflation) |
|---|---|---|
| Lending | Abundant credit, low rates | Costly credit, higher interest rates |
| Investment | Expansion due to high demand | Dampened due to costly loans |
| Consumption | Initially stable | Falls as goods get costlier |
| Aggregate Demand | Encourages production | Supply bottlenecks keep inflation high |
| Employment | More jobs created | Job losses, neutral/negative hiring |
| Wages | Nominal wages rise | Real wages fall, purchasing power decreases |
| Self-employed | Can benefit from higher prices | Suffer due to high input costs and falling demand |
Impact of Inflation on Exchange Rate and Exports
Inflation erodes the purchasing power of money, weakens currency in international markets, and influences export competitiveness. The effect depends on relative inflation between trading partners, exchange rate regime, and interest rate policies.
Inflation erodes the purchasing power of money, weakens currency in international markets, and influences export competitiveness. The effect depends on relative inflation between trading partners, exchange rate regime, and interest rate policies.
Impact of Inflation on Exchange Rate & Exports
| Factor | Short-run Impact | Long-run Impact |
|---|---|---|
| Exchange Rate | Currency depreciates, boosting exports | Sustained inflation weakens confidence → more depreciation |
| Exports | Cheaper for foreign buyers, exporters benefit | High input costs reduce competitiveness |
| Interest Rate Link | Higher interest rates attract foreign investment, currency appreciates | Persistent inflation makes policy unstable, deters long-term investment |
Impact of Inflation on Imports, Balance of Trade, and Taxpayers
Inflation directly affects imports by making foreign goods costlier, influences balance of trade depending on a country’s economic structure, and increases the burden on taxpayers through higher indirect taxes and bracket creep in direct taxes.
Inflation directly affects imports by making foreign goods costlier, influences balance of trade depending on a country’s economic structure, and increases the burden on taxpayers through higher indirect taxes and bracket creep in direct taxes.
Inflation Impact Summary
| Aspect | Impact |
|---|---|
| Imports | Costlier due to currency depreciation; leads to imported inflation |
| Balance of Trade | Developed nations may benefit, developing nations often face deficits due to costly essential imports |
| Taxpayers | Indirect taxes rise with higher prices; direct taxes rise due to bracket creep |
Impact of Inflation on Capital Gains Tax and Economic Growth
Inflation affects taxation by inflating nominal capital gains, which may result in higher tax liability unless adjusted for inflation through indexation. It also influences economic growth positively in mild doses but negatively when it is high and uncontrolled.
Inflation affects taxation by inflating nominal capital gains, which may result in higher tax liability unless adjusted for inflation through indexation. It also influences economic growth positively in mild doses but negatively when it is high and uncontrolled.
Important Concepts Related to Inflation
These terms describe different types and patterns of inflation such as reflation (reviving economy), skewflation (imbalanced inflation in some goods), open inflation (market-driven price rise), headline inflation (overall CPI-based inflation), and core inflation (inflation excluding volatile items).
These terms describe different types and patterns of inflation such as reflation (reviving economy), skewflation (imbalanced inflation in some goods), open inflation (market-driven price rise), headline inflation (overall CPI-based inflation), and core inflation (inflation excluding volatile items).
Types of Inflation Concepts
| Concept | Explanation | Example |
|---|---|---|
| Reflation | Government increases money supply/expenditure to revive economy | Great Depression, 2008 Crisis |
| Skewflation | Price rise in few goods/services faster than average inflation | Healthcare inflation higher than overall CPI |
| Open Inflation | Free market price rise due to demand > supply | Consumer goods prices rise |
| Headline Inflation | Overall CPI-based inflation including food & fuel | CPI headline numbers in India |
| Core Inflation | Inflation excluding food & fuel (stable) | India’s core CPI figures |
Prelims Strategy Tips
Advanced Concepts Related to Inflation
These are refined economic terms that explain hidden inflation (shrinkflation), statistical effect on inflation (base effect), gaps between demand and supply (inflationary/deflationary gap), and wage-price cycles (inflationary spiral).
These are refined economic terms that explain hidden inflation (shrinkflation), statistical effect on inflation (base effect), gaps between demand and supply (inflationary/deflationary gap), and wage-price cycles (inflationary spiral).
Key Inflation Concepts
| Concept | Meaning | Impact |
|---|---|---|
| Shrinkflation | Product size reduces but price same | Hidden inflation; consumers pay more unknowingly |
| Base Effect | Inflation depends on reference year (base index) | Same price rise shows different % inflation |
| Inflationary Gap | Demand > Supply at full employment | Leads to price rise (demand-pull inflation) |
| Inflationary Spiral | Wages and prices rise in a cycle | Persistent inflation and wage demands |
| Deflationary Gap | Demand < Supply at full employment | Causes price fall, unemployment and slowdown |
Prelims Strategy Tips
Special Concepts Related to Inflation
These concepts—Inflation Tax, Inflation Accounting, and Inflation Premium—explain hidden effects of inflation on money holders, companies, and borrowers.
These concepts—Inflation Tax, Inflation Accounting, and Inflation Premium—explain hidden effects of inflation on money holders, companies, and borrowers.
Special Inflation Concepts
| Concept | Meaning | Impact |
|---|---|---|
| Inflation Tax | Loss of money’s value during inflation | Cash holders lose purchasing power |
| Inflation Accounting | Adjusting profits for inflation | Shows real profit instead of overstated profit |
| Inflation Premium | Borrower’s benefit from inflation | Borrowers repay less in real terms; lenders lose |
Prelims Strategy Tips
Indicators of Inflation – Producer Price Index (PPI)
Producer Price Index (PPI) measures inflation from the perspective of producers instead of consumers. It is used globally (like in OECD countries) to capture changes in prices at wholesale and production stages.
Producer Price Index (PPI) measures inflation from the perspective of producers instead of consumers. It is used globally (like in OECD countries) to capture changes in prices at wholesale and production stages.
Comparison: WPI vs PPI
| Aspect | WPI | PPI |
|---|---|---|
| Coverage | Only goods, no services | Goods + Services |
| Bias | Double-counting issues | More accurate representation |
| Use in India | Used officially | Not used yet |
| Global Alignment | Not aligned with global standards | Follows international best practices |
| Role in GDP | Less accurate deflator | Better for real GDP calculation |
Prelims Strategy Tips
Wholesale Price Index (WPI)
The Wholesale Price Index (WPI) measures overall changes in prices of goods at the wholesale level, i.e., before goods reach the retail stage. It excludes services and is widely used to track inflation trends in India.
The Wholesale Price Index (WPI) measures overall changes in prices of goods at the wholesale level, i.e., before goods reach the retail stage. It excludes services and is widely used to track inflation trends in India.
WPI Commodity Basket (Old vs New Base Year)
| Category | Weightage (2004-05) | Weightage (2011-12) | Remarks |
|---|---|---|---|
| Primary Articles (Food, Non-Food: cereals, fruits, vegetables, minerals) | 20.12% | 22.62% | Increased |
| Fuel & Power (coal, electricity, petrol, diesel) | 14.91% | 13.15% | Decreased |
| Manufactured Products (textiles, apparels, paper, chemicals, processed foods) | 64.97% | 64.23% | Slightly Decreased |
| Total | 100% | 100% | No Change |
Prelims Strategy Tips
Wholesale Food Price Index (WPI Food Index) & Consumer Price Index (CPI)
WPI Food Index measures inflation in wholesale food items (producer level), while CPI measures inflation at the retail consumer level (consumption point). Together, they provide a complete picture of inflation in India.
WPI Food Index measures inflation in wholesale food items (producer level), while CPI measures inflation at the retail consumer level (consumption point). Together, they provide a complete picture of inflation in India.
WPI vs CPI
| Aspect | WPI | CPI |
|---|---|---|
| Level | Wholesale (producer level) | Retail (consumer level) |
| Coverage | 697 commodities, excludes services | Goods + Services (consumer basket) |
| Publishing Agency | DPIIT, Ministry of Commerce & Industry | NSO, Ministry of Statistics & Programme Implementation |
| Base Year | 2011-12 | 2012 |
| Usage | Used for wholesale inflation trends | Used by RBI for inflation targeting |
Prelims Strategy Tips
Types of Consumer Price Index (CPI) in India
India compiles multiple types of CPI to capture inflation for different groups – workers, rural and urban population, and overall retail inflation. These indices serve different policy and administrative purposes such as wage revisions, DA calculation, and monetary policy.
India compiles multiple types of CPI to capture inflation for different groups – workers, rural and urban population, and overall retail inflation. These indices serve different policy and administrative purposes such as wage revisions, DA calculation, and monetary policy.
Types of CPI Compiled in India
| CPI Type | Base Year | Released by | Significance |
|---|---|---|---|
| CPI for Industrial Workers (CPI-IW) | 2016 | Labour Bureau (Ministry of Labour & Employment), released monthly | Used for DA (Dearness Allowance) of govt. employees, dearness relief for pensioners, wage revisions. Pay Commissions also use this index. |
| CPI for Agricultural Workers (CPI-AL) | 1986-87 | Labour Bureau, released monthly | Used for revising minimum wages of agricultural labourers in different states. |
| CPI for Rural Labourers (CPI-RL) | 1986-87 | Labour Bureau, released monthly | Used for revising minimum wages of rural labourers in different states. |
| CPI (Urban) | 2012 | National Statistics Office (NSO) | Tracks price level of goods & services consumed by urban population. |
| CPI (Rural) | 2012 | National Statistics Office (NSO) | Tracks price level of goods & services consumed by rural population. |
| CPI (Combined – Rural + Urban) | 2012 | National Statistics Office (NSO) | Official inflation measure used by RBI for monetary policy & inflation targeting. |
| Consumer Food Price Index (CFPI) | 2012 | National Statistics Office (NSO) | Measures retail price changes of food items only. Gives food inflation for rural, urban, and all-India levels. Excludes beverages, packaged meals, pan, tobacco, and intoxicants. |
Comparison of CPI vs WPI
| Aspect | WPI | CPI |
|---|---|---|
| Level of Tracking | Producer/Wholesale level | Consumer/Retail level |
| Coverage | 697 commodities, no services | Goods + Services (consumer basket) |
| Weightage | Higher weightage to manufactured goods | Higher weightage to food items |
| Usage in India | Used for wholesale inflation analysis | Used by RBI for inflation targeting & monetary policy |
Prelims Strategy Tips
Divergence between WPI, CPI and GDP Deflator
While WPI, CPI and GDP Deflator all measure inflation, they often diverge due to differences in coverage, weights, inclusion/exclusion of services, and calculation methods. CPI reflects consumer-level inflation, WPI captures wholesale-level inflation, and GDP deflator is a broad economy-wide measure.
While WPI, CPI and GDP Deflator all measure inflation, they often diverge due to differences in coverage, weights, inclusion/exclusion of services, and calculation methods. CPI reflects consumer-level inflation, WPI captures wholesale-level inflation, and GDP deflator is a broad economy-wide measure.
Comparison of WPI, CPI and GDP Deflator
| Aspect | WPI | CPI | GDP Deflator |
|---|---|---|---|
| Level | Wholesale level (producer prices) | Retail level (consumer prices) | Overall economy-wide inflation |
| Coverage | 697 goods (no services) | Goods + Services (consumer basket) | All domestically produced goods and services |
| Inclusion of Imports | Yes | Yes | No (only domestic output) |
| Weightage | High weight to manufactured goods | High weight to food items | Implicit weights (all GDP components) |
| Publisher | Office of Economic Advisor, Ministry of Commerce | National Statistics Office (NSO) | NSO (with GDP data) |
| Frequency | Monthly | Monthly | Quarterly (with GDP release) |
Prelims Strategy Tips
Measures to Control Inflation
Inflation means a continuous rise in prices of goods and services, which reduces the purchasing power of money. To control it, governments and the Reserve Bank of India (RBI) adopt supply-side, cost-side, and demand-side measures. These can be short-term (quick actions) or long-term (structural reforms).
Inflation means a continuous rise in prices of goods and services, which reduces the purchasing power of money. To control it, governments and the Reserve Bank of India (RBI) adopt supply-side, cost-side, and demand-side measures. These can be short-term (quick actions) or long-term (structural reforms).
Monetary Policy vs Fiscal Policy Measures
| Aspect | Monetary Policy (RBI) | Fiscal Policy (Government) |
|---|---|---|
| CRR & SLR | RBI increases them → Banks must keep more reserves → Less money for loans. | Not applicable |
| Repo Rate | RBI raises repo → Loans become costlier → Borrowing reduces. | Not applicable |
| Reverse Repo Rate | Higher rate → Banks park money with RBI → Less lending. | Not applicable |
| Open Market Operations | RBI sells government bonds → Absorbs excess money. | Not applicable |
| Credit Control | RBI tells banks to restrict loans in high-inflation sectors. | Not applicable |
| Taxation | Not applicable | Raise taxes to reduce demand (for demand-pull) or cut taxes to lower costs (for cost-push). |
| Public Expenditure | Not applicable | Cut subsidies, reduce unnecessary govt. schemes, rationalise expenditure. |
| Fiscal Deficit | Not applicable | Reduce borrowing and deficit by better revenue management. |
Prelims Strategy Tips
Chapter Complete!
Ready to move to the next chapter?