
Economics Playlist
18 chapters • 0 completed
Introduction to Economics
10 topics
National Income
17 topics
Inclusive growth
15 topics
Inflation
21 topics
Money
15 topics
Banking
38 topics
Monetary Policy
15 topics
Investment Models
9 topics
Food Processing Industries
9 topics
Taxation
28 topics
Budgeting and Fiscal Policy
24 topics
Financial Market
34 topics
External Sector
37 topics
Industries
21 topics
Land Reforms in India
16 topics
Poverty, Hunger and Inequality
24 topics
Planning in India
16 topics
Unemployment
17 topics
Chapter 17: Planning in India
Chapter TestPlanning in India – Meaning, Process & Pre-Independence Blueprints
Economic planning means thinking ahead and organizing resources to meet clear goals for growth and welfare within a set time. In India, planning combines goal-setting (what), strategy (how), resource use (with what), and implementation/monitoring (by whom, when). Before independence, several influential blueprints—Visvesvaraya Plan, Congress/NPC Plan, Bombay Plan, Gandhian Plan, People’s Plan, and Sarvodaya Plan—shaped India’s later Five-Year Plans.
Economic planning means thinking ahead and organizing resources to meet clear goals for growth and welfare within a set time. In India, planning combines goal-setting (what), strategy (how), resource use (with what), and implementation/monitoring (by whom, when). Before independence, several influential blueprints—Visvesvaraya Plan, Congress/NPC Plan, Bombay Plan, Gandhian Plan, People’s Plan, and Sarvodaya Plan—shaped India’s later Five-Year Plans.
Pre-Independence Planning Blueprints – Who Proposed What?
| Plan / Year | Who / Source | Core Idea | Focus Areas | Why It Mattered |
|---|---|---|---|---|
| Visvesvaraya Plan (1934) | M. Visvesvaraya, 'Planned Economy of India' | Democratic capitalism; rapid industrialisation; double national income in ~10 years | Heavy industry, productivity, modern management | First systematic blueprint; stressed efficiency & industry-led growth |
| Congress / NPC Plan (1938; reports 1948-49) | National Planning Committee chaired by J. L. Nehru | Comprehensive national plan; state guidance with social objectives | All major sectors; long-term development | Placed planning at centre of nation-building discourse |
| Bombay Plan (1944-45) | 8 leading industrialists: JRD Tata, GD Birla, et al. | Growth needs strong state intervention & regulation; big public investment | Infrastructure, heavy industry, social services | Remarkable: business leaders asking for state-led planning & welfare |
| Gandhian Plan (1944) | Sriman Narayan Agarwal (Gandhian thought) | Decentralised, village-centric economy; small & cottage industries | Agriculture, khadi, rural crafts; self-reliant villages | Counter-vision to heavy-industry bias; emphasised sustainability & dignity of labour |
| People’s Plan (1945) | M. N. Roy | Marxist socialist approach; guarantee basic necessities to all | Employment, food, health, housing | Inspired later common minimum programmes (UF 1990s; UPA 2004) |
| Sarvodaya Plan (1950) | Jayaprakash Narayan; inspired by Gandhi & Vinoba | Sarvodaya (welfare of all), trusteeship, community action | Agri & agri-based small industries, land reforms, minimal foreign dependence | Reinforced decentralised, participatory planning and rural self-reliance |
Mains Key Points
Prelims Strategy Tips
Major Objectives and Types of Economic Planning in India
Economic planning in India was designed to address socio-economic challenges like poverty, unemployment, inequality, and underdevelopment. It aims at achieving growth, modernisation, self-reliance, and social justice. Over time, planning evolved into different models—democratic vs totalitarian, centralised vs decentralised, directive vs indicative, financial vs physical, functional vs structural, comprehensive vs partial—each reflecting different approaches to organising and managing resources.
Economic planning in India was designed to address socio-economic challenges like poverty, unemployment, inequality, and underdevelopment. It aims at achieving growth, modernisation, self-reliance, and social justice. Over time, planning evolved into different models—democratic vs totalitarian, centralised vs decentralised, directive vs indicative, financial vs physical, functional vs structural, comprehensive vs partial—each reflecting different approaches to organising and managing resources.
Comparison of Types of Planning
| Type | Description | Example |
|---|---|---|
| Democratic | Participatory, consultative; parliament oversight | India |
| Totalitarian | Central authority controls all activities | Soviet Union |
| Centralised | Controlled by a national planning authority | India’s early 5YPs |
| Decentralised | Local bodies plan for local needs | Kerala People’s Plan |
| By Direction | Targets ordered by state authority | USSR model |
| By Inducement | Use of subsidies, fiscal tools | Indian mixed economy |
| Indicative | Broad goals, private freedom | France, India post-1991 |
| Imperative | Rigid, compulsory targets | China (pre-reforms) |
| Financial | Resource allocation in money terms | Budgets |
| Physical | Resource allocation in real goods | Steel, coal, manpower plans |
| Functional | Solves short-term economic difficulties | Crisis-management plans |
| Structural | Deep changes in socio-economic structure | Land reforms |
| Comprehensive | All sectors covered | Five-Year Plans |
| Partial | Only some sectors covered | Agriculture-focused plans |
Mains Key Points
Prelims Strategy Tips
Central Planning in India – Central Plans & Early Five-Year Plans
Central Plans are nationwide plans formulated and funded by the Union Government. India used three major central plan instruments: Five-Year Plans, the Twenty-Point Programme, and MPLAD. Among these, Five-Year Plans were the backbone of India’s development strategy—setting goals, choosing sectors to prioritise, allocating resources, and tracking outcomes.
Central Plans are nationwide plans formulated and funded by the Union Government. India used three major central plan instruments: Five-Year Plans, the Twenty-Point Programme, and MPLAD. Among these, Five-Year Plans were the backbone of India’s development strategy—setting goals, choosing sectors to prioritise, allocating resources, and tracking outcomes.
Five-Year Plans (I to V): Focus, Model, Highlights, Outcomes
| Plan (Years) | Primary Focus | Model/Strategy | Key Institutions/Outcomes | Growth |
|---|---|---|---|---|
| I (1951–56) | Agriculture, irrigation, power | Harrod–Domar | IITs start, UGC set up, agri research & extension | ~3.6% |
| II (1956–61) | Heavy industry, capital goods | Mahalanobis | Bhilai/Durgapur/Rourkela steel, hydro, TIFR, AEC, coal & NE rail | ~4.27% |
| III (1961–66) | Food self-sufficiency + industry | Gadgil orientation; Sandy–Chakravarty ideas | Agriculture push (wheat), but wars & drought hit targets | ~2.84% |
| Annual Plans (1966–69) | Agriculture rescue; exports | Crisis mgmt; Green Revolution start | IMF borrowing; 1966 rupee devaluation | — |
| IV (1969–74) | Growth + stability + self-reliance | Gadgil strategy | 14 banks nationalised; Green Revolution deepens | ~3.33% |
| V (1974–79) | Garibi Hatao, jobs, self-reliance | D. D. Dhar framework | MNP, NH system, 20-Point (1975), RBI inflation role | ~4.8% (ended early) |
Mains Key Points
Prelims Strategy Tips
Central Planning (1978–2017): Rolling Plan to Twelfth Five-Year Plan
After the early Five-Year Plans, India’s central planning moved through the Rolling Plan, the reform years of the 6th–8th Plans, consolidation in the 9th–10th, ‘inclusive growth’ in the 11th, and ‘inclusive & sustainable growth’ in the 12th. The period saw major shifts: from rigid five-year blueprints to flexible rolling targets, from state-led industry to liberalisation, and from input targets to measurable outcomes.
After the early Five-Year Plans, India’s central planning moved through the Rolling Plan, the reform years of the 6th–8th Plans, consolidation in the 9th–10th, ‘inclusive growth’ in the 11th, and ‘inclusive & sustainable growth’ in the 12th. The period saw major shifts: from rigid five-year blueprints to flexible rolling targets, from state-led industry to liberalisation, and from input targets to measurable outcomes.
Plans at a Glance (1978–2017)
| Plan/Period | Core Focus | Key Actions/Institutions | Outcome (Growth) |
|---|---|---|---|
| Rolling Plan (1978–80) | Flexibility; annual updating | 3-tier: annual, medium (≈3y), long perspective | — |
| Sixth (1980–85) | Income, modernisation, poverty/jobs, family planning | NABARD (1982) | ~5.7% (target 5.2%) |
| Seventh (1985–90) | Productivity, tech upgrade, foodgrains, jobs with justice | Decentralisation push; but BoP/fiscal stress | ~6% (target 5%) |
| Annual Plans (1990–92) | Employment & social transformation | LPG reforms begin (1991) | — |
| Eighth (1992–97) | Redefine state role; infra; subsidy/fiscal reform; decentralise | Modernise industry; gradual opening | ~6.8% (target 5.6%) |
| Ninth (1997–2002) | BMS social services; fiscal consolidation | User charges; PRIs; stronger PDS | ~5.4% (plan) | ~6.7% avg/yr |
| Tenth (2002–07) | Poverty↓, quality jobs, gender gaps↓; regional balance | Monitorable targets (11 indicators) | ~7.6% (target 8%) |
| Eleventh (2007–12) | Inclusive growth; skills; agri 4%; TFR 2.1 | Faced inflation/strong INR/oil shock | ~8% (target 10%) |
| Twelfth (2012–17) | Inclusive & sustainable; services access | 50M non-farm jobs; power/water/banking; nutrition; HE | Target 9% (contextual outcomes) |
Mains Key Points
Prelims Strategy Tips
Twenty-Point Programme (TPP) & MPLAD Scheme
The Twenty-Point Programme (1975, restructured later) was a central poverty alleviation and rural quality-of-life initiative, while the MPLADS (1993) scheme empowers Members of Parliament to recommend development projects in their constituencies. Both aimed to improve basic services, but faced criticisms on effectiveness, misuse, and conflict with democratic principles.
The Twenty-Point Programme (1975, restructured later) was a central poverty alleviation and rural quality-of-life initiative, while the MPLADS (1993) scheme empowers Members of Parliament to recommend development projects in their constituencies. Both aimed to improve basic services, but faced criticisms on effectiveness, misuse, and conflict with democratic principles.
Comparison – TPP vs MPLADS
| Aspect | Twenty-Point Programme (TPP) | MPLADS |
|---|---|---|
| Launch | 1975 (restructured 1982, 1986, 2006) | 1993 |
| Nature | Centrally monitored poverty-alleviation umbrella | Central Sector Scheme; direct MP recommendations |
| Focus | Rural poverty, employment, health, housing, education | Durable community assets (water, roads, schools, health) |
| Funding | Part of central/state scheme budgets | ₹5 crore per MP per year (2 installments) |
| Criticism | Became outdated; phased out in 2015 | Misuse, corruption, conflict with separation of powers, low utilisation |
Mains Key Points
Prelims Strategy Tips
Critical Evaluation of the Planning Process in India
India’s planning built core capacity (infrastructure, industry, irrigation, human capital) but struggled with weak long-term perspective, regional imbalance, over-centralisation, job-poor strategies, PSU dominance, and an industry-first bias over agriculture. Post-1991 reforms and the 73rd/74th Amendments nudged planning toward decentralisation, private participation, outcome-based monitoring, and inclusion—yet gaps remain in data quality, local finance, accountability, and execution.
India’s planning built core capacity (infrastructure, industry, irrigation, human capital) but struggled with weak long-term perspective, regional imbalance, over-centralisation, job-poor strategies, PSU dominance, and an industry-first bias over agriculture. Post-1991 reforms and the 73rd/74th Amendments nudged planning toward decentralisation, private participation, outcome-based monitoring, and inclusion—yet gaps remain in data quality, local finance, accountability, and execution.
Strengths and Weaknesses of India’s Planning Experience
| Aspect | Strengths (What Worked) | Weaknesses (What Fell Short) |
|---|---|---|
| Capacity Creation | Steel, power, dams, roads; IIT/UGC; Green Revolution | Maintenance gaps; time/cost overruns; uneven access |
| Growth Quality | Industrial base; services surge post-1991 | Jobless/low-job growth; MSME constraints |
| Equity & Regions | Targeted welfare, DBT/JAM; focus on aspirational districts | Regional imbalance persisted; urban slums/tribal areas lag |
| Governance | Shift to outcome dashboards; GIS monitoring | Over-centralisation; weak local finance/cadre; thin evaluation culture |
| Agriculture | Input support, MSP cereals, irrigation expansion | Low value-addition/diversification; volatile farm incomes |
| PSUs & Markets | Strategic capacity, nation-building | Monopolies, inefficiency, fiscal burdens; uneven PSU reform |
Mains Key Points
Prelims Strategy Tips
Multi-level Planning in India
Multi-level Planning (MLP) means planning is not only done at the Centre; it happens at every tier—nation, state, district, block and village—with each level both guiding the level below and learning from the level above. It aims to make plans locally relevant, faster to execute, and more accountable through function sharing, fiscal and administrative decentralisation, and people’s participation.
Multi-level Planning (MLP) means planning is not only done at the Centre; it happens at every tier—nation, state, district, block and village—with each level both guiding the level below and learning from the level above. It aims to make plans locally relevant, faster to execute, and more accountable through function sharing, fiscal and administrative decentralisation, and people’s participation.
Five Levels of Multi-level Planning – Who Does What?
| Level | Core Role | Typical Works/Decisions |
|---|---|---|
| National/Central | Macro vision, funding, standards, flagship schemes | National policies, big infra, inter-state issues |
| State | Adapt national goals; allocate across departments/regions | State sector plans, health/education/irrigation priorities |
| District | Aggregate block/ULB plans; ensure balance | District roads, hospitals, school upgradation, land records |
| Block | Targeting, supervision, tech support to Panchayats | Beneficiary lists, work estimates, convergence of schemes |
| Panchayat/Village/ULB | Micro-works, O&M, local monitoring | Handpumps, drains, streets, streetlights, anganwadi repair |
Principles of MLP – At a Glance
| Principle | Meaning | Beginner Hint |
|---|---|---|
| Function sharing | Clear division of duties across tiers | कौन योजना बनाएगा/कौन कार्य करेगा |
| Financial decentralisation | Funds & revenue powers devolved downward | पैसा बिना अधिकार = योजना काग़ज़ पर |
| Administrative decentralisation | Staff/skills/procurement at local tiers | इंजीनियर/लेखा/आईटी टीम चाहिए |
| Public participation | Gram/ward sabhas, social audit | लोग चुनें, लोग देखें |
| Nesting/integration | Bottom-up aggregation + top-down guidance | नीचे की ज़रूरतें + ऊपर की नीति = फिट |
Mains Key Points
Prelims Strategy Tips
Decentralised Planning in India
Decentralised planning means decisions about development are taken closer to the people—by local governments (Panchayats/Urban Local Bodies) with community participation. It aims to make plans more relevant, faster to execute, and accountable by sharing functions, funds, and functionaries across tiers, especially after the 73rd/74th Constitutional Amendments.
Decentralised planning means decisions about development are taken closer to the people—by local governments (Panchayats/Urban Local Bodies) with community participation. It aims to make plans more relevant, faster to execute, and accountable by sharing functions, funds, and functionaries across tiers, especially after the 73rd/74th Constitutional Amendments.
Timeline – Building Blocks of Decentralised Planning (Select Milestones)
| Year/Body | What it proposed/changed |
|---|---|
| 1951–56 (1st Plan) | Community Development Blocks → multi-tier approach idea |
| 1957 (Balwant Rai Mehta) | Village/Block/District Panchayats recommended |
| 1967 (ARC) | Local variations + resources; area-specific planning |
| 1969 (Planning Commission) | Detailed district plan guidelines; annual/medium/perspective plans |
| 1978 (M.L. Dantwala) | Block-level planning → link between village & district |
| 1983–84 (RBI/CSS) | Strengthen district plan & district credit plan |
| 1984 (Hanumantha Rao) | Devolution of functions, funds, finances; district planning bodies |
| 1985 (GVK Rao) | District Panchayat to manage rural development programmes |
| 1992 (73rd/74th CAA) | Constitutional status to PRIs/ULBs; DPCs for plan integration |
Who Does What? (Rural & Urban)
| Tier | Role | Examples |
|---|---|---|
| Village/Ward | Identify needs; micro-works; monitoring | Handpumps, drains, Anganwadi repair |
| Block | Consolidate village/ward plans; tech/estimates; convergence | Beneficiary lists, estimates, scheme mapping |
| District (DPC) | Integrate rural + urban plans; prioritise & budget | District roads, PHCs, markets, bus stands |
| State | Standards, sector policies, funds, oversight | State schemes, guidelines, capacity support |
| Centre | National vision, flagship funding, norms | Jal Jeevan, SBM, PMGSY, health/education missions |
Mains Key Points
Prelims Strategy Tips
Bodies Associated with Planning in India – Planning Commission (1950–2014)
The Planning Commission was set up by a Union Cabinet resolution on March 15, 1950 as an extra-constitutional, advisory body to steer India’s planned development. Chaired by the Prime Minister with a full-time Deputy Chairman (cabinet rank), it assessed resources, set priorities, prepared Five-Year Plans, and worked with the National Development Council (NDC) for approval and coordination. Over time it was criticised for centralisation, delays, and weak federal accommodation.
The Planning Commission was set up by a Union Cabinet resolution on March 15, 1950 as an extra-constitutional, advisory body to steer India’s planned development. Chaired by the Prime Minister with a full-time Deputy Chairman (cabinet rank), it assessed resources, set priorities, prepared Five-Year Plans, and worked with the National Development Council (NDC) for approval and coordination. Over time it was criticised for centralisation, delays, and weak federal accommodation.
Planning Commission – Key Facts at a Glance
| Aspect | Details |
|---|---|
| Legal status | Extra-constitutional, created by Union Cabinet Resolution (15 March 1950) |
| Head | Prime Minister (Chairperson) |
| Executive head | Full-time Deputy Chair (cabinet rank), plus Members/Advisers |
| Core functions | Assess resources, set priorities, prepare Five-Year Plans, allocate outlays, monitor |
| NDC link | NDC discussed/approved plan strategies; Centre–State coordination |
| Strengths | National coordination, resource focus, institution/infra building |
| Key criticisms | Centralisation, slow/delayed policy, political pressures, bureaucratic dominance |
Mains Key Points
Prelims Strategy Tips
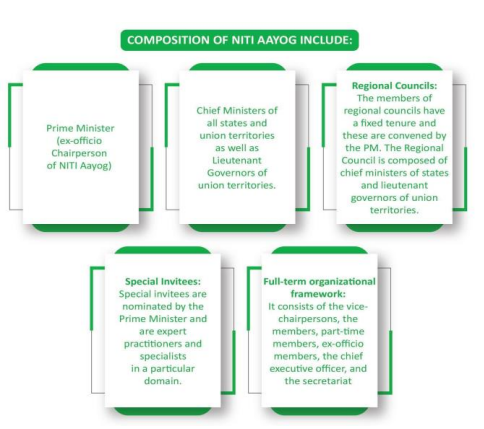
NITI Aayog (2015–Present)
NITI Aayog, or the National Institution for Transforming India, was established in 2015 as the government’s premier policy think tank to replace the Planning Commission. Unlike the Planning Commission, which followed a centralised command economy model, NITI Aayog focuses on cooperative and competitive federalism, evidence-based policymaking, and providing strategic advice to both the Centre and States. It is an executive body, not a constitutional or statutory institution.
NITI Aayog, or the National Institution for Transforming India, was established in 2015 as the government’s premier policy think tank to replace the Planning Commission. Unlike the Planning Commission, which followed a centralised command economy model, NITI Aayog focuses on cooperative and competitive federalism, evidence-based policymaking, and providing strategic advice to both the Centre and States. It is an executive body, not a constitutional or statutory institution.
Planning Commission vs NITI Aayog
| Aspect | Planning Commission | NITI Aayog |
|---|---|---|
| Year Established | 1950 | 2015 |
| Legal Status | Extra-constitutional, executive | Executive body (not statutory/constitutional) |
| Head | Prime Minister (Chair) | Prime Minister (Chair) |
| Role | Formulate and allocate plans; fund allocation | Policy think tank; advisory role, no fund allocation |
| Approach | Top-down, centralised | Bottom-up, cooperative + competitive federalism |
| Focus | Resource allocation, production targets | Strategic advice, reforms, innovation, SDGs |
Mains Key Points
Prelims Strategy Tips
Major Achievements of NITI Aayog
Since its creation in 2015, NITI Aayog has moved away from the top-down, fund-allocating approach of the Planning Commission. Instead, it has focused on outcome-based monitoring, cooperative and competitive federalism, innovation promotion, and providing evidence-based advice. Its initiatives have covered education, health, water, agriculture, innovation, digital payments, and more, making it a central think tank for India’s developmental journey.
Since its creation in 2015, NITI Aayog has moved away from the top-down, fund-allocating approach of the Planning Commission. Instead, it has focused on outcome-based monitoring, cooperative and competitive federalism, innovation promotion, and providing evidence-based advice. Its initiatives have covered education, health, water, agriculture, innovation, digital payments, and more, making it a central think tank for India’s developmental journey.
NITI Aayog – Major Achievements
| Initiative | Description/Outcome |
|---|---|
| State Indices | Introduced Health, Education, Water, SDG, Innovation indices for state ranking |
| SATH-E | Education reforms in Jharkhand, Odisha, Madhya Pradesh |
| Aspirational Districts | 117 districts improved using multi-stakeholder local governance |
| CPSE Reforms | Strategic disinvestment of 30+ PSUs recommended |
| Global Partnerships | E-Amrit portal, SAMAVESH, Champions of Change |
| Vision Documents | 15-year Vision, 7-year Strategy, 3-year Action Agenda |
| Agriculture Reforms | Model Land Leasing Act, Model APMC Act, Reform Index |
| Digital Payments | Lucky Grahak Yojana & Digi Dhan Vyapar Yojana |
| Atal Innovation Mission | Tinkering Labs in schools, Incubation Centres for start-ups |
Mains Key Points
Prelims Strategy Tips
Criticisms of NITI Aayog and Role of Economic Advisory Council (EAC-PM)
While NITI Aayog was envisioned as a dynamic think-tank for policy innovation, it has often been criticized for acting more like a mouthpiece of the government rather than an independent advisory body. In contrast, the Economic Advisory Council to the Prime Minister (EAC-PM) functions as a more neutral body providing independent economic advice.
While NITI Aayog was envisioned as a dynamic think-tank for policy innovation, it has often been criticized for acting more like a mouthpiece of the government rather than an independent advisory body. In contrast, the Economic Advisory Council to the Prime Minister (EAC-PM) functions as a more neutral body providing independent economic advice.
NITI Aayog vs EAC-PM
| Aspect | NITI Aayog | EAC-PM |
|---|---|---|
| Nature | Executive body, advisory think tank | Independent, non-constitutional body |
| Established | 2015 (replacing Planning Commission) | 2017 (replacing PMEAC) |
| Role | Advises on policy, cooperative federalism, indices, reforms | Advises PM directly on economic issues |
| Criticism | Seen as mouthpiece of Govt, weak independence | Considered more neutral, issue-based |
| Power | No fund allocation or investment control | Advisory only, no implementation role |
Mains Key Points
Prelims Strategy Tips
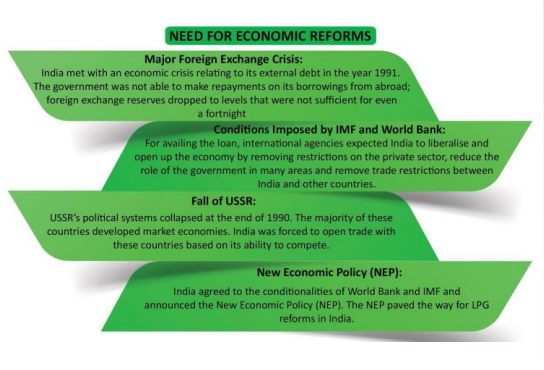
Economic Reforms in India (1991 and After)
The economic reforms of 1991 marked a turning point in India's economic history. Facing a severe balance of payments crisis, India shifted from a state-controlled, centrally planned economy to a more open, market-oriented system. These reforms were based on three pillars – Liberalisation, Privatisation, and Globalisation (LPG).
The economic reforms of 1991 marked a turning point in India's economic history. Facing a severe balance of payments crisis, India shifted from a state-controlled, centrally planned economy to a more open, market-oriented system. These reforms were based on three pillars – Liberalisation, Privatisation, and Globalisation (LPG).
Liberalisation Reforms: Before and After 1991
| Aspect | Before 1991 | After 1991 |
|---|---|---|
| Industrial Licensing | Required for almost all industries | Abolished except for select industries (e.g., alcohol, explosives, pharma) |
| Private Sector Role | Restricted in many industries | Allowed in most industries except atomic energy & railways |
| Small-Scale Industries | Many goods reserved for SSI | Gradual dereservation, larger firms allowed |
| Price Control | Government-fixed prices | Prices determined by market forces |
Mains Key Points
Prelims Strategy Tips
Economic Reforms in India – Key Sectoral Reforms (Post-1991)
After the 1991 crisis, India introduced wide-ranging reforms in multiple sectors such as industry, finance, taxation, foreign exchange, trade, and investment. The focus was to increase efficiency, reduce government control, promote private participation, and integrate India into the global economy.
After the 1991 crisis, India introduced wide-ranging reforms in multiple sectors such as industry, finance, taxation, foreign exchange, trade, and investment. The focus was to increase efficiency, reduce government control, promote private participation, and integrate India into the global economy.
Industrial Deregulation: Before and After 1991
| Aspect | Before 1991 | After 1991 |
|---|---|---|
| Industrial Licensing | Required for almost every industry | Abolished except for select industries |
| Private Sector Role | Not allowed in many industries | Allowed in most industries (railways, atomic energy reserved) |
| Small-Scale Industries | Many goods reserved for SSI | Most dereserved, larger firms allowed |
| Price Control | Government fixed prices | Market determined prices |
Mains Key Points
Prelims Strategy Tips
Privatisation and Globalisation in India
Privatisation refers to transferring ownership or management of government enterprises to private hands, often through disinvestment or strategic sale. Globalisation is the process of increasing interdependence and integration of economies, societies, and cultures across borders. Both processes became central features of India's economic reforms after 1991.
Privatisation refers to transferring ownership or management of government enterprises to private hands, often through disinvestment or strategic sale. Globalisation is the process of increasing interdependence and integration of economies, societies, and cultures across borders. Both processes became central features of India's economic reforms after 1991.
Privatisation vs Globalisation
| Aspect | Privatisation | Globalisation |
|---|---|---|
| Meaning | Transfer of ownership/management from govt to private sector | Integration of economies and societies beyond borders |
| Process | Disinvestment, strategic sale of PSUs | FDI, foreign technology, trade liberalisation |
| Objective | Improve efficiency, reduce govt role | Increase global interdependence, attract investment |
| Concerns | Equity, employment, profit focus | Cultural homogenisation, market dependence |
Mains Key Points
Prelims Strategy Tips
Second to Fourth Generation Economic Reforms in India
Economic reforms in India progressed in stages after 1991. Second-generation reforms (2000 onwards) focused on dismantling price controls, improving PSUs, and reforming government institutions. Third-generation reforms (2002–07) emphasized inclusive growth and strengthening Panchayati Raj institutions. Fourth-generation reforms (post-2014) highlighted digitisation and IT-enabled governance. These reforms collectively impacted GDP growth, employment, agriculture, industry, fiscal balances, and foreign trade.
Economic reforms in India progressed in stages after 1991. Second-generation reforms (2000 onwards) focused on dismantling price controls, improving PSUs, and reforming government institutions. Third-generation reforms (2002–07) emphasized inclusive growth and strengthening Panchayati Raj institutions. Fourth-generation reforms (post-2014) highlighted digitisation and IT-enabled governance. These reforms collectively impacted GDP growth, employment, agriculture, industry, fiscal balances, and foreign trade.
Generations of Economic Reforms in India
| Generation | Key Focus | Period |
|---|---|---|
| First Generation | Public sector, private sector, external sector, finance, tax reforms | 1991–2000 |
| Second Generation | Factor markets, PSU autonomy, governance reforms | 2000 onwards |
| Third Generation | Inclusive growth, Panchayati Raj empowerment | 2002–07 |
| Fourth Generation | Digital reforms, IT-enabled governance | 2014 onwards |
Mains Key Points
Prelims Strategy Tips
Chapter Complete!
Ready to move to the next chapter?