
Economics Playlist
18 chapters • 0 completed
Introduction to Economics
10 topics
National Income
17 topics
Inclusive growth
15 topics
Inflation
21 topics
Money
15 topics
Banking
38 topics
Monetary Policy
15 topics
Investment Models
9 topics
Food Processing Industries
9 topics
Taxation
28 topics
Budgeting and Fiscal Policy
24 topics
Financial Market
34 topics
External Sector
37 topics
Industries
21 topics
Land Reforms in India
16 topics
Poverty, Hunger and Inequality
24 topics
Planning in India
16 topics
Unemployment
17 topics
Chapter 2: National Income
Chapter TestNational Income
National Income is the total monetary value of all final goods and services produced by a country in one year. It reflects the overall economic activity, purchasing power, and standard of living, and is a key tool for economic planning and policy-making.
National Income is the total monetary value of all final goods and services produced by a country in one year. It reflects the overall economic activity, purchasing power, and standard of living, and is a key tool for economic planning and policy-making.
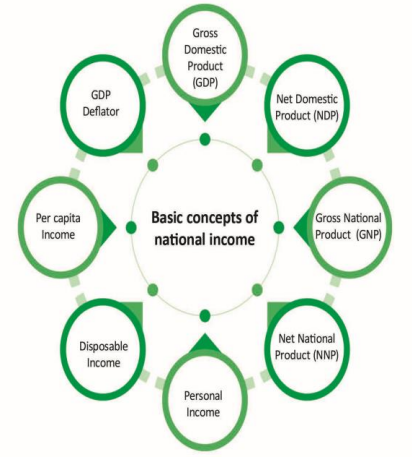
National Income – Key Concepts
| Concept | Explanation |
|---|---|
| National Income | Money value of all final goods and services produced by residents in one year. |
| GDP | Market value of final goods/services produced within country, regardless of nationality. |
| Factor Cost | Total cost of production (wages, rent, interest, profit, subsidies). |
| Market Price | Price consumers pay; FC + Indirect Taxes – Subsidies. |
Mains Key Points
Prelims Strategy Tips
Elements of GDP Calculation
GDP measures the total market value of all final goods and services produced within a country’s domestic territory in a given period. To calculate GDP correctly, one must include only final goods and services, define domestic territory, identify residents, and exclude transfer payments.
GDP measures the total market value of all final goods and services produced within a country’s domestic territory in a given period. To calculate GDP correctly, one must include only final goods and services, define domestic territory, identify residents, and exclude transfer payments.
Elements of GDP – Key Points
| Element | Explanation |
|---|---|
| Final Goods & Services | Only final goods are counted, intermediate goods excluded to avoid double counting. |
| Domestic Territory | Geographical area + embassies + military bases + ships/aircraft operated by residents. |
| Residents | Persons/institutions with economic interest in country for ≥ 1 year. |
| Transfer Payments | Excluded from GDP since no goods/services are produced. |
Mains Key Points
Prelims Strategy Tips
Types of GDP and Methods of Calculation
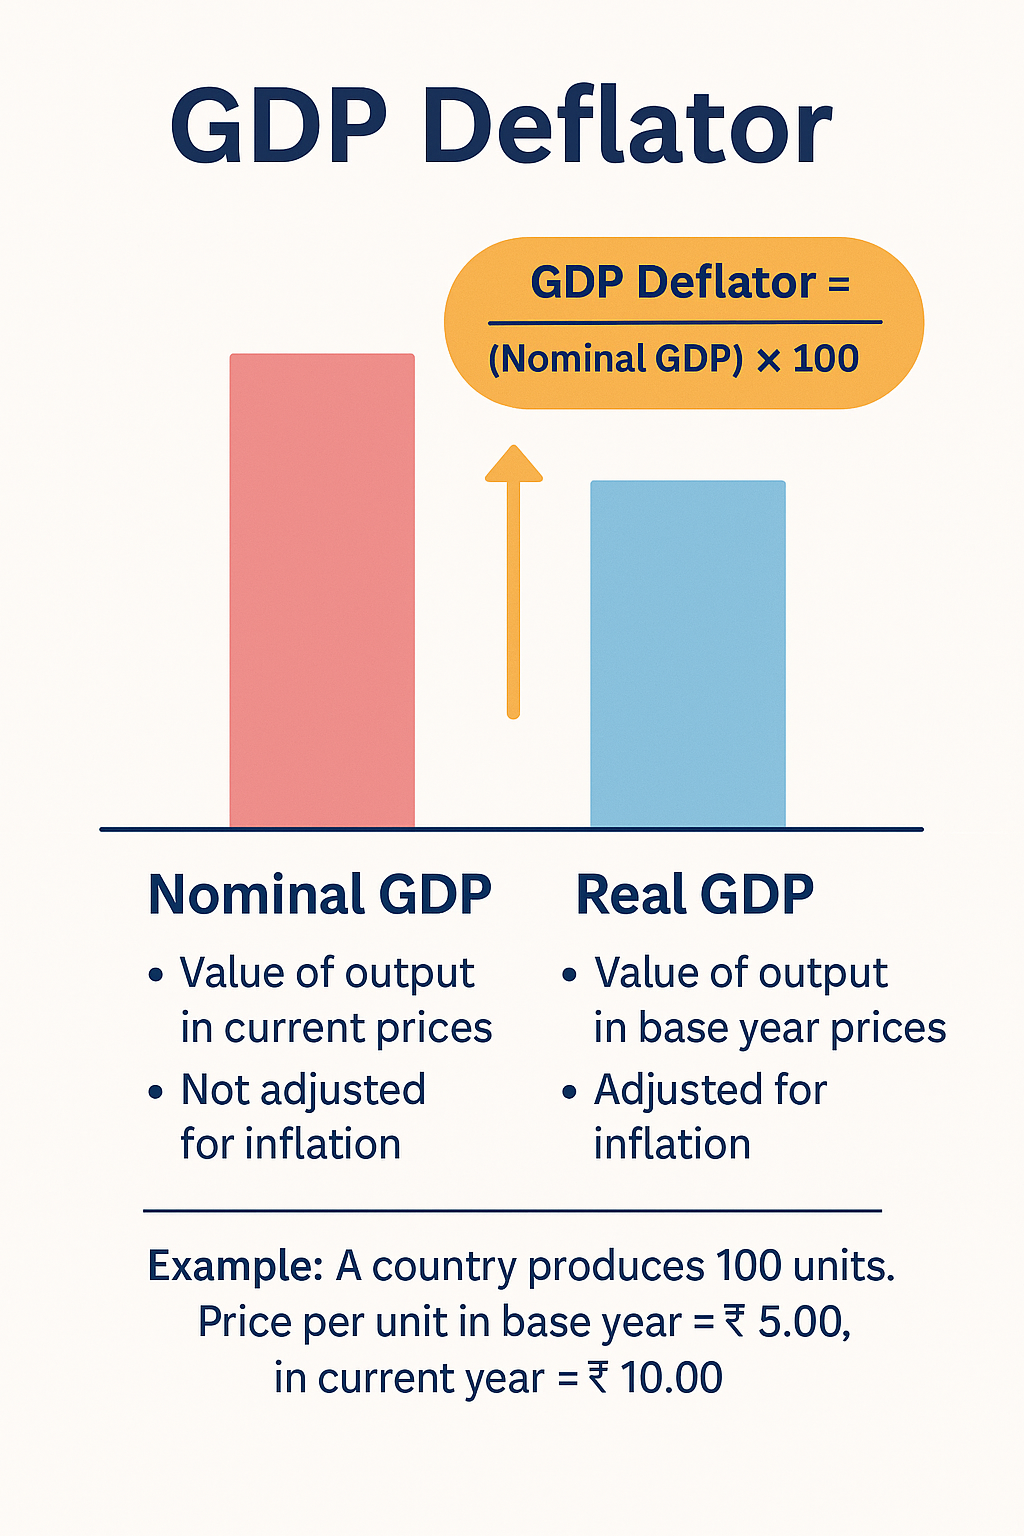
GDP (Gross Domestic Product) measures the monetary value of all final goods and services produced within a country’s domestic territory in a year. It can be measured at current prices (Nominal GDP) or constant prices (Real GDP). National income can be calculated using three approaches: production (value added), income, and expenditure methods.
GDP (Gross Domestic Product) measures the monetary value of all final goods and services produced within a country’s domestic territory in a year. It can be measured at current prices (Nominal GDP) or constant prices (Real GDP). National income can be calculated using three approaches: production (value added), income, and expenditure methods.
Types of GDP and Calculation Methods
| Type/Method | Explanation |
|---|---|
| Nominal GDP | GDP at current year prices, not adjusted for inflation. |
| Real GDP | GDP at base year prices, adjusted for inflation. |
| Production Method | GDP = Value Added (Output – Intermediate consumption). |
| Income Method | GDP = Wages + Rent + Interest + Profits. |
| Expenditure Method | GDP = Consumption + Investment + Govt. spending + Net Exports (C+I+G+(X–M)). |
Mains Key Points
Prelims Strategy Tips
GDP by Value Added and Income Method
In the Value Added Method, GDP is calculated by summing value added at each stage of production, but only final goods/services are included. In the Income Method, GDP is calculated as the sum of all factor incomes earned in production (wages, rent, interest, profits, and mixed income).
In the Value Added Method, GDP is calculated by summing value added at each stage of production, but only final goods/services are included. In the Income Method, GDP is calculated as the sum of all factor incomes earned in production (wages, rent, interest, profits, and mixed income).
Goods and Services in Value Added Method
| Goods/Services | Included in GDP? |
|---|---|
| Goods & services sold in market | Included |
| Services by agents | Included |
| Imputed rent/interest | Included |
| Second-hand goods | Not Included |
| Transfer payments (pension, scholarships) | Not Included |
Income Method – Factor Payments
| Factor of Production | Type of Income |
|---|---|
| Land | Rent |
| Labour | Wages and Salaries |
| Capital | Interest |
| Entrepreneurship | Profits (corporate tax, dividends, retained earnings) |
| Self-employed | Mixed income (farmers, doctors, traders) |
Mains Key Points
Prelims Strategy Tips
GDP by Expenditure Method
Expenditure Method calculates GDP by summing all expenditures made on final goods and services within the domestic territory in a given year. It assumes that at equilibrium, total spending (demand) = total production (supply). Formula: GDP at Market Price = C + I + G + (X – M).
Expenditure Method calculates GDP by summing all expenditures made on final goods and services within the domestic territory in a given year. It assumes that at equilibrium, total spending (demand) = total production (supply). Formula: GDP at Market Price = C + I + G + (X – M).
Expenditure Method – Key Components
| Component | Description | Included/Excluded |
|---|---|---|
| Consumption (C) | Household spending on final goods/services | New TV, food, transport (Included); Second-hand goods (Excluded) |
| Investment (I) | Spending on capital goods | Machinery, construction (Included); Bank savings/bonds (Excluded) |
| Government (G) | Spending by govt. on goods/services | Defence, admin costs (Included); Pensions, subsidies (Excluded) |
| Net Exports (NX) | Exports – Imports | Exports (Included); Imports (Excluded) |
Mains Key Points
Prelims Strategy Tips
Other Measures of National Income
Beyond GDP, national income is measured through Net Domestic Product (NDP), Depreciation, and Gross National Product (GNP). These measures refine GDP by accounting for wear and tear of assets and by distinguishing between production within borders vs by citizens worldwide.
Beyond GDP, national income is measured through Net Domestic Product (NDP), Depreciation, and Gross National Product (GNP). These measures refine GDP by accounting for wear and tear of assets and by distinguishing between production within borders vs by citizens worldwide.
GDP vs NDP vs GNP
| Measure | Definition | Formula |
|---|---|---|
| GDP | Value of goods/services produced within domestic territory. | GDP = C + I + G + (X – M) |
| NDP | GDP adjusted for depreciation (wear and tear). | NDP = GDP – Depreciation |
| GNP | Value of goods/services produced by citizens, irrespective of location. | GNP = GDP + NFIA |
Mains Key Points
Prelims Strategy Tips
Net National Product (NNP) & National Income
NNP is the total value of final goods and services produced by nationals of a country after deducting depreciation from GNP. When expressed at Factor Cost, NNP is also called National Income. It adjusts for indirect taxes and subsidies, giving a true measure of income available to citizens.
NNP is the total value of final goods and services produced by nationals of a country after deducting depreciation from GNP. When expressed at Factor Cost, NNP is also called National Income. It adjusts for indirect taxes and subsidies, giving a true measure of income available to citizens.
Comparison of GDP, GNP, NDP, and NNP
| Measure | Definition | Formula |
|---|---|---|
| GDP | Value of goods/services within domestic territory. | GDP = C + I + G + (X – M) |
| NDP | GDP adjusted for depreciation. | NDP = GDP – Depreciation |
| GNP | Goods/services by nationals worldwide. | GNP = GDP + NFIA |
| NNP | GNP adjusted for depreciation (National Income at FC). | NNP = GNP – Depreciation |
Mains Key Points
Prelims Strategy Tips
Personal Income and Related Concepts
Personal Income is the total income actually received by individuals from all sources before paying direct taxes. From this, Disposable Personal Income, National Disposable Income, and Per Capita Income are derived, which indicate how much income is available for consumption, savings, and average living standards.
Personal Income is the total income actually received by individuals from all sources before paying direct taxes. From this, Disposable Personal Income, National Disposable Income, and Per Capita Income are derived, which indicate how much income is available for consumption, savings, and average living standards.
Comparison of Personal Income Measures
| Measure | Definition | Formula | Key Point |
|---|---|---|---|
| Personal Income (PI) | Total income received before paying direct taxes. | PI = NI – (Undistributed Profits + Social Security Contributions) + Transfer Payments | Includes subsidies and transfers, excludes retained earnings. |
| Disposable Personal Income (DPI) | Income left after paying direct taxes. | DPI = PI – Direct Taxes | Actual money available for spending or saving. |
| National Disposable Income (NDI) | Total factor + non-factor income of residents. | NDI = Factor Incomes + Transfer Incomes | Represents maximum goods/services available for use. |
| Per Capita Income (PCI) | Average income per person. | PCI = National Income ÷ Population | Indicator of standard of living, but ignores inequality. |
Mains Key Points
Prelims Strategy Tips
Per Capita Income in India
Per capita income in India has grown enormously since independence, reflecting rising output and improving living standards. However, in absolute dollar terms it remains modest, and large inequalities persist across states and population groups.
Per capita income in India has grown enormously since independence, reflecting rising output and improving living standards. However, in absolute dollar terms it remains modest, and large inequalities persist across states and population groups.
India: Per Capita Income Over Time (Selected years)
| Year | Per Capita Income (₹, nominal) | Per Capita Income (US$, nominal) |
|---|---|---|
| 1950 | ₹ 265 | — |
| 2000-01 | ₹ 18,667 | — |
| 2020-21 | ₹ 1,28,829 | ≈ US$ 1,907 (for India’s GDP per capita in 2020) :contentReference[oaicite:8]{index=8} |
| 2024 | — | US$ 2,396.71 :contentReference[oaicite:9]{index=9} |
Mains Key Points
Prelims Strategy Tips
Other Concepts Related to GDP
Two key concepts linked with GDP are the GDP Deflator (a measure of inflation) and Base Year (used as a reference for calculating real growth). These help economists understand how much of GDP growth is due to higher production versus rising prices.
Two key concepts linked with GDP are the GDP Deflator (a measure of inflation) and Base Year (used as a reference for calculating real growth). These help economists understand how much of GDP growth is due to higher production versus rising prices.
Prelims Strategy Tips
Potential GDP and GDP Calculation in India
Potential GDP is the maximum sustainable level of output an economy can produce without creating inflationary pressures. In India, GDP is measured by the National Statistical Office (NSO) using GVA at basic prices (base year 2011–12), following international standards.
Potential GDP is the maximum sustainable level of output an economy can produce without creating inflationary pressures. In India, GDP is measured by the National Statistical Office (NSO) using GVA at basic prices (base year 2011–12), following international standards.
Key Changes in India’s National Accounts (2015)
| Component | Old Method | New Method |
|---|---|---|
| Base Year | 2004–05 | 2011–12 |
| Growth Measurement | GDP at Factor Cost | GDP at Market Price |
| Sectoral GVA | Factor Cost | Basic Price (includes production taxes, excludes subsidies) |
| Database | ASI + IIP | MCA21 corporate filings |
| Agricultural Income | Farm produce only | Farm + Livestock value addition |
Mains Key Points
Prelims Strategy Tips
Significance of New NAS Series & GDP–GVA Gap
The 2015 revision of India’s National Accounts Statistics (NAS) introduced major changes to align with international standards (SNA 2008). It improved coverage, data sources, and methodology, making GDP estimates more accurate and globally comparable. A key distinction is that GDP is at market prices, while GVA is at basic prices, leading to a GDP–GVA gap.
The 2015 revision of India’s National Accounts Statistics (NAS) introduced major changes to align with international standards (SNA 2008). It improved coverage, data sources, and methodology, making GDP estimates more accurate and globally comparable. A key distinction is that GDP is at market prices, while GVA is at basic prices, leading to a GDP–GVA gap.
GDP vs GVA
| Aspect | GDP (Market Prices) | GVA (Basic Prices) |
|---|---|---|
| Definition | Value of goods/services at market price (includes taxes, excludes subsidies) | Value added at basic price (excludes product taxes, includes subsidies) |
| Formula | GDP = GVA + Product Taxes – Product Subsidies | GVA = GDP – Product Taxes + Product Subsidies |
| Use | Measures economy’s size including govt. taxes/subsidies impact | Shows sector-wise value addition (production-side measure) |
| Gap Causes | Changes in taxes/subsidies | Not affected directly by taxes |
Mains Key Points
Prelims Strategy Tips
Utility of GDP and GVA under Different Circumstances
GDP shows the economy from the demand/consumer side, while GVA presents it from the supply/producer side. Together, they provide a complete picture of economic performance. Policymakers, investors, and analysts use both for better decision-making.
GDP shows the economy from the demand/consumer side, while GVA presents it from the supply/producer side. Together, they provide a complete picture of economic performance. Policymakers, investors, and analysts use both for better decision-making.
Comparison of GDP and GVA
| Aspect | Gross Domestic Product (GDP) | Gross Value Added (GVA) |
|---|---|---|
| Definition | Market value of all final goods/services produced within domestic territory. | Value of output – Value of intermediate goods (value added at basic prices). |
| Viewpoint | Consumer/Demand side (economic health, standard of living). | Producer/Supply side (sectoral production activity). |
| Formula | GDP = GVA + Taxes – Subsidies. | GVA = GDP – Taxes + Subsidies. |
| Measurement | By Output, Income, and Expenditure methods. | By Output/Production method (sector-wise GVA). |
| Sector Focus | Whole economy as a single entity. | Sector-wise/region-wise performance (agriculture, industry, services). |
| Usefulness | To gauge overall growth, demand, consumption trends. | To analyze supply, productivity, and identify lagging sectors. |
Mains Key Points
Prelims Strategy Tips
GDP and Welfare
GDP measures the value of goods and services produced, but welfare (well-being) depends on both economic and non-economic factors. Hence, GDP growth does not always mean higher welfare.
GDP measures the value of goods and services produced, but welfare (well-being) depends on both economic and non-economic factors. Hence, GDP growth does not always mean higher welfare.
GDP vs Welfare
| Aspect | GDP | Welfare |
|---|---|---|
| Definition | Value of goods & services produced in economy. | Sense of well-being (economic + non-economic). |
| Measurement | Monetary terms (market prices). | Monetary + non-monetary factors (income, health, environment). |
| Scope | Focus on production & income. | Focus on quality of life. |
| Limitation | Ignores inequality, externalities, harmful goods. | Broader measure including distribution & sustainability. |
Mains Key Points
Prelims Strategy Tips
GDP is not the Correct Measure of Growth
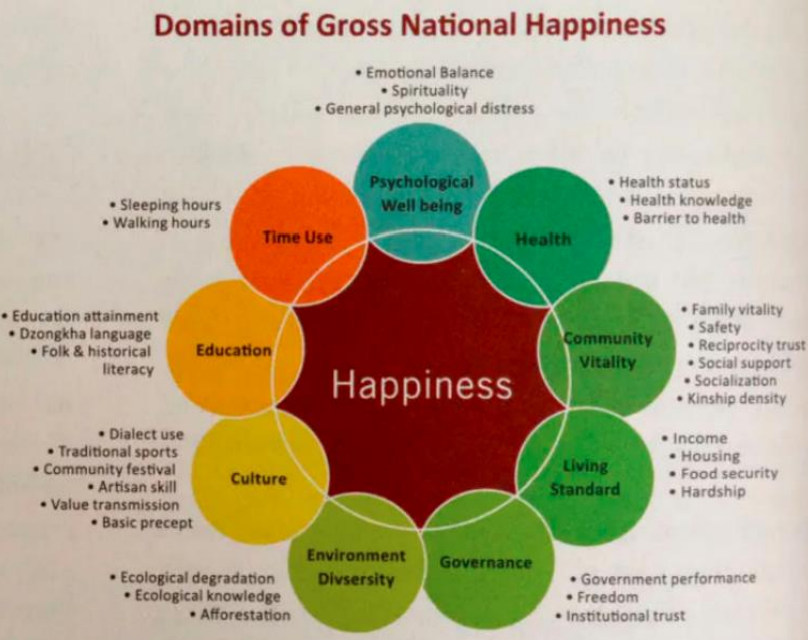
GDP measures economic production but ignores welfare, environment, unpaid work, and non-economic aspects of life. Hence, alternate measures like Green GDP and Gross National Happiness (GNH) have been proposed.
GDP measures economic production but ignores welfare, environment, unpaid work, and non-economic aspects of life. Hence, alternate measures like Green GDP and Gross National Happiness (GNH) have been proposed.
Comparison: GDP vs Green GDP vs GNH
| Measure | Definition | Focus | Limitation |
|---|---|---|---|
| GDP | Market value of all goods and services. | Production & income. | Ignores environment, unpaid work, social well-being. |
| Green GDP | GDP adjusted for environmental costs. | Sustainable growth + environment. | Data challenges, valuation of biodiversity difficult. |
| GNH | Index of happiness & well-being (Bhutan model). | Holistic well-being, non-economic factors. | Hard to measure happiness accurately. |
Mains Key Points
Prelims Strategy Tips
Human Development Index (HDI)
HDI is a composite index published by UNDP to measure a country's achievements in three dimensions – health, education, and standard of living. It ranks countries on a scale of 0 to 1, where higher values mean higher human development.
HDI is a composite index published by UNDP to measure a country's achievements in three dimensions – health, education, and standard of living. It ranks countries on a scale of 0 to 1, where higher values mean higher human development.
Dimensions of HDI
| Dimension | Indicator |
|---|---|
| Health | Life expectancy at birth |
| Education | Mean years of schooling + Expected years of schooling |
| Standard of Living | GNI per capita (PPP, USD) |
Mains Key Points
Prelims Strategy Tips
Thriving Places Index (TPI)
The Thriving Places Index (TPI), created by the Centre for Thriving Places, measures whether local conditions exist for people to live well. It focuses on fairness (equality), sustainability, and well-being, challenging the idea that progress is only about economic growth.
The Thriving Places Index (TPI), created by the Centre for Thriving Places, measures whether local conditions exist for people to live well. It focuses on fairness (equality), sustainability, and well-being, challenging the idea that progress is only about economic growth.
Thriving Places Index – Key Features
| Element | Focus |
|---|---|
| Local Conditions | Housing, health, education, safety, community connections |
| Equality | Fair distribution of opportunities and resources |
| Sustainability | Environment, carbon emissions, long-term balance |
Mains Key Points
Prelims Strategy Tips
Chapter Complete!
Ready to move to the next chapter?