
Geography Optional · UPSC Notes
Biogeography — UPSC Geography Optional Notes
Free, exam-focused notes for UPSC Prelims and Mains, with Prelims tips and Mains points for every topic. 5 topics.
Open in the interactive reader: bookmarks, progress tracking and read-aloud.
Soil Genesis, Profile, Classification and Distribution
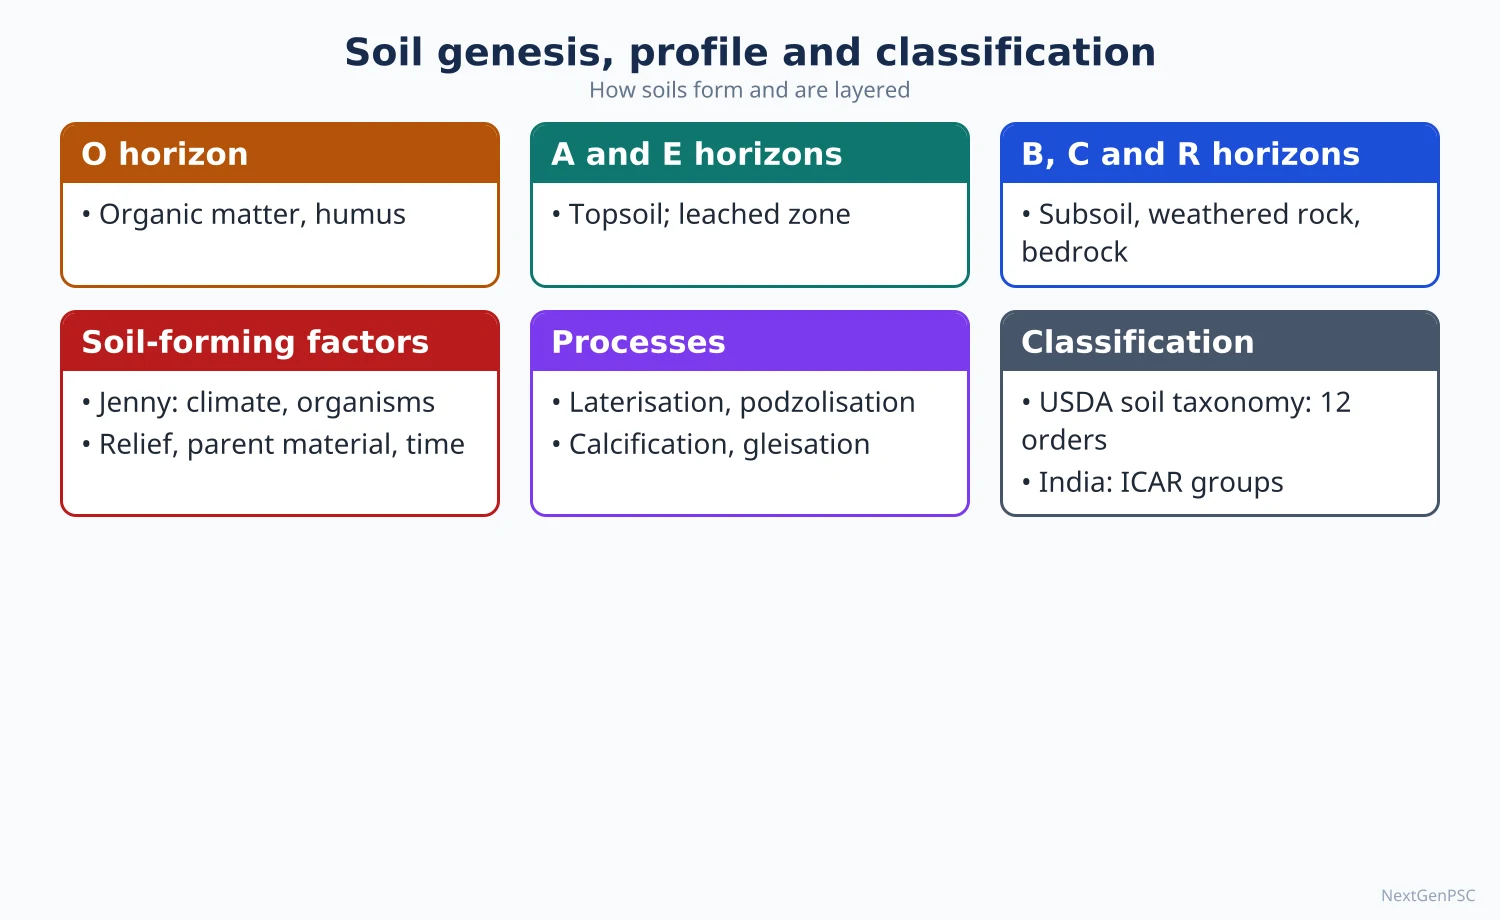
Soil is the thin, living layer of weathered mineral matter, organic matter, water and air that forms where the lithosphere meets the atmosphere and biosphere. Vasily Dokuchaev founded modern pedology by showing that soil is an independent natural body shaped by climate and vegetation, and Hans Jenny (1941) expressed soil as a function of climate, organisms, relief, parent material and time (CLORPT). Processes such as podzolisation, laterisation and calcification create distinct soil horizons, and soils are classified genetically (zonal, intrazonal, azonal) or by the USDA Soil Taxonomy of 12 orders.
In simple words
Soil is not just dirt; it is a slowly made mixture of broken rock, dead plants and animals, water and air.
Think of it like a cake baked very slowly: the rock is the flour, climate is the oven heat, plants and microbes are the yeast, and time is the baking period.
Soil decides what crops grow, how much water the land holds and where forests stand.
UPSC asks how soils form, why each layer looks different, and how soil types are spread across the world and India.
1. Concepts and definitions
Soil: the unconsolidated upper layer of the earth's crust, made of mineral particles, organic matter (humus), water, air and living organisms, capable of supporting plant growth.
Pedology: the science of soil formation, classification and mapping; the Russian scientist V.V. Dokuchaev is regarded as its founder through his study of the Russian chernozem (1883).
Dokuchaev's idea: soil is an independent natural body, not merely weathered rock, and its character depends mainly on climate and vegetation; this led to the idea of zonal soils.
Regolith: the loose weathered rock mantle above bedrock; soil is the upper, biologically active part of the regolith.
Soil texture: the proportion of sand (2–0.05 mm), silt (0.05–0.002 mm) and clay (finer than 0.002 mm) in the USDA scale; loam is a balanced mix.
Soil structure: the arrangement of particles into aggregates (granular, platy, blocky, prismatic, columnar).
Humus: dark, decomposed organic matter that holds nutrients and water and gives topsoil its dark colour.
Soil pH: acidity or alkalinity; podzols and laterites are acidic, desert and saline soils are alkaline.
2. Factors of soil formation
Jenny's equation (Factors of Soil Formation, 1941): S = f(cl, o, r, p, t), where soil depends on climate, organisms, relief, parent material and time.
Parent material: the rock or deposit from which soil develops; it controls texture and minerals in young soils (for example, black soils on Deccan basalt).
Climate: the most important active factor; temperature and rainfall control the rate of weathering, leaching and organic decay, so mature soils of the same climate look alike on different rocks.
Organisms: vegetation supplies organic matter; earthworms, termites and microbes mix and decompose it; grasslands give humus-rich soils, coniferous forests give acidic litter.
Relief: steep slopes have thin, eroded soils; valley floors gather thick, often waterlogged soils; aspect changes moisture and temperature.
Time: soils mature over hundreds to thousands of years; young soils (Entisols) show little horizon development, old soils (Oxisols) are deeply weathered.
Human factor: often added as a sixth factor today, through ploughing, irrigation, fertilisers and deforestation.
3. Pedogenic processes, step by step
Basic processes: additions (organic litter, dust), losses (leaching, erosion), translocations (movement of clay, iron or salts down or up the profile) and transformations (weathering, humification).
Podzolisation: in cool, humid climates under conifers, acidic humus water leaches iron and aluminium from the upper layer, leaving a bleached ash-grey E horizon and depositing them in the B horizon; example: podzols of the Russian taiga and Canada.
Laterisation: in hot, wet tropics with alternating wet and dry seasons, silica and bases are leached away, leaving iron and aluminium oxides; the soil turns red and can harden on exposure; examples: laterites of Kerala, the Western Ghats and Meghalaya.
Calcification: in semi-arid grasslands where evaporation exceeds rainfall, calcium carbonate accumulates in the lower horizon; examples: chernozems of Ukraine and the Prairies.
Salinisation and alkalisation: in dry areas or over-irrigated land, capillary rise brings salts to the surface (reh or kallar in Punjab, Haryana and Uttar Pradesh).
Gleisation: in waterlogged soils with little oxygen, iron is reduced, giving grey-blue mottled layers; common in tundra and marshes.
Humification and melanisation: organic matter decays into humus and darkens the topsoil, strongest under grasslands.
4. Soil profile and horizons
Soil profile: a vertical section from the surface to the parent rock showing distinct layers called horizons.
O horizon: surface layer of fresh and partly decomposed organic litter, thick in forests.
A horizon (topsoil): mineral layer mixed with humus, the zone of eluviation (washing out) and of most root activity.
E horizon: a light-coloured layer of strong eluviation, typical of podzols.
B horizon (subsoil): the zone of illuviation, where clay, iron, aluminium or carbonates washed from above accumulate.
C horizon: weathered parent material with little biological change.
R layer: unweathered bedrock.
Solum: the A and B horizons together, the true soil.
5. Classification of soils
Genetic (zonal) classification: developed by Dokuchaev and Sibirtsev in Russia and used in the USA by C.F. Marbut; zonal soils reflect climate and vegetation (podzol, chernozem, laterite), intrazonal soils reflect a strong local factor such as drainage or salts (peat, saline soils), and azonal soils are young with no developed profile (alluvium, mountain soils, sand dunes).
Pedalfer and pedocal (Marbut): pedalfers are humid-region soils rich in aluminium and iron with carbonates leached out; pedocals are drier-region soils with calcium carbonate accumulation.
USDA Soil Taxonomy: published in 1975 (second edition 1999) by the US Soil Conservation Service, based on measurable diagnostic horizons rather than assumed origin; it has 12 orders, the latest added being Andisols (1990) and Gelisols (1998).
The 12 orders: Alfisols, Andisols, Aridisols, Entisols, Gelisols, Histosols, Inceptisols, Mollisols, Oxisols, Spodosols, Ultisols and Vertisols.
FAO-UNESCO and WRB: the FAO-UNESCO Soil Map of the World (1970s) led to the World Reference Base for Soil Resources, used for international correlation.
Debate: genetic schemes are easy to relate to climate but assume an origin that may be wrong; the USDA scheme is objective but uses coined names that are hard to learn; most textbooks now teach both.
6. World distribution
Tropical humid belts: Oxisols and Ultisols (laterite and red-yellow soils) in the Amazon, Congo basin and South-East Asia; nutrients are held mostly in the vegetation, not the soil.
Mid-latitude grasslands: Mollisols (chernozem, prairie soils) of Ukraine, Russia, the North American Prairies and the Argentine Pampas, the world's grain belts.
Deserts: Aridisols of the Sahara, Arabia, Thar and central Australia, with salt or lime crusts.
Cool humid forests: Spodosols (podzols) of the taiga in Canada, Scandinavia and Siberia.
Tundra and permafrost: Gelisols of northern Canada, Alaska and Siberia.
Volcanic regions: Andisols of Japan, Indonesia and the Andes, fertile and porous.
Swelling clays: Vertisols of the Deccan, Sudan, eastern Australia and Texas, which crack deeply when dry.
7. Indian soils
ICAR classification: the Indian Council of Agricultural Research grouped Indian soils into eight major groups: alluvial, black, red and yellow, laterite, arid, saline and alkaline, peaty and marshy, and forest and mountain soils.
Alluvial soils: the most extensive group, covering the Indo-Gangetic-Brahmaputra plains and the deltas; khadar (newer, fertile flood-plain alluvium) and bhangar (older alluvium with kankar nodules).
Black soils (regur): formed on Deccan basalt in Maharashtra, Madhya Pradesh, Gujarat and parts of Karnataka and Telangana; rich in clay (montmorillonite), lime and iron, retain moisture, crack when dry; suited to cotton.
Red and yellow soils: on crystalline rocks of the peninsula (Tamil Nadu, Karnataka, Odisha, Chhattisgarh, Jharkhand); red from iron oxide, yellow when hydrated.
Laterite soils: in high-rainfall areas such as the Western Ghats, Kerala, Karnataka, Odisha hills and Meghalaya; good for plantation crops such as cashew, tea and coffee with manuring.
Arid soils: in western Rajasthan, sandy with low humus; saline soils in the Rann of Kutch, coastal deltas and over-irrigated canal areas; peaty soils in Kerala's kari soils and the Sundarbans.
Mapping agency: the National Bureau of Soil Survey and Land Use Planning (NBSS&LUP), Nagpur, maps Indian soils using the USDA system.
8. Maps and diagrams to draw
Soil profile: draw a tall rectangle divided into layers from top: O (dark, leaf symbols), A (dark grey, roots), E (pale), B (darker, dots for clay and iron), C (broken rock fragments), R (solid bedrock with cracks); add arrows down labelled eluviation and arrows ending in B labelled illuviation.
Jenny's factors: draw a central circle labelled Soil with five arrows pointing in from Climate, Organisms, Relief, Parent material and Time.
Podzol vs laterite profiles: draw two columns side by side; in the podzol show a bleached E horizon over an iron-rich B; in the laterite show a deep red profile with an iron crust and no clear E horizon.
Map of India's soils: shade alluvial soils along the northern plains and coastal deltas, black soils on the Deccan lava plateau, red soils across the eastern and southern peninsula, laterite strips along the Western Ghats and eastern hills, arid soils in western Rajasthan and mountain soils along the Himalaya.
9. Using it in the exam
10-mark answer (150 words): define soil, state Jenny's equation, explain one process (for example laterisation) with a small profile sketch and one Indian example.
15-mark answer (200 words): compare two processes or two classifications in a table, with a profile diagram and world and Indian examples.
20-mark answer (250 words): factors, processes, profile diagram, zonal-intrazonal-azonal and USDA classification, a world or India map, and a line on soil as a non-renewable resource on human time scales.
Keywords: CLORPT, eluviation and illuviation, diagnostic horizon, zonal soil, podzolisation, laterisation, calcification.
Attribution to quote: Hans Jenny (1941) treated soil as a function of climate, organisms, relief, parent material and time.
| Process | Climate and vegetation | What happens | Resulting soil and example |
|---|---|---|---|
| Podzolisation | Cool humid; coniferous forest | Iron and aluminium leached from upper layer to B horizon; bleached E horizon | Podzol (Spodosol); Canadian and Siberian taiga |
| Laterisation | Hot humid with dry season; tropical forest | Silica and bases leached; iron and aluminium oxides remain | Laterite (Oxisol); Kerala, Western Ghats, Meghalaya |
| Calcification | Semi-arid; grassland | Calcium carbonate collects in lower horizon; humus-rich top | Chernozem (Mollisol); Ukraine, Prairies |
| Salinisation | Arid or over-irrigated | Capillary rise brings salts to surface | Saline soils; Rann of Kutch, reh lands of Punjab and Uttar Pradesh |
| Gleisation | Waterlogged, cold or marshy | Iron reduced under low oxygen; grey-blue mottles | Gley soils; tundra, marshes |
| Basis | Genetic (zonal) scheme | USDA Soil Taxonomy |
|---|---|---|
| Originators | Dokuchaev, Sibirtsev; Marbut in the USA | US Soil Conservation Service (1975; 2nd edition 1999) |
| Criterion | Assumed origin linked to climate and vegetation | Measurable diagnostic horizons and properties |
| Main classes | Zonal, intrazonal, azonal | 12 orders, from Alfisols to Vertisols |
| Strength | Easy to relate to climate maps | Objective and quantitative |
| Weakness | Origin may be wrongly assumed | Coined names, complex criteria |
Mains points
- Questions often ask to explain the role of climate versus parent material in soil formation; answer that parent material dominates young soils and climate dominates mature, zonal soils.
- Always draw a labelled soil profile showing eluviation and illuviation; it is the single most expected diagram.
- Compare podzolisation, laterisation and calcification in a table with climate, process and examples.
- Know the 12 USDA orders and match at least five to Indian soils (Vertisols for black soil, Oxisols and Ultisols for laterite, Alfisols for red soils, Entisols and Inceptisols for alluvium, Aridisols for desert soils).
- A common mistake is calling laterite simply 'red soil'; laterite is a product of intense leaching with iron-aluminium enrichment.
- Link soil types to land use and agriculture (cotton on regur, plantation crops on laterite) for a geographical answer.
- Close with soil as a slowly renewable resource and the need for soil health management.
Did you know?
- Memory trick for Jenny's factors: 'CLORPT' — CLimate, ORganisms, Relief, Parent material, Time.
- Laterite gets its name from the Latin 'later', meaning brick, because the hardened soil was cut into building bricks in Kerala, as Francis Buchanan described in 1807.
Soil Erosion, Degradation and Conservation
Soil erosion is the removal of topsoil by water, wind and gravity faster than new soil forms, and soil degradation is the wider decline in soil quality through erosion, salinity, waterlogging, nutrient loss, compaction and pollution. Water erosion proceeds from sheet to rill to gully and ravine, as in the Chambal ravines, while wind erosion dominates the Thar. The Universal Soil Loss Equation of Wischmeier and Smith estimates erosion, and conservation combines agronomic, mechanical and watershed measures.
In simple words
Soil erosion is the washing or blowing away of the top layer of soil, the part that feeds plants.
It is like losing the cream from milk: what is left still looks like milk but has much less value, because topsoil takes centuries to form.
Erosion lowers crop yields, silts up dams and rivers, and can turn farmland into ravines or desert.
UPSC asks about its causes, the types of erosion, India's degraded areas, and conservation methods with examples.
1. Concepts and definitions
Geological (normal) erosion: the slow natural removal of soil, roughly balanced by soil formation under natural vegetation.
Accelerated erosion: erosion speeded up by human action (deforestation, overgrazing, ploughing slopes), exceeding the rate of soil formation.
Soil degradation: a decline in the soil's capacity to provide ecosystem goods and services; it includes physical (erosion, compaction, crusting), chemical (salinity, acidity, nutrient loss, pollution) and biological (loss of organic matter and soil life) degradation.
Land degradation: the broader decline of land productivity, including vegetation loss; under the UN Convention to Combat Desertification (UNCCD), desertification means land degradation in arid, semi-arid and dry sub-humid areas resulting from climatic variations and human activities.
Tolerable soil loss (T value): the maximum rate of erosion that still allows productivity to be sustained; often taken in textbooks as a few tonnes per hectare per year.
2. Types of erosion and how they work
Splash erosion: raindrops strike bare soil, detach particles and seal the surface, which increases runoff.
Sheet erosion: a thin, uniform layer of soil is removed by overland flow; it is hard to notice and therefore called the most dangerous first stage.
Rill erosion: runoff concentrates into small channels a few centimetres deep that ploughing can remove.
Gully erosion: rills deepen and widen into channels too deep to plough; headward erosion extends them into fields.
Ravine formation: a dense network of deep gullies in soft alluvium, as along the Chambal, Yamuna and Mahi; the Chambal ravines spread across Madhya Pradesh, Rajasthan and Uttar Pradesh.
Stream bank erosion: rivers cut their banks during floods, as on the Brahmaputra around Majuli island in Assam and the Ganga in Malda and Murshidabad (West Bengal).
Wind erosion: in dry areas, deflation lifts fine particles, saltation bounces sand grains and surface creep rolls coarse grains; common in western Rajasthan and parts of Gujarat and Haryana.
Mass movement: landslides and slumps strip soil on steep slopes, as in the Himalaya and the Western Ghats during heavy monsoon rain.
Choes: seasonal torrents of the deforested Shiwalik foothills, notably in Hoshiarpur district of Punjab, that bring sand onto fields.
3. Causes
Natural: intense monsoon rain, steep slopes, erodible soils (alluvium, loess, sandy soils), sparse vegetation and strong winds in dry seasons.
Deforestation: removes the canopy and roots that break rain impact and bind soil.
Overgrazing: strips grass cover and compacts soil, common in semi-arid Rajasthan and Gujarat.
Faulty farming: ploughing up and down slopes, shifting cultivation with shortened fallow cycles (jhum in the north-eastern hills), monocropping and leaving fields bare.
Over-irrigation and poor drainage: waterlogging and salinity in canal command areas, such as parts of the Indira Gandhi Canal area and the Sharda Sahayak command.
Mining, roads and construction: expose soil and destabilise slopes.
4. Measuring erosion
Universal Soil Loss Equation (USLE): developed by W.H. Wischmeier and D.D. Smith of the US Department of Agriculture (Agriculture Handbook 282, 1965; revised 1978) as A = R × K × LS × C × P.
Terms: A is average annual soil loss; R is rainfall erosivity; K is soil erodibility; LS is slope length and steepness; C is the cover and management factor; P is the support practice factor (contouring, terracing).
Use and limits: it guides planning, but it predicts sheet and rill erosion only, not gully or wind erosion, and was built on data from the United States; revised versions such as RUSLE try to address this.
Remote sensing: satellite data are used to map eroded and degraded land, as in ISRO's Desertification and Land Degradation Atlas.
5. Degradation in India and the world
India: the Desertification and Land Degradation Atlas of India (ISRO Space Applications Centre, 2021) reported about 97.85 million hectares, roughly 29.7% of the country's geographical area, undergoing land degradation in 2018–19.
Main processes in India: water erosion is the largest single process, followed by vegetation degradation and wind erosion.
States badly affected: Rajasthan, Maharashtra, Gujarat, Ladakh and Jharkhand are among the states with large degraded areas in that atlas; the exact ranking should be quoted only from the report.
India's target: India pledged to restore 26 million hectares of degraded land by 2030, announced at UNCCD COP14 held in New Delhi in 2019.
World: FAO's Status of the World's Soil Resources (2015) judged about a third of the world's soils to be moderately to highly degraded.
Historic lesson: the Dust Bowl of the 1930s on the US Great Plains followed ploughing of grassland and drought, and led to the Soil Conservation Service (1935) under Hugh Hammond Bennett.
6. Conservation methods
Agronomic (biological) measures: contour ploughing, strip cropping (erosion-resisting crops alternating with row crops), cover crops, mulching, crop rotation with legumes and conservation tillage.
Mechanical measures: contour bunding, graded bunds, bench terracing on hill slopes (as in Uttarakhand, Himachal and the north-eastern hills), check dams, gully plugging and stone walls.
Ravine reclamation: levelling, peripheral bunds, plugging gully heads and afforestation, as attempted in the Chambal ravines.
Wind erosion control: shelter belts and windbreaks, sand-dune stabilisation with grasses and shrubs, as practised by the Central Arid Zone Research Institute (CAZRI), Jodhpur.
Chemical correction: gypsum for alkaline (usar) soils, lime for acidic soils, and drainage for waterlogged land.
Watershed approach: treating a whole catchment from ridge to valley, combining soil, water and vegetation work with people's participation; examples are Ralegan Siddhi (Maharashtra) and Sukhomajri (Haryana).
Indian programmes: the Soil Health Card Scheme (launched 2015) for nutrient testing; the watershed development component of Pradhan Mantri Krishi Sinchayee Yojana (WDC-PMKSY); the Green India Mission; and the National Afforestation Programme.
7. Theory and debates
Population versus poverty: neo-Malthusian views blame population pressure, while political ecologists such as Piers Blaikie and Harold Brookfield (Land Degradation and Society, 1987) argue that poverty, land tenure and markets push farmers to degrade land.
Counter-example: Tiffen, Mortimore and Gichuki's study of Machakos, Kenya (More People, Less Erosion, 1994) showed that land improved as population grew, through terracing and investment; the general validity of this is debated.
Top-down versus participatory: early Indian soil conservation built bunds through government agencies; later watershed programmes stress community ownership, which evaluations generally find more lasting.
8. Maps and diagrams to draw
Stages of water erosion: draw a hill slope with four zones from top to bottom labelled splash, sheet, rill and gully, with arrows of increasing size for runoff.
Conservation on a slope: draw a hill in profile with bench terraces (steps), contour bunds as small ridges along the contours, and a check dam in the valley at the foot.
India map of degraded areas: shade the Chambal-Yamuna ravine belt, the Thar (wind erosion), the Shiwalik choes of Punjab, the jhum areas of the north-east, waterlogged and saline canal tracts of Punjab, Haryana and Uttar Pradesh, and eroded slopes of the Western Ghats.
USLE flow chart: six boxes R, K, LS, C, P multiplied to give A, with C and P marked as the factors humans can change.
9. Using it in the exam
10-mark answer: define soil erosion, list types (sheet, rill, gully, wind) with one Indian example each, and add a slope diagram.
15-mark answer: causes and consequences in a flow chart, conservation measures grouped as agronomic, mechanical and watershed, with Indian examples.
20-mark answer: concept of degradation, USLE, India's data with year and source (ISRO atlas 2021), map of problem areas, programmes and a sustainable land management conclusion linked to land degradation neutrality (SDG 15.3).
Keywords: accelerated erosion, ravines, USLE, watershed management, land degradation neutrality, conservation agriculture.
Attribution: the USLE is credited to Wischmeier and Smith; the political-ecology view of degradation to Blaikie and Brookfield.
| Type | Agent and process | Indian example | Main remedy |
|---|---|---|---|
| Sheet | Overland flow removes a thin uniform layer | Gently sloping red-soil uplands of the peninsula | Contour ploughing, cover crops |
| Rill and gully | Concentrated runoff cuts channels | Shiwalik foothills; Chota Nagpur plateau | Gully plugging, check dams |
| Ravine | Deep gully network in soft alluvium | Chambal, Yamuna and Mahi valleys | Levelling, bunding, afforestation |
| Wind | Deflation, saltation, creep | Western Rajasthan (Thar) | Shelter belts, dune stabilisation |
| Stream bank | Lateral cutting during floods | Majuli on the Brahmaputra; Ganga in Malda | Embankments, bank protection, vegetation |
| Mass movement | Landslides on steep wet slopes | Himalaya, Western Ghats | Slope stabilisation, drainage, afforestation |
Mains points
- Distinguish clearly between soil erosion (removal) and soil degradation (wider loss of quality); examiners reward precise terms.
- Quote India's degradation figure with year and source: about 97.85 million hectares (about 29.7%) in 2018–19, ISRO Desertification and Land Degradation Atlas (2021).
- Explain the USLE factors and point out that C and P are the ones human management can change.
- Group conservation methods as agronomic, mechanical and watershed-based, with a named Indian example for each.
- Use a political-ecology angle (Blaikie and Brookfield) in 20-mark answers to show that degradation is also a social problem.
- A common mistake is ignoring waterlogging and salinity in irrigated areas; these are major forms of degradation in Punjab, Haryana and Uttar Pradesh.
- Conclude with land degradation neutrality (SDG 15.3) and India's 26-million-hectare restoration target for 2030.
Did you know?
- Memory trick for the USLE: 'Really Keen Land Stewards Cover Properly' — R, K, LS, C, P give A, the soil loss.
World Distribution of Plants and Animals; Gene Pool Centres
Plants and animals are distributed according to climatic, edaphic, physiographic and biotic factors, shaped over geological time by continental drift, glaciation and barriers to dispersal. Ronald Good divided the world into six floristic kingdoms, and Sclater and Alfred Russel Wallace into six zoogeographical realms, separated in South-East Asia by Wallace's Line. Nikolai Vavilov identified the centres of origin of cultivated plants (gene pool centres), one of which is the Indian (Hindustan) centre.
In simple words
This topic asks why kangaroos live only in Australia, why tigers are found in Asia but not Africa, and where our crops first came from.
Living things are like people who settled in different towns long ago: climate decides who can live where, while seas, mountains and deserts act like walls that stop them moving.
Knowing where crops first grew helps scientists find wild relatives to breed hardier varieties.
UPSC asks about factors of distribution, world realms and Vavilov's gene centres.
1. Concepts and definitions
Biogeography: the study of the distribution of plants (phytogeography) and animals (zoogeography) over space and through time, and the processes behind it.
Ecological versus historical biogeography: ecological biogeography explains present distributions through climate, soil and interactions; historical biogeography explains them through evolution, continental drift, past climates and dispersal.
Range: the area within which a species occurs; ranges are limited by tolerance limits (Shelford's law of tolerance) and by barriers.
Endemism: a species found naturally in only one area; islands and isolated mountains have high endemism (Western Ghats amphibians, Madagascar's lemurs).
Cosmopolitan and disjunct distribution: cosmopolitan species occur worldwide; disjunct species occur in widely separated areas, often explained by drift or extinction in between (for example, lungfishes in South America, Africa and Australia).
Gene pool centre (centre of origin): a region where a crop was first domesticated and where its greatest genetic diversity and wild relatives are found.
2. Factors influencing distribution
Climatic factors: temperature sets latitudinal and altitudinal limits (tree line, frost line); precipitation and its seasonality separate forests, grasslands and deserts; light controls photoperiod and canopy layering; wind shapes trees and causes desiccation.
Edaphic factors: soil depth, texture, pH, salinity and nutrients; for example, mangroves need saline tidal mud and halophytes grow in the Rann of Kutch.
Physiographic factors: altitude, slope and aspect; the Himalaya shows vertical zonation from tropical forest in the foothills to alpine meadows and snow.
Biotic factors: competition, predation, pollination, seed dispersal by animals and the role of humans in clearing, introducing and domesticating species.
Historical factors: continental drift separated Gondwana flora and fauna (marsupials in Australia, ratite birds on southern continents); Pleistocene glaciations pushed species towards the equator and stranded relict populations on mountains.
Barriers and corridors: oceans, deserts and mountains act as barriers; land bridges such as the Isthmus of Panama allowed the Great American Biotic Interchange about 3 million years ago.
Dispersal routes: George Gaylord Simpson described corridors (easy exchange), filter bridges (selective exchange) and sweepstakes routes (chance crossings, as of animals rafting to islands).
3. World vegetation and biomes
Biome: a large regional community of plants and animals adapted to a similar climate, such as tropical rainforest, savanna, hot desert, Mediterranean, temperate grassland, temperate deciduous forest, taiga and tundra.
Latitudinal pattern: species richness generally falls from the equator towards the poles; this latitudinal diversity gradient has several proposed explanations (energy, area, time, stability), which remain debated.
Altitudinal pattern: climbing a mountain resembles travelling towards the poles; in the Himalaya, tropical moist forests give way to subtropical pine, temperate oak and deodar, subalpine birch and juniper, then alpine meadows.
4. Floristic kingdoms
Ronald Good (The Geography of the Flowering Plants, 1947): divided the world into six floristic kingdoms: Boreal or Holarctic, Palaeotropical, Neotropical, South African (Cape), Australian and Antarctic.
Holarctic: the largest kingdom, covering North America, Europe and northern Asia including the Himalaya.
Palaeotropical: tropical Africa, tropical Asia including most of India, and the Pacific islands.
Cape kingdom: the tiny but extremely rich fynbos region of South Africa, often cited as the smallest floristic kingdom.
5. Zoogeographical realms
Philip Sclater (1858): proposed six regions based on the distribution of birds.
Alfred Russel Wallace (The Geographical Distribution of Animals, 1876): extended Sclater's scheme to all vertebrates; the six realms are Palaearctic, Nearctic, Neotropical, Ethiopian (Afrotropical), Oriental (Indo-Malayan) and Australian.
Wallace's Line: a faunal boundary running between Bali and Lombok and between Borneo and Sulawesi; Asian mammals dominate to the west and Australian marsupials to the east, because the deep straits stayed water even when sea levels fell in the Ice Ages.
Wallacea: the transition zone of islands between Wallace's Line and Lydekker's Line, with Weber's Line marking the balance between Asian and Australian fauna.
Recent revision: Holt and colleagues (Science, 2013) used modern data on amphibians, birds and mammals to propose eleven realms; it is cited as an update rather than a replacement of Wallace.
India's position: most of India lies in the Oriental realm, while the Himalaya and Trans-Himalaya share Palaearctic elements; India also has Ethiopian (African) elements such as the Asiatic lion, which makes its fauna a meeting point of three realms.
6. Island biogeography
MacArthur and Wilson (The Theory of Island Biogeography, 1967): the number of species on an island is a balance between immigration and extinction; larger islands and those nearer the mainland hold more species.
Application: protected areas behave like islands in a sea of farmland, so the theory supports large reserves and wildlife corridors; the SLOSS debate (single large or several small reserves) is unresolved.
Indian example: the Andaman and Nicobar Islands show high endemism, and the Nicobars belong to the Sundaland biodiversity hotspot.
7. Vavilov's gene pool centres
Nikolai Vavilov: the Russian botanist who, after collecting crops worldwide, proposed (1926, refined in 1935) that cultivated plants originated in a few centres of maximum genetic diversity, usually in mountainous areas of the tropics and subtropics.
The eight main centres: (1) Chinese; (2) Indian, with (2a) Indo-Malayan; (3) Central Asiatic; (4) Near Eastern; (5) Mediterranean; (6) Abyssinian; (7) South Mexican and Central American; (8) South American (Peru, Ecuador, Bolivia), with Chiloe and Brazil-Paraguay sub-centres.
Crops of the Indian (Hindustan) centre: rice, pigeon pea, black gram and green gram, brinjal, cucumber, mango, citrus fruits, black pepper and old-world cotton; sugarcane is often listed, though its origin is debated with New Guinea.
Other examples: wheat, barley and lentil from the Near East; maize and beans from Mexico and Central America; potato from the Andes; coffee from Abyssinia; soybean from China.
Criticism: J.R. Harlan (1971) showed that domestication also happened over wide 'non-centres', and that the area of greatest diversity is not always the area of origin; modern genetics has refined many of Vavilov's claims.
Conservation importance: gene centres hold wild relatives with resistance to drought and disease; India's National Bureau of Plant Genetic Resources (NBPGR), New Delhi, runs the National Gene Bank, and the Svalbard Global Seed Vault in Norway (opened 2008) keeps backup seed samples.
8. Biogeographic zones of India
Rodgers and Panwar (1988), Wildlife Institute of India: divided India into ten biogeographic zones: Trans-Himalaya, Himalaya, Desert, Semi-arid, Western Ghats, Deccan Peninsula, Gangetic Plain, North-East, Coasts and Islands.
Hotspots: India includes parts of four of the world's 36 biodiversity hotspots: the Himalaya, Indo-Burma, the Western Ghats and Sri Lanka, and Sundaland (Nicobar Islands).
9. Maps and diagrams to draw
World map of zoogeographical realms: draw the continents roughly and divide them into six realms: Nearctic (North America above Mexico), Neotropical (Central and South America), Palaearctic (Europe, North Africa, northern Asia above the Himalaya), Ethiopian (Africa south of the Sahara), Oriental (South and South-East Asia), Australian; draw Wallace's Line as a dashed line between Bali and Lombok and between Borneo and Sulawesi.
Vavilov's centres: on a world outline place eight numbered circles over China, India, Central Asia, the Near East, the Mediterranean, Ethiopia, southern Mexico and the Andes, with two crops written beside each.
Himalayan vertical zonation: draw a mountain profile with bands labelled from base to top: tropical moist deciduous, subtropical pine, temperate broadleaf and conifer, subalpine, alpine meadow, snow.
Island biogeography graph: plot number of species on the x-axis, with a falling immigration curve and a rising extinction curve; mark their crossing as the equilibrium number of species.
10. Using it in the exam
10-mark answer: list factors in four groups with one example each, or summarise Vavilov's centres with Indian crops.
15-mark answer: explain realms with a world map and Wallace's Line, adding India's position at the meeting of realms.
20-mark answer: combine ecological and historical factors, realms, gene centres and their conservation value, with a map and Indian examples.
Keywords: endemism, disjunct distribution, barriers and corridors, Wallace's Line, centres of origin, wild relatives, gene bank.
Attribution: Vavilov held that a crop's centre of origin is where its greatest genetic diversity is found; this is his view, later qualified by Harlan.
| Realm | Area | Characteristic animals |
|---|---|---|
| Palaearctic | Europe, North Africa, Asia north of the Himalaya | Brown bear, wild sheep and goats, snow leopard in high Asia |
| Nearctic | North America north of tropical Mexico | Bison, pronghorn, beaver |
| Neotropical | Central and South America | Sloths, anteaters, New World monkeys, llama |
| Ethiopian (Afrotropical) | Africa south of the Sahara, southern Arabia, Madagascar | Giraffe, zebra, gorilla, lemurs in Madagascar |
| Oriental (Indo-Malayan) | South and South-East Asia west of Wallace's Line | Tiger, Asian elephant, orangutan, gibbons |
| Australian | Australia, New Guinea, islands east of Wallacea | Kangaroo, koala, platypus and echidna |
| Centre | Typical crops |
|---|---|
| Chinese | Soybean, millets, tea, peach |
| Indian (with Indo-Malayan) | Rice, pigeon pea, mango, brinjal, black pepper, banana and coconut in the Indo-Malayan part |
| Central Asiatic | Bread wheat varieties, pea, onion, apple |
| Near Eastern | Wheat, barley, lentil, chickpea, fig |
| Mediterranean | Olive, oats, cabbage |
| Abyssinian | Coffee, sorghum, teff |
| South Mexican and Central American | Maize, beans, cotton (upland), cocoa |
| South American (Andean) | Potato, tomato; groundnut and cassava in the Brazil-Paraguay sub-centre |
Mains points
- For 'factors influencing distribution', group them as climatic, edaphic, physiographic, biotic and historical, and give one world and one Indian example for each.
- Always add the historical dimension (continental drift, glaciation, land bridges); answers that use only climate look incomplete.
- Draw the zoogeographical realms map with Wallace's Line; it is the most expected diagram on this topic.
- For gene pool centres, name Vavilov's eight centres, list Indian-centre crops, and add Harlan's criticism for balance.
- Link gene centres to food security and climate adaptation through wild relatives, NBPGR and seed banks.
- A common mistake is placing all of India in one realm; mention Palaearctic elements in the Himalaya and African elements such as the Asiatic lion.
- Use India's ten biogeographic zones (Rodgers and Panwar, 1988) and four hotspots to make the answer India-specific.
Did you know?
- Bali and Lombok are separated by the narrow Lombok Strait and are almost within sight of each other, yet Wallace found their bird life sharply different; this observation became Wallace's Line.
- Vavilov, who spent his life collecting seeds to end famine, died in a Soviet prison in 1943, and his colleagues in besieged Leningrad guarded his seed collection even while starving.
Deforestation, Social Forestry, Agro-forestry and Wildlife
Deforestation is the permanent conversion of forest to other land uses, driven mainly by agricultural expansion, along with logging, mining, dams and settlements. Conservation combines protection, regeneration and people's participation: social forestry (recommended by the National Commission on Agriculture, 1976), Joint Forest Management (1990), agro-forestry (National Agroforestry Policy, 2014) and protected areas for wildlife under the Wildlife (Protection) Act, 1972. India's forest cover is 21.76% and forest plus tree cover 25.17% of its geographical area (ISFR 2023).
In simple words
Deforestation means cutting or clearing forests and not letting them grow back, usually to make farms, mines or towns.
A forest works like a giant sponge and air filter: it soaks up rain, holds soil, stores carbon and is home to wildlife.
When it is lost, floods, soil erosion, heat and species loss follow, so planting trees on farms and village land helps.
UPSC asks about causes, social forestry, agro-forestry and wildlife protection with Indian examples.
1. Concepts and definitions
Deforestation (FAO definition): the conversion of forest to other land use, whether human-induced or not; selective logging followed by regrowth is forest degradation, not deforestation.
Forest degradation: a decline in the forest's capacity to provide goods and services (thinning canopy, loss of species, fire damage) while it remains forest.
Forest cover (India): all land of more than one hectare with tree canopy density above 10%, irrespective of ownership and legal status, as measured by the Forest Survey of India from satellite data.
Tree cover: tree patches outside recorded forest smaller than one hectare, including trees on farms and in towns.
Social forestry: raising trees on public and community land and on farms, by and for local people, to meet fuel, fodder, small timber and environmental needs and to reduce pressure on natural forests.
Agro-forestry: the deliberate growing of trees with crops and/or livestock on the same land unit, in spatial mixture or time sequence, for ecological and economic benefit.
Wildlife: all undomesticated plants and animals in their natural habitat; in Indian law the term covers animals, aquatic and land vegetation forming part of a habitat.
2. World and Indian status
World: FAO's Global Forest Resources Assessment 2020 put world forest area at about 4.06 billion hectares, about 31% of land; deforestation was estimated at about 10 million hectares a year in 2015–2020, and net forest loss at about 4.7 million hectares a year in 2010–2020 after counting forest gain.
Hotspots of loss: the Amazon (cattle ranching and soybean), the Congo basin (shifting cultivation and fuelwood) and South-East Asia (oil palm and pulpwood in Indonesia and Malaysia).
India (ISFR 2023, Forest Survey of India): forest cover about 7.15 lakh km², 21.76% of geographical area; forest and tree cover together 25.17%.
Policy target: the National Forest Policy, 1988, aims at one-third of the country under forest or tree cover and two-thirds in the hills.
Regional pattern in India: forest cover is high in the north-eastern states and the Andaman and Nicobar Islands and low in Haryana, Punjab and Rajasthan; the north-east has also reported decline in recent assessments, linked to shifting cultivation and development.
3. Causes of deforestation
Agricultural expansion: the leading global driver; in India, historic clearing of the Gangetic plains and the Terai, and encroachment today.
Shifting cultivation: jhum in the north-eastern hills and podu in Odisha and Andhra Pradesh; sustainable with long fallows, damaging when the cycle shortens to a few years.
Mining and industry: coal, iron ore and bauxite lie under forests of Jharkhand, Chhattisgarh and Odisha, as in the debate over coal mining in the Hasdeo Arand forest of Chhattisgarh.
Dams, roads and urban growth: river-valley projects submerge forests (Sardar Sarovar on the Narmada), and highways fragment habitats.
Fuelwood, fodder and grazing: rural demand degrades forests near villages.
Forest fires: mostly human-caused in India, common in the dry deciduous forests of central India and the chir pine forests of Uttarakhand.
Historical policy: colonial forest policy (Indian Forest Act, 1878 and 1927) treated forests as a revenue and timber source, restricted community rights and cleared forests for railways and plantations.
4. Effects
Hydrological: more runoff and floods, less groundwater recharge, siltation of reservoirs.
Soil: accelerated erosion and landslides in the Himalaya and Western Ghats.
Climate: loss of carbon sinks; forests store large amounts of carbon, and their clearing adds to emissions; local climate becomes hotter and drier.
Biodiversity: habitat loss and fragmentation, the main cause of species extinction.
Human: loss of livelihood for forest-dependent tribal communities and rising human-wildlife conflict, such as elephant conflict in Odisha, Jharkhand and Chhattisgarh.
5. Social forestry and participatory management
Origin: the National Commission on Agriculture (1976) recommended social forestry to meet rural needs and relieve pressure on natural forests; programmes were launched in the late 1970s and 1980s, often with World Bank support in states such as Gujarat and Uttar Pradesh.
Components: farm forestry (trees on private farms), community forestry (village common land), extension forestry (strips along roads, canals and railways) and reforestation of degraded land.
Results and criticism: farm forestry spread fast, but much of it was eucalyptus grown for pulp and poles sold in towns rather than fuel and fodder for the poor, as critics such as Vandana Shiva argued; community woodlots often failed where villagers had no secure rights.
Joint Forest Management (JFM): the Government of India's circular of 1 June 1990 allowed forest departments and village committees to protect and share benefits from degraded forests; it grew out of the Arabari experiment in Midnapore, West Bengal, in the early 1970s.
People's movements: the Chipko movement (from 1973 in the Garhwal Himalaya, with Gaura Devi at Reni in 1974, Chandi Prasad Bhatt and Sunderlal Bahuguna) and the Appiko movement (1983, Uttara Kannada, Karnataka) showed local defence of forests.
Rights-based approach: the Scheduled Tribes and Other Traditional Forest Dwellers (Recognition of Forest Rights) Act, 2006, recognises individual and community forest rights, including the right to manage community forest resources.
6. Agro-forestry systems
Agri-silviculture: trees with crops, such as poplar with wheat in Punjab, Haryana and western Uttar Pradesh, and khejri (Prosopis cineraria) in crop fields of western Rajasthan.
Silvo-pastoral: trees with pasture and livestock, common in semi-arid areas and grazing lands.
Agri-silvo-pastoral: trees, crops and livestock together, as in the multi-storey home gardens of Kerala with coconut, areca, pepper, banana and cattle.
Taungya: a system in which farmers grow crops between young forest trees for the first few years; it was developed in Burma in the nineteenth century under Dietrich Brandis and used in Indian forest plantations.
Benefits: diversified farm income, fodder and fuel, soil fertility (nitrogen-fixing trees), windbreaks, carbon storage and reduced pressure on forests.
Policy: India adopted a National Agroforestry Policy in 2014, among the first countries to do so; the Sub-Mission on Agroforestry supports planting on farms.
7. Wildlife and its conservation
Threats: habitat loss, fragmentation, poaching and wildlife trade, invasive species (Lantana in Indian forests, Prosopis juliflora in Kutch), pollution and climate change.
In-situ conservation: protected areas (national parks, wildlife sanctuaries, conservation and community reserves) under the Wildlife (Protection) Act, 1972, biosphere reserves under UNESCO's Man and the Biosphere programme, and corridors linking habitats.
Ex-situ conservation: zoos, botanical gardens, gene banks and captive breeding, as for the gharial and the vultures at Pinjore (Haryana).
Flagship programmes: Project Tiger (1973, beginning with nine reserves including Corbett), Project Elephant (1992) and Project Cheetah (cheetahs released in Kuno National Park, Madhya Pradesh, in 2022).
Tiger status: the All India Tiger Estimation 2022 reported a minimum of 3,167 tigers, later estimated at about 3,682 on average, about three-quarters of the world's wild tigers.
Laws and treaties: Forest (Conservation) Act, 1980 (amended in 2023 and renamed the Van (Sanrakshan Evam Samvardhan) Adhiniyam), Biological Diversity Act, 2002, Compensatory Afforestation Fund Act, 2016; internationally CITES (1973) and the Convention on Biological Diversity (1992).
8. Theory and debates
Fortress conservation versus community conservation: exclusionary parks protect habitat but displace people; community-based models (Bishnoi protection of blackbuck and khejri in Rajasthan, sacred groves such as the kavu of Kerala and the law kyntang of Meghalaya) show the value of local stewardship.
Forest transition theory: Alexander Mather (1992) proposed that countries move from forest loss to forest recovery as they develop; India's stable or rising forest cover is sometimes cited as an example, though critics note that plantations and tree cover can mask the loss of natural forest.
Measurement debate: India's forest cover counts any canopy above 10% density, including plantations and orchards, so ecologists argue it overstates natural forest; this remains debated.
9. Maps and diagrams to draw
India forest cover map: shade very dense and moderately dense forest in the north-east, the Western Ghats, the Eastern Ghats, central India (Madhya Pradesh, Chhattisgarh, Jharkhand, Odisha), the Himalaya and the Andaman and Nicobar Islands; leave the north-west and the Indo-Gangetic plains light.
Deforestation flow chart: causes (agriculture, mining, dams, fuelwood) → forest loss → effects in three columns: environmental (erosion, floods, carbon), biological (habitat loss), social (tribal livelihoods, conflict).
Agro-forestry sketch: draw a field with rows of wheat between lines of poplar trees, label tree rows, crop alleys and a boundary windbreak; beside it draw a Kerala home garden with layers (coconut canopy, pepper vines, banana, ground crops).
Protected-area zonation: draw three concentric rings for a biosphere reserve: core (strict protection), buffer (research and limited use) and transition (settlements and sustainable use).
10. Using it in the exam
10-mark answer: define social forestry or agro-forestry, list its types with Indian examples and one limitation.
15-mark answer: causes and effects of deforestation with a flow chart and Indian data (ISFR 2023), and two conservation measures.
20-mark answer: global and Indian status with data and year, causes, effects, conservation approaches (protection, social forestry, JFM, agro-forestry, Forest Rights Act, wildlife programmes), a map, and a debate on community versus fortress conservation.
Keywords: forest transition, JFM, community forest rights, agro-forestry, carbon sink, habitat fragmentation, corridors.
Attribution: the National Forest Policy (1988) set the goal of one-third of India's area under forest or tree cover.
| Feature | Social forestry | Agro-forestry | Joint Forest Management |
|---|---|---|---|
| Land | Public, community and farm land outside forests | Private farm land | Degraded state forest land |
| Main aim | Fuel, fodder, small timber; relieve forest pressure | Integrated income from trees, crops and livestock | Regenerate forests with village participation and benefit sharing |
| Origin in India | National Commission on Agriculture (1976) | Traditional; National Agroforestry Policy (2014) | Arabari experiment (West Bengal); Government circular of 1990 |
| Example | Roadside and canal-bank plantations; village woodlots | Poplar with wheat in Punjab; khejri in Rajasthan; Kerala home gardens | Village forest protection committees in West Bengal and Odisha |
| Criticism | Eucalyptus monoculture served markets more than the poor | Market risk; limited extension support | Forest department dominance; weak rights for villagers |
Mains points
- Quote forest data with year and source: India's forest cover 21.76% and forest plus tree cover 25.17% of geographical area (ISFR 2023), against the 33% goal of the National Forest Policy, 1988.
- Separate deforestation (conversion) from degradation (decline in quality); examiners notice the distinction.
- For social forestry, give its components, its success in farm forestry and the criticism of eucalyptus monoculture.
- For agro-forestry, name the types (agri-silviculture, silvo-pastoral, agri-silvo-pastoral) with Indian examples and the 2014 policy.
- Bring in people's participation: Chipko, Appiko, JFM and the Forest Rights Act, 2006, and the debate on fortress versus community conservation.
- For wildlife, combine in-situ and ex-situ measures with flagship programmes and recent data such as the 2022 tiger estimation.
- A common mistake is presenting rising forest cover as proof of healthy forests; note that plantations and tree cover can hide natural forest loss.
Did you know?
- In 1730, Amrita Devi Bishnoi and over 300 Bishnois of Khejarli village near Jodhpur are said to have given their lives to stop the felling of khejri trees; India's Amrita Devi Bishnoi Wildlife Protection Award is named after her.
UPSC Previous Year Questions: Biogeography
From 2014 to 2026 UPSC asked 27 question parts worth 375 marks from Biogeography in Paper I. The most-asked topics are world distribution of plants and animals with gene pool centres (10 parts, 140 marks) and soil genesis, profile and classification (9 parts, 115 marks), followed by deforestation, social forestry and wildlife (5 parts, 75 marks) and soil erosion and conservation (3 parts, 45 marks). Every question below has a model answer written to the UPSC word limit, with the map or diagram to draw.
In simple words
Read the question and write your own answer in the time limit first: about 7 minutes for 10 marks, 11 for 15 marks and 14 for 20 marks.
Then compare it with the model answer: check the definition, the geographer named, the examples (Indian first, then world) and the diagram or map.
Note what you missed in a small notebook and revise those soil types, biomes and examples before the exam.
1. Soil Genesis, Profile, Classification and Distribution
Example 1 (UPSC 2026, 10 marks): How a 'Solum' as a concept different from 'Pedon'? Describe.
Paper and question: Paper I, Q1(d)
Approach: Define pedon and solum with their source, then contrast them by dimension, horizons included and use; draw a soil profile marking the solum within a pedon.
Soil is studied through units of different scale. The pedon is a three-dimensional unit of soil, while the solum is the genetically developed upper part of its profile.
Pedon: the smallest volume of soil, about 1 to 10 m² in surface area, that shows the full set of horizons and properties of a soil. The USDA Soil Taxonomy uses it as the basic unit of description and sampling, and contiguous similar pedons form a polypedon, the unit shown on soil maps.
Solum: the A, E and B horizons, where humification, eluviation and illuviation are active. It excludes the parent material (C) and bedrock (R), and its depth shows soil maturity: deep in old tropical laterites, thin in young hill soils of the Himalaya.
Diagram: A block of soil (pedon) with its front face showing O, A, E, B, C and R horizons; a bracket marks A to B as the solum and the whole block as the pedon, with neighbouring blocks labelled polypedon.
They differ in dimension (solum is a vertical section, pedon a volume), content (a pedon may include the C horizon) and purpose (pedon for classification and mapping, solum for judging soil development and the root zone).
Example 2 (UPSC 2023, 10 marks): Explain the natural processes of soil enrichment and its impact on food production.
Paper and question: Paper I, Q1(c)
Approach: Explain the geological and biological processes that naturally enrich soil, then their effect on food production with examples; draw a nutrient-cycle flow diagram.
Soil enrichment is the natural gain of nutrients, organic matter and good structure in soil through geological and biological processes.
Geological processes: weathering of parent rock releases potassium, calcium and phosphorus; floods spread fresh silt over floodplains and deltas, as in the Ganga plain and the Nile delta; volcanic ash renews soils in Java, and Deccan basalt has weathered into fertile black soil.
Biological processes: microbes turn litter into humus; Rhizobium in legume roots and blue-green algae in paddy fields fix atmospheric nitrogen; mycorrhizal fungi help roots take up phosphorus; earthworms and termites mix and aerate the soil.
Diagram: Flow chart: parent rock and atmosphere → weathering and nitrogen fixation → soil nutrient pool → crops → litter and residues → humus → back to the pool, with an extra arrow for flood silt.
Impact on food: such soils give high yields with fewer inputs, so the alluvial plains from Punjab to West Bengal, the Nile delta and volcanic Java support very dense farming populations. Legume rotations and algae in paddy lower fertiliser needs.
But enrichment is slow while erosion is fast, so crop rotation, green manuring and mulching that copy nature are vital for food security.
Example 3 (UPSC 2023, 15 marks): Differentiate between the characteristics of organic horizons and mineral horizons in a generalised soil profile.
Paper and question: Paper I, Q4(b)
Approach: Define the generalised profile, then contrast organic (O) and mineral (A, E, B, C) horizons point by point on origin, composition, colour and processes, with examples; draw a labelled soil profile.
A soil profile is a vertical section from the surface to the parent rock showing layers called horizons. In a generalised profile an organic layer (O) lies over the mineral horizons A, E, B and C and bedrock R.
Organic horizons: built from the top downward by the fall of leaves, twigs and dead organisms. They are dominated by organic matter, are dark brown to black, light, porous and hold much water. By stage of decay they are Oi (fresh litter), Oe (partly decomposed) and Oa (humus).
Organic horizons are thick under coniferous forest, where acid mor humus builds up as in the podzols of Siberia and Canada, and in waterlogged peat soils (Histosols) such as the kari lands of Kuttanad in Kerala.
Mineral horizons: formed mainly from weathered rock and dominated by sand, silt and clay. The A horizon mixes humus with minerals and loses material downward; E is a pale eluvial zone stripped of clay, iron and aluminium; B is the illuvial zone of accumulation of clay, sesquioxides or carbonates; C is weathered parent material.
Diagram: A labelled profile: O (Oi, Oe, Oa) at top; A dark mineral layer; E bleached grey layer; B layer with arrows showing clay and iron moving in; C broken rock; R bedrock.
They thus differ in origin (litter above vs rock weathering below), composition (organic vs mineral), dominant processes (decomposition and humification vs leaching and accumulation) and role in fertility.
Both work as one system: humus from the O horizon feeds the A horizon, and their balance reflects climate and vegetation.
Example 4 (UPSC 2022, 10 marks): Well developed soils typically exhibit distinct layers in their soil profile. Elaborate.
Paper and question: Paper I, Q1(e)
Approach: Explain why mature soils develop distinct horizons through soil-forming factors and processes over time, contrast with immature soils, and draw mature versus young profiles.
A well-developed or mature soil is one in which soil-forming processes have acted long enough to divide the profile into distinct horizons that differ in colour, texture, structure and chemistry.
Hans Jenny (1941) showed that soil is a function of climate, organisms, relief, parent material and time. Given stable relief and enough time, climate and organisms transform the parent rock layer by layer.
Roy Simonson (1959) explained horizon formation by four processes: additions (litter, dust), losses (leaching of bases), translocations (clay, iron and humus moving from A and E into B) and transformations (weathering, humification). Their uneven action with depth creates the layers.
Diagram: Two profiles side by side: a mature podzol with O, A, E, Bs and C horizons, and a young alluvial soil showing only a thin A over stratified C.
Examples: podzols of the taiga show a bleached E over a rusty B; chernozems have a thick black A over a calcium carbonate layer; laterites show an iron-rich hardpan. In contrast, the khadar alluvium of the Ganga plain and the regosols of the Thar dunes are young and lack clear horizons.
Distinct layering is thus a sign of soil maturity and a guide to fertility.
Example 5 (UPSC 2020, 15 marks): Land use/Land cover and soil types influence forage quantity and quality in semi-arid regions of the world. Discuss with relevant examples.
Paper and question: Paper I, Q4(b)
Approach: Explain how land use/land cover and soil type each control the quantity and quality of forage in semi-arid lands, with Indian and world examples, and end with management; draw a world map of semi-arid rangelands.
Semi-arid regions, with roughly 250 to 600 mm of erratic rain, support most of the world’s livestock on natural rangelands. Forage quantity (biomass per hectare) and forage quality (protein content and digestibility) depend on rainfall, but also on how land is used and on the soil beneath.
Land use and land cover: conversion of grassland to cropland shrinks grazing area, as in the Sahel and western Rajasthan, though crop residues such as bajra stover add dry-season feed. Overgrazing replaces palatable perennial grasses with unpalatable annuals and shrubs. Invasive Prosopis juliflora has cut forage in the Banni grasslands of Kachchh, and shrinking village commons (oran, gauchar) concentrate grazing.
Tree cover can help: the khejri (Prosopis cineraria) of Rajasthan gives protein-rich leaf fodder in the dry season.
Soil types: sandy soils of the Thar hold little water, so grasses like sewan (Lasiurus sindicus) grow fast after rain but give modest biomass; deep clayey black soils of the Deccan and the mollisols of the Great Plains hold moisture and yield more. Saline soils of the Rann fringe favour coarse halophytes of low palatability. Soils poor in nitrogen and phosphorus give low-protein grass, while legumes on fertile soils raise quality.
Map: World map shading semi-arid rangelands: Sahel, Kalahari, Thar and Deccan rain-shadow, Great Plains, Patagonia, Central Asian steppe and inland Australia.
Management therefore needs rotational grazing, reseeding with grasses like Cenchrus (anjan), protection of commons and removal of invasives, as promoted by CAZRI (Jodhpur) and IGFRI (Jhansi).
Example 6 (UPSC 2019, 15 marks): How are soil acidity and alkalinity related to soil fertility?
Paper and question: Paper I, Q3(b)
Approach: Explain soil pH and the nutrient-availability optimum, then how acidity and alkalinity each reduce fertility, with Indian regions and remedies; draw Truog’s pH–nutrient availability chart.
Soil reaction (pH) measures the acidity or alkalinity of soil on a scale of 0 to 14. It controls fertility because it decides which nutrients are soluble and how active soil microbes are; most nutrients are best available between about pH 6 and 7.5.
Acidic soils (below about pH 5.5) form where heavy rain leaches calcium, magnesium and potassium, as in the laterites of the Western Ghats and Kerala and the hill soils of north-east India. Aluminium and manganese reach toxic levels, phosphorus is locked by iron and aluminium, and nitrogen-fixing bacteria slow down. Liming corrects them, though tea in Assam and Darjeeling thrives in acid soil.
Alkaline and sodic soils (above about pH 8.5) form in dry areas and under poorly drained canal irrigation, where evaporation leaves salts and sodium. These usar, reh or kallar lands of Uttar Pradesh, Haryana and Punjab show poor structure, crusting, low water entry and shortage of iron, zinc and phosphorus. Gypsum and good drainage reclaim them; ICAR-CSSRI (Karnal) estimates about 6.7 million ha of salt-affected soils in India.
Diagram: Truog’s chart (1946): pH 4 to 10 on the horizontal axis with bands for N, P, K, Ca, Mg, S, Fe, Mn, Zn and B whose width shows availability; most bands are widest between pH 6 and 7.5.
Fertility therefore peaks near neutral pH, and testing it through the Soil Health Card scheme (2015) guides correct amendments.
Example 7 (UPSC 2018, 10 marks): Distinguish between intrazonal and azonal soils. Describe in brief the characteristics and importance of azonal soils.
Paper and question: Paper I, Q1(d)
Approach: Distinguish intrazonal and azonal soils in the zonal–intrazonal–azonal scheme, then describe the characteristics and importance of azonal soils with examples; draw a sketch contrasting the profiles.
The zonal, intrazonal and azonal grouping grew from the Russian school of Dokuchaev and was adopted in the USDA classification of 1938. Zonal soils reflect climate and vegetation; the other two do not.
Intrazonal soils have well-developed horizons, but local factors such as poor drainage, salts or limestone override climate: saline solonchak, hydromorphic bog and gley soils, and calcimorphic rendzina. Azonal soils are too young or unstable to develop horizons at all.
Characteristics of azonal soils: an A horizon resting directly on parent material, or no horizons; properties inherited from the parent material; varied fertility. Types are alluvial soils on floodplains, regosols on dunes and volcanic ash, and lithosols on steep rocky slopes.
Diagram: Two profiles: intrazonal gley soil with A, mottled grey Bg and C; azonal alluvium with thin A over layered C.
Importance: alluvial soils feed the Ganga–Brahmaputra plain, the Nile, Huang He and Mekong deltas, renewed yearly in the khadar; volcanic regosols make Java highly productive; lithosols support forests and grazing on the Himalayan slopes.
Example 8 (UPSC 2017, 15 marks): Distinguish between the characteristics of Chernozem and Sierozem soils.
Paper and question: Paper I, Q3(b)
Approach: Introduce both as pedocals of the dry mid-latitudes, then contrast climate, vegetation, profile, chemistry, distribution and use point by point; draw the two profiles side by side.
Chernozem and Sierozem are both zonal pedocals formed by calcification, where evaporation exceeds rainfall and calcium carbonate collects in the profile. They differ because one forms under grass in a sub-humid steppe and the other under sparse shrubs in a semi-desert.
Chernozem (Russian for black earth): found in the steppes of Ukraine, southern Russia and northern Kazakhstan and the prairies of the USA and Canada. Dense grass roots give a thick, black, humus-rich A horizon with crumb structure, a calcium carbonate layer lower down, near-neutral pH and high base saturation. These are among the world’s most fertile soils and carry the great wheat belts.
Sierozem (grey earth): found in the semi-deserts of Central Asia (Uzbekistan, Turkmenistan), Iran and the Great Basin of the USA. Scanty shrubs give little humus, so the soil is thin, light grey and loose; carbonate and sometimes gypsum lie close to the surface, pH is alkaline and salts build up. Farming needs irrigation, as with cotton on the Amu Darya and Syr Darya, which helped shrink the Aral Sea.
Diagram: Two profiles: Chernozem with a black A of about 1 m over a white carbonate band; Sierozem with a thin grey A over a shallow carbonate layer and a salt crust.
In short, Chernozem shows grassland abundance and Sierozem desert scarcity.
Example 9 (UPSC 2015, 15 marks): Classify soils based on their zonal distribution and describe the characteristics of pedocals.
Paper and question: Paper I, Q3(c)
Approach: Give the zonal–intrazonal–azonal classification and the pedalfer–pedocal division of zonal soils, then describe pedocals (process, profile, types, distribution); draw a humid-to-arid transect.
The 1938 USDA classification, based on the Russian school, grouped soils by distribution: zonal soils shaped by climate and vegetation over wide belts, intrazonal soils shaped by local drainage or parent rock, and azonal soils too young to have horizons.
C.F. Marbut divided zonal soils into two groups. Pedalfers (Al and Fe) form in humid climates where leaching removes bases and leaves aluminium and iron: tundra soils, podzols, grey-brown podzolic soils, red-yellow soils and laterites. Pedocals (Ca) form in dry climates where calcium accumulates. In the USA the boundary runs roughly along the 98th to 100th meridian.
Characteristics of pedocals: evaporation exceeds rainfall, so water moves only part way down and calcium carbonate is deposited as a white layer or nodules, called kankar in India. They are alkaline, rich in bases and not leached. Humus falls as aridity rises, giving the sequence Chernozem, Chestnut, Brown, Sierozem and red desert soils.
Diagram: A transect from humid east to dry west of the USA showing podzolic soils, then Chernozem, Chestnut, Brown and desert soils, with the carbonate layer rising closer to the surface westward.
Pedocals are naturally fertile and form the grain belts of the prairies, Ukraine and Kazakhstan, but need irrigation and protection from salinity and wind erosion, as in arid Rajasthan.
2. Soil Erosion, Degradation and Conservation
Example 10 (UPSC 2024, 15 marks): "Soil erosion is creeping death." Explaining the statement, suggest various soil conservation measures.
Paper and question: Paper I, Q3(b)
Approach: Explain why erosion is a slow, unseen but fatal loss of topsoil with Indian and world examples, then suggest biological, mechanical and policy measures; draw contour bunds and terraces on a slope.
Soil erosion is the removal of topsoil by water and wind faster than it forms. It is called creeping death because sheet erosion strips a thin film every season almost unnoticed, yet a few centimetres of fertile topsoil take centuries to form.
The damage builds up slowly: humus and nutrients are lost first, then water-holding capacity, until rills and gullies make land useless. In India an often-cited estimate puts soil loss at about 5.3 billion tonnes a year (Narayana and Ram Babu, 1983). The Chambal ravines, the choes of the Shivaliks in Hoshiarpur and shortened jhum cycles in the north-east show the result; the Dust Bowl of the USA in the 1930s and the Loess Plateau of China are world examples.
Biological measures: contour ploughing, strip cropping, cover crops, mulching, crop rotation with legumes, agroforestry, grassed waterways and shelterbelts in dry areas such as western Rajasthan.
Mechanical measures: contour and graded bunds, bench terraces on hill slopes, check dams, gully plugging and ravine reclamation, as in the Chambal and Yamuna ravine lands.
Diagram: A hill slope showing bench terraces above, contour bunds in the middle, a check dam in the gully and a shelterbelt at the foot, with arrows of slowed runoff.
Policy measures: watershed development (Sukhomajri in Haryana and Ralegan Siddhi in Maharashtra are models), the Watershed Development Component of PMKSY and the Soil Health Card scheme.
Since soil is practically non-renewable on a human time scale, conservation is cheaper than cure.
Example 11 (UPSC 2021, 15 marks): Soil erosion and soil degradation are threat to food supply. Discuss.
Paper and question: Paper I, Q2(c)
Approach: Define erosion and degradation, explain the routes by which each cuts food supply with Indian and world evidence, and end with remedies; draw a cause–effect flow chart.
Soil erosion is the physical removal of topsoil by water and wind; soil degradation is the wider decline in soil quality through erosion, salinisation, waterlogging, acidification, compaction and nutrient loss. Since about 95% of food comes directly or indirectly from soil (an FAO estimate), both threaten food supply.
Scale: the ISRO Desertification and Land Degradation Atlas (2021) found about 97.8 million ha, nearly 30% of India’s area, degraded in 2018–19, with water erosion the leading process. The FAO Status of the World’s Soil Resources (2015) judged about a third of global soils moderately to highly degraded.
How food supply suffers: loss of fertile topsoil lowers yields and raises fertiliser needs; salinity and waterlogging in canal commands of Punjab, Haryana and the Indira Gandhi Canal area reduce cropping; overuse of urea and declining organic carbon have flattened yield growth in the Green Revolution belt; silt fills reservoirs and tanks, cutting irrigation.
Abroad, degradation in the Sahel worsened the famines of the 1970s and 1980s, and Haiti’s eroded hills cannot feed their people.
Diagram: Flow chart: deforestation, overgrazing, faulty irrigation and overuse of chemicals → erosion and degradation → lower yields, higher costs, silted reservoirs → food insecurity.
Remedies include watershed management, balanced fertiliser use guided by Soil Health Cards, organic and natural farming, and land restoration under India’s Bonn Challenge pledge of 26 million ha by 2030. Healthy soil is the first line of food security.
Example 12 (UPSC 2020, 15 marks): "Land degradation is a threat to productivity and sustainable resource management." Explain with suitable examples from India.
Paper and question: Paper I, Q6(b)
Approach: Define land degradation, show with Indian examples how each process lowers productivity and undermines sustainable resource use, and end with India’s responses; draw a map of India marking degradation hotspots.
UNCCD defines land degradation as the reduction or loss of the biological or economic productivity of land through human activity and climate. It undermines productivity and the sustainable management of soil, water and forests together.
Water erosion, the leading process in the ISRO atlas (2021), strips topsoil in the Chambal ravines, the Shivalik foothills and the Western Ghats slopes. Vegetation degradation from overgrazing and fuelwood removal affects the Aravallis and Deccan commons, and wind erosion spreads sand in the Thar.
Salinisation and waterlogging in canal commands such as the Indira Gandhi Canal area and parts of Haryana take land out of farming. Mining scars land in the Jharia coalfield, Bellary iron-ore belt and Goa. Rajasthan, Maharashtra, Gujarat, Jharkhand and Odisha have the largest degraded areas (ISRO, 2021).
Effects on sustainability: lower yields push farmers onto marginal land, silt reduces reservoir life and groundwater recharge, biodiversity falls, and rural poverty and migration rise, a vicious circle that degrades more land.
Map: Outline map of India shading the Thar (wind erosion), Chambal ravines, Punjab–Haryana and Indira Gandhi Canal area (salinity, waterlogging), Jharia and Bellary (mining) and the north-eastern jhum belt.
India’s responses include integrated watershed management under PMKSY, the Green India Mission, the target of land degradation neutrality and restoring 26 million ha by 2030, announced at UNCCD COP14 in New Delhi (2019). Sustainable land use must keep productivity within the land’s carrying capacity.
3. World Distribution of Plants and Animals; Gene Pool Centres
Example 13 (UPSC 2026, 20 marks): How does the annual variations in temperature and precipitation influence plants growth, development and distribution? How do animals cope up with variations in climate?
Paper and question: Paper I, Q4(a)
Approach: First explain how annual temperature and precipitation regimes control plant growth, development (phenology) and distribution, then how animals cope through physiological, morphological and behavioural adaptations; draw Whittaker’s biome diagram.
Temperature and precipitation, and their variation through the year, are the main climatic controls of life. They set the length of the growing season, the timing of life cycles and the limits of each species’ range.
Temperature and plants: photosynthesis and growth run only within a range, roughly above 5 to 6 °C for most plants, so the growing season shortens poleward and upward. Winter cold triggers dormancy and leaf fall in temperate deciduous trees, and wheat needs vernalisation to flower. Frost limits mangroves and palms to warm coasts, and the treeline marks where summer warmth is too short for trees, near 3,500 to 4,000 m in the western Himalaya.
Precipitation and plants: the amount and season of rain decide whether forests are evergreen or deciduous. A long dry season makes sal and teak shed leaves in the Indian monsoon forests; desert ephemerals of the Thar complete their life cycle within weeks after rain; xerophytes store water or root deeply.
Distribution: Whittaker (1975) showed that biomes can be plotted by mean annual temperature and rainfall, and Holdridge’s life zones (1947) use temperature, rainfall and evapotranspiration in the same way.
Diagram: Whittaker’s biome diagram: mean annual temperature on the x-axis, annual precipitation on the y-axis, with tundra, taiga, temperate forest, grassland, desert, savanna and tropical rainforest as fields.
How animals cope: physiologically through hibernation (Himalayan brown bear, marmot) and aestivation (lungfish, desert snails); morphologically following Bergmann’s rule (larger bodies in colder climates) and Allen’s rule (shorter ears and limbs), with thick fur and fat as in the snow leopard and yak.
Behaviourally, animals migrate to follow food and rain: Amur falcons pass over Nagaland each autumn, cranes winter in Rajasthan, and wildebeest circle the Serengeti. Desert animals are nocturnal or burrow, and many breed to match the season of plenty.
As climate warms, these ranges and timings are shifting, a key concern for biodiversity.
Example 14 (UPSC 2024, 15 marks): "The latitudinal gradient in species richness is an important geographic trend in biodiversity." Examine the statement.
Paper and question: Paper I, Q4(c)
Approach: Describe the pattern of species richness from equator to poles with examples, examine the main explanations and the exceptions, and conclude on its value for conservation; draw a richness–latitude graph.
The latitudinal diversity gradient is the increase in the number of species from the poles to the tropics, noted since Alexander von Humboldt. It holds for most groups of plants, birds, mammals, insects and marine life, and is among the most consistent patterns in biogeography.
Examples: plots in western Amazonia hold several hundred tree species per hectare, against a handful in the boreal taiga; Colombia, Brazil and Indonesia are richer in birds and plants than any temperate country. In India, the Western Ghats and north-east are far richer than Ladakh.
Explanations: the time-stability idea holds that the tropics escaped Pleistocene glaciation and had longer to diversify; the area hypothesis notes the tropics form the largest climatic zone; the energy idea links more sunlight and productivity to more species; faster evolution at high temperatures and intense competition, predation and specialisation also add species. Most scholars think several causes act together, and the relative weight is debated.
Diagram: A graph of species richness against latitude from 90°S to 90°N, peaking between the tropics and falling toward both poles, slightly asymmetric.
Exceptions: penguins, seabirds, some aphids and conifers peak outside the tropics, and freshwater and marine groups show weaker gradients.
The gradient guides conservation: most of the 36 biodiversity hotspots (Myers’ idea, 1988) lie in the tropics, including the Western Ghats–Sri Lanka and Indo-Burma, where protection yields the greatest return.
Example 15 (UPSC 2022, 20 marks): Plants and animals that exist in a particular ecosystem are those that have been successful in adjusting to their habitat and environmental conditions. Elucidate with examples.
Paper and question: Paper I, Q3(a)
Approach: Explain adaptation through the laws of tolerance and limiting factors, then elucidate with plant and animal examples from contrasting ecosystems (desert, mangrove, rainforest, tundra, high mountain) and the fate of those that fail; draw a tolerance curve.
Every ecosystem works as a filter. Liebig’s law of the minimum and Shelford’s law of tolerance (1913) state that a species survives only where each environmental factor lies within its range of tolerance; natural selection, as Darwin explained, keeps those that adapt and removes those that do not.
Hot deserts: cacti and euphorbias store water and open stomata at night; khejri in the Thar roots very deep; the camel tolerates water loss and the desert gerbil stays in burrows by day.
Mangroves: in the Sundarbans, Rhizophora and Avicennia grow breathing roots (pneumatophores), stilt roots and seeds that germinate on the tree (vivipary) to cope with salt and tides; mudskippers breathe air and the tiger swims between islands.
Tropical rainforests: buttress roots, drip-tip leaves, climbers and epiphytes reach for light; the lion-tailed macaque and great hornbill of the Western Ghats live in the canopy.
Diagram: Shelford’s tolerance curve: a bell-shaped curve of population against an environmental factor, with the optimum range at the centre, zones of stress on both sides and zones of intolerance at the ends.
Tundra and high mountains: cushion plants and mosses hug the ground; the musk ox and arctic fox carry dense fur; the yak has large lungs and the snow leopard a thick tail for warmth in Ladakh.
Species that fail to adjust disappear: the cheetah was declared extinct in India in 1952 after habitat loss and hunting, and its reintroduction at Kuno (2022) tests whether it can adjust again. Invasive Lantana and Prosopis show that wide tolerance also explains success.
Hence the composition of an ecosystem reflects long adjustment between life and habitat, which rapid human change now threatens to break.
Example 16 (UPSC 2021, 10 marks): Gene pool centres are 'Good Hope' for biodiversity conservation. Elucidate.
Paper and question: Paper I, Q1(d)
Approach: Explain gene pool centres after Vavilov, show why their genetic diversity is a hope for crops and biodiversity with examples, and note in situ and ex situ conservation; draw a world map of Vavilov’s centres.
Gene pool centres are regions where crop plants were first domesticated and where their wild relatives and traditional varieties still show the greatest genetic diversity. N.I. Vavilov, in work from 1926 to the 1930s, identified eight such centres, including the Hindustan centre, home of rice, sugarcane, pigeon pea, mango and brinjal.
They are a ‘good hope’ because this diversity holds genes for resistance to pests, disease, drought and salinity. When grassy stunt virus hit Asian rice in the 1970s, resistance was found in the wild rice Oryza nivara collected in India and bred into IRRI varieties.
Map: World map marking Vavilov’s eight centres: China, Hindustan (with Indo-Malayan), Central Asia, Near East, Mediterranean, Abyssinia, South Mexico–Central America and South America.
Conservation works in two ways: in situ, as in the Nokrek area of the Garo Hills, protected for wild citrus, and ex situ in the National Gene Bank of ICAR-NBPGR, New Delhi, and the Svalbard Global Seed Vault (2008).
As monocultures replace local varieties, protecting these centres keeps future food security and adaptation to climate change possible.
Example 17 (UPSC 2020, 10 marks): Which factors influence the growth of wild plants in India? Discuss their economic significance.
Paper and question: Paper I, Q1(d)
Approach: Discuss the climatic, relief, soil and biotic factors that control wild plant growth in India, then their economic significance with examples and data; draw a map of India’s natural vegetation.
The growth of wild plants in India depends on rainfall first: above about 200 cm gives tropical evergreen forest (Western Ghats, north-east), 100–200 cm moist deciduous, 50–100 cm dry deciduous, and below 50 cm thorn scrub in Rajasthan and Gujarat.
Temperature and altitude add zonation in the Himalaya, from sal at the foothills to oak, deodar, birch and alpine meadows. Soils matter locally: mangroves on saline deltas, sal on well-drained red and laterite soils. Grazing, fire and clearing alter all of these.
Map: Outline map of India showing evergreen, moist deciduous, dry deciduous, thorn, montane and mangrove forests.
Economic significance: timber (teak, sal, deodar), bamboo, and minor forest produce such as tendu leaves, mahua, sal seeds, lac and medicinal herbs that support millions of tribal families. Forests also give fodder and fuelwood and protect soil and water. Forest cover was about 21.8% of India’s area (ISFR 2023).
Sustainable harvesting can thus join livelihoods with conservation.
Example 18 (UPSC 2017, 15 marks): Give a classification of plants based on the amount of water requirement.
Paper and question: Paper I, Q3(c)
Approach: Give Warming’s classification of plants by water need and describe each group with adaptations and Indian examples; draw a moisture gradient diagram from water to desert.
Water is the most decisive factor in plant form. The Danish botanist Eugenius Warming, in his Oecology of Plants (1895, English edition 1909), grouped plants by their water relations, a scheme still used in biogeography.
Hydrophytes grow in or on water: submerged (Hydrilla, Vallisneria), free-floating (water hyacinth, Pistia), rooted with floating leaves (lotus, water lily) and emergent (Typha). They have little supporting tissue, air spaces for buoyancy and reduced roots, as in Dal Lake and the Loktak phumdis.
Mesophytes need moderate, steady moisture: most crops and trees such as mango, sal and neem, with well-developed roots, broad leaves and stomata on the lower surface.
Xerophytes survive drought: ephemerals that complete life after rain, succulents such as Opuntia and Euphorbia that store water, and hardy shrubs such as Acacia, Prosopis and Calotropis with deep roots, thick cuticles, sunken stomata and small or spiny leaves, as in the Thar.
Halophytes tolerate salt, like the mangroves Rhizophora and Avicennia of the Sundarbans and Suaeda of the Rann of Kachchh. Tropophytes change with the seasons, behaving as mesophytes in the rains and xerophytes in the dry season, like teak, which sheds leaves.
Diagram: A horizontal gradient from open water to desert showing submerged, floating and emergent hydrophytes, a marsh, mesophytic forest, tropophytic deciduous forest and xerophytic scrub, with a saline coast branch for halophytes.
This classification explains vegetation zones and helps choose species for afforestation and dryland farming.
Example 19 (UPSC 2016, 10 marks): Bring out the ecological significance of Tropical Rainforest Biome.
Paper and question: Paper I, Q1(d)
Approach: Locate the biome, then bring out its ecological significance (biodiversity, carbon, water cycle, nutrient cycling, genetic resources) with examples; draw a world map of tropical rainforests.
The tropical rainforest biome lies roughly within 10° of the equator where rain exceeds about 200 cm and temperatures stay near 27 °C all year: the Amazon, Congo basin and South-east Asia, and in India the Western Ghats, north-east and Andaman and Nicobar Islands.
Biodiversity: though it covers a small share of land, it is commonly estimated to hold over half of terrestrial species, in layered canopies with epiphytes and climbers.
Climate and water: it stores vast carbon in biomass and recycles rainfall through transpiration; Amazon moisture feeds rain far to the south.
Nutrient cycling: nutrients lie mostly in living biomass and recycle rapidly, so soils are poor once forest is cleared.
Map: World map shading the Amazon, Congo, South-east Asian and north-east Australian rainforests, with India’s Western Ghats and north-east.
It is also a store of genes and medicines, such as vincristine from the rosy periwinkle of Madagascar, and home to indigenous peoples. Its loss would weaken global climate and life support.
Example 20 (UPSC 2016, 15 marks): Describe Newbigin's scheme of Floristic regions of the world and explain the Mediterranean Floristic region.
Paper and question: Paper I, Q4(c)
Approach: Outline Newbigin’s grouping of the world’s plant regions on climate and plant life-forms, then explain the Mediterranean region’s location, climate, vegetation, adaptations and human use; draw a world map of Mediterranean-type regions.
Marion Newbigin, in Plant and Animal Geography (1936), grouped the world’s vegetation into broad regions in which climate shapes the dominant plant life-forms. Indian textbooks present her scheme in slightly different forms, but its main regions are:
Forest regions: tropical rainforest, tropical monsoon and deciduous forest, temperate deciduous and evergreen forest, and coniferous forest; grassland regions: tropical savanna and temperate steppe and prairie; desert regions: hot and cold deserts; and the Mediterranean, tundra and mountain regions with their own distinctive floras.
Mediterranean floristic region: found on the western sides of continents between about 30° and 45° latitude: the Mediterranean Basin, California, central Chile, the south-western Cape of South Africa and south-western and southern Australia. Summers are hot and dry, winters mild and wet.
The vegetation is sclerophyllous evergreen woodland and scrub: cork oak, holm oak, olive and Aleppo pine, degrading into maquis and garrigue scrub; chaparral in California, matorral in Chile, fynbos in the Cape and mallee in Australia. Plants have small, thick, waxy leaves, deep roots and thick bark, and many recover after fire.
Map: World map shading the five Mediterranean-climate regions on western continental margins between 30° and 45° N and S.
The region has very high endemism; the Cape is treated as a separate floral kingdom by Ronald Good. Long human use created the ‘orchard lands’ of olive, vine and citrus, while fire, grazing and urban growth now threaten them.
Newbigin’s scheme thus links plants to climate, and the Mediterranean region shows this most clearly.
Example 21 (UPSC 2014, 10 marks): State the uniqueness of the Eurasian Steppe Biome.
Paper and question: Paper I, Q1(d)
Approach: Locate the Eurasian steppe and state what makes it unique in extent, climate, soils, flora and fauna, and human history; draw a map of the steppe belt.
The Eurasian Steppe is the largest temperate grassland on Earth, stretching about 8,000 km from the Hungarian puszta through Ukraine, southern Russia and Kazakhstan to Mongolia and north-east China.
Climate: deep in the continent, it has hot summers, very cold winters and about 250 to 500 mm of rain, mostly in early summer, which favours grass over trees.
Soils and flora: feather grass (Stipa) and fescue built the black Chernozem and chestnut soils, among the most fertile in the world.
Fauna: grazing and burrowing animals such as the saiga antelope, bobak marmot and susliks, and Przewalski’s horse, now reintroduced in Mongolia.
Map: Map of Eurasia shading the steppe belt from the Danube to Manchuria between forest to the north and deserts to the south.
Human history: it was a corridor of horse-riding nomads, from the Scythians to the Mongols, and of Silk Road trade. Since the Soviet Virgin Lands Campaign of the 1950s much of it has become a wheat granary, which brought wind erosion. Its unbroken extent and historical role make it unique.
Example 22 (UPSC 2014, 15 marks): Define zoogeographic region. Also describe the basic faunal makeup of the Neo-Arctic zoogeographic region.
Paper and question: Paper I, Q4(b)
Approach: Define a zoogeographic region with Sclater and Wallace, then describe the Nearctic region’s extent and its faunal make-up: shared Holarctic animals, endemics, immigrants and absences; draw a world map of Wallace’s six realms.
A zoogeographic region is a large part of the Earth whose animal life is distinctive, with characteristic and endemic groups, separated from others by barriers such as oceans, deserts and mountains. P.L. Sclater (1858) proposed six regions from bird distribution and A.R. Wallace (1876) extended them to all animals: Palaearctic, Nearctic, Neotropical, Ethiopian, Oriental and Australian.
The Nearctic region covers North America, including Greenland, down to the Mexican highlands, where it meets the Neotropical region.
Shared Holarctic fauna: because North America was joined to Asia by the Bering land bridge, it shares many groups with the Palaearctic: moose, caribou (reindeer), wolves, brown bears, beavers, lynx, bison and the arctic musk ox.
Characteristic and endemic animals: the pronghorn (the only living member of its family), the mountain beaver, pocket gophers, the wild turkey, sage grouse, American alligator and a great variety of salamanders.
Immigrants and absences: the opossum and armadillo entered from South America after the Isthmus of Panama formed; true primates, apes and many tropical groups are absent.
Map: World map of Wallace’s six realms with boundaries: Nearctic separated from Neotropical across Mexico, and Wallace’s Line between Oriental and Australian regions.
The Nearctic thus combines northern Holarctic elements with a few endemics and southern immigrants, a mix shaped by past land bridges and glaciations.
4. Deforestation, Social Forestry, Agro-forestry and Wildlife
Example 23 (UPSC 2025, 15 marks): Man and wildlife conflicts are ever increasing. Discuss its causes, consequences and remedies.
Paper and question: Paper I, Q2(c)
Approach: Define human–wildlife conflict, then discuss its causes, consequences and remedies in turn with Indian and world examples; draw a map of India marking conflict hotspots.
Human–wildlife conflict arises when wild animals and people compete for space and resources, causing loss to both. In India it involves elephants, tigers, leopards, wild boar, nilgai and monkeys, and is rising as the two share ever smaller landscapes.
Causes: loss and fragmentation of habitat through farming, mining and settlement; roads, railways and canals cutting through movement routes (the Elephant Corridors of India report, 2023, listed 150 corridors); crops such as sugarcane that shelter leopards, as in Junnar (Maharashtra); recovery of some populations, with about 3,682 tigers estimated in 2022; and degraded forests that push animals out for food and water.
Consequences: human deaths and injuries, crop and livestock losses that hit poor farmers hardest, elephant deaths on railway tracks and from electrocution, retaliatory poisoning of tigers and leopards, and growing hostility to conservation.
Map: Outline map of India marking conflict hotspots: elephant ranges of Odisha, Jharkhand, Chhattisgarh, Assam and Kerala–Karnataka, tiger landscapes of the Terai and Sundarbans, leopards in Junnar, and monkey conflict in Himachal Pradesh.
Remedies: securing corridors and building animal underpasses and elevated roads; early-warning systems and slower trains in elephant zones; solar fences, bee-box fences (KVIC’s Project RE-HAB) and chilli barriers; quick and fair compensation; community response teams; and the national advisory on human–wildlife conflict (2021). Kenya’s bee fences and community conservancies offer world lessons.
Coexistence, not separation, is the goal, built on land-use planning that leaves room for wildlife.
Example 24 (UPSC 2025, 20 marks): What are the ecological consequences of agricultural deforestation in the Amazon and Congo Basins, particularly concerning biodiversity and climate regulation?
Paper and question: Paper I, Q4(a)
Approach: Explain the agricultural drivers of deforestation in each basin, then the ecological consequences for biodiversity and for climate regulation (carbon, moisture recycling, tipping points), ending with responses; draw a map of both basins marking deforestation fronts.
The Amazon and Congo basins hold the two largest tropical rainforests, and agriculture is the main cause of their loss. In the Amazon the drivers are commercial: cattle ranching and soybean farming along the ‘arc of deforestation’ in Pará, Mato Grosso and Rondônia. In the Congo basin, especially the DR Congo, small-scale shifting cultivation and charcoal making by a growing rural population dominate.
Biodiversity: clearing destroys habitat for very many endemic species, such as the bonobo and okapi in the DR Congo. Fragmentation creates edge effects of drying, wind damage and fire, as shown by the long-running forest-fragment experiment near Manaus begun by Thomas Lovejoy in 1979. Roads open forests to hunting, which empties them of seed-dispersing animals such as forest elephants and primates.
Carbon: burning and decay release stored carbon; studies (Gatti and others, 2021) found parts of the south-eastern Amazon now emit more carbon than they absorb. The Congo’s Cuvette Centrale peatlands store about 30 billion tonnes of carbon (Dargie and others, 2017), which clearing and drainage could release.
Moisture recycling: rainforests return much rainfall to the air through transpiration, the ‘flying rivers’ that carry Amazon moisture to southern Brazil and the La Plata basin. Loss of forest lengthens dry seasons and raises local temperature. Lovejoy and Nobre (2018) warned of a tipping point at about 20 to 25% deforestation, after which parts of the Amazon may turn to degraded savanna; the threshold is debated.
Map: Maps of South America and Central Africa showing the Amazon and Congo basins, the arc of deforestation in southern and eastern Amazonia, smallholder clearing around Kinshasa and Kisangani, and the Cuvette Centrale peatlands.
Responses include Brazil’s PPCDAm action plan (2004) and the Soy Moratorium (2006), which cut deforestation sharply by 2012, satellite monitoring by INPE, indigenous territories, REDD+ finance and the Central African Forest Initiative (2015). Protecting both basins is vital for global biodiversity and climate stability.
Example 25 (UPSC 2024, 10 marks): Examine the impacts of social forestry in socio-economic transformation of rural areas.
Paper and question: Paper I, Q1(d)
Approach: Define social forestry and its components, then examine its economic, social and ecological impacts on rural areas with Indian examples, including its limitations; draw a diagram of social forestry components.
Social forestry, recommended by the National Commission on Agriculture (1976), means growing trees on village commons, farm boundaries, roadsides and canal banks to meet rural needs of fuelwood, fodder and small timber while easing pressure on natural forests.
Economic impact: farm forestry with eucalyptus and poplar raised farm incomes in Gujarat, Punjab and Haryana, where poplar feeds the plywood units of Yamunanagar; planting and nurseries created rural jobs.
Social impact: fuelwood and fodder near villages cut the time women spend gathering, and community woodlots gave panchayats a shared asset.
Diagram: A tree diagram of social forestry: farm forestry, community forestry and extension forestry (roadside, canal bank, railway line), with outputs fuel, fodder, timber, income and soil protection.
Ecological impact: wastelands were greened and soil erosion checked. Critics, however, note that benefits often went to larger farmers and that eucalyptus monocultures met market rather than local needs.
Linked with Joint Forest Management and the National Agroforestry Policy (2014), social forestry remains a useful tool of rural change.
Example 26 (UPSC 2020, 15 marks): Explain the effects and causes of deforestation, and its impact on the pattern of agriculture in India.
Paper and question: Paper I, Q3(b)
Approach: Explain the causes of deforestation in India, its environmental and social effects, and then its specific impact on the pattern of agriculture with regional examples; draw a map of India marking the regions discussed.
Deforestation is the permanent removal of forest cover for other land uses. India’s forest cover is about 21.8% of its area (ISFR 2023), well below the one-third goal of the National Forest Policy (1988), and dense natural forest continues to thin in the north-east and central India.
Causes: clearing for farming and colonial plantations of tea and coffee in Assam and the Nilgiris; shortened jhum cycles in the north-east; submergence by river valley projects such as Sardar Sarovar; coal and iron-ore mining in Jharkhand, Odisha and Chhattisgarh; roads, towns, grazing, fire and fuelwood demand.
Effects: soil erosion and floods in the Himalaya, silting of reservoirs, falling groundwater, loss of biodiversity, more human–wildlife conflict and loss of tribal livelihoods.
Impact on agriculture: in the north-east, jhum cycles have fallen from a decade or more to a few years, lowering yields and pushing a shift to terraces, horticulture and plantations such as rubber in Tripura. In the Shivaliks of Punjab, deforestation produced torrents (choes) that buried farmland with sand. Loss of forest fodder and leaf manure reduced livestock and raised dependence on chemical fertilisers, while silted tanks in the Deccan weakened irrigation.
Map: Outline map of India marking jhum areas of the north-east, the Shivalik choe belt in Hoshiarpur, the mining belt of Jharkhand, Odisha and Chhattisgarh, and tea and coffee plantation areas of Assam and the Nilgiris.
Agroforestry, watershed treatment and Green India Mission plantations can restore the forest–farm balance on which Indian agriculture depends.
Example 27 (UPSC 2018, 15 marks): Discuss the causes of degradation of tropical rainforests and suggest remedial measures for their prevention, conservation and development.
Paper and question: Paper I, Q4(c)
Approach: Discuss the direct and underlying causes of tropical rainforest degradation with world and Indian examples, then suggest measures under prevention, conservation and development; draw a flow chart of causes and remedies.
Tropical rainforests are being degraded, thinned and fragmented as well as cleared. Their causes are both direct and underlying.
Direct causes: cattle ranching and soy in the Amazon; oil palm and pulpwood plantations in Indonesia and Malaysia; commercial logging in Borneo and Central Africa; shifting cultivation with shortened fallows in the Congo basin and north-east India; mining such as Carajás iron ore in Brazil; dams such as Belo Monte; and fires that spread from cleared land.
Underlying causes: population growth and poverty, roads such as the Trans-Amazonian Highway opening new frontiers, global demand for beef, soy and palm oil, weak land titles and governance, and droughts made worse by climate change.
Prevention: moratoria and law enforcement, such as the Soy Moratorium (2006) and Indonesia’s halt on new licences in primary forest and peat, made permanent in 2019; satellite monitoring by Brazil’s INPE; and certification by FSC and RSPO.
Conservation: protected areas and World Heritage sites such as the Western Ghats (2012); recognition of indigenous territories; and REDD+ payments for keeping carbon in forests.
Development: extractive reserves such as the Chico Mendes reserve in Acre; payments for ecosystem services pioneered by Costa Rica; agroforestry and value chains for forest products; Joint Forest Management in India.
Diagram: Flow chart linking causes (ranching, plantations, logging, shifting cultivation, mining, roads) to degradation and then to remedies under prevention, conservation and development.
Lasting success needs forests to be worth more standing than cleared for the people who live in them.
Mains points
- Soil questions reward correct pedological vocabulary: pedon, solum, horizons (O, A, E, B, C, R), zonal, intrazonal and azonal soils, pedalfers and pedocals, with a labelled soil profile in every answer.
- Biogeography questions expect named classifications with their authors: Wallace and Sclater for zoogeographic realms, Vavilov for gene centres, Warming for water-based plant groups, Newbigin for floristic regions, Whittaker for biomes.
- Erosion and degradation answers score when they link the physical process to food security and give Indian evidence such as the ISRO Desertification and Land Degradation Atlas and named regions like the Chambal ravines.
- Deforestation and wildlife questions are increasingly applied: Amazon and Congo, human-wildlife conflict, social forestry. Balance causes, consequences and remedies, and cite Indian programmes with correct years.
- Draw something in every answer: a soil profile, a world map of realms or biomes, a Whittaker biome diagram or a cause-effect flow chart. Examiners in Geography optional reward visual presentation.
Did you know?
- Memory trick for the soil horizons from top to bottom: O A E B C R, read as 'Old Apes Eat Bananas Carefully, Right?'
Geography Optional: All chapters
- Exam Pattern, Syllabus and Strategy
- The Earth's Interior and Tectonics
- Geomorphic Processes and Landscape Development
- Climatology: Atmosphere and Circulation
- Climatology: Weather Systems, Climates and Climate Change
- Oceanography
- Biogeography
- Environmental Geography
- Perspectives in Human Geography
- Economic Geography
- Population Geography
- Settlement Geography
- Regional Planning
- Models, Theories and Laws in Human Geography
- India: Physical Setting I
- India: Physical Setting II
- Resources of India
- Agriculture in India
- Industry in India
- Transport, Communication and Trade
- Cultural Setting and Population of India
- Settlements in India
- Regional Development and Planning in India
- Political Aspects
- Contemporary Issues
- Places for the Map Question