
Geography Optional · UPSC Notes
India: Physical Setting II — UPSC Geography Optional Notes
Free, exam-focused notes for UPSC Prelims and Mains, with Prelims tips and Mains points for every topic. 5 topics.
Open in the interactive reader: bookmarks, progress tracking and read-aloud.
Mechanism of the Indian Monsoon and Rainfall Patterns
The Indian monsoon is a seasonal reversal of winds that brings about three-quarters of India's annual rain between June and September. Classical thermal theory (Halley) has given way to a dynamic view involving the northward shift of the ITCZ, the heating of the Tibetan Plateau, the Tropical Easterly Jet, the Somali jet and ocean–atmosphere links such as El Niño, the Indian Ocean Dipole and the MJO. The 2026 season ended at about 87% of the long period average (IMD), showing how variability affects farming, water and the economy.
In simple words
In summer the land heats up much faster than the sea, like a hot frying pan next to a bucket of water.
Moist sea winds rush towards the hot land and drop rain: this seasonal wind is the monsoon.
In winter the flow reverses and dry winds blow from land to sea.
Most of India's crops, rivers and reservoirs depend on these four rainy months, so UPSC asks how the monsoon works, why it fails some years and how rain is distributed.
1. Concepts and Definitions
Monsoon: from the Arabic mausim (season); a seasonal reversal of the prevailing wind direction of at least about 120° between January and July, with associated wet and dry seasons (a definition used in climatology following Ramage, 1971).
Seasons recognised by IMD: winter (January–February), pre-monsoon or hot weather (March–May), south-west monsoon (June–September) and post-monsoon or retreating monsoon (October–December).
Long Period Average (LPA): the all-India June–September average rainfall for 1971–2020, about 87 cm (868.6 mm per IMD); seasons are 'normal' at 96–104% of LPA and 'deficient' below 90%.
Inter-Tropical Convergence Zone (ITCZ): a low-pressure belt where the trade winds of both hemispheres meet; in July it shifts to about 20°–25°N over the Gangetic plain as the monsoon trough.
Tropical Easterly Jet (TEJ): a strong easterly upper-air wind (about 150–100 hPa) over peninsular India in summer, identified by P.R. Krishna Rao and P. Koteswaram in the 1950s.
Somali (Findlater) jet: a low-level cross-equatorial jet off East Africa described by J. Findlater (1969) that carries moisture into the Arabian Sea branch.
Break in the monsoon: a spell of a week or more with little rain over central India when the monsoon trough shifts to the Himalayan foothills; heavy rain then falls in the foothills and North-East.
2. Theories of the Monsoon
Thermal theory (Edmund Halley, 1686): differential heating of land and sea creates a summer low over land and a high over the ocean; winds blow from sea to land; simple but cannot explain sudden onset, breaks or year-to-year variation.
Dynamic (ITCZ shift) theory (Flohn, 1951): the monsoon is a seasonal migration of planetary wind belts; south-east trades cross the equator, are deflected by the Coriolis force and become south-westerlies.
Tibetan Plateau and jet stream theory: the plateau heats strongly in summer and acts as an elevated heat source, creating an upper-level anticyclone; the subtropical westerly jet jumps north of the Himalaya (about early June), allowing the easterly jet and monsoon flow to establish; work by Flohn, Koteswaram (1958) and Yin (1949) on the jet is classic.
Ocean–atmosphere links: El Niño Southern Oscillation (ENSO, Gilbert Walker identified the Southern Oscillation in the 1920s): El Niño years often bring weaker monsoons (2002, 2009, 2015); La Niña years often better ones.
Indian Ocean Dipole (Saji et al., 1999): a positive IOD (warmer western Indian Ocean) tends to support Indian rainfall and can offset El Niño (as in 1997 and 2019).
Madden–Julian Oscillation (Madden and Julian, 1971): an eastward-moving pulse of clouds and rain every 30–60 days that influences active and break spells.
Present view: the monsoon is a coupled land–ocean–atmosphere system; no single theory is complete, and the relative weight of factors is debated.
3. Onset, Advance, Breaks and Withdrawal
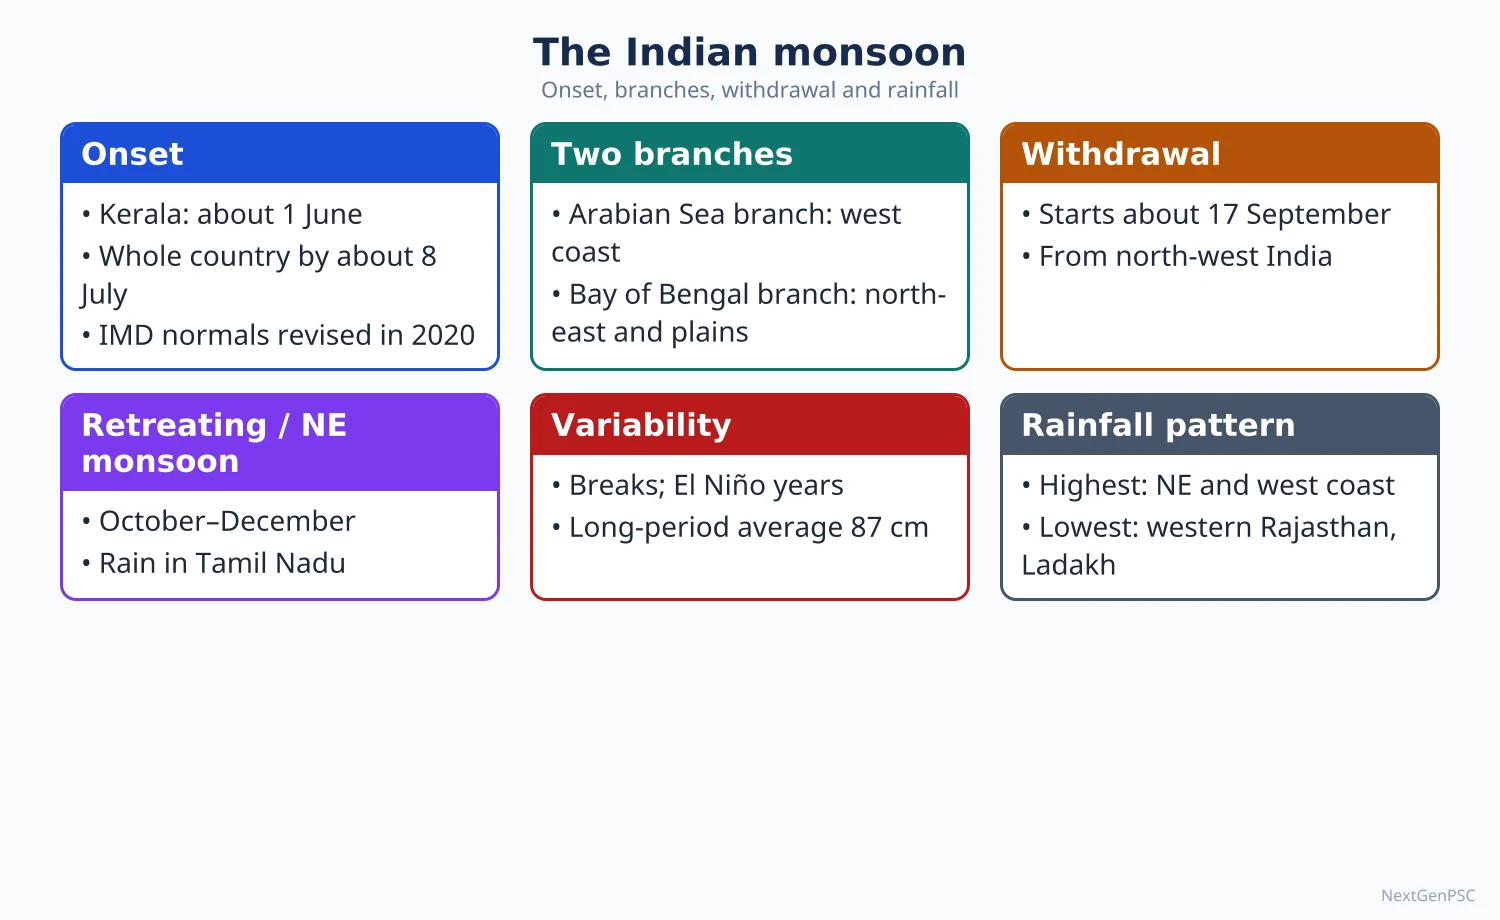
Onset over Kerala: normal date 1 June; IMD declares onset using rainfall at 14 stations, depth of westerlies and outgoing longwave radiation; 'burst of monsoon' refers to the sudden heavy rain at onset.
Two branches: the Arabian Sea branch strikes the Western Ghats (orographic rain on the windward side, rain shadow on the Deccan); the Bay of Bengal branch moves up to the North-East (Meghalaya's funnel-shaped hills give very heavy rain at Mawsynram and Cherrapunji) and is turned west along the Himalaya into the Ganga plain.
Advance: covers the whole country by about 8 July (normal date revised by IMD in 2020 from 15 July).
Withdrawal: begins from north-west India around 17 September (revised normal) and is complete by mid-October; in 2026 it began on 19 September (IMD).
North-east (winter) monsoon: October–December; Tamil Nadu coast, south Andhra Pradesh and Kerala receive much of their rain; Tamil Nadu gets about half of its annual rainfall in this season.
Western disturbances: winter rain and snow in north-west India from Mediterranean-origin systems help rabi wheat (see next topic).
4. Rainfall Patterns and Variability
Spatial pattern: over 200 cm on the Western Ghats coast, sub-Himalaya and North-East; 100–200 cm in the eastern plains and eastern plateau; 50–100 cm in the interior Deccan and upper Ganga plain; less than 50 cm in western Rajasthan, Kutch and Ladakh.
Controls: distance from the sea, orography (windward vs leeward), direction of monsoon branches, and the position of the monsoon trough and lows that move west-north-west from the Bay of Bengal.
Variability: the coefficient of variation is low (below about 25%) in high-rainfall areas and high (over 50%) in western Rajasthan, which explains drought proneness there.
Recent data: the 2026 south-west monsoon gave 759.4 mm against an LPA of 868.6 mm (about 87%); June was very weak (about 50% of LPA) and the south peninsula and east and north-east India were the most deficient (IMD end-of-season statement, 30 September 2026); 2025 had been above normal.
Trends: studies (e.g. Roxy et al., 2017, in Nature Communications) report an increase in widespread extreme rain events over central India since 1950 along with weakening mean rainfall in some regions; findings vary by dataset and are debated.
Forecasting: IMD issues long-range forecasts in April and an update in late May using a multi-model ensemble and the Monsoon Mission Coupled Forecasting System; extended-range forecasts help farmers plan sowing.
5. Theory and Debates
Is the monsoon a land–sea breeze on a large scale? Halley's model is a useful first approximation but most climatologists now treat the monsoon as part of the planetary circulation (Flohn), with the Himalaya–Tibet complex as essential.
Role of the Himalaya: the Himalaya act as a barrier keeping out cold Central Asian air and trapping monsoon moisture; modelling studies differ on whether the barrier or the heating of Tibet matters more.
ENSO–monsoon relationship: the inverse link weakened after about 1980 (Krishna Kumar et al., 1999), partly because of Indian Ocean warming and the IOD; this remains an active debate.
Climate change: warming may increase moisture and extreme rain but also make the monsoon more erratic; the IPCC AR6 (2021) projects an increase in South Asian monsoon precipitation with high variability.
6. Maps and Diagrams to Draw
Onset isochrones map: lines showing normal onset dates: 1 June (Kerala), about 5 June (North-East), about 10–11 June (Mumbai, Kolkata), about 27–30 June (Delhi region), 8 July (whole country), following IMD's revised normals of 2020; arrows for the Arabian Sea and Bay of Bengal branches.
Annual rainfall map: shade zones above 200 cm, 100–200 cm, 50–100 cm and below 50 cm; label Mawsynram, the Western Ghats and western Rajasthan.
July circulation diagram: India with the monsoon trough from Ganganagar to the head of the Bay of Bengal, south-west winds, the TEJ at upper level and the Tibetan high.
Walker circulation sketch: normal year vs El Niño year across the Pacific, with arrows for rising and sinking air.
Orographic rain section: west–east profile across the Western Ghats showing windward rain at Mahabaleshwar and rain shadow at Pune.
7. Using It in the Exam
10 marks: define the monsoon, list three mechanisms (thermal, ITCZ shift, jets/Tibet) and one teleconnection, with a circulation sketch.
15 marks: explain onset, branches and breaks with an onset map; add the 2026 deficit as a current example.
20 marks: critically evaluate theories, add ENSO, IOD and MJO, spatial rainfall pattern and variability, and implications for agriculture and water.
Keywords: differential heating, ITCZ, monsoon trough, Tropical Easterly Jet, Somali jet, ENSO, IOD, MJO, break monsoon, LPA.
Attributed idea: Flohn (1951) explained the monsoon as a seasonal shift of planetary wind belts rather than a giant sea breeze.
Mistake to avoid: giving outdated normal dates (15 July for full coverage); use IMD's revised dates (8 July).
| Factor | Favourable phase for India | Unfavourable phase | Example years |
|---|---|---|---|
| ENSO (Pacific) | La Niña | El Niño | El Niño droughts: 2002, 2009, 2015 |
| Indian Ocean Dipole | Positive IOD | Negative IOD | Positive IOD offset El Niño in 1997 |
| Tibetan Plateau heating | Strong spring heating, low snow cover | Heavy Eurasian/Himalayan snow | Snow–monsoon link noted by Blanford (1884) |
| MJO | Active phase over Indian Ocean | Phase over Pacific | Governs active and break spells within a season |
| Somali jet | Strong cross-equatorial flow | Weak jet | Affects Arabian Sea branch rainfall |
Mains points
- Typical questions: 'Explain the mechanism of the Indian monsoon', 'role of the Tibetan Plateau and jet streams', 'ENSO and IOD', 'monsoon variability and agriculture'.
- Present theories in order (thermal → dynamic → jet/Tibet → teleconnections) and conclude that the monsoon is a coupled system.
- Always draw at least one diagram: onset map or July circulation with the TEJ and monsoon trough.
- Use current data with source: 2026 season about 87% of LPA (IMD), revised onset and withdrawal dates (2020).
- Link rainfall patterns to agriculture, drought and flood regions, reservoirs and food prices to show applied understanding.
- Common mistake: treating El Niño as a guarantee of drought; mention the IOD and the weakened ENSO link.
Did you know?
- H.F. Blanford of the India Meteorological Department issued the first long-range monsoon forecast in 1886, using Himalayan snow cover as a predictor.
Tropical Cyclones, Western Disturbances, Floods and Droughts
Tropical cyclones form over the warm Bay of Bengal and Arabian Sea mainly in the pre-monsoon (April–June) and post-monsoon (October–December) seasons and strike the east coast far more often than the west. Western disturbances are extra-tropical lows from the Mediterranean region that bring winter rain and snow to north-west India. Floods and droughts are two faces of monsoon variability: the Ganga–Brahmaputra plains flood almost every year, while western Rajasthan, the Deccan rain-shadow and parts of Karnataka, Telangana and Bundelkhand are drought-prone.
In simple words
A cyclone is a giant spinning storm fed by warm sea water, like a huge whirlpool in the sky.
Western disturbances are winter rain-bearing winds from the Mediterranean that help wheat in Punjab and snow in Kashmir.
Too much rain in a short time brings floods; too little for too long brings drought.
These hazards destroy crops, homes and lives, so UPSC asks where and why they occur in India and how we manage them.
1. Tropical Cyclones: Concepts and Formation
Tropical cyclone: an intense, warm-core low-pressure system with spiralling winds (anticlockwise in the Northern Hemisphere), a calm eye surrounded by an eyewall of towering cumulonimbus clouds.
Conditions for formation (Gray, 1968, and later work): sea surface temperature above about 26.5°C to a depth of about 50 m, enough Coriolis force (so they rarely form within about 5° of the equator), low vertical wind shear, a pre-existing disturbance, and moist mid-troposphere with upper-level divergence.
Process: warm moist air rises → condensation releases latent heat → the column warms and pressure falls → more air converges and spirals in → upper outflow removes air → the storm intensifies while over warm water and decays after landfall or over cool water.
Hazards: storm surge (the biggest killer, e.g. 1999 Odisha super cyclone), very strong winds, torrential rain and floods, and saline intrusion into coastal farmland.
IMD classification (maximum sustained wind): depression 31–49 km/h, deep depression 50–61, cyclonic storm 62–88, severe cyclonic storm 89–117, very severe 118–166, extremely severe 167–221, super cyclonic storm 222 km/h and above.
Naming: storms in the North Indian Ocean are named from a list prepared by the WMO/ESCAP Panel on Tropical Cyclones (13 member countries, current list adopted in 2020).
Why the Bay of Bengal gets more cyclones: warmer and less saline surface water, the remnants of Pacific typhoons moving west, a funnel-shaped coast and the shallow continental shelf that increases surge; the Arabian Sea gets fewer, though studies (e.g. Murakami et al., 2017) report rising Arabian Sea activity with ocean warming.
2. Indian Cyclone Examples
East coast: Odisha super cyclone (1999), Phailin (2013, Gopalpur), Hudhud (2014, Visakhapatnam), Fani (2019, Puri), Amphan (2020, Sundarbans), Michaung (2023, Andhra coast), Remal (2024, West Bengal–Bangladesh), Dana (2024, Odisha), Montha (October 2025, Andhra Pradesh near Kakinada), Arnab (very severe cyclonic storm crossing the Andhra coast on 28 October 2026, IMD bulletins).
West coast: Ockhi (2017, Kerala, Tamil Nadu and Lakshadweep), Tauktae (2021, Gujarat), Biparjoy (June 2023, landfall near Jakhau, Kutch).
Success of preparedness: evacuations of over a million people before Phailin and Fani kept deaths far below 1999 levels; Odisha's multipurpose cyclone shelters and community warning systems are cited as models.
Institutions: IMD's Regional Specialised Meteorological Centre (RSMC) New Delhi issues warnings for the North Indian Ocean; the National Cyclone Risk Mitigation Project (NCRMP, World Bank-assisted, from 2011) built shelters and early warning systems.
3. Western Disturbances
Definition: eastward-moving extra-tropical low-pressure systems embedded in the subtropical westerly jet, originating over the Mediterranean, Caspian and Black Sea region and reaching north-west India mainly from December to March.
Mechanism: the westerly jet lies south of the Himalaya in winter; troughs in the jet steer the lows across Iran, Afghanistan and Pakistan; moisture is picked up from the Mediterranean, Caspian and Arabian Sea; they cause rain in Punjab, Haryana and western Uttar Pradesh and snow in Jammu and Kashmir, Himachal Pradesh and Uttarakhand.
Importance: winter rain (locally called mahawat) benefits rabi wheat and barley; Himalayan snowfall feeds rivers in summer; they also bring cold waves, fog and hailstorms.
Interaction with the monsoon: when a western disturbance meets monsoon moisture, extreme events can occur: the Kedarnath disaster (June 2013) and the Himachal floods of July 2023 are linked to such interaction.
4. Floods
Extent: the Rashtriya Barh Ayog (National Flood Commission, 1980) assessed about 40 million hectares as flood-prone; later estimates are of the same order, with Uttar Pradesh, Bihar, Assam and West Bengal most affected.
Causes: heavy, concentrated monsoon rain; low gradients and sediment-choked channels (the Kosi and Brahmaputra carry very high silt loads); embankment breaches; deforestation in catchments; encroachment on flood plains and urban drainage failure (Mumbai 2005, Chennai 2015, Bengaluru 2022); dam releases; cloudbursts and glacial lake outburst floods in the Himalaya (South Lhonak, Sikkim, October 2023).
Flood regions: Brahmaputra valley (Assam), Ganga plain (north Bihar's Kosi–Gandak belt, eastern Uttar Pradesh), north-west rivers (Punjab, Haryana), and deltas of the Mahanadi, Godavari and Krishna; Kerala's 2018 floods showed a high-rainfall hilly state is also exposed.
Management: structural (dams, embankments, channel improvement) and non-structural (flood plain zoning, forecasting by the Central Water Commission, flood insurance, early warning); the 2008 NDMA flood guidelines emphasise living with floods.
5. Droughts
Types: meteorological drought (IMD: seasonal rainfall deficiency of more than 25% over an area; moderate 26–50%, severe above 50%), hydrological drought (depletion of surface and groundwater), agricultural drought (soil moisture insufficient for crops), and socio-economic drought.
Drought-prone areas: about one-third of India's area is often cited as drought-prone; core areas: western Rajasthan and Kutch, the rain-shadow of the Western Ghats (Marathwada, Vidarbha interior, north Karnataka, Rayalaseema), Bundelkhand, parts of Telangana and Tamil Nadu.
Causes: monsoon failure or long breaks, delayed onset or early withdrawal, El Niño years, high rainfall variability, over-extraction of groundwater and degraded catchments.
Management: Drought Prone Areas Programme (1973), Desert Development Programme (1977–78), watershed development, the Manual for Drought Management (2016, revised 2020) which uses rainfall, vegetation index, soil moisture and crop sowing indicators for declaration; PMFBY crop insurance (2016); Atal Bhujal Yojana (2019) for groundwater.
6. Theory and Debates
Hazard vs disaster: Gilbert White's work on flood plain occupance (1945) argued that floods are 'acts of God' but flood losses are 'largely acts of man'; Ben Wisner, Piers Blaikie and others (At Risk, 1994) developed the pressure-and-release model linking disasters to vulnerability.
Embankment debate: embankments on the Kosi and in Assam protect in the short run but raise river beds and cause catastrophic breaches (Kosi breach at Kusaha, Nepal, 2008); scholars such as Dinesh Kumar Mishra argue for living with floods.
Climate change and extremes: a warming Arabian Sea and more intense rainfall events may raise cyclone and flood risks; attribution of individual events remains debated.
Drought and policy: some argue that drought in India is as much a water management failure (sugarcane in Marathwada, borewell irrigation) as a rainfall shortage.
Framework: Disaster Management Act (2005, amended 2025), NDMA, NDRF, National Disaster Management Plan (2016, revised 2019) aligned with the Sendai Framework (2015–2030).
7. Maps and Diagrams to Draw
Cyclone tracks map: show typical tracks from the Andaman Sea and central Bay curving to Odisha, Andhra and West Bengal, and Arabian Sea tracks to Gujarat and Oman; mark Phailin, Fani, Amphan and Biparjoy landfall points.
Cyclone cross-section: eye, eyewall, spiral rain bands, inflow at the surface and outflow at the top, with a storm surge dome at the coast.
Western disturbance path: arrows from the Mediterranean across Iran and Afghanistan into Jammu and Kashmir and Punjab with the westerly jet axis.
Flood and drought map: hatch flood-prone areas in the Ganga–Brahmaputra plains and coastal deltas; dot drought-prone areas in Rajasthan, the Deccan rain shadow and Bundelkhand.
8. Using It in the Exam
10 marks: conditions of cyclone formation with a cross-section, or a short note on western disturbances with a path map.
15 marks: flood or drought-prone regions with causes and a map; give one recent example with year.
20 marks: hazard–vulnerability–risk framework, structural and non-structural management, institutional framework (NDMA, Sendai), and case studies (Odisha model, Kosi).
Keywords: warm core, storm surge, wind shear, westerly jet, flood plain zoning, meteorological and agricultural drought, vulnerability.
Attributed idea: Gilbert White argued that flood losses result largely from human occupation of flood plains; present it in your own words.
| Feature | Tropical cyclone | Western disturbance |
|---|---|---|
| Origin | Warm tropical seas (Bay of Bengal, Arabian Sea) | Mediterranean, Caspian, Black Sea region |
| Core | Warm core, no fronts | Extra-tropical, often frontal |
| Season | April–June and October–December | Mainly December–March |
| Steering | Easterly flow, subtropical ridge | Subtropical westerly jet |
| Area affected | East and west coasts | North-west India and western Himalaya |
| Effects | Wind, storm surge, floods | Winter rain, snow, cold waves, hail; helps rabi crops |
Mains points
- Questions often ask why the east coast is more cyclone-prone, how western disturbances affect north India, or to discuss flood and drought management.
- Always give recent Indian examples with year and place (Biparjoy 2023, Montha 2025, Arnab 2026, Kerala floods 2018, Sikkim GLOF 2023).
- Use the hazard–vulnerability–risk framework and cite Gilbert White or the pressure-and-release model to add theory.
- Draw a cyclone cross-section or a flood/drought map; map-based answers score well.
- Discuss both structural and non-structural measures and the Odisha preparedness model; avoid only listing government schemes.
- Common mistake: confusing meteorological, hydrological and agricultural drought; define each with an indicator.
Did you know?
- The deadliest part of a cyclone is usually not the wind but the storm surge: the 1999 Odisha super cyclone pushed sea water several kilometres inland.
Climatic Regions of India
India's climate is broadly tropical monsoon, but altitude, latitude, distance from the sea and relief create sharp regional contrasts, from the humid Konkan coast to the hot Thar desert and the cold desert of Ladakh. Koppen's classification, applied to India in standard texts, recognises eight types (Amw, As, Aw, BShw, BWhw, Cwg, Dfc, E), while Trewartha, Thornthwaite (moisture index) and Stamp offer alternative schemes. Climatic regions underlie agro-climatic planning, disaster risk and climate change adaptation.
In simple words
Although we call India's climate 'monsoon', Kerala, Rajasthan and Ladakh feel completely different.
A climatic region is an area where temperature and rainfall follow a similar yearly pattern, like neighbours who share the same weather habits.
Geographers use letter codes (such as Aw or BWhw) to label these regions.
Knowing them helps decide which crops to grow and which hazards to prepare for, and UPSC asks you to classify India's climates and draw them on a map.
1. Concepts and Definitions
Climate: the long-term (conventionally 30-year) average and variability of weather elements; a climatic region is an area with broadly homogeneous climate.
Empirical vs genetic classification: empirical schemes use observed temperature and rainfall (Koppen, Thornthwaite); genetic schemes use causes such as air masses (e.g. Strahler's air-mass based classification).
Koppen (Wladimir Köppen, first scheme 1900, revised 1918 and 1936): based on vegetation limits expressed through temperature and precipitation; main groups A (tropical humid), B (dry), C (warm temperate), D (cold snow-forest) and E (polar/ice), with second and third letters for rainfall season (w dry winter, s dry summer, m monsoon) and temperature (h hot, g Ganges-type with hottest month before the solstice, c cool summer).
Thornthwaite (1931, revised 1948): uses precipitation effectiveness and later potential evapotranspiration (PE) to compute a moisture index; applied to India by D.B. Carter (1954) and later by Indian climatologists such as Subrahmanyam.
Trewartha (1954, revised 1968): modified Koppen with groups A, C, B and H (highland); used in several Indian textbooks.
Dudley Stamp: divided India into a tropical south and a temperate or continental north using the January isotherm of about 18°C (roughly along the Tropic of Cancer), then into sub-regions by rainfall.
Climatic controls in India: latitude (Tropic of Cancer divides the country), the Himalaya (barrier to cold Central Asian air), distribution of land and sea, altitude, monsoon winds, western disturbances, tropical cyclones and upper-air jets.
2. Koppen's Climatic Regions of India
Amw (monsoon with short dry season): west coast south of Goa (Konkan and Malabar), parts of the North-East; over 250–300 cm rain; tropical evergreen forests.
As (dry summer, wet winter): Coromandel coast of Tamil Nadu and adjoining Andhra Pradesh, where much rain comes from the north-east monsoon and post-monsoon cyclones.
Aw (tropical savanna): most of the Peninsular plateau south of the Tropic of Cancer; distinct dry winter; deciduous forests.
BShw (semi-arid steppe): north-western Gujarat, parts of western Rajasthan and Punjab–Haryana margins, and the rain-shadow interior of Karnataka and Andhra Pradesh; 25–50 cm or so of rain.
BWhw (hot desert): extreme western Rajasthan (Jaisalmer, Barmer); less than about 25 cm rain; very high diurnal and annual temperature range.
Cwg (monsoon type with dry winter): most of the Ganga plain, eastern Rajasthan, northern Madhya Pradesh and parts of the North-East; hottest month (May–June) occurs before the summer solstice and monsoon rain.
Dfc (cold humid winter with short summer): Arunachal Pradesh and adjoining high eastern Himalaya.
E (polar type): high mountains of Jammu and Kashmir, Ladakh, Himachal Pradesh and Uttarakhand; Ladakh is a cold desert with very low precipitation.
3. Seasons and Temperature Patterns
Cold weather season (December–February): isotherms run roughly east–west; Dras and Leh record extreme cold; the south stays warm because of maritime influence; western disturbances bring rain to the north-west.
Hot weather season (March–May): the heat belt shifts north; temperatures above 45°C in Rajasthan and Vidarbha; local winds such as the loo (north India), kalbaisakhi or nor'westers (West Bengal, Odisha, Assam), mango showers (Kerala and Karnataka coast) and cherry blossom showers (Karnataka coffee areas).
South-west monsoon (June–September): about 75% of annual rain; temperature falls after onset.
Retreating monsoon (October–November): clear skies and 'October heat' due to high temperature and humidity; north-east monsoon rain in Tamil Nadu; cyclones in the Bay of Bengal.
Continentality: the annual temperature range is small at Thiruvananthapuram and Mumbai but large at Delhi and Bikaner, showing maritime vs continental influence.
4. Heat Waves, Cold Waves and Climate Change
Heat wave (IMD criteria): declared when the maximum temperature reaches at least 40°C in the plains (37°C on the coast, 30°C in hills) and the departure from normal is 4.5–6.4°C; a severe heat wave above 6.4°C departure; also declared when the actual maximum is 45°C or more.
Trends: IMD and Ministry of Earth Sciences assessments (Assessment of Climate Change over the Indian Region, 2020) report that India's average temperature rose by about 0.7°C during 1901–2018, with more frequent heat waves and extreme rain events.
Recent extremes: intense heat waves in 2024 across north and central India; record peak electricity demand of about 256 GW on 25 April 2026 (Ministry of Power) during an early heat spell shows how climate stress affects energy.
Heat Action Plans: Ahmedabad's Heat Action Plan (2013) was the first in South Asia; NDMA guidelines encourage city and district plans.
Urban heat islands: cities such as Delhi, Ahmedabad and Hyderabad show higher night-time temperatures than their rural surroundings.
5. Theory and Debates
Strength and weakness of Koppen: simple, uses widely available data and matches vegetation zones; but it ignores the causes of climate, uses arbitrary boundaries, and fails to capture India's strong monsoon seasonality and orographic contrasts.
Thornthwaite's advantage: water balance and moisture index are more useful for agricultural planning in a monsoon country (e.g. identifying arid, semi-arid, dry sub-humid zones), which is why ICAR and CRIDA use moisture indices.
Boundary problem: all schemes draw lines where real change is gradual; Indian climatologists note that boundaries shift from year to year with monsoon variability.
Shifting zones: with warming, some studies suggest expansion of semi-arid conditions and a poleward/upward shift of climatic belts in the Himalaya; this is an evolving research area.
6. Maps and Diagrams to Draw
Koppen map of India: outline India; mark Amw along the west coast, As on the Coromandel coast, Aw over the Peninsula, BWhw in western Rajasthan, BShw around it and in the rain-shadow Deccan, Cwg over the Ganga plain, Dfc in Arunachal and E in the western Himalaya; add a key.
Climographs: draw temperature curves and rainfall bars for Thiruvananthapuram (Amw), Chennai (As), Delhi (Cwg), Jaisalmer (BWhw) and Leh (E) to show contrasts.
January and July isotherm sketch: January isotherms roughly parallel to latitudes; July isotherms bending with the heat low over north-west India.
Local winds map: mark the loo, nor'westers, mango showers and cherry blossom showers.
7. Using It in the Exam
10 marks: list Koppen types with areas and a map.
15 marks: compare Koppen with Trewartha or Thornthwaite; explain why moisture-based schemes suit India.
20 marks: climatic controls, regions, seasonal cycle, extremes (heat waves) and relevance for agro-climatic planning, with a map and two climographs.
Keywords: climatic controls, Koppen symbols (Amw, Aw, BWhw, Cwg), moisture index, potential evapotranspiration, continentality, heat wave criteria.
Attributed idea: Thornthwaite argued that climate should be classified by its effectiveness for plants, measured through evapotranspiration, not by temperature and rainfall alone.
Common mistake: writing 'Cw' without the 'g', or placing As on the west coast; As belongs to the Coromandel coast.
| Symbol | Climate type | Main areas | Typical station |
|---|---|---|---|
| Amw | Monsoon with short dry season | West coast south of Goa, parts of North-East | Thiruvananthapuram |
| As | Dry summer, winter rain | Coromandel coast | Chennai |
| Aw | Tropical savanna | Peninsular plateau south of Tropic | Hyderabad |
| BShw | Semi-arid steppe | Margins of Thar, Deccan rain-shadow | Bikaner fringe, Bellary |
| BWhw | Hot desert | Western Rajasthan | Jaisalmer |
| Cwg | Monsoon with dry winter, Ganges type | Ganga plain, northern MP | Delhi, Patna |
| Dfc | Cold humid winter, short summer | Arunachal Pradesh | Tawang |
| E | Polar/highland | Ladakh, high western Himalaya | Leh |
Mains points
- Typical questions: 'Classify the climatic regions of India (Koppen)', 'Compare Koppen and Thornthwaite for India', 'Heat waves in India'.
- Draw a Koppen map with symbols and a key; add two contrasting climographs for extra marks.
- Explain climatic controls first (latitude, Himalaya, land–sea, monsoon, altitude), then the regions.
- Critically evaluate schemes and explain why moisture-based classification suits agricultural planning in India.
- Add current context: IMD heat wave criteria, the 2020 MoES climate assessment, heat action plans and energy demand peaks.
- Avoid putting As on the west coast or Dfc in the western Himalaya; these are common errors.
Did you know?
- The 'g' in Cwg stands for 'Ganges type': the hottest month comes before the summer solstice because the monsoon clouds cool the land in late June.
Natural Vegetation and Soils of India
India's natural vegetation ranges from tropical evergreen forests of the Western Ghats and North-East to thorn scrub in Rajasthan and alpine meadows in the Himalaya; Champion and Seth (1968) grouped them into 16 type groups. The India State of Forest Report 2023 puts forest cover at 7,15,343 km² (21.76% of geographical area) and forest plus tree cover at 25.17%. Soils, classified by ICAR into eight major groups such as alluvial, black (regur), red and laterite, mirror climate, parent rock and vegetation, and nearly 30% of India's land faces degradation.
In simple words
Plants and soil are like a natural mirror of climate: wet places grow thick evergreen forests, dry places grow thorny bushes.
Soil forms slowly from broken rock, rotting leaves and water, and its colour tells its story: black soil from lava rock, red soil from iron in old rocks.
Forests protect water, wildlife and livelihoods, and good soil feeds us.
UPSC asks you to classify India's forests and soils, map them and explain degradation and conservation.
1. Concepts and Definitions
Natural vegetation: plant cover that has grown without direct human aid and adjusted to climate and soil; little truly 'virgin' vegetation remains in India except in remote hills.
Forest cover (FSI definition): all lands over 1 hectare with tree canopy density above 10%, irrespective of ownership and legal status; classified as very dense (70% and above), moderately dense (40–70%) and open forest (10–40%).
Recorded forest area: land recorded as forest in government records, which is different from actual forest cover.
Soil: the thin layer of unconsolidated material at the Earth's surface formed by weathering of rock and decomposition of organic matter; soil profile shows horizons O, A, B, C over bedrock.
Soil-forming factors (Dokuchaev, later formalised by Hans Jenny, 1941): climate, organisms, relief, parent material and time (the 'clorpt' equation).
Zonal, intrazonal and azonal soils: zonal soils reflect climate (laterite, red), intrazonal soils reflect local factors such as drainage or salts (saline, peaty), azonal soils are immature (alluvium, mountain soils).
2. Forest Types of India
Classification: H.G. Champion (1936) and H.G. Champion and S.K. Seth (A Revised Survey of the Forest Types of India, 1968) identified 16 type groups and about 200 forest types based on climate (temperature and rainfall) and dominant species.
Tropical wet evergreen: over 200 cm rain; Western Ghats, North-East, Andaman; tall, multi-layered; rosewood, ebony, mahogany, white cedar.
Tropical semi-evergreen: transition belts of the Western Ghats, Odisha hills and the North-East.
Tropical moist deciduous: 100–200 cm rain; teak, sal, shisham, sandalwood; eastern slopes of the Western Ghats, Chota Nagpur, Odisha, Shiwalik foothills; the most widespread commercially important type.
Tropical dry deciduous: 70–100 cm rain; teak, tendu, palash; large parts of the Peninsula and the Ganga plain (much cleared for farming).
Tropical thorn: less than 70 cm rain; acacia, khejri, babul, cacti; Rajasthan, Gujarat, rain-shadow Deccan.
Montane forests: subtropical pine (chir) at 1,000–2,000 m; wet temperate (oak, chestnut) and Himalayan moist temperate (deodar, blue pine, spruce, fir) at 1,500–3,000 m; sub-alpine and alpine (birch, rhododendron, junipers, meadows called bugyals and margs) above about 3,000 m; shola forests with grasslands in the Nilgiris and Anaimalai.
Littoral and swamp forests: mangroves of the Sundarbans (West Bengal), Bhitarkanika (Odisha), Godavari–Krishna deltas, Gulf of Kachchh and the Andaman and Nicobar Islands; mangrove cover 4,992 km² (ISFR 2023).
3. Current Forest Data (ISFR 2023, Forest Survey of India, released December 2024)
Forest cover 7,15,343 km² (21.76%) and tree cover 1,12,014 km² (3.41%); together 8,27,357 km² (25.17%) of geographical area; combined increase of 1,445 km² since ISFR 2021.
Largest forest and tree cover by area: Madhya Pradesh, followed by Arunachal Pradesh and Maharashtra; highest share of area under forest among states: Mizoram (over 80%), followed by other north-eastern states.
Total carbon stock in forests estimated at about 7,285 million tonnes (ISFR 2023); India's NDC target is an additional carbon sink of 2.5–3 billion tonnes CO₂ equivalent through forest and tree cover by 2030.
Concerns: decline of forest cover in some north-eastern states, forest fires (FSI fire alerts peak in March–April), invasive species such as Lantana, and diversion for mining and infrastructure.
National Forest Policy (1988) targets one-third of the geographical area under forest or tree cover (two-thirds in hills); Green India Mission (2014) and Nagar Van Yojana (2020) support afforestation.
4. Soils of India
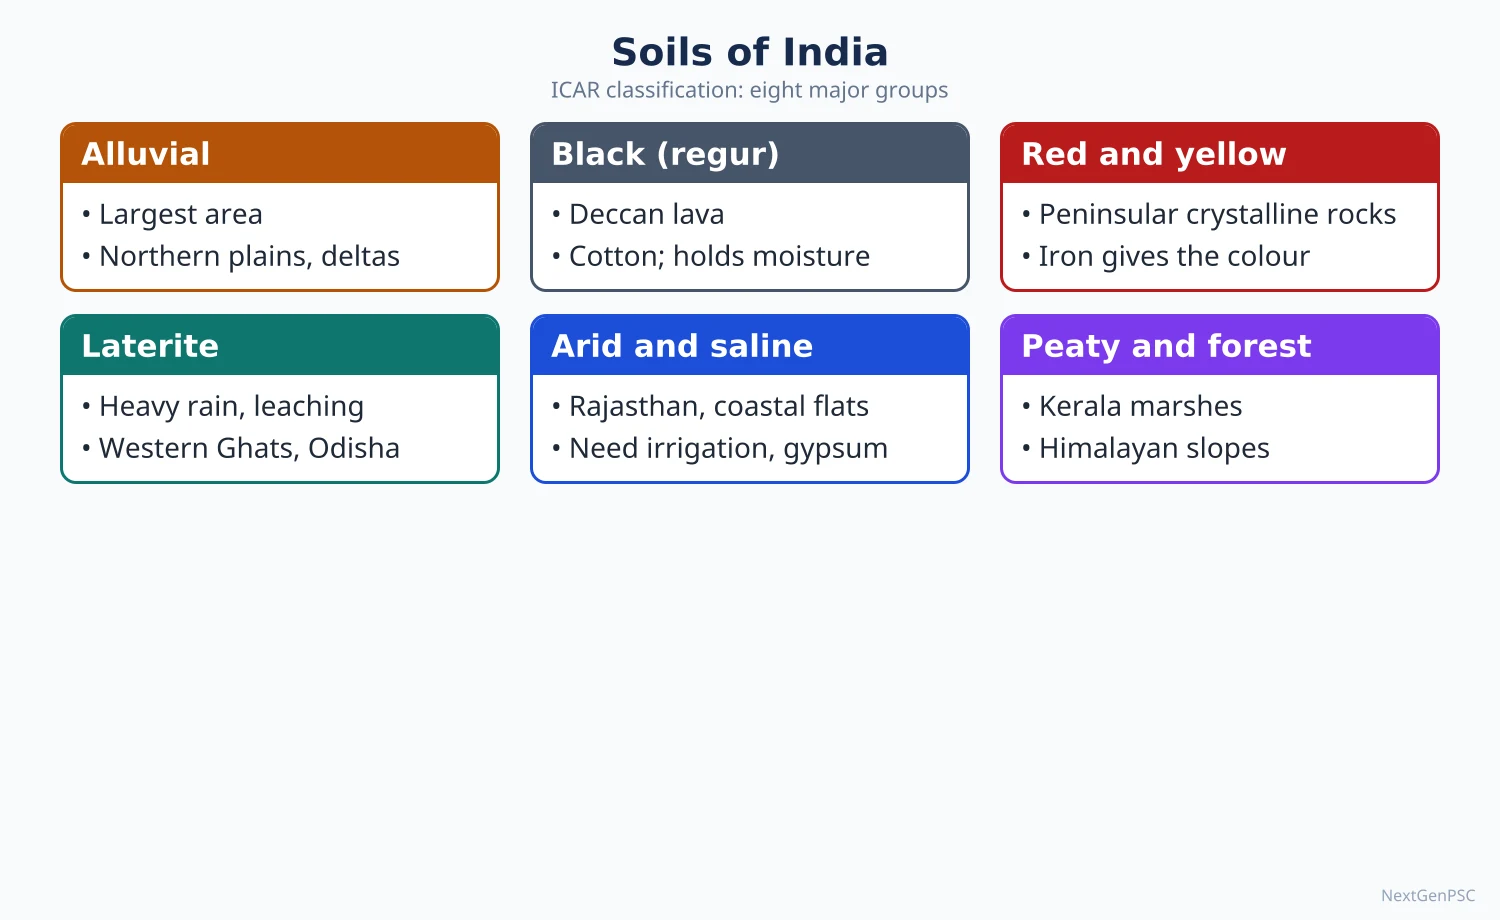
ICAR's eight groups: alluvial, black (regur), red and yellow, laterite, arid (desert), saline and alkaline, peaty and marshy (organic), and forest and mountain soils.
Alluvial soils: largest area (roughly two-fifths of India); Indo-Gangetic–Brahmaputra plains and deltas; khadar (new, fertile) and bhangar (old, with kankar); rich in potash, poor in nitrogen and phosphorus; support rice, wheat, sugarcane.
Black soils (regur): formed from Deccan basalt; Maharashtra, Malwa, Gujarat, parts of Karnataka and Telangana; high clay (montmorillonite), moisture-retentive, swell and crack (self-ploughing); rich in lime, iron, magnesia; ideal for cotton, soybean, jowar; correspond to Vertisols.
Red and yellow soils: on crystalline Archaean rocks of the eastern and southern Peninsula; red from ferric oxide, yellow when hydrated; poor in nitrogen and humus; millets, pulses, groundnut.
Laterite soils: from intense leaching in high temperature and heavy rain; Western Ghats, Eastern Ghats, Odisha, Meghalaya; rich in iron and aluminium, acidic; suitable for cashew, tea, coffee with fertilisers; also used as building bricks.
Arid soils: Rajasthan; sandy, saline, low humus; productive with irrigation (Indira Gandhi Canal). Saline and alkaline soils (usar, reh, kallar): canal-irrigated Punjab, Haryana, Uttar Pradesh, coastal Gujarat. Peaty soils: Kerala (Kuttanad), Sundarbans. Mountain soils: immature, acidic under conifers.
USDA soil taxonomy (NBSS&LUP mapping): Inceptisols and Entisols are the most extensive orders in India, followed by Alfisols and Vertisols, with smaller areas of Aridisols, Ultisols, Mollisols and others.
5. Soil Degradation and Conservation
Extent: the ISRO Space Applications Centre's Desertification and Land Degradation Atlas of India (2021) estimated 97.85 million hectares (about 29.7% of India's geographical area) under land degradation in 2018–19; water erosion is the leading process.
Problems: sheet and gully erosion (Chambal ravines), wind erosion (Thar), waterlogging and salinisation (Punjab–Haryana), nutrient mining and imbalanced fertiliser use, shifting cultivation (jhum) in the North-East, mining.
Measures: contour bunding, terracing, strip cropping, shelterbelts in Rajasthan, gypsum for alkaline soils (Central Soil Salinity Research Institute, Karnal), watershed development, Soil Health Card scheme (2015), and India's target to restore 26 million hectares of degraded land by 2030 (announced at UNCCD COP14, 2019).
6. Theory and Debates
Climax vegetation: F.E. Clements's monoclimax idea (1916) vs A.G. Tansley's polyclimax; in India, fire, grazing and shifting cultivation create 'biotic climaxes' such as savanna grasslands, so natural vegetation is partly a human product.
Forest cover vs forest quality: critics argue that FSI's canopy-based definition counts plantations, orchards and tea gardens as forest, overstating natural forest; FSI counters that it reports forest cover, not forest type; the issue is debated.
Community forestry: Chipko (1973), Joint Forest Management (1990) and the Forest Rights Act (2006) show debates between state control and community rights.
Soil classification debate: genetic (Russian, Dokuchaev) vs morphological (USDA) systems; Indian surveys use USDA taxonomy for scientific work but textbooks keep ICAR's descriptive groups.
7. Maps and Diagrams to Draw
Forest types map: shade tropical evergreen (Western Ghats, North-East, Andaman), moist deciduous (eastern Peninsula, foothills), dry deciduous (central India), thorn (Rajasthan, rain-shadow Deccan), montane (Himalaya, Nilgiris) and mangroves (deltas).
Altitudinal zonation sketch: a Himalayan slope from the foothills (tropical moist deciduous) through chir pine, oak, deodar, fir, birch–rhododendron to alpine meadows and snow.
Soil map: alluvial in the plains, black in the Deccan lava region, red over the eastern and southern Peninsula, laterite on the Ghats and Odisha, arid in Rajasthan, mountain soils in the Himalaya.
Soil profile diagram: horizons O, A, B, C and R labelled for a laterite profile showing leaching from A and iron accumulation in B.
8. Using It in the Exam
10 marks: forest types table or soil groups table with a small map.
15 marks: explain how rainfall and temperature control vegetation (Champion and Seth) with ISFR 2023 data.
20 marks: soils: formation, classification (ICAR and USDA), distribution, degradation (2021 atlas) and conservation, with a soil map and profile.
Keywords: forest cover, canopy density, type groups, laterisation, Vertisols, land degradation neutrality, soil health.
Attributed idea: Dokuchaev showed that soil is an independent natural body formed by the interaction of climate, organisms, relief, parent material and time.
| Soil | Formation | Main areas | Crops |
|---|---|---|---|
| Alluvial | River deposition | Indo-Gangetic–Brahmaputra plains, deltas | Rice, wheat, sugarcane |
| Black (regur) | Weathering of Deccan basalt | Maharashtra, Malwa, Gujarat, north Karnataka | Cotton, soybean, jowar |
| Red and yellow | Weathering of crystalline rocks | Tamil Nadu, Karnataka, Odisha, Chhattisgarh, Jharkhand | Millets, pulses, groundnut |
| Laterite | Leaching under heavy rain and heat | Western and Eastern Ghats, Odisha, Meghalaya | Cashew, tea, coffee |
| Arid | Desert weathering, aeolian sand | Rajasthan, Kutch | Bajra, guar; crops with irrigation |
| Saline and alkaline | Capillary rise of salts, poor drainage | Punjab, Haryana, UP, coastal Gujarat | Reclaimed with gypsum; salt-tolerant crops |
| Peaty and marshy | Waterlogged organic matter | Kuttanad (Kerala), Sundarbans | Rice |
| Mountain and forest | Immature, humus-rich | Himalaya, Western Ghats | Tea, fruits, temperate crops |
Mains points
- Questions ask to classify forests or soils, relate them to climate and parent rock, and discuss degradation and conservation.
- Use Champion and Seth (1968) for forests and ICAR groups plus USDA orders for soils; give ISFR 2023 figures with the year.
- Draw a forest types map or soil map; add an altitudinal zonation sketch for Himalayan vegetation.
- Discuss debates: canopy-based forest cover vs natural forest, biotic climax, community rights (FRA 2006).
- Link soils to crops and agricultural regions to integrate with the agriculture chapter.
- Common mistake: quoting old forest data (ISFR 2019 or 2021) or calling laterite soils fertile without fertilisers.
Did you know?
- Black soil is called 'self-ploughing' because it swells when wet and cracks deeply when dry, turning itself over naturally.
UPSC Previous Year Questions: India: Physical Setting II
From 2014 to 2026 UPSC asked 26 question parts worth 370 marks from this chapter in Paper II. Natural vegetation and soils (10 parts) and cyclones, western disturbances, floods and droughts (8 parts) lead, followed by the mechanism and variability of the monsoon (6 parts) and climatic regions (2 parts). Every question below has a model answer written to the UPSC word limit, with the map or diagram an examiner expects.
In simple words
Read the question and write your own answer first, keeping to the word limit (10 marks about 150 words, 15 marks about 200, 20 marks about 250).
Then compare it with the model answer: did you explain the mechanism, name real places and events with their year, quote IMD or ISFR data, and draw a map or diagram?
Note what you missed in one line and reread that part of the notes before trying the next question.
1. Mechanism of the Indian Monsoon and Rainfall Patterns
Example 1 (UPSC 2026, 20 marks): The relationship between El Niño and the Indian monsoon is becoming complex under the conditions of global warming. Critically examine.
Paper and question: Paper II, Q2(a)
Approach: Explain the classical El Niño–monsoon link, then examine critically how and why it has become complex (weakening correlation, El Niño flavours, IOD, Atlantic and warming of the Indian Ocean), with recent years as evidence, and conclude on forecasting. Draw a Walker circulation diagram.
El Niño is the periodic warming of the central and eastern equatorial Pacific, the ocean phase of the El Niño–Southern Oscillation (ENSO). It shifts the rising limb of the Walker circulation eastward, so air sinks over the Indian region and the monsoon weakens; historically most Indian droughts (1918, 1987, 2002, 2009, 2015) coincided with El Niño years.
Why the link is becoming complex: (i) Kumar, Rajagopalan and Cane (Science, 1999) showed that the inverse ENSO–monsoon correlation weakened after about 1980. The strong 1997 El Niño, for example, brought a normal monsoon.
(ii) Flavours of El Niño: central Pacific (Modoki) warming, as in 2002, tends to suppress Indian rainfall more than eastern Pacific warming (Kumar and others, 2006).
(iii) Indian Ocean Dipole: a positive IOD can offset El Niño (Ashok and others, 2001); in 2019 a strong positive IOD helped the monsoon reach 110% of the long period average (LPA), while in 2023 El Niño with a weak IOD gave 94% of LPA (IMD).
(iv) Global warming: the western Indian Ocean is warming faster than other tropical oceans, reducing the land–sea thermal contrast, while a warmer, moister atmosphere produces more extreme rain events. Roxy and others (2017) found a threefold rise in widespread extreme rain events over central India between 1950 and 2015, even as total rainfall in some regions declined.
Critical view: El Niño still raises drought risk, so the link has not vanished, but it is now one of several interacting drivers, and short records make trend claims uncertain.
Diagram: Two panels of the Pacific–Indian Ocean Walker circulation: normal (rising air over Indonesia and India) and El Niño (rising limb shifted to the central Pacific, sinking air over India), with a positive IOD inset.
IMD's coupled dynamical model (Monsoon Mission) and the use of multiple predictors, not ENSO alone, are therefore the way forward for forecasting.
Example 2 (UPSC 2024, 10 marks): How are geographic factors influencing the distribution of high annual rainfall in certain parts of India?
Paper and question: Paper II, Q5(a)
Approach: Identify the high-rainfall areas and explain each by the geographic factor responsible (orography, coastal alignment, monsoon branches, depressions). Draw an isohyet map of India.
Areas receiving over 2,000 mm a year form two belts: the windward Western Ghats with the west coast, and north-east India with the sub-Himalayan foothills (Sikkim, northern West Bengal). India's mean monsoon rainfall is only about 870 mm (IMD LPA, 1971–2020).
Orography: the Western Ghats lie at right angles to the moist Arabian Sea branch, forcing it to rise; Agumbe and Mahabaleshwar receive several thousand millimetres while the leeward Deccan lies in rain shadow.
Funnel-shaped relief: the Bay of Bengal branch is trapped by the Garo–Khasi hills, giving Mawsynram and Sohra over 11,000 mm a year.
Himalayan barrier: the monsoon trough and Bay depressions moving north-west release heavy rain on the foothills of Sikkim, Darjeeling and Arunachal Pradesh.
Coastal and seasonal factors: offshore vortices and troughs add rain on the Konkan–Malabar coast, while the Coromandel coast gets heavy rain from the north-east monsoon and cyclones in October–December.
Map: Isohyet map of India showing areas above 2,000 mm along the Western Ghats and in the north-east, with arrows for the Arabian Sea and Bay of Bengal branches.
Relief and wind direction, more than latitude, therefore decide where India's heaviest rain falls.
Example 3 (UPSC 2022, 20 marks): Critically examine the factors affecting the unpredictability of South-West Monsoon system in India.
Paper and question: Paper II, Q2(a)
Approach: Briefly state the normal monsoon mechanism, then critically examine the factors behind its unpredictability (global teleconnections, intraseasonal oscillations, regional land–ocean factors, climate change) and the limits of forecasting. Draw a diagram of the monsoon trough positions in active and break phases.
The south-west monsoon results from the seasonal northward shift of the Inter-Tropical Convergence Zone into the monsoon trough, aided by heating of the Tibetan plateau, the tropical easterly jet and cross-equatorial flow (the Somali jet). Although it brings about 75% of India's annual rain, its onset, intensity, breaks and withdrawal vary greatly from year to year.
Global teleconnections: El Niño tends to weaken it and La Niña to strengthen it, but the link has weakened since about 1980; the Indian Ocean Dipole can reinforce or offset ENSO, as in 2019 (110% of LPA).
Intraseasonal oscillations: the Madden–Julian Oscillation and the northward-moving boreal summer oscillation create active spells and breaks of one to three weeks. When the trough shifts to the Himalayan foothills, a 'break' brings drought to central India and floods to the north-east, as in August 2023.
Synoptic systems: the number and track of Bay of Bengal low-pressure systems decide rainfall over central India; IMD linked the weak monsoon of 2017 to fewer lows and more north-west Pacific typhoons. Cyclones in the Arabian Sea, such as Vayu (2019) and Biparjoy (2023), can delay onset or advance.
Climate change: a warming Indian Ocean and moister air have produced fewer moderate rain days and more extreme events (Roxy and others, 2017), along with a delayed withdrawal in several recent years.
Critical view: the monsoon is a chaotic coupled system, so forecasts beyond about two weeks remain probabilistic. Dynamical models (Monsoon Mission), better ocean observation and extended-range forecasts are improving skill.
Diagram: Map of India showing the normal monsoon trough from Ganganagar to the head of the Bay of Bengal (active phase) and its shift to the Himalayan foothills (break phase), with arrows for the Somali jet and the two branches.
Unpredictability is therefore built into the monsoon, and adaptation through water storage, crop insurance and contingency crop plans is as important as better forecasting.
Example 4 (UPSC 2020, 10 marks): Climate change has unsettled the rhythm of seasons. Comment with examples and empirical evidences.
Paper and question: Paper II, Q1(b)
Approach: Show with empirical evidence (temperature records, heatwaves, monsoon timing, winter changes) how the seasonal calendar has shifted, and the effects on farming and people. Draw a graph of India's annual mean temperature anomaly.
India's traditional rhythm of four seasons (cold, hot, south-west monsoon, retreating monsoon) is becoming irregular. The Ministry of Earth Sciences' climate assessment (2020) found that India's average temperature rose by about 0.7°C between 1901 and 2018, and IMD ranked 2024 as the warmest year since records began in 1901.
Evidence: (i) Shrinking spring and early heat: March 2022 was the warmest March on record, and February 2023 was the warmest February since 1901. (ii) Longer, harsher heatwaves: in 2024 many parts of north India experienced heatwaves that lasted for weeks. (iii) Monsoon timing: withdrawal has often been delayed into October (2019), August 2023 was the driest August on record, and rain arrives in fewer, more intense spells. (iv) Weaker winters: fewer cold days and erratic western disturbances reduce winter rain and Himalayan snowfall.
Effects: mistimed sowing, early flowering of mango and apple, heat stress on rabi crops, and longer vector-borne disease seasons.
Diagram: Line graph of India's annual mean temperature anomaly from 1901 to 2024 (IMD), showing the steep rise after 1980.
Heat action plans, climate-resilient crop calendars and better seasonal forecasts are needed as the seasons lose their rhythm.
Example 5 (UPSC 2019, 10 marks): Why is the Indian Monsoon erratic in nature? Explain.
Paper and question: Paper II, Q1(c)
Approach: Define what 'erratic' means for the monsoon (onset, amount, breaks, distribution, withdrawal) and explain the causes briefly. Draw a map of monsoon onset and variability.
The Indian monsoon is erratic because its onset (normally about 1 June over Kerala), total amount, breaks, spatial spread and withdrawal vary from year to year, giving floods in one region and drought in another.
Causes: (i) Shifting monsoon trough: its north–south oscillation produces active spells and breaks; (ii) Low-pressure systems: the number and track of Bay of Bengal depressions decide rain over central India; (iii) ENSO and the Indian Ocean Dipole: El Niño tends to weaken and a positive IOD to strengthen the monsoon; (iv) Intraseasonal oscillations such as the MJO; (v) Tibetan heating and Eurasian snow cover, which alter the strength of the tropical easterly jet; (vi) Relief, which creates heavy windward and scanty leeward rain.
Climate change is adding more extreme rain events and longer dry spells.
Map: Map of India showing isochrones of normal monsoon onset (1 June Kerala to 8 July Rajasthan) and shading for areas where rainfall variability exceeds 25%.
This erratic behaviour, affecting rain-fed agriculture on about half the net sown area, calls for water storage, drought-proofing and better forecasts.
Example 6 (UPSC 2017, 10 marks): Give a reasoned account of unusual pattern of distribution of monsoonal rainfall in India in 2017.
Paper and question: Paper II, Q1(b)
Approach: Give the national figure for 2017, describe the unusual regional and temporal pattern with examples, then explain the reasons. Draw a map of 2017 subdivision-wise rainfall departures.
The 2017 south-west monsoon gave 95% of the long period average for India as a whole (IMD), just inside the normal band, against a forecast of 98%. The national total hid a highly uneven distribution in space and time.
Unusual pattern: intense spells caused floods in Gujarat (Banaskantha, July), Assam and north Bihar (August) and Mumbai (29 August). At the same time parts of central and north-western India received deficient rain, and September brought only about 76% of normal rain for the country. Several subdivisions thus suffered both floods and dry spells within one season.
Reasons: (i) IMD attributed the late-season deficit to intraseasonal variations linked to strong typhoon activity in the north-west Pacific and to fewer monsoon low-pressure systems; (ii) a few slow-moving depressions and offshore troughs dumped very heavy rain locally; (iii) ENSO was neutral with no strong Indian Ocean Dipole support; (iv) a warmer atmosphere tends to concentrate rain into short, extreme bursts.
Map: Map of India's meteorological subdivisions shaded by 2017 rainfall departure, with flood events marked in Gujarat, Assam, Bihar and Mumbai.
2017 showed that a 'normal' national total can conceal regional distress, so district-level planning matters.
2. Tropical Cyclones, Western Disturbances, Floods and Droughts
Example 7 (UPSC 2023, 15 marks): Discuss the problems of floods and their management with special reference to Indo-Gangetic Plain.
Paper and question: Paper II, Q3(b)
Approach: Explain why the Indo-Gangetic plain floods (physical and human causes), describe the problems they create, then evaluate structural and non-structural management. Draw a map of flood-prone areas of the plain.
The Rashtriya Barh Ayog (1980) assessed about 40 million hectares of India as flood-prone, and the Indo-Gangetic plain, especially north Bihar, eastern Uttar Pradesh and northern West Bengal, is the worst affected.
Causes: concentrated monsoon rain; Himalayan rivers (Kosi, Gandak, Ghaghara, Bagmati) rising in Nepal with enormous silt loads; very gentle gradients and shifting channels; siltation of river beds; drainage congestion behind embankments, roads and railway lines; and encroachment on floodplains and wetlands.
Problems: loss of life, houses and crops every year, waterlogging and sand-casting of farmland, disease, disruption of transport, and recurring displacement of the poor; Bihar alone has about 73% of its area flood-prone (Bihar Water Resources Department). Embankment breaches, such as the Kosi at Kusaha in 2008, turn floods into disasters.
Management: structural measures include embankments, reservoirs (proposed high dams on the Kosi and Gandak in Nepal) and the Flood Management and Border Areas Programme. Non-structural measures include Central Water Commission forecasting, floodplain zoning, flood-proof raised platforms, insurance and NDMA guidelines (2008).
Evaluation: embankments give short-term protection but raise river beds and fail catastrophically; zoning laws are rarely enforced, and transboundary cooperation with Nepal is slow.
Map: Map of the Ganga plain shading the chronically flood-prone zones of north Bihar (Kosi, Gandak, Bagmati), eastern Uttar Pradesh (Rapti, Ghaghara) and Malda–Murshidabad, with the Kosi embankments.
An integrated basin approach that 'gives room to the river' and combines forecasting with community preparedness is the sustainable path.
Example 8 (UPSC 2022, 15 marks): Incidence of extreme rainfall events and flash floods in recent times have led to devastating consequences for people living in low-lying areas and flood plains of the country. Discuss.
Paper and question: Paper II, Q4(c)
Approach: Show the rising trend of extreme rain and flash floods with evidence, give recent named disasters, analyse why low-lying and floodplain dwellers suffer most, and suggest measures. Draw a map of recent extreme-rain events.
Extreme rainfall events (very heavy rain of 200 mm or more in a day, or intense cloudbursts) and the flash floods they trigger have become more frequent; Roxy and others (2017) found a threefold rise in widespread extreme rain events over central India between 1950 and 2015.
Recent examples: the Kerala floods of August 2018; Chennai (December 2015 and Cyclone Michaung, 2023); Himachal Pradesh (July–August 2023); the Wayanad landslides (30 July 2024); and the Sikkim GLOF (October 2023). Delhi's Yamuna reached a record 208.66 m in July 2023.
Why low-lying people suffer most: informal settlements on floodplains, river beds and drains (for example along the Yamuna and Mithi) are the first to be inundated; the poor have weak houses and little savings or insurance. Urban concrete reduces infiltration, encroached lakes lose their storage, and short warning times leave no chance of evacuation.
Consequences: deaths, destruction of homes and livelihoods, disease outbreaks, loss of crops and livestock, and long recovery that deepens poverty.
Measures: nowcasting and Doppler radar coverage, urban flood plans with sponge-city design, restoration of wetlands and drains, floodplain zoning, resilient housing, and inclusion of the poor in insurance and resettlement.
Map: Map of India marking Kerala 2018, Chennai 2015 and 2023, Himachal 2023, Wayanad 2024, Sikkim 2023 and Delhi 2023.
Adapting to more intense rain is now a core development task, not only a disaster-response issue.
Example 9 (UPSC 2021, 15 marks): Appraise why drought is one of the most common climatic extremes in India.
Paper and question: Paper II, Q2(b)
Approach: Define drought and its types, then appraise the climatic, physical and human reasons that make it so common in India, with data and examples, ending with management. Draw a map of drought-prone areas.
Drought is a prolonged deficiency of water relative to normal, classified as meteorological (rainfall deficit), hydrological (falling surface and groundwater) and agricultural (soil moisture too low for crops). NDMA's drought guidelines (2010) note that about 68% of India's cultivated area is vulnerable to drought.
Climatic reasons: about three-quarters of annual rain falls in four monsoon months, so a delayed onset, long break or early withdrawal causes shortage; high variability (over 25% in western Rajasthan and Gujarat); and El Niño years (2002, 2009, 2015) that cut rainfall nationally.
Physical reasons: rain-shadow areas east of the Western Ghats (Marathwada, Rayalaseema, north interior Karnataka); hard-rock aquifers of the Deccan with low storage; high temperatures and evaporation; and sandy soils in the Thar.
Human reasons: about half the net sown area is rain-fed; groundwater over-extraction in Punjab, Haryana and Rajasthan; water-intensive crops such as sugarcane in Marathwada; and degraded watersheds.
Management: the Manual for Drought Management (2016, updated 2020), watershed development, micro-irrigation, crop diversification, PM Fasal Bima Yojana and MGNREGS relief.
Map: Map of India shading chronically drought-prone areas: western Rajasthan, Kutch, Marathwada, Rayalaseema, interior Karnataka and Bundelkhand.
Drought is thus common because a variable monsoon meets vulnerable land and water use, so mitigation must address both.
Example 10 (UPSC 2021, 20 marks): Explain the impact of tropical cyclones and western disturbances on the climate of India.
Paper and question: Paper II, Q6(a)
Approach: Explain the origin and seasonality of tropical cyclones and western disturbances, then their separate impacts on India's temperature, rainfall, seasons and hazards, and their interaction. Draw a map of cyclone tracks and western disturbance paths.
India's climate is shaped not only by the monsoon but by two travelling weather systems: tropical cyclones from the Bay of Bengal and Arabian Sea, and western disturbances, extratropical low-pressure systems originating over the Mediterranean region and carried east by the subtropical westerly jet.
Tropical cyclones: they form over warm seas (above about 26–27°C) mainly in April–June and October–December, and the Bay of Bengal has historically produced several times more than the Arabian Sea. Impacts: very heavy rain that supplies much of the north-east monsoon rainfall of Tamil Nadu and coastal Andhra Pradesh; storm surges and winds causing disasters (Odisha super cyclone 1999, Phailin 2013, Fani 2019, Amphan 2020); and monsoon depressions that carry rain deep into central India. Arabian Sea cyclones are increasing, as with Tauktae (2021) and Biparjoy (2023), and they can delay monsoon onset.
Western disturbances: four to six affect north India each month in winter. Impacts: winter rain (mahawat) vital for rabi wheat in Punjab, Haryana and western Uttar Pradesh; snowfall that feeds Himalayan glaciers and rivers; and cold waves and dense fog after their passage. In spring and summer they cause hailstorms, thunderstorms and dust storms, as in May 2018.
Interaction: when a western disturbance meets monsoon moisture, catastrophic rain can result, as in Kedarnath in June 2013 and Himachal Pradesh in July 2023.
Map: Map of India showing typical Bay of Bengal and Arabian Sea cyclone tracks, the east-coast landfall zones, and the eastward path of western disturbances from Pakistan into Jammu and Kashmir, Punjab and the Ganga plain.
Together these systems add winter and post-monsoon rain, shape seasonal transitions and cause major hazards, so IMD's cyclone warnings, which cut deaths sharply after 1999, and better forecasting of western disturbances are both vital.
Example 11 (UPSC 2018, 10 marks): Explain the unusual intensity of dust storms and thunder storms across India in the pre-monsoon period of year 2018.
Paper and question: Paper II, Q1(b)
Approach: State the facts of the 2018 storms, then explain the meteorological and surface conditions that made them unusually intense. Draw a synoptic sketch of north-west India in May 2018.
Pre-monsoon dust storms and thunderstorms (aandhi in the north-west, kalbaisakhi in the east) are normal in April–May, but in 2018 they were unusually frequent and violent. The storm of 2–3 May killed over a hundred people in Rajasthan and Uttar Pradesh, Agra and Bharatpur being worst hit, and further storms followed in mid-May.
Reasons: (i) Intense heating: surface temperatures of 45°C and above over Rajasthan created strong instability and convection. (ii) Frequent western disturbances: an unusually high number of western disturbances moved across north India, providing upper-level lift. (iii) Moisture convergence: moist easterly winds from the Bay of Bengal met these systems over the Indo-Gangetic plain, and a cyclonic circulation over Haryana helped build tall cumulonimbus clouds. (iv) Dry, loose soil after a weak winter provided abundant dust for strong downdrafts to lift.
Diagram: Synoptic sketch of north-west India showing a western disturbance over Jammu and Kashmir, a cyclonic circulation over Haryana, hot dry westerlies over Rajasthan and moist easterlies from the Bay of Bengal converging over Uttar Pradesh.
Better nowcasting, public alerts and safer housing are needed as such extremes may intensify with warming.
Example 12 (UPSC 2016, 15 marks): Describe the flood-prone areas and their management problems in the Ganga Plains.
Paper and question: Paper II, Q2(b)
Approach: Identify and explain the flood-prone areas of the Ganga plain sub-region by sub-region, then analyse the problems of managing them. Draw a map of flood-prone areas.
The Ganga plains, with low gradients, heavy monsoon rain and silt-laden Himalayan tributaries, contain India's largest flood-prone tract.
Flood-prone areas: (i) North Bihar, the most severely affected, drained by the Kosi, Gandak, Bagmati, Kamla and Mahananda rising in Nepal, where about 73% of the state's area is flood-prone; (ii) eastern Uttar Pradesh along the Ghaghara, Rapti and Sharda (Gorakhpur, Bahraich, Ballia); (iii) the Yamuna floodplain in Delhi and western Uttar Pradesh, where the river reached a record 208.66 m in July 2023; (iv) West Bengal (Malda, Murshidabad), where the Ganga erodes its banks downstream of Farakka; (v) local tracts along the Son and Punpun in south Bihar.
Management problems: (i) embankments built since the 1950s confine silt, raising river beds and failing catastrophically, as on the Kosi at Kusaha in 2008; (ii) drainage congestion and waterlogging behind embankments, roads and canals; (iii) transboundary catchments in Nepal, with the proposed Kosi high dam still unbuilt; (iv) weak forecasting lead time for flashy rivers; (v) encroachment on floodplains and the non-enforcement of floodplain zoning; (vi) heavy, recurring maintenance costs and poor coordination between states and the Centre.
Map: Map of the Ganga plains shading flood-prone north Bihar, eastern Uttar Pradesh, the Delhi Yamuna floodplain and Malda–Murshidabad, with the Kosi and Gandak and the Farakka barrage.
Integrated basin management, cooperation with Nepal, wetland restoration and flood-resilient livelihoods offer a better path than embankments alone.
Example 13 (UPSC 2015, 10 marks): Explain the pattern of winter rainfall in India.
Paper and question: Paper II, Q1(c)
Approach: Describe the two sources of winter rain (western disturbances in the north-west and the north-east monsoon in the south-east), their areas, amounts and significance. Draw a map of winter rainfall.
In winter (December–February, with the post-monsoon months) most of India is dry under the north-east trade winds blowing from land, so winter rainfall is confined to two regions with different causes.
North-west India: western disturbances from the Mediterranean region, steered by the subtropical westerly jet, bring light to moderate rain to Punjab, Haryana, Delhi and western Uttar Pradesh, and heavy snowfall in Jammu and Kashmir, Himachal Pradesh and Uttarakhand. This rain is small in total but vital for rabi wheat and Himalayan snow-fed rivers.
South-east coast: from October to December, the retreating (north-east) monsoon picks up moisture over the Bay of Bengal and, aided by depressions and cyclones, gives heavy rain to coastal Tamil Nadu, south coastal Andhra Pradesh and Puducherry. Tamil Nadu receives nearly half its annual rain in this season, and Chennai records its rainiest months in October–November.
Map: Map of India showing winter rainfall: western disturbance paths and snowfall in the north-west, and north-east monsoon arrows with heavy rain on the Coromandel coast.
Winter rain is therefore small and patchy, yet crucial for rabi crops in the north and kharif–rabi cycles in Tamil Nadu.
Example 14 (UPSC 2015, 20 marks): Account for the growing frequency and intensity of floods in India, and suggest short- and long-term remedial measures indicating the chronically flood-prone areas.
Paper and question: Paper II, Q4(a)
Approach: Present evidence of rising flood frequency and intensity, account for it through climatic and human causes, map the chronically flood-prone areas, and then suggest short- and long-term remedies separately. Draw a map of chronically flood-prone areas.
Floods are India's most frequent disaster; the Rashtriya Barh Ayog (1980) estimated about 40 million hectares as flood-prone, and recent decades have seen more frequent and more damaging events, including urban floods.
Climatic causes: a warmer atmosphere holds more moisture, producing more extreme rainfall events (a threefold rise over central India between 1950 and 2015, Roxy and others, 2017); cloudbursts in the Himalaya; more intense cyclones; and glacial lake outburst floods (South Lhonak, 2023).
Human causes: deforestation and land-use change in catchments raise runoff and silt; siltation of river beds and reservoirs; encroachment on floodplains, lakes and drains (Chennai 2015, Mumbai 2005); unplanned urbanisation and concrete surfaces; embankments that raise river beds and breach (Kosi, 2008); and sudden dam releases without coordination, as alleged in the Kerala floods of 2018.
Chronically flood-prone areas: the Brahmaputra and Barak valleys of Assam; north Bihar, eastern Uttar Pradesh and northern West Bengal; the deltas of the Mahanadi, Godavari and Krishna; the Ghaggar plain of Punjab and Haryana; and increasingly coastal and urban Kerala, Chennai and Mumbai.
Short-term measures: better forecasting and warning (CWC, IMD nowcasts), timely evacuation and NDRF deployment, regulated reservoir releases, repair of embankments and drains before the monsoon, and relief and health camps.
Long-term measures: catchment afforestation and watershed treatment; floodplain zoning and protection of wetlands; storage reservoirs and detention basins; urban sponge-city design and drain restoration; cooperation with Nepal and Bhutan on transboundary rivers; and flood insurance and resilient housing.
Map: Map of India shading chronically flood-prone areas: Brahmaputra valley, north Bihar, eastern Uttar Pradesh, northern West Bengal, east-coast deltas, the Ghaggar plain and Kerala, with Chennai and Mumbai marked.
Floods cannot be eliminated, so the shift must be from flood control to flood management and living with floods.
3. Climatic Regions of India
Example 15 (UPSC 2016, 20 marks): Discuss the role of spatial pattern of rainfall and temperature in the delimitation of climatic regions of India especially with reference to Stamp's climatic regionalization.
Paper and question: Paper II, Q2(a)
Approach: Explain why rainfall and temperature are the key criteria for climatic regionalisation, describe Stamp's scheme (the 18°C January isotherm and rainfall-based sub-regions), compare briefly with Koppen and Trewartha, and evaluate. Draw a map of Stamp's climatic regions.
A climatic region is an area with broadly uniform climate; in India the spatial pattern of rainfall and temperature is the natural basis for drawing such regions because the monsoon creates sharp contrasts in both.
Role of rainfall: annual rainfall ranges from over 11,000 mm at Mawsynram to under 150 mm in western Rajasthan separates humid, sub-humid, semi-arid and arid regions. Isohyets of 2,000, 1,000 and 500 mm therefore form most regional boundaries.
Role of temperature: latitude, altitude and distance from the sea create contrasts between the equable tropical south and the continental north with cold winters.
Stamp's regionalisation: L. Dudley Stamp first divided India along the 18°C January isotherm, which runs roughly along the Tropic of Cancer, into Temperate or Continental India to the north (January mean below 18°C) and Tropical India to the south. He then subdivided each zone, chiefly by the amount of rainfall and secondarily by temperature, into eleven regions. These include the Himalayan region, the arid lowlands of Rajasthan and moderate-rainfall plains in the north, and heavy-rainfall north-eastern, Konkan and Malabar coastal, Tamil Nadu coastal and drier interior Deccan regions in the south. Textbooks name the sub-regions slightly differently.
Comparison: Koppen (adapted to India) uses quantitative thresholds of temperature and precipitation, while Stamp's scheme is simpler and descriptive.
Evaluation: Stamp's use of temperature for the first division and rainfall for subdivision reflects India's reality, since rainfall controls vegetation, soils and agriculture. However, the 18°C line is arbitrary, the boundaries are subjective, and the scheme ignores evapotranspiration, rainfall variability and seasonality, which Thornthwaite's moisture index handles better.
Map: Map of India showing the 18°C January isotherm dividing Continental and Tropical India, with the eleven sub-regions shaded on the basis of isohyets.
Stamp's scheme remains a useful teaching framework, but modern regionalisation combines rainfall, temperature and water balance.
Example 16 (UPSC 2014, 20 marks): Describe the salient climatological characteristics of Rayalaseema region.
Paper and question: Paper II, Q4(a)
Approach: Locate Rayalaseema and explain the controls of its climate, then describe its temperature, rainfall (both monsoons), variability, aridity and extremes, ending with implications. Draw a location map with isohyets.
Rayalaseema is the south-western interior region of Andhra Pradesh, covering the former districts of Kurnool, Anantapur, Kadapa and Chittoor (reorganised into more districts in 2022), on the Deccan plateau at roughly 300–600 m.
Climatic controls: it lies in the rain shadow of the Western Ghats for the south-west monsoon, while the Eastern Ghats ranges (Nallamala, Velikonda, Seshachalam) shield it partly from the north-east monsoon and Bay cyclones. Its interior location adds continentality.
Temperature: it is hot for most of the year. Summer (March–May) is intense, with maximum temperatures often above 40°C at Kurnool and Anantapur and hot, dry winds, while winters are mild and dry with large daily ranges.
Rainfall: it is among the driest parts of peninsular India, with annual rainfall of roughly 500–900 mm; Anantapur, at about 550 mm, is one of the driest districts in the country outside Rajasthan. Kurnool and Anantapur receive most rain from the south-west monsoon (June–September), whereas Chittoor and Kadapa receive a large share from the north-east monsoon and depressions in October–December. Rain falls on few days and in short, intense spells.
Variability and extremes: rainfall variability is high (often above 25%), making it one of India's most drought-prone regions. Semi-arid conditions (Koppen BSh) and high evaporation cause moisture deficits in most months. Yet occasional depressions bring floods, as in November 2021, when extreme rain caused the Annamayya dam on the Cheyyeru near Kadapa to breach.
Implications: low and erratic rainfall, shallow red soils and hard-rock aquifers have led to dependence on groundwater and tanks, groundnut monocropping in Anantapur, farmer distress and a risk of desertification.
Map: Location map of Andhra Pradesh showing Rayalaseema, the Western and Eastern Ghats, isohyets of 500, 750 and 1,000 mm, and arrows for the two monsoons.
Its climate demands drought-proofing through watershed management, micro-irrigation and Krishna–Penna water transfers such as the Handri–Neeva and Telugu Ganga projects.
4. Natural Vegetation and Soils of India
Example 17 (UPSC 2026, 10 marks): Explain the vertical zonation of vegetation of the Himalayas.
Paper and question: Paper II, Q1(c)
Approach: Explain why vegetation changes with altitude, then describe the zones from the foothills to the snowline with species, noting east–west and slope differences. Draw a vertical zonation diagram.
In the Himalaya temperature falls by about 6.5°C per 1,000 m, and rainfall, soils and exposure also change with height, so vegetation is arranged in altitudinal zones that mimic the latitudinal belts from the tropics to the poles.
Zones (approximate heights): (i) Tropical moist deciduous forests of sal in the foothills and Terai–Bhabar up to about 1,000 m; (ii) subtropical pine forests of chir between about 1,000 and 2,000 m; (iii) montane temperate forests from about 1,500 to 3,000 m, with broadleaf oak, laurel and chestnut on moist slopes and conifers such as deodar and blue pine; (iv) sub-alpine forests of fir, birch and rhododendron at about 3,000–3,600 m; (v) alpine scrub and meadows (bugyals in Uttarakhand, margs in Kashmir) up to about 4,800 m; (vi) mosses and lichens below the snowline.
Variations: zones lie higher in the wetter eastern Himalaya, which also has tropical evergreen forests, and south-facing slopes carry drier forest than north-facing ones.
Diagram: Mountain profile from the Terai to the snowline with labelled bands: sal, chir pine, oak–deodar, fir–birch, alpine meadows and snow.
This zonation sustains transhumance, timber and medicinal plants but is shifting upward with warming.
Example 18 (UPSC 2026, 10 marks): Describe the geographical conditions necessary for the growth of mangrove forests in India. Explain their ecological and economic significance.
Paper and question: Paper II, Q1(d)
Approach: List the geographical conditions for mangrove growth with Indian examples, then their ecological and economic significance, using ISFR data. Draw a map of mangrove areas.
Mangroves are salt-tolerant trees and shrubs of tropical intertidal coasts; India has about 4,992 km² (ISFR 2023), with the largest share in West Bengal's Sundarbans, followed by Gujarat and the Andaman and Nicobar Islands.
Conditions: warm temperatures (generally above 20°C); sheltered, low-energy coasts such as deltas, estuaries, lagoons and creeks; regular tidal flooding with brackish water; fine, silty, oxygen-poor mud; and a supply of fresh water and sediment from rivers. Hence the east-coast deltas (Sundarbans, Bhitarkanika in the Mahanadi–Brahmani delta, Godavari–Krishna, Pichavaram) are richer than the steep west coast, except for the Gulf of Kutch.
Ecological significance: they buffer storm surges and erosion (villages behind Bhitarkanika's mangroves suffered fewer deaths in the 1999 Odisha super cyclone), serve as fish and prawn nurseries, store large amounts of blue carbon, and shelter the Bengal tiger and saltwater crocodile.
Economic significance: fisheries, honey and wax (Sundarbans), fodder, ecotourism, and coastal protection that saves infrastructure; the MISHTI scheme (2023) promotes mangrove planting.
Map: Outline map of India marking the Sundarbans, Bhitarkanika, Godavari–Krishna, Pichavaram, Gulf of Kutch and the Andaman and Nicobar mangroves.
Their protection is thus both a climate adaptation and a livelihood strategy.
Example 19 (UPSC 2022, 10 marks): How do physiography and climate of India explain the biological diversity of the country?
Paper and question: Paper II, Q1(c)
Approach: State India's biodiversity status, then show how physiography (relief range, location, isolation) and climate (rainfall and temperature gradients) create varied habitats, with examples. Draw a map of biogeographic zones.
India, with 2.4% of the world's land, holds about 7–8% of recorded species and four of the 36 global biodiversity hotspots (Himalaya, Indo-Burma, Western Ghats–Sri Lanka and Sundaland in the Nicobars).
Physiography: (i) relief from sea level to 8,586 m (Kangchenjunga) packs tropical, temperate and alpine habitats into short distances; (ii) India lies at the meeting point of the Indo-Malayan, Palaearctic and Afrotropical realms, mixing their flora and fauna; (iii) isolated units such as the Western Ghats, the Andaman and Nicobar Islands and the Shola sky-islands foster endemism (for example the Nilgiri tahr and lion-tailed macaque); (iv) varied landforms, from deserts and deltas to coral islands, create distinct habitats.
Climate: rainfall ranges from under 150 mm in the Thar to over 11,000 mm in Meghalaya and temperatures from tropical to polar, producing evergreen, deciduous, thorn, montane, alpine and mangrove ecosystems.
Map: Map of India's ten biogeographic zones (Rodgers and Panwar), marking the four hotspots.
This diversity of physical settings is India's natural capital, demanding habitat-based conservation.
Example 20 (UPSC 2022, 15 marks): Soils of India, are clear reflections of the structure and process. Comment.
Paper and question: Paper II, Q3(c)
Approach: Explain soil formation as structure (parent rock, relief) plus process (climate-driven pedogenesis), take each major soil group as evidence, and comment on where climate overrides structure. Draw a soil map of India.
Soil is the product of parent material, relief, climate, organisms and time (Dokuchaev, Jenny). In India, structure (geology and relief) supplies the parent material, while process (weathering, leaching, laterisation, calcification, salinisation) shaped by climate gives each soil its character.
Structure-dominated soils: alluvial soils of the Indo-Gangetic plain and deltas derive from Himalayan and Peninsular sediments (khadar on new floodplains, bhangar on older terraces); black soils derive from Deccan Trap basalt; red soils derive from Archaean granite and gneiss; and mountain soils are thin and immature on steep Himalayan slopes.
Process-dominated soils: laterites form by intense leaching under high temperature and heavy, seasonal rain (Western Ghats, Meghalaya), removing silica and leaving iron and aluminium oxides; arid soils of Rajasthan show calcification and kankar; saline and alkaline soils (reh, kallar, usar) form by capillary rise and poor drainage in the Rann of Kutch and over-irrigated Punjab and Haryana; peaty soils form in waterlogged areas (kari soils of Kerala); and podzolisation occurs under Himalayan conifers.
Comment: structure and process interact. Black soils also occur on non-basaltic rocks in Tamil Nadu (regur on gneiss), and red soils on basalt in wetter areas, which shows that climate can override parent rock over time.
Map: Soil map of India showing alluvial, black, red and yellow, laterite, arid, saline, peaty and mountain soils.
Indian soils are thus a record of both their rocks and their climate, and soil management must respect both.
Example 21 (UPSC 2021, 10 marks): Discuss the economic significance of volcanic soils of India.
Paper and question: Paper II, Q1(c)
Approach: Identify India's volcanic soils as the black (regur) soils of the Deccan Trap, give their properties and distribution, then their economic significance for agriculture and allied activities. Draw a map of black soil areas.
India's volcanic soils are the black or regur soils formed by weathering of the Deccan Trap basalts. They cover roughly one-sixth of the country in Maharashtra, western Madhya Pradesh, Gujarat (Saurashtra), northern Karnataka and Telangana.
Properties: fine, clayey and rich in montmorillonite, they retain moisture for long periods, swell when wet and crack when dry ('self-ploughing'). They are rich in lime, iron, magnesium and potash but poor in nitrogen, phosphorus and organic matter.
Economic significance: (i) the core of India's cotton belt, with Gujarat and Maharashtra the leading producers, which historically gave rise to the Mumbai and Ahmedabad textile industry; (ii) soybean in Madhya Pradesh and Maharashtra, making the region India's oilseed bowl; (iii) rain-fed jowar, tur and gram, and wheat in Malwa; (iv) sugarcane, Nashik grapes and Nagpur oranges where irrigated, supporting sugar cooperatives and agro-processing.
Limitations: stickiness makes ploughing hard, and the soils are prone to waterlogging and salinity under heavy irrigation.
Map: Outline map of India shading the black soil region of the Deccan plateau and Malwa, with Nagpur, Nashik and Akola marked.
With balanced fertilisers and drip irrigation these soils remain central to dryland prosperity.
Example 22 (UPSC 2020, 15 marks): Soil types in India, classified on the basis of colour, possess specific chemical and mineral characteristics. Discuss.
Paper and question: Paper II, Q2(b)
Approach: Explain why colour reflects chemistry and mineralogy, then discuss each colour-based soil group (red, yellow, black, laterite, alluvial, desert, saline, peaty) with its chemical and mineral traits and areas. Draw a soil map of India.
Soil colour is a visible index of composition: iron oxides give red and yellow, humus and certain clays give black, and salts and lime give white or grey.
Red soils: derived from granite and gneiss of Tamil Nadu, Karnataka, Odisha and Chotanagpur, they owe their colour to ferric oxide (haematite) diffused through the soil. They are dominated by kaolinite, porous and acidic to neutral, and poor in nitrogen, phosphorus, lime and humus.
Yellow soils: red soils turn yellow where iron is hydrated (limonite, goethite) under higher rainfall, as in parts of Chhattisgarh and the Western Ghats foothills.
Black soils: developed on Deccan basalt, they get their colour from titaniferous magnetite and clay–humus complexes, not from high organic matter. They are rich in montmorillonite and in calcium, magnesium, potash and lime, but poor in nitrogen and phosphorus.
Laterite: intense leaching leaves reddish iron and aluminium sesquioxides; the soils are acidic, poor in bases and silica, and in places form bauxite.
Alluvial soils: light grey to brown, they are rich in potash and lime but poor in nitrogen and phosphorus. Desert soils: sandy and pale, they have high soluble salts and calcium carbonate (kankar) but little humus. Saline–alkaline soils: white crusts (reh) of sodium salts. Peaty soils: black, acidic and rich in organic matter (Kerala's kari soils).
Map: Soil map of India showing red, yellow, black, laterite, alluvial, desert, saline and peaty soils.
Colour is thus a quick field guide to fertility.
Example 23 (UPSC 2019, 15 marks): Discuss the rainfall pattern and correlate it with spatial distribution of natural vegetation in India.
Paper and question: Paper II, Q3(c)
Approach: Describe India's rainfall pattern with isohyets, then correlate each rainfall belt with its natural vegetation type (Champion and Seth), noting exceptions due to relief, soil and humans. Draw overlapping isohyet and vegetation maps.
Rainfall pattern: India's mean annual rainfall of about 1,100–1,200 mm is very unevenly spread. It exceeds 2,000 mm on the Western Ghats, the north-east and the sub-Himalaya, is 1,000–2,000 mm over the eastern plateau and middle Ganga plain, 500–1,000 mm over the Deccan interior and the upper Ganga plain, and below 500 mm in western Rajasthan, Kutch and Ladakh.
Correlation with vegetation (Champion and Seth): (i) above 2,000 mm: tropical wet evergreen forests of the Western Ghats, north-east and Andamans; (ii) 1,000–2,000 mm: moist deciduous forests of sal and teak in the north-east plateau, Shiwalik foothills and eastern Western Ghats slopes; (iii) 500–1,000 mm: dry deciduous forests and savanna-like woodland of teak, tendu and palash over the Deccan and Ganga plain, largely cleared for farming; (iv) below 500 mm: tropical thorn forests and scrub of babul, khejri and cacti in Rajasthan, Gujarat and the rain-shadow Deccan.
Exceptions: relief overrides rainfall in the Himalaya (montane zonation) and in the Nilgiri sholas; tidal swamps produce mangroves regardless of rainfall; and human clearing has replaced much deciduous forest with cropland.
Present status: forest cover is 21.76% of India's area and forest plus tree cover 25.17% (ISFR 2023), the densest forests coinciding with the highest rainfall in the north-east and Western Ghats.
Map: Map of India overlaying isohyets of 500, 1,000 and 2,000 mm on shaded evergreen, moist deciduous, dry deciduous, thorn, montane and mangrove vegetation.
Rainfall is thus the primary control of India's vegetation, modified by altitude, soil and land use.
Example 24 (UPSC 2016, 15 marks): Describe the distribution of black soils in India and their specific use for agriculture.
Paper and question: Paper II, Q4(c)
Approach: Describe the formation and distribution of black soils (core and peripheral areas), their properties, and then their specific agricultural uses and management needs. Draw a map of black soil distribution.
Black soils (regur, or black cotton soils) develop mainly from the weathering of Deccan Trap basalt under a semi-arid to sub-humid climate; their dark colour comes from titaniferous magnetite and clay–humus complexes.
Distribution: (i) the core area of the Deccan lava plateau: most of Maharashtra (Vidarbha, Marathwada, western Maharashtra), western Madhya Pradesh (Malwa) and Gujarat (Saurashtra); (ii) peripheral areas in northern Karnataka, western Telangana and the Krishna–Godavari uplands of Andhra Pradesh; (iii) non-volcanic outliers in Tamil Nadu (Coimbatore, Madurai, Tirunelveli) and Bundelkhand, formed on gneiss and old alluvium. Deep black soils occupy valleys, and shallow ones the uplands.
Properties: clayey and rich in montmorillonite, they hold moisture, swell and crack (self-ploughing), and are rich in lime, potash and magnesium but poor in nitrogen, phosphorus and humus.
Agricultural use: (i) cotton, hence the name black cotton soil, in Vidarbha, Gujarat and Malwa; (ii) soybean, India's leading oilseed in Madhya Pradesh and Maharashtra; (iii) rain-fed jowar, tur, gram and linseed, and wheat in Malwa using residual moisture; (iv) sugarcane, grapes, citrus and onions under irrigation.
Management: heavy texture makes ploughing difficult when wet or dry, and the soils are prone to waterlogging and salinity in canal commands, so they need balanced fertilisers, ridge-and-furrow sowing and drip irrigation.
Map: Map of India showing deep and shallow black soils of the Deccan, Malwa and Saurashtra, and outliers in Tamil Nadu and Bundelkhand.
Black soils thus sustain India's dryland commercial agriculture.
Example 25 (UPSC 2015, 10 marks): How does natural vegetation affect the formation of in situ soils?
Paper and question: Paper II, Q1(e)
Approach: Define in situ soils, then explain the ways vegetation shapes them (organic matter, nutrient cycling, acids and leaching, protection, organisms) with Indian examples of soil–vegetation pairs. Draw comparative soil profiles.
In situ (residual) soils form in place from the underlying rock, as on the Deccan and the Peninsular plateaus, and natural vegetation is one of the active soil-forming factors identified by Dokuchaev and Jenny.
How vegetation acts: (i) organic matter: leaf litter and dead roots are decomposed into humus, which darkens the topsoil and improves structure and water-holding; (ii) nutrient cycling: deep roots bring bases up from weathered rock and return them through litter; (iii) acids and leaching: acidic litter of conifers releases organic acids that leach iron and aluminium and cause podzolisation, as under Himalayan fir and pine; (iv) root weathering: roots widen cracks and release carbon dioxide, speeding chemical weathering of the parent rock; (v) protection: canopy and litter reduce erosion, allowing deep profiles to develop.
Indian examples: humus-rich brown forest soils under Himalayan oak, thin and poor soils under desert scrub, and laterites under tropical forest, where rapid decomposition leaves little humus.
Diagram: Side-by-side soil profiles under deciduous forest, coniferous forest (bleached E horizon) and desert scrub, showing differences in humus layer and horizons.
Clearing vegetation therefore degrades in situ soils quickly, making afforestation a soil-conservation measure.
Example 26 (UPSC 2014, 20 marks): Bring out the distribution of Laterite soils in India and their specific use for agriculture.
Paper and question: Paper II, Q2(a)
Approach: Explain the formation and properties of laterite, describe its distribution region by region, then its specific uses in agriculture (plantation and other crops) and the management it needs. Draw a map of laterite areas.
The term laterite was coined by Francis Buchanan (1807) in Malabar, from the Latin 'later' (brick), because the material hardens on exposure and was cut into building blocks.
Formation and properties: laterite forms by laterisation under high temperature and heavy, seasonal rainfall with alternating wet and dry periods. Intense leaching removes silica and bases, leaving iron and aluminium sesquioxides that give a red colour. The soils are acidic, porous and well drained, and poor in nitrogen, phosphorus, potash, lime and humus. The upland variety is thin, gravelly and hardens into a crust, while the lowland variety is deeper and more fertile.
Distribution: (i) the crest and slopes of the Western Ghats in Ratnagiri and Sindhudurg (Maharashtra), Goa, coastal Karnataka and Kerala; (ii) the Eastern Ghats uplands of Odisha and northern Andhra Pradesh; (iii) the Rajmahal hills, Chotanagpur pat lands and the Birbhum–Bankura uplands of West Bengal; (iv) the Meghalaya plateau and parts of Assam.
Agricultural use: naturally infertile, laterite becomes productive with manuring and is best suited to plantation and tree crops that tolerate acidity and need good drainage: cashew in the Konkan, Goa, Kerala and coastal Odisha; coffee in Kodagu and Chikkamagaluru; rubber, coconut, arecanut and black pepper in Kerala and coastal Karnataka; tea in the Nilgiris and Kerala hills; and mango (Ratnagiri Alphonso). In valleys and terraced lowlands, rice, ragi, tapioca and pulses are grown with fertilisers.
Constraints and management: acidity, phosphorus fixation by iron and aluminium, hardpan formation and erosion on slopes call for liming, organic manure, contour bunding and terracing, and permanent tree cover.
Map: Outline map of India marking laterite areas along the Western and Eastern Ghats, Rajmahal–Chotanagpur, Meghalaya and the West Bengal uplands, with cashew, coffee and rubber centres.
Laterite thus supports high-value plantation economies when managed as a tree-based system rather than for intensive field crops.
Mains points
- Monsoon questions increasingly ask about variability and climate change: link ENSO, the Indian Ocean Dipole, the MJO and warming oceans to named recent seasons (2017, 2019, 2023) with IMD figures as a percentage of the long period average.
- Hazard questions (floods, droughts, cyclones, flash floods, dust storms) reward the cause–impact–management structure, named events with dates (Kerala 2018, Wayanad 2024, Kosi 2008, Biparjoy 2023) and institutions such as NDMA, CWC and IMD.
- Soil questions expect the link between parent rock, climate and process (laterisation, calcification, leaching) and the agricultural use of each soil; a soil map of India is almost compulsory.
- Vegetation answers should follow Champion and Seth's forest types, correlate them with rainfall isohyets, and cite ISFR 2023 for forest and mangrove cover.
- Draw isohyet, cyclone-track, flood-prone-area, soil and vegetation maps; a well-labelled map often lifts a 15-mark answer by two or three marks.
Did you know?
- Mawsynram and Sohra (Cherrapunji) in Meghalaya, among the wettest places on Earth, lie only about 15 km apart; both owe their rain to the funnel-shaped Khasi hills that force moist Bay of Bengal winds to rise steeply.
Geography Optional: All chapters
- Exam Pattern, Syllabus and Strategy
- The Earth's Interior and Tectonics
- Geomorphic Processes and Landscape Development
- Climatology: Atmosphere and Circulation
- Climatology: Weather Systems, Climates and Climate Change
- Oceanography
- Biogeography
- Environmental Geography
- Perspectives in Human Geography
- Economic Geography
- Population Geography
- Settlement Geography
- Regional Planning
- Models, Theories and Laws in Human Geography
- India: Physical Setting I
- India: Physical Setting II
- Resources of India
- Agriculture in India
- Industry in India
- Transport, Communication and Trade
- Cultural Setting and Population of India
- Settlements in India
- Regional Development and Planning in India
- Political Aspects
- Contemporary Issues
- Places for the Map Question