
Geography Optional · UPSC Notes
Climatology: Weather Systems, Climates and Climate Change — UPSC Geography Optional Notes
Free, exam-focused notes for UPSC Prelims and Mains, with Prelims tips and Mains points for every topic. 5 topics.
Open in the interactive reader: bookmarks, progress tracking and read-aloud.
Tropical and Temperate Cyclones
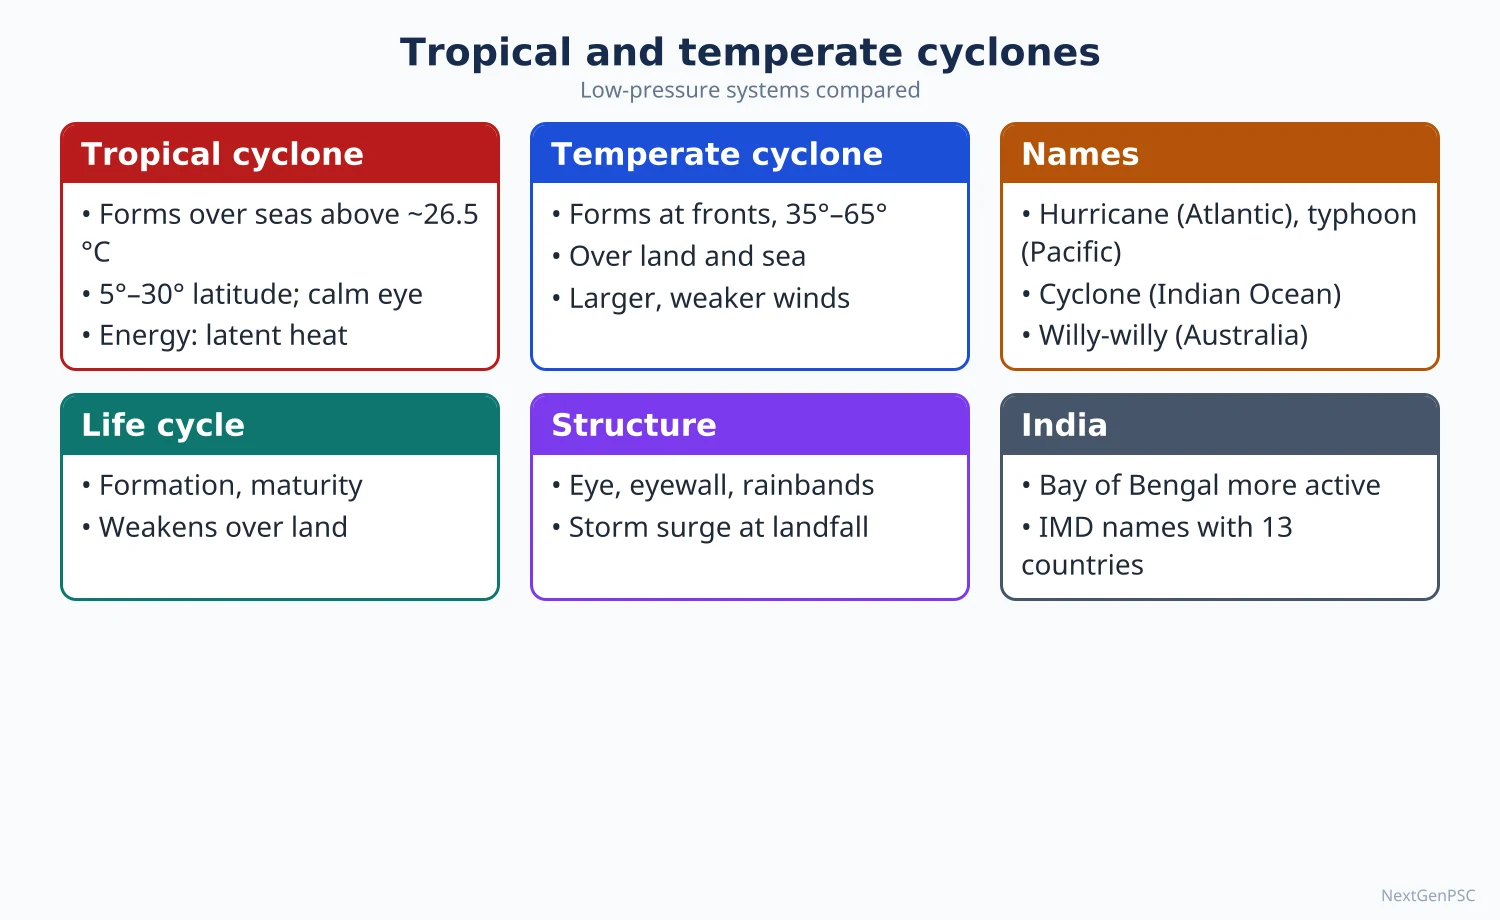
A cyclone is a low-pressure system with winds spiralling inward, anticlockwise in the northern hemisphere. Tropical cyclones draw energy from the latent heat of warm oceans, have a calm eye and cause storm surges; temperate (extra-tropical) cyclones form on the polar front from contrasting air masses, as explained by the Bergen school. India's coasts, especially the Bay of Bengal, are among the world's most cyclone-affected.
In simple words
A cyclone is a huge whirl of air around a centre of low pressure, like water swirling down a drain but hundreds of kilometres wide.
Tropical cyclones are fed by warm sea water and bring violent winds, heavy rain and sea surges; temperate cyclones form where cold and warm air meet and bring changeable weather.
They decide disaster risk on India's east coast and winter weather in Europe and North America.
UPSC asks how they form, how the two types differ and how India manages cyclone risk.
1. Tropical cyclones: conditions of formation
Warm sea surface: sea surface temperature of about 26.5–27°C or more, with warm water to a depth of about 50 m, to supply heat and moisture.
Coriolis force: needed to start rotation, so cyclones rarely form within about 5° of the equator.
Low vertical wind shear: small change of wind speed and direction with height, so the vertical heat engine is not torn apart; this is one reason cyclones are suppressed over the Arabian Sea and Bay during the peak monsoon months.
Pre-existing disturbance: a low-level low or easterly wave around which convergence begins.
Upper-level divergence: an outflow aloft that removes rising air and keeps surface pressure falling.
Moist mid-troposphere: humid air at middle levels so that rising air keeps condensing.
2. Mechanism, structure and life cycle
Energy source: warm moist air converges and rises; condensation releases latent heat, warming the core and lowering surface pressure, which draws in more air; the cyclone is a heat engine fed by the ocean.
Eye: a calm, nearly cloud-free centre about 10–50 km across where air sinks.
Eye wall: a ring of towering cumulonimbus around the eye with the strongest winds and heaviest rain.
Spiral rain bands: bands of cloud and rain curving into the centre.
Stages: formation (low and depression), intensification (cyclonic storm with eye), maturity (largest extent, lowest pressure) and decay on landfall or over cold water, when the supply of moisture is cut and friction increases.
Hazards: destructive winds, torrential rain and flooding, and the storm surge, a rise of sea level pushed onshore by wind and low pressure, which causes most deaths on low, shallow coasts such as the head of the Bay of Bengal.
Regional names: cyclones in the Indian Ocean, hurricanes in the Atlantic and north-east Pacific, typhoons in the north-west Pacific, and an older term willy-willies in Australia.
Intensity scales: the Saffir-Simpson scale (categories 1–5) for hurricanes; IMD's own scale for the north Indian Ocean.
3. Tropical cyclones in India
Bay of Bengal vs Arabian Sea: the Bay gets several times more cyclones than the Arabian Sea because of warmer water, remnants of Pacific typhoons crossing South-East Asia and a funnel-shaped, shallow coast; the Arabian Sea has seen more intense cyclones in recent decades, which many studies link to its warming (debated in degree).
Seasons: two peaks, pre-monsoon (April–May) and post-monsoon (October–December); the post-monsoon season is the more dangerous for the east coast.
Major events: the Odisha super cyclone (1999); Phailin (2013, Odisha), where large-scale evacuation kept deaths low; Hudhud (2014, Visakhapatnam); Fani (2019, Odisha); Amphan (2020, West Bengal), a super cyclonic storm over the Bay; Tauktae (2021) along the west coast; and Biparjoy (2023, Gujarat).
Naming: cyclones of the north Indian Ocean are named from a list of 169 names contributed by 13 member countries of the WMO/ESCAP Panel on Tropical Cyclones, adopted in 2020; names are used in order and not repeated.
Management: IMD early warnings, the National Cyclone Risk Mitigation Project, multipurpose cyclone shelters, coastal shelter belts and mangroves; Odisha's community-based approach after 1999 is often cited as a model.
4. Temperate (extra-tropical) cyclones
Definition: large low-pressure systems of the middle latitudes (about 35°–65°), often 1,000–2,000 km across, formed by the interaction of contrasting air masses.
Polar front theory: developed by the Bergen school (Vilhelm and Jacob Bjerknes, Halvor Solberg, Tor Bergeron) around 1918–1922.
Stage 1, stationary front: cold polar air and warm tropical air flow side by side in opposite directions along the polar front.
Stage 2, wave formation: a small disturbance causes warm air to bulge poleward into the cold air, forming a wave with a warm front ahead and a cold front behind.
Stage 3, mature or open wave: a well-developed warm sector lies between the two fronts; pressure falls at the tip of the wave and winds circulate anticlockwise (northern hemisphere).
Stage 4, occlusion: the faster cold front overtakes the warm front, lifting the warm sector off the ground.
Stage 5, dissipation: once the warm air is cut off from the surface, the energy supply ends and the cyclone fills.
Weather sequence: ahead of the warm front, high cirrus and then steady rain; in the warm sector, mild and humid weather; with the cold front, heavy showers, gusts and a sharp drop in temperature.
Steering: temperate cyclones move eastward with the westerlies and are steered by the polar front jet; upper-level divergence beneath the jet deepens them.
Indian link: western disturbances are extra-tropical systems from the Mediterranean region that reach north-west India in winter, bringing rain for rabi wheat and snow to the Himalaya.
5. Anticyclones
Definition: high-pressure systems with outward, clockwise winds in the northern hemisphere and sinking air; weather is calm and dry, with fog or frost in winter and heat waves in summer.
Blocking anticyclones: persistent highs that divert cyclones and cause long spells of drought or heat, as in Europe's summer heat waves.
6. Diagrams to draw
Tropical cyclone cross-section: draw a symmetrical section with a narrow clear eye in the centre with downward arrows, tall cumulonimbus eye walls on both sides with upward arrows, outflow arrows spreading at the top, and spiral rain bands on the flanks; mark sea surface and storm surge at the landward side.
Plan view of a tropical cyclone: concentric circular isobars with anticlockwise inflowing arrows and the eye at the centre.
Stages of a temperate cyclone: draw five small panels in a row: a straight front with opposing arrows; a gentle wave; an open wave with warm and cold front symbols and a shaded warm sector; an occluded front; a dying swirl.
India cyclone map: mark the Bay of Bengal and Arabian Sea, shade the most vulnerable coasts (Odisha, West Bengal, Andhra Pradesh, Tamil Nadu, Gujarat) and add labelled tracks of Phailin, Amphan and Biparjoy as arrows.
7. Using it in the exam
10-mark answer: conditions for a tropical cyclone with a cross-section.
15-mark answer: stages of a temperate cyclone according to the polar front theory with the five-panel sketch.
20-mark answer: compare tropical and temperate cyclones in a table, then discuss cyclone vulnerability of India's coasts and disaster management with examples.
Keywords: latent heat, warm core, eye wall, wind shear, storm surge, polar front, warm sector, occlusion, western disturbance.
Attribution: the polar front theory is credited to the Bergen school led by Vilhelm Bjerknes, with the cyclone model published by Jacob Bjerknes and Solberg around 1922.
| Feature | Tropical cyclone | Temperate cyclone |
|---|---|---|
| Latitude | About 5°–30° | About 35°–65° |
| Origin | Over warm oceans only | Over land and sea, along the polar front |
| Energy | Latent heat of condensation | Temperature contrast between air masses |
| Fronts | None | Warm and cold fronts |
| Size | Smaller, often a few hundred km | Larger, often 1,000–2,000 km |
| Isobars | Circular, closely spaced | Oval or V-shaped, widely spaced |
| Winds | Very strong, can exceed 200 km/h | Moderate |
| Movement | East to west in the trades, recurving poleward | West to east with the westerlies |
| Eye | Calm eye present | No eye |
| Life span | Usually about a week; dies on landfall | Up to two weeks or more |
| Category | Maximum sustained wind (km/h) | Knots |
|---|---|---|
| Depression | 31–49 | 17–27 |
| Deep depression | 50–61 | 28–33 |
| Cyclonic storm | 62–88 | 34–47 |
| Severe cyclonic storm | 89–117 | 48–63 |
| Very severe cyclonic storm | 118–166 | 64–89 |
| Extremely severe cyclonic storm | 167–221 | 90–119 |
| Super cyclonic storm | 222 and above | 120 and above |
Mains points
- A 'distinguish' question on the two types is best answered with a ten-row table plus one diagram of each.
- List all six conditions for tropical cyclone formation; many answers forget vertical wind shear and upper divergence.
- Explain the polar front theory stage by stage with the five-panel sketch and name the Bergen school.
- Use Indian examples with year (Odisha 1999, Phailin 2013, Amphan 2020, Biparjoy 2023) and IMD categories.
- Add the Bay of Bengal vs Arabian Sea contrast and the recent rise in intense Arabian Sea cyclones as a debated climate-change signal.
- Close with disaster management: early warning, shelters, mangroves and community preparedness.
Did you know?
- Before Phailin made landfall in October 2013, Odisha and Andhra Pradesh evacuated close to a million people, one of the largest such evacuations in India, and deaths were far lower than in 1999.
Precipitation and the Hydrological Cycle
Precipitation is water falling from clouds as rain, snow, sleet or hail after condensation and growth of droplets by the Bergeron-Findeisen (ice-crystal) or collision-coalescence process. By the cause of uplift it is convectional, orographic or cyclonic (frontal). Precipitation is one stage of the hydrological cycle, the continuous circulation of water between ocean, atmosphere and land driven by solar energy and gravity.
In simple words
Rain begins when moist air rises, cools and its water vapour turns into tiny droplets, like steam forming drops on a cold lid.
These droplets must grow a million times bigger before they fall, either by freezing onto ice crystals or by bumping and merging.
Air rises because of heating, mountains or fronts, which gives the three types of precipitation; the falling water then flows back to the sea, completing the hydrological cycle.
UPSC asks about types of rainfall, their distribution and the water cycle.
1. Humidity, condensation and clouds
Humidity: absolute humidity is the mass of water vapour per unit volume of air; relative humidity is the actual vapour as a percentage of what the air could hold at that temperature; specific humidity is the mass of vapour per unit mass of air.
Dew point: the temperature at which air becomes saturated on cooling; further cooling causes condensation.
Condensation nuclei: tiny particles of salt, dust and smoke (hygroscopic nuclei) on which vapour condenses; without them air can become supersaturated.
Forms of condensation: dew, frost, fog, mist and clouds; fog is a cloud at ground level, common in the Indo-Gangetic plain in winter.
Cloud types: high clouds (cirrus, cirrostratus, cirrocumulus), middle clouds (altostratus, altocumulus), low clouds (stratus, stratocumulus, nimbostratus) and vertically developed clouds (cumulus, cumulonimbus), following Luke Howard's naming (1803).
2. How raindrops grow
The problem: cloud droplets are about 0.01–0.02 mm across, while raindrops are about 1–2 mm; condensation alone is too slow to grow them.
Bergeron-Findeisen (ice-crystal) process: proposed by Tor Bergeron (1933) and developed by Walter Findeisen; in clouds colder than 0°C, ice crystals and supercooled droplets coexist; saturation vapour pressure over ice is lower than over water, so crystals grow at the expense of droplets, become heavy and fall, melting into rain at lower levels; important in mid-latitude and tall clouds.
Collision-coalescence (warm cloud) process: in warm clouds, larger droplets fall faster, collide with smaller ones and merge; Irving Langmuir studied it in the 1940s; it explains rain from warm tropical clouds, including much monsoon rain.
Cloud seeding: adding silver iodide or salt particles to promote these processes; results are uncertain and debated; India has tried it, for example the CAIPEEX experiments of IITM Pune in rain-shadow areas.
3. Forms of precipitation
Rain: liquid drops larger than about 0.5 mm; drizzle is finer.
Snow: ice crystals formed directly when temperatures are below freezing throughout.
Sleet: raindrops that freeze while falling through a cold surface layer (in British usage, a mix of rain and snow).
Hail: layered balls of ice formed by repeated up-and-down movement in strong cumulonimbus updrafts; damages rabi crops in north and central India during March–April storms.
4. Types of rainfall by cause of uplift
Convectional rainfall: intense surface heating makes air rise, cool and form cumulonimbus; heavy afternoon showers with thunder; daily in equatorial regions (Amazon, Congo) and in summer in continental interiors; pre-monsoon showers in Kerala are partly convectional.
Orographic (relief) rainfall: moist wind forced up a mountain cools and gives heavy rain on the windward slope; the leeward slope lies in a rain shadow as descending air warms.
Indian orographic examples: Mahabaleshwar on the Western Ghats receives very heavy rain while Pune, just to its east, is much drier; Mawsynram and Cherrapunji (Sohra) on the Meghalaya plateau get some of the world's highest rainfall because moist Bay of Bengal winds are funnelled into the Khasi hills; Shillong, in their lee, gets far less.
Cyclonic or frontal rainfall: warm air is lifted at fronts in temperate cyclones, or by convergence in tropical cyclones; gives prolonged rain over wide areas in mid-latitudes; western disturbances give frontal rain in north-west India.
Convergence rainfall: in the ITCZ, converging trade winds force air upward, giving daily rain at the equator.
5. World distribution of precipitation
Equatorial belt (about 10° N to 10° S): heavy rain all year, often over 200 cm, from convection and convergence.
Trade wind belt: eastern coasts of continents get rain from onshore trades; western sides between about 20° and 30° are deserts (Sahara, Atacama, Kalahari, Australian, Thar), helped by subtropical highs and cold ocean currents.
Monsoon lands: heavy summer rain and dry winters.
Westerly belt (about 40°–60°): western coasts get rain all year (British Columbia, north-west Europe, southern Chile); rain decreases inland.
Mediterranean regions (about 30°–40°, western sides): winter rain from westerlies, dry summers.
Polar regions: very low precipitation, mostly snow, so they are cold deserts.
Rules of thumb: precipitation falls from equator to poles, is higher on coasts than in interiors, higher on windward than leeward slopes, and higher over oceans than land.
Variability: the lower the mean rainfall, the higher its variability; in India, west Rajasthan has the highest variability and the west coast and the north-east have among the lowest.
6. The hydrological cycle
Definition: the continuous circulation of water through evaporation, transpiration, condensation, precipitation, infiltration, percolation, runoff and storage, powered by solar energy and gravity.
Distribution of water: about 97 per cent of the earth's water is in the oceans; of the remaining fresh water, roughly two-thirds is in ice caps and glaciers and most of the rest is groundwater; rivers, lakes and the atmosphere hold only a tiny share (figures follow USGS-style estimates, which vary slightly by source).
Fluxes: more water evaporates from the oceans than falls on them; the surplus is carried over land as vapour, falls as precipitation and returns as river runoff and groundwater flow, so the cycle is balanced globally.
Residence time: water stays in the atmosphere for only about 9–10 days on average, but for thousands of years in the deep ocean and in ice sheets, and longer still in deep aquifers.
Water balance (Thornthwaite): precipitation equals evapotranspiration plus runoff plus change in storage; Thornthwaite's water-balance method underlies his 1948 climate classification and is used in irrigation planning.
Human impact: dams, irrigation, groundwater pumping, urban paving and deforestation change runoff and infiltration; in India, falling water tables in Punjab, Haryana and Rajasthan show groundwater withdrawal exceeding recharge (Central Ground Water Board assessments).
Climate change: a warmer atmosphere holds about 7 per cent more water vapour per 1°C (Clausius-Clapeyron relation), intensifying heavy rainfall and droughts.
7. Diagrams to draw
Three rainfall types: draw three panels: (a) heated ground with a rising arrow and a cumulonimbus; (b) a mountain with wind rising on the windward side, clouds and rain, and a dry descending arrow labelled rain shadow on the lee; (c) a wedge of cold air with warm air rising over it along a front and nimbostratus clouds.
Hydrological cycle: draw ocean on the left, land and mountains on the right; arrows for evaporation from the sea, transpiration from trees, condensation into clouds, advection of clouds over land, precipitation, surface runoff in a river back to the sea, infiltration and groundwater flow.
Western Ghats profile: draw an east-west section from the Arabian Sea over the Ghats to the Deccan, with rainfall bars showing very high values at Mahabaleshwar and low values at Pune.
8. Using it in the exam
10-mark answer: Bergeron-Findeisen and collision-coalescence theories compared, one line each with a sketch.
15-mark answer: types of rainfall with the three-panel diagram and Indian examples.
20-mark answer: hydrological cycle: components, global water distribution, human interference and climate change effects, with the cycle diagram and Indian groundwater example.
Keywords: dew point, condensation nuclei, supercooled droplets, ice-crystal process, coalescence, orographic, rain shadow, residence time, water balance.
Attribution: Bergeron (1933) and Findeisen for the ice-crystal theory; Thornthwaite for the water-balance concept; Luke Howard for cloud names.
| Type | Cause of uplift | Character | Examples |
|---|---|---|---|
| Convectional | Surface heating | Heavy, short afternoon showers with thunder | Equatorial Amazon and Congo; pre-monsoon showers in Kerala |
| Orographic | Forced ascent over mountains | Heavy on windward side, rain shadow on lee | Western Ghats (Mahabaleshwar vs Pune); Khasi hills (Mawsynram vs Shillong) |
| Cyclonic or frontal | Lifting at fronts or convergence in cyclones | Prolonged, widespread | North-west Europe; western disturbance rain in Punjab |
| Convergence | Converging trade winds in the ITCZ | Daily, heavy | Equatorial belt |
Mains points
- Explain why condensation alone does not make rain, then give both raindrop-growth theories with their regions of relevance.
- For types of rainfall, a three-panel diagram with Indian examples (Western Ghats, Meghalaya, western disturbances) scores better than world examples alone.
- Discuss world distribution as a pattern with reasons (latitude, winds, currents, relief), not as a list of figures.
- In hydrological cycle answers, include human interference and climate change; examiners expect an applied angle.
- Do not quote exact water-distribution percentages beyond the ones you are sure of; give approximate shares and the source.
- Link to Indian issues: groundwater depletion, urban flooding, rain-shadow drought.
Did you know?
- A single drop of water spends on average only about nine days in the atmosphere, so the whole atmospheric store of water is replaced roughly forty times a year.
Classification of World Climates (Koppen, Thornthwaite, Trewartha)
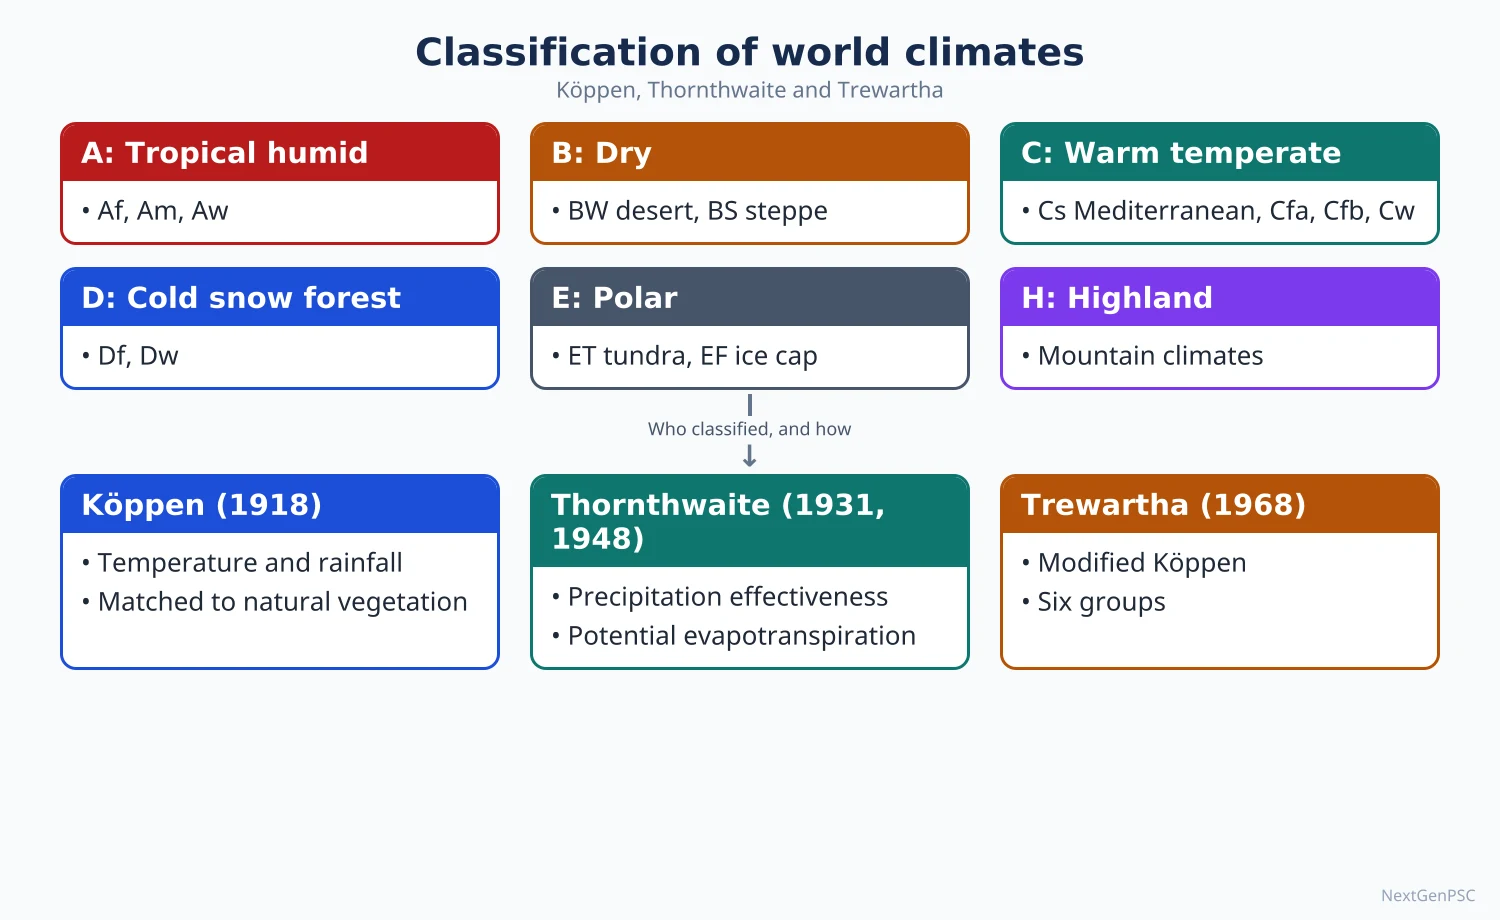
Climate is the long-term average and variability of weather, usually over 30 years. Wladimir Koppen classified climates empirically using temperature and precipitation thresholds linked to vegetation; C.W. Thornthwaite based his 1931 scheme on precipitation effectiveness and his 1948 scheme on potential evapotranspiration and moisture index; Glenn Trewartha modified Koppen to fit the length of the growing season. Each is used to describe and map world and Indian climates.
In simple words
Weather is today's mood of the atmosphere; climate is its long-term personality, averaged over about 30 years.
Classifying climates is like sorting books in a library: geographers use rules based on temperature and rainfall so that similar places fall on the same shelf.
Koppen's letters such as Af or BWh let you describe a whole region in two or three characters, and they match vegetation well.
UPSC asks you to explain, compare and criticise these schemes and to apply them to India.
1. Weather, climate and approaches to classification
Weather: the state of the atmosphere at a place over a short period (hours to days); climate: the long-term pattern, conventionally the 30-year normal used by the WMO.
Empirical classification: based on observed elements such as temperature and precipitation and their effects (Koppen, Thornthwaite, Trewartha).
Genetic classification: based on causes such as air masses and circulation (for example Arthur Strahler's air-mass based scheme and Flohn's scheme based on wind belts).
Applied classification: designed for a purpose such as agriculture or human comfort.
2. Koppen's classification
Author and dates: Wladimir Koppen, a German climatologist trained in botany, published a vegetation-based scheme in 1900 and revised it in 1918 and 1936; Rudolf Geiger later refined it, hence the name Koppen-Geiger.
Basis: mean monthly temperature and precipitation thresholds chosen to match natural vegetation boundaries (for example, the 18°C coolest-month limit of tropical plants and the 10°C warmest-month limit of trees).
A, tropical humid: every month 18°C or warmer; Af (no dry season, rainforest), Am (monsoon, short dry season), Aw (dry winter, savanna), As (dry summer, rare).
B, dry: potential evaporation exceeds precipitation; BW (desert) and BS (steppe), with h for hot and k for cold; the dryness threshold depends on temperature and rainfall season.
C, warm temperate (mesothermal): coldest month between 18°C and −3°C (0°C in some later versions); Cs (dry summer, Mediterranean), Cw (dry winter), Cf (no dry season).
D, cold (microthermal): coldest month below −3°C and warmest above 10°C; Df, Dw, Ds; found only in the northern hemisphere because southern continents are narrow at these latitudes.
E, polar: warmest month below 10°C; ET (tundra, 0°–10°C) and EF (ice cap, below 0°C); H for highland climates was added by later workers.
Third letters: a (hot summer, warmest month 22°C or more), b (warm summer), c (cool summer), d (very cold winter); g in Indian usage marks the Ganges type with the hottest month before the summer solstice.
Merits: simple, quantitative, uses widely available data, matches vegetation and is easily mapped; still the most widely used scheme.
Criticism: boundaries are arbitrary and based on vegetation rather than climatic causes; ignores evapotranspiration, winds, cloud and air masses; mixes climatically different regions (for example the British Isles and parts of south China share C); Thornthwaite called it insufficiently rational.
3. Thornthwaite's 1931 classification
Author: C.W. Thornthwaite, an American climatologist, published 'The climates of North America according to a new classification' (1931) and extended it to the world in 1933.
Precipitation effectiveness (P-E) index: the sum of monthly P-E ratios (precipitation divided by evaporation), estimated from temperature and precipitation.
Humidity provinces: A wet (rainforest, index 128 and above), B humid (forest, 64–127), C subhumid (grassland, 32–63), D semiarid (steppe, 16–31), E arid (desert, below 16).
Thermal efficiency (T-E) index: gives provinces A' tropical, B' mesothermal, C' microthermal, D' taiga, E' tundra and F' frost.
Seasonal distribution: r (adequate in all seasons), s (deficient in summer), w (deficient in winter), d (deficient in all seasons); combinations gave 32 climatic types.
Criticism: data for evaporation were scarce, the formulas were empirical, and the scheme was too complex for general use; it still used vegetation as a guide.
4. Thornthwaite's 1948 classification
Paper: 'An approach toward a rational classification of climate' (Geographical Review, 1948).
Potential evapotranspiration (PE): the water that would be lost by evaporation and transpiration from a vegetated surface if water were always available, computed from mean temperature and day length; Thornthwaite treated PE as the true measure of water need and heat.
Water balance: comparing monthly precipitation with PE gives water surplus (s) and deficit (d).
Moisture index (1948): Im = (100 s − 60 d) divided by PE, with surplus and deficit weighted differently; later revisions (Thornthwaite and Mather, 1955) changed the weighting.
Moisture regions: A perhumid, B4–B1 humid, C2 moist subhumid, C1 dry subhumid, D semiarid, E arid.
Thermal efficiency: PE itself is used as the index of heat, giving megathermal (A'), mesothermal (B'), microthermal (C'), tundra (D') and frost (E') regions.
Merits: rational and physically based, independent of vegetation boundaries, useful for agriculture, irrigation and water-resource planning.
Criticism: PE formula relies on temperature and may misjudge evaporation in windy dry areas; boundaries do not always match vegetation; calculation is laborious; climatic regions do not appear on a world map as neatly as Koppen's.
Indian application: V.P. Subrahmanyam and colleagues applied the 1948 method to India, dividing it into perhumid, humid, subhumid, semiarid and arid regions, from the west coast and north-east to west Rajasthan.
5. Trewartha's modification
Author: Glenn T. Trewartha, an American geographer, modified Koppen in An Introduction to Climate (1954 and later editions; revised with L.H. Horn, 1980).
Key change: redefined the middle-latitude groups by the number of months with mean temperature at or above 10°C, a better proxy for the growing season.
Groups (1980 version): A tropical humid (all months 18°C or more), B dry, C subtropical (8–12 months at or above 10°C), D temperate (4–7 months), E boreal (1–3 months), F polar (no month at or above 10°C), H highland.
Sub-types: Ar (tropical wet) and Aw (wet-dry); Cs and Cf; Do (oceanic) and Dc (continental); Ft (tundra) and Fi (ice cap).
Merits: corrects Koppen's grouping of very different mid-latitude climates in C, separates subtropical from temperate climates, and matches agricultural seasons better.
Criticism: still empirical, still uses threshold values, and remains less widely used than Koppen.
6. Climates of India under Koppen
Amw: monsoon type with short dry season on the west coast south of Goa.
As: tropical with dry summer on the Coromandel coast of Tamil Nadu, which gets winter rain.
Aw: tropical savanna over most of the peninsular plateau south of the Tropic of Cancer.
BShw: semi-arid steppe in parts of Rajasthan, Gujarat, Haryana and the rain-shadow Deccan.
BWhw: hot desert in most of western Rajasthan.
Cwg: monsoon type with dry winter over the Ganga plain, eastern Rajasthan, northern Madhya Pradesh and much of the north-east.
Dfc and E: cold humid winter type in Arunachal Pradesh, and polar-highland types in the higher Himalaya of Ladakh, Jammu and Kashmir, Himachal Pradesh and Uttarakhand (classes as given in NCERT, India: Physical Environment).
7. Diagrams to draw
Hypothetical continent: draw an idealised continent shaped like a pear, wide in the north and narrow in the south; shade Af along the equator, Aw and BS bands around it, BW on the western side near 20°–30°, Cs on the western side at 30°–40°, Cf on the eastern side, Cfb on the western side at 40°–60°, Df in the northern interior, ET and EF near the pole.
India Koppen map: outline India and mark Amw on the west coast, As on the Tamil Nadu coast, Aw over the plateau, BWhw in west Rajasthan with BShw around it, Cwg over the Ganga plain and north-east, Dfc in Arunachal and E in the high Himalaya.
Water-balance graph (Thornthwaite): plot monthly precipitation and PE for a monsoon station; shade surplus where precipitation exceeds PE in the monsoon months and deficit in the dry months.
8. Using it in the exam
10-mark answer: basis of Koppen's classification with the five groups and one criticism.
15-mark answer: Thornthwaite's 1948 scheme: PE, water balance, moisture index and its advantages over Koppen.
20-mark answer: compare Koppen, Thornthwaite and Trewartha in a table, then apply Koppen to India with a map.
Keywords: empirical, genetic, threshold, vegetation boundary, precipitation effectiveness, potential evapotranspiration, moisture index, growing season, Cwg.
Attribution: Koppen (1900, revised 1918 and 1936), Thornthwaite (1931 and 1948), Trewartha (1954; Trewartha and Horn, 1980).
| Feature | Koppen | Thornthwaite (1948) | Trewartha |
|---|---|---|---|
| Basis | Monthly temperature and precipitation thresholds matched to vegetation | Potential evapotranspiration and water balance | Koppen modified by number of months at or above 10°C |
| Main groups | A, B, C, D, E (H added later) | Moisture regions A–E and thermal regions A'–E' | A, B, C, D, E, F, H |
| Nature | Empirical | Rational, physically based | Empirical |
| Strength | Simple, widely used, easy to map | Useful for agriculture and water planning | Better separation of subtropical and temperate climates |
| Weakness | Arbitrary boundaries; ignores evaporation and causes | Laborious; PE estimated from temperature | Still threshold-based; less used |
| Type | Description | Areas |
|---|---|---|
| Amw | Monsoon with short dry season | West coast south of Goa |
| As | Monsoon with dry summer | Coromandel coast of Tamil Nadu |
| Aw | Tropical savanna | Most of the peninsular plateau south of the Tropic of Cancer |
| BShw | Semi-arid steppe | Parts of Rajasthan, Gujarat, Haryana; rain-shadow Deccan |
| BWhw | Hot desert | Most of western Rajasthan |
| Cwg | Monsoon with dry winter | Ganga plain, eastern Rajasthan, northern Madhya Pradesh, most of the north-east |
| Dfc | Cold humid winter, short summer | Arunachal Pradesh |
| E | Polar type | Higher Himalaya of Ladakh, Jammu and Kashmir, Himachal Pradesh, Uttarakhand |
Mains points
- State the basis of each scheme first (vegetation thresholds, precipitation effectiveness, potential evapotranspiration, growing season) before describing groups.
- Always add criticism and a comparison; 'critically examine Koppen' expects at least three limitations and how Thornthwaite or Trewartha responded.
- Draw the hypothetical continent or an India map; both are quick and earn visible credit.
- Get thresholds right: A coolest month 18°C or more; E warmest month below 10°C; C-D boundary −3°C (0°C in some versions).
- Distinguish Thornthwaite 1931 (P-E and T-E indices) from 1948 (PE and moisture index); mixing them is a common error.
- For India, quote the NCERT Koppen types with areas and link them to agriculture.
Did you know?
- Memory trick for Koppen's groups from equator to pole: 'Always Be Cool During Exams' = A, B, C, D, E.
Global Climate Change, Applied and Urban Climatology
Earth's climate has always changed through natural causes such as Milankovitch cycles, solar variation and volcanoes, but the warming since the industrial era is mainly human-caused: the IPCC Sixth Assessment Report (2021) found the decade 2011–2020 about 1.1°C warmer than 1850–1900. Man's role is through greenhouse gases and land-use change; his response is mitigation and adaptation. Applied climatology uses climate knowledge for farming, health and building, and urban climatology studies the urban heat island and other effects of cities.
In simple words
Climate change means a lasting shift in average weather, like a fever that does not go away rather than one hot day.
In the past it happened slowly through changes in the earth's orbit, the sun and volcanoes; today burning coal, oil and gas and cutting forests are warming the planet fast.
Cities are like heat traps: concrete and traffic make them warmer than nearby villages, especially at night.
UPSC asks about causes, man's role and response, and urban climate problems with Indian examples.
1. Evidence of past climate change
Geological record: glacial deposits, fossil pollen, coral bands, ocean sediments and ice cores show warm and cold periods throughout earth history.
Pleistocene ice ages: repeated glacials and interglacials over the last 2.6 million years; the last glacial maximum was about 20,000 years ago, when sea level was roughly 120 m lower.
Holocene: the present interglacial of about the last 11,700 years; within it the Medieval Warm Period (roughly 950–1250) and the Little Ice Age (roughly 1300–1850) were regional rather than uniformly global (debated).
Indian evidence: the drying of the Thar and the decline of Harappan settlements around 4,200 years ago are linked by many scholars to a weakening monsoon (debated); Himalayan glacial moraines record past ice advances.
2. Natural causes of climate change
Milankovitch cycles: Milutin Milankovic (1920s–1941) linked ice ages to orbital changes: eccentricity (about 100,000 years), obliquity or axial tilt (about 41,000 years) and precession (about 23,000 years), which change the seasonal distribution of insolation.
Solar variability: sunspot cycles of about 11 years cause small changes in output; the Maunder Minimum (about 1645–1715) coincided with a cold phase of the Little Ice Age.
Volcanic eruptions: sulphate aerosols in the stratosphere reflect sunlight; Tambora (1815) caused the 'year without a summer' (1816) and Pinatubo (1991) cooled global temperature by about 0.5°C for one to two years.
Plate tectonics: over millions of years, moving continents, mountain building (such as the Himalaya and Tibet) and opening or closing of ocean gateways change ocean currents and weathering, altering climate.
Ocean-atmosphere variability: ENSO, the Pacific Decadal Oscillation and the Atlantic Meridional Overturning Circulation cause year-to-decade variations.
3. Anthropogenic climate change
Enhanced greenhouse effect: carbon dioxide from fossil fuels and cement, methane from rice paddies, livestock and leaks, nitrous oxide from fertilisers, and fluorinated gases add to the natural greenhouse effect.
Concentration: atmospheric carbon dioxide has risen from about 280 ppm before industrialisation to over 410 ppm by 2019 (IPCC AR6), the highest in at least two million years according to the report.
IPCC AR6 Working Group I (2021): it is unequivocal that human influence has warmed the atmosphere, ocean and land; global surface temperature in 2011–2020 was about 1.09°C above 1850–1900.
Recent record: the WMO reported 2024 as the warmest year on record, about 1.55°C above the 1850–1900 average; a single year above 1.5°C does not by itself mean the Paris goal has been breached, which refers to long-term averages.
Land-use change: deforestation releases carbon and changes albedo; urbanisation and irrigation alter local climates.
Aerosols: sulphate and other particles from industry partly mask warming by reflecting sunlight, while black carbon absorbs heat and darkens snow on the Himalaya.
4. Impacts, with Indian examples
Temperature: India's average temperature rose by about 0.7°C during 1901–2018 (Ministry of Earth Sciences, Assessment of Climate Change over the Indian Region, 2020).
Extremes: more frequent heat waves, more intense short-duration rainfall, and urban floods; the 2023 and 2024 heat waves affected large parts of north India.
Cryosphere: retreat of many Himalayan glaciers, glacial lake outburst floods (for example the South Lhonak lake outburst in Sikkim, October 2023) and changing river flow.
Sea level and coasts: rising sea level threatens the Sundarbans, Lakshadweep and low-lying coastal cities.
Agriculture: terminal heat during wheat grain filling in March reduces yields; erratic monsoon rainfall affects kharif crops.
Health and ecosystems: heat stress, spread of vector-borne disease to higher altitudes, coral bleaching in the Gulf of Mannar and Lakshadweep.
5. Role and response of man
Role: man is now a geomorphic and climatic agent; many scholars call the present epoch the Anthropocene, a term popularised by Paul Crutzen (2000), though geologists have not formally adopted it.
Mitigation: cutting emissions through renewable energy, efficiency, electric mobility, carbon sinks and carbon pricing.
Adaptation: heat action plans, climate-resilient crops, early warning systems, coastal protection, water conservation.
Global framework: UNFCCC (1992), Kyoto Protocol (1997) with binding targets for developed countries, Paris Agreement (2015) with nationally determined contributions and the goal of holding warming well below 2°C and pursuing 1.5°C.
India's commitments: the updated NDC (2022) aims to reduce the emissions intensity of GDP by 45 per cent by 2030 from the 2005 level and to have about 50 per cent of installed electric power capacity from non-fossil sources by 2030; India announced a net-zero target for 2070 at COP26 (Glasgow, 2021).
National Action Plan on Climate Change (2008): eight national missions, including the National Solar Mission, Enhanced Energy Efficiency, Sustainable Habitat, Water, Sustaining the Himalayan Ecosystem, Green India, Sustainable Agriculture and Strategic Knowledge for Climate Change; states prepare State Action Plans.
Equity debate: developing countries stress common but differentiated responsibilities and historical emissions; developed countries stress current and future emissions of large emerging economies.
6. Applied climatology
Meaning: the use of climatic data and knowledge to solve practical problems in agriculture, health, architecture, transport, energy and planning.
Agroclimatology: crop calendars, irrigation scheduling, frost and drought forecasting; IMD's Gramin Krishi Mausam Sewa issues agromet advisories to farmers.
Bioclimatology and health: thermal comfort indices, heat index, wind chill; link between climate and diseases such as malaria and dengue.
Building climatology: orientation, thick walls, courtyards and jalis in traditional hot-dry architecture of Rajasthan; sloping roofs in high-rainfall Kerala and the north-east.
Other uses: aviation and shipping forecasts, wind and solar site selection, disaster planning.
7. Urban climate and the urban heat island
Urban heat island (UHI): a city being warmer than its rural surroundings, most marked on calm, clear nights; first documented by Luke Howard in The Climate of London (1818–1820).
Layers: T.R. Oke distinguished the urban canopy layer (from ground to roof level) and the urban boundary layer above it; Oke also related UHI intensity to city size.
Causes: low-albedo asphalt and concrete that store heat, loss of vegetation and evapotranspiration, anthropogenic heat from vehicles and air conditioners, street canyons that trap long-wave radiation, and pollution haze that traps outgoing heat.
Other urban effects: lower wind speeds, more haze and smog, sometimes more rainfall downwind of cities (as found in the METROMEX study of St Louis in the 1970s), and rapid runoff causing urban floods.
Indian examples: Mumbai's flood of 26 July 2005, when Santacruz recorded about 944 mm in 24 hours; Chennai floods of December 2015; Delhi's winter smog; daytime surface heat islands in Delhi, Ahmedabad and Hyderabad seen in satellite data.
Remedies: urban forests and green belts, cool and green roofs, protecting lakes and wetlands, permeable pavements, better building codes and heat action plans; Ahmedabad's Heat Action Plan (2013) was the first in South Asia, and NDMA has issued national heat wave guidelines.
8. Diagrams to draw
Urban heat island profile: draw a horizontal line from rural area through suburbs to the city centre and out again; draw a temperature curve that rises gently over suburbs, forms a 'plateau' over the built-up area and a 'peak' at the dense centre, falling sharply at the rural-urban edge ('cliff'), with lower values over parks and rivers.
Milankovitch cycles: three small sketches of the earth's orbit: a more and less elliptical orbit (eccentricity), the axis tilted between about 22.1° and 24.5° (obliquity), and a wobbling axis (precession).
India impacts map: mark Himalayan glacier retreat, heat-wave belt over north-west and central India, cyclone-prone east coast, Sundarbans and Lakshadweep sea-level risk, and drought-prone Deccan.
9. Using it in the exam
10-mark answer: urban heat island: definition, causes, the profile diagram and one Indian example.
15-mark answer: natural versus anthropogenic causes of climate change with evidence.
20-mark answer: role and response of man in climate change: causes, IPCC findings, impacts on India, mitigation and adaptation, India's NDC and NAPCC, and the equity debate.
Keywords: radiative forcing, enhanced greenhouse effect, Milankovitch, aerosols, Anthropocene, mitigation, adaptation, NDC, urban canopy layer, heat action plan.
Attribution: IPCC AR6 (2021) for warming figures; Milankovic for orbital theory; Luke Howard for the first urban climate study; T.R. Oke for urban boundary-layer concepts.
| Cause | Type | Time scale | Example or evidence |
|---|---|---|---|
| Milankovitch orbital cycles | Natural | About 23,000 to 100,000 years | Pleistocene glacial-interglacial cycles |
| Plate tectonics and mountain building | Natural | Millions of years | Uplift of the Himalaya and Tibet |
| Solar variability | Natural | 11-year cycles to centuries | Maunder Minimum, 1645–1715 |
| Volcanic aerosols | Natural | One to a few years | Pinatubo 1991, about 0.5°C cooling |
| Greenhouse gas emissions | Anthropogenic | Decades to centuries | About 1.09°C warming in 2011–2020 vs 1850–1900 (IPCC AR6) |
| Land-use change and urbanisation | Anthropogenic | Years to decades | Deforestation; urban heat islands |
Mains points
- Separate natural and anthropogenic causes clearly and give time scales; this shows conceptual clarity.
- Quote the IPCC AR6 (2021) figure of about 1.1°C with its baseline (1850–1900); avoid unsourced numbers.
- For 'role and response of man', cover both mitigation and adaptation, and India's NDC (2022), net zero 2070 and NAPCC (2008).
- For urban climate, draw the heat island profile and give Indian examples such as Mumbai 2005 and Ahmedabad's Heat Action Plan.
- Mark debated points: regional vs global extent of the Medieval Warm Period and Little Ice Age, monsoon role in Harappan decline, the Anthropocene as a formal epoch.
- Conclude with sustainable development and climate justice rather than a generic 'awareness' line.
Did you know?
- After the 1815 Tambora eruption, the cold, gloomy 'year without a summer' of 1816 kept a group of writers indoors near Lake Geneva, where Mary Shelley began writing Frankenstein.
UPSC Previous Year Questions: Climatology: Weather Systems, Climates and Climate Change
From 2014 to 2026 UPSC asked 21 question parts worth 315 marks from this chapter, all in Paper I. Global climate change, applied and urban climatology is the most-asked topic (10 parts, 160 marks), followed by climatic classification of Köppen, Thornthwaite and Trewartha (5 parts, 75 marks), cyclones and anticyclones (4 parts, 50 marks) and precipitation (2 parts, 30 marks). Every question below has a model answer written to the UPSC word limit.
In simple words
Read the question and the approach line, then write your own answer in the time limit: about 7 minutes for 10 marks, 10 for 15 marks and 12 for 20 marks.
Compare your answer with the model: check the definition and its author, the criteria or processes, the named examples, any data with year and source, and the map or diagram.
Note what you missed and revise that topic in the notes before trying the next question.
1. Tropical and Temperate Cyclones
Example 1 (UPSC 2024, 10 marks): Formation of temperate cyclone depends on the condition of axis of dilation. Elucidate.
Paper and question: Paper I, Q1(b)
Approach: Explain frontogenesis in a deformation field: define the axes of dilatation and contraction, show that a front forms when isotherms lie close to the axis of dilatation (Petterssen), and link it to the birth of a temperate cyclone on the polar front; sketch the deformation field.
A temperate cyclone forms on a front between cold polar and warm tropical air masses (Bjerknes' polar front theory). A front first needs frontogenesis, the sharpening of the temperature contrast, which depends on the pattern of air flow called a deformation field.
In a deformation field, such as a col between two highs and two lows, air converges along one axis (the axis of contraction) and spreads out along the other, the axis of dilatation.
Sverre Petterssen (1936) showed that if the isotherms make an angle of less than 45° with the axis of dilatation, the flow crowds them together, the temperature gradient tightens and a front forms along that axis. If the angle exceeds 45°, isotherms are spread apart and the front dissolves (frontolysis).
Diagram: Deformation field with hyperbolic streamlines, the axes of contraction and dilatation crossing at right angles, and isotherms crowding along the axis of dilatation.
A wave then develops on the front and deepens into a cyclone with warm and cold fronts. Hence alignment of isotherms with the axis of dilatation decides whether a temperate cyclone can form.
Example 2 (UPSC 2023, 15 marks): Explain the characteristics and weather conditions associated with 'Anticyclones' giving suitable examples.
Paper and question: Paper I, Q2(b)
Approach: Define anticyclones, explain their characteristics (pressure, wind, subsidence, divergence) and the weather they bring in winter and summer, classify them (cold, warm, blocking) with world and Indian examples; draw a plan and section.
An anticyclone is a system of high pressure with the highest pressure at the centre and closed isobars around it. Air sinks at the centre and spreads outward.
Characteristics: winds blow outward, clockwise in the northern hemisphere and anticlockwise in the southern, because of the Coriolis force. Isobars are widely spaced, so winds are light. Subsidence warms the air adiabatically and dries it, often creating an inversion aloft.
Weather: in summer, clear skies and strong sunshine bring hot, dry spells and heat waves. In winter, clear nights cause strong radiation cooling, frost, fog and, in cities, smog trapped under the inversion. Precipitation is rare.
Types: (i) cold or thermal anticyclones over cold continents in winter, such as the Siberian High, which feeds the cold, dry winter monsoon of East Asia; (ii) warm or dynamic subtropical highs, such as the Azores–Bermuda, North Pacific and Mascarene Highs, maintained by sinking air of the Hadley cell; (iii) blocking anticyclones, which stall the westerlies and caused the European heat wave of 2003 and the Russian heat wave of 2010.
India: winter high pressure over north-west India brings clear skies, cold waves and dense fog over the Indo-Gangetic Plain, while the Mascarene High drives the cross-equatorial flow of the south-west monsoon.
Diagram: Plan of an anticyclone with concentric isobars and clockwise outflowing winds, and a section with subsiding air and an inversion layer.
Anticyclones thus bring settled but not always pleasant weather.
Example 3 (UPSC 2020, 10 marks): Write a geographical note on Halloween Storm.
Paper and question: Paper I, Q1(a)
Approach: Identify the Halloween Storm of 1991 (the 'Perfect Storm'), explain its formation from an extratropical low that absorbed Hurricane Grace and later turned tropical, and note its effects and geographical significance; sketch the synoptic setting.
The Halloween Storm of late October and early November 1991, popularly called the Perfect Storm, was a powerful nor'easter off the north-east coast of North America. (The name is also used for the solar storms of October 2003, but in climatology it refers to this event.)
Formation: an extratropical low developed along a cold front off Atlantic Canada around 28 October. It absorbed the remnants of Hurricane Grace, gaining tropical moisture and energy. A strong high over eastern Canada steepened the pressure gradient, spreading gale-force winds over a huge area.
Unusually, the storm moved westward and then south-westward towards the coast, a retrograde track. Over the warm Gulf Stream it acquired a warm core and became a hurricane that was deliberately left unnamed.
Effects: huge waves and storm surge battered New England coasts; the fishing boat Andrea Gail was lost with all six crew, as told in Sebastian Junger's The Perfect Storm.
Diagram: Synoptic sketch of the north-west Atlantic with the low, Hurricane Grace merging from the south, the Canadian high and the storm's retrograde track.
It shows how tropical and mid-latitude systems can merge into hybrid storms.
Example 4 (UPSC 2016, 15 marks): Compare the origin and weather conditions associated with the tropical and temperate cyclones.
Paper and question: Paper I, Q2(b)
Approach: Compare tropical and temperate cyclones point by point: origin (energy source, latitude, fronts, conditions), structure, movement and associated weather, with named examples, ending with key contrasts; draw plan views of both.
Both are low-pressure systems with converging, rotating winds, but they differ in origin and weather.
Origin of tropical cyclones: they form over warm oceans with surface temperatures above about 26–27°C, between about 5° and 20° latitude where the Coriolis force is enough, with low vertical wind shear and a pre-existing disturbance. Their energy is latent heat of condensation; they have no fronts. Examples: Cyclone Amphan (2020), Hurricane Katrina (2005).
Origin of temperate cyclones: they form between about 35° and 65° latitude along the polar front where cold and warm air masses meet (Bjerknes' theory). Their energy comes from the temperature contrast between air masses and is guided by the jet stream. Example: Western Disturbances reaching north India.
Weather of tropical cyclones: a calm eye ringed by the eye wall with the strongest winds and torrential rain, spiral rain bands and storm surge at landfall. They are compact, move east to west with the trades and weaken quickly over land.
Weather of temperate cyclones: a sequence as fronts pass, steady rain ahead of the warm front, a mild warm sector, then heavy showers and a sharp temperature fall at the cold front. They are large (often over 1,000 km), move west to east with the westerlies and occur over land and sea.
Diagram: Plan views of a tropical cyclone with eye and spiral bands, and a temperate cyclone with warm front, cold front and warm sector.
Thus tropical cyclones are violent, compact and seasonal, while temperate cyclones are milder, larger and frequent.
2. Precipitation and the Hydrological Cycle
Example 5 (UPSC 2021, 20 marks): Examine major influencing factors for varied patterns of precipitations on the continents.
Paper and question: Paper I, Q3(a)
Approach: Examine the factors behind the uneven distribution of precipitation over continents (latitude and pressure belts, winds, distance from sea, ocean currents, relief, monsoons and cyclones, local factors) with named regions for each, ending with an integrated view; add a world map of rainfall zones.
Precipitation over continents ranges from almost nil in the Atacama to over 11,000 mm a year at Mawsynram in Meghalaya. This variety arises because rain needs moist air and a mechanism to lift it, and both are unevenly distributed.
(1) Latitude and pressure belts: the rising air of the Inter-Tropical Convergence Zone gives heavy convectional rain in the Amazon and Congo basins, while the sinking air of the subtropical highs creates the great deserts near the tropics: the Sahara, Arabia, Thar and Kalahari.
(2) Prevailing winds: onshore winds bring rain, as the westerlies do to the west coasts of Europe, British Columbia and southern Chile between 40° and 60°; offshore trade winds leave the western sides of continents dry in low latitudes.
(3) Continentality: interiors far from the sea, such as Central Asia, the Gobi and the Great Basin, receive little moisture.
(4) Ocean currents: cold currents chill and stabilise coastal air, producing fog but little rain along the Atacama (Humboldt Current) and Namib (Benguela Current), while warm currents add moisture to eastern coasts such as south-east USA and Brazil.
(5) Relief: mountains force orographic rain on windward slopes and leave rain shadows, as in the Western Ghats versus the Deccan interior, the Khasi Hills, and Patagonia east of the Andes.
(6) Monsoons and cyclones: seasonal wind reversal gives South and South-East Asia most of their rain in summer, while mid-latitude cyclones add frontal rain. (7) Local factors and teleconnections such as ENSO modify totals from year to year.
Map: World map showing zones of heavy rainfall (equatorial, monsoon, windward west coasts), deserts on western margins near the tropics and dry continental interiors.
These factors act together: the Thar is dry because of subtropical subsidence, the Aravallis lying parallel to the monsoon winds and distance from moisture.
Example 6 (UPSC 2018, 10 marks): Explain the role of evaporation in the hydrologic cycle.
Paper and question: Paper I, Q1(b)
Approach: Explain evaporation as the engine of the hydrologic cycle: its share in moving water from oceans and land to the atmosphere, its role in energy transfer, precipitation, salinity and climate, and the factors controlling it; include a cycle diagram.
Evaporation is the change of liquid water into vapour. With transpiration from plants (together evapotranspiration), it is the only process that lifts water from the earth's surface into the atmosphere, making it the engine of the hydrologic cycle.
Role: (i) Oceans supply most evaporated water; winds carry part of it over land as rain that returns by rivers, linking ocean and land stores. (ii) Evaporation distils water, leaving salts behind, so it supplies fresh water and raises subtropical ocean salinity, as in the Red Sea.
(iii) Energy: evaporation absorbs latent heat, which is released when vapour condenses into clouds; this transfers heat from the tropics towards the poles and powers thunderstorms and cyclones. (iv) It cools surfaces, moderating temperatures of oceans and vegetated land.
Controls: temperature, solar radiation, humidity, wind speed, water surface area and, on land, soil moisture and vegetation. Evaporation is highest over subtropical oceans and lowest in polar regions.
Diagram: Hydrologic cycle showing evaporation from ocean, transport of vapour, condensation, precipitation, runoff and infiltration, with evaporation arrows labelled.
Warming raises evaporation and atmospheric moisture, intensifying both heavy rain and droughts.
3. Classification of World Climates (Koppen, Thornthwaite, Trewartha)
Example 7 (UPSC 2024, 15 marks): Describe latitudinal distribution of Köppen's classification of world climate.
Paper and question: Paper I, Q2(b)
Approach: Describe Köppen's major climate groups in their latitudinal order from the equator to the poles, giving each group's temperature or moisture criterion, sub-types, location and examples, and note departures from strict zonation; draw an idealised hypothetical continent.
Wladimir Köppen's classification (1918, revised 1936) uses monthly temperature and precipitation, with boundaries chosen to match vegetation. Its five main groups roughly follow latitude from the equator to the poles.
A, tropical humid (coldest month 18°C or above): from the equator to about 15–25°. Af (rainforest: Amazon, Congo, Indonesia) lies near the equator; Am (monsoon: west coast of India, Myanmar) and Aw (savanna: Sudan, Deccan) lie poleward.
B, dry (evaporation exceeds precipitation): mainly 15–30° on the western sides of continents (BWh: Sahara, Thar, Atacama) and in mid-latitude interiors and rain shadows (BWk, BSk: Gobi, Patagonia).
C, warm temperate (coldest month between 18°C and −3°C): about 25–45°. Cs (Mediterranean) on west coasts, Cw and Cfa on eastern margins (north China, south-east USA), and Cfb (marine west coast) at 45–60° in north-west Europe.
D, cold snow-forest (coldest month below −3°C, warmest above 10°C): 40–70° only in the northern hemisphere, which alone has broad land there: Dfa–Dfb in the US Midwest and Russia, Dfc and Dw in Siberia and Canada.
E, polar (warmest month below 10°C): beyond about 65–70°, ET tundra on Arctic coasts and EF ice caps in Greenland and Antarctica; highland climates (H) occur at any latitude, as in the Himalaya and Andes.
Diagram: Köppen's hypothetical continent showing A, B, C, D and E zones with B extending along western margins and D confined to the northern hemisphere.
The order is latitudinal but is distorted by land–sea distribution, ocean currents and relief, which is why B and H break the pattern.
Example 8 (UPSC 2019, 10 marks): Explain the techniques to calculate potential evapotranspiration suggested by Thornthwaite.
Paper and question: Paper I, Q1(b)
Approach: Define potential evapotranspiration, then explain Thornthwaite's techniques: field measurement with evapotranspirometers and his empirical temperature formula (heat index, exponent, day-length correction); note limits; show the steps as a flow diagram.
Potential evapotranspiration (PE) is the amount of water that would evaporate and transpire from a surface fully covered by vegetation if soil water were never limiting. C.W. Thornthwaite introduced the concept and made it the basis of his 1948 classification.
Measurement: Thornthwaite used evapotranspirometers (lysimeters), moist soil tanks with growing grass in which water added minus water drained gives the loss.
Empirical formula: as such data were scarce, he related PE to mean monthly temperature (T, °C). First, a monthly heat index i = (T/5) raised to the power 1.514 is computed and summed for twelve months to give the annual heat index I. Unadjusted PE = 16 × (10T/I) raised to the power a, in mm per month, where a is an empirically derived function of I.
This assumes a 30-day month and 12-hour days, so it is corrected for day length by latitude and month length.
Diagram: Flow chart: mean monthly temperature → heat index i → annual index I → exponent a → unadjusted PE → day-length correction → monthly PE.
Needing only temperature, it ignores wind and humidity and underestimates PE in arid areas; Penman's method is more physical.
Example 9 (UPSC 2018, 15 marks): Critically examine the basis and scheme of climatic classification proposed by G.T. Trewartha.
Paper and question: Paper I, Q2(b)
Approach: Critically examine Trewartha's classification: state its basis (modification of Köppen using temperature and precipitation thresholds tied to vegetation), outline the scheme of groups and types with examples, then assess merits and limitations; include a schematic table-diagram.
Glenn T. Trewartha's scheme (An Introduction to Climate, revised 1966–68 and later with Lyle Horn, 1980) is a modified Köppen classification. Like Köppen, it is empirical, using mean monthly temperature and precipitation, but it redraws the mid-latitude boundaries to fit vegetation and agriculture better.
Basis: the key measure is the number of months with mean temperature of 10°C or more, which reflects the length of the growing season. Moisture is judged by comparing precipitation with a temperature-dependent dryness threshold.
Scheme: A, tropical (all months 18°C or above: Ar wet, Aw wet-and-dry); B, dry (BW desert, BS steppe); C, subtropical (8 or more months at 10°C: Cs dry summer, Cf humid); D, temperate (4–7 months at 10°C: Do oceanic, Dc continental); E, boreal (1–3 months); F, polar (no month above 10°C: Ft tundra, Fi ice cap); and H, highland.
Merits: it splits Köppen's very broad C group, separating the subtropical south-east USA from oceanic north-west Europe; the 10°C rule ties zones to the growing season; and it is simple to apply.
Limitations: like Köppen it is descriptive, not genetic, so it ignores air masses, fronts and circulation; thresholds remain arbitrary and boundaries are sharp lines; means hide extremes; and moisture is treated less precisely than in Thornthwaite's water balance.
Diagram: A pole-to-equator column showing groups F, E, D, C and A by the number of months at or above 10°C, with B and H marked as moisture and altitude exceptions.
Trewartha's scheme is thus a practical refinement of Köppen that shares its static, empirical character.
Example 10 (UPSC 2015, 15 marks): What is Potential Evapotranspiration? Explain how it is used in assessing the water balance in an area.
Paper and question: Paper I, Q2(b)
Approach: Define potential evapotranspiration and contrast it with actual evapotranspiration, then explain the Thornthwaite–Mather water balance (comparison of P and PE, soil-moisture storage, utilisation, recharge, deficit, surplus) and its uses, with an Indian example and a water-balance graph.
Potential evapotranspiration (PE), a concept introduced by C.W. Thornthwaite (1948), is the water loss that would occur from a vegetated surface if water supply were unlimited. It is the climatic demand for water, set mainly by energy (temperature and day length). Actual evapotranspiration (AE) is the loss that really occurs and equals PE only when water is plentiful.
Water balance: Thornthwaite and Mather (1955) compared monthly precipitation (P) with PE, treating the soil as a store holding a fixed amount (often taken as 100 mm or more, depending on soil and roots).
Steps: (i) when P exceeds PE, the extra first recharges soil moisture and, once the soil is full, becomes a water surplus that feeds runoff and groundwater; (ii) when P falls below PE, plants draw on stored moisture (utilisation); (iii) when the store is exhausted, AE falls below PE and the gap is the water deficit.
Uses: the annual surplus and deficit give a moisture index that classifies climates from perhumid to arid; deficits show when and how much irrigation is needed; surpluses indicate runoff for reservoir planning; and the indices help assess drought.
India: V.P. Subrahmanyam applied the method to India, showing surpluses on the west coast and in the North-East, and deficits increasing towards Rajasthan and the rain-shadow Deccan.
Diagram: Water-balance graph with monthly P and PE curves for a monsoon station, shading surplus, utilisation, deficit and recharge periods.
PE thus turns rainfall into a measure of real water availability.
Example 11 (UPSC 2015, 20 marks): Discuss the basis of Köppen's climatic classification. Bring out the salient characteristics of 'Cs' type of climate.
Paper and question: Paper I, Q3(a)
Approach: Discuss the basis of Köppen's scheme (vegetation boundaries, monthly temperature and precipitation thresholds, letter code), then bring out the salient features of the Cs (Mediterranean) climate: location, causes, temperature, rainfall, sub-types, vegetation and economy; include a world map of Cs regions.
Wladimir Köppen, a botanist-climatologist, published his classification in 1900 and revised it in 1918 and 1936. It remains the most widely used scheme.
Basis: (i) Köppen assumed that natural vegetation is the best expression of climate, drawing on de Candolle's plant groups, so he set climate boundaries to match vegetation limits; (ii) he used mean monthly and annual temperature and precipitation; (iii) he fixed numerical thresholds, for example 18°C for the coldest month of A climates, 10°C for the warmest month as the tree line, and a dryness limit for B; (iv) he used a letter code: capitals for main groups (A, B, C, D, E), small letters for rainfall season (f, s, w, m) and temperature (a, b, c, d, h, k).
Cs climate (Mediterranean): warm temperate with a dry summer. 's' means the driest summer month has less than one-third the rain of the wettest winter month and less than about 30–40 mm (the threshold varies by edition).
Location and cause: west coasts between about 30° and 45°, Mediterranean basin, California, central Chile, the south-western Cape and south-west and southern Australia. The seasonal shift of pressure belts brings subtropical high pressure in summer and westerlies with cyclones in winter.
Characteristics: mean summer temperatures about 20–27°C, mild winters about 5–12°C; annual rain about 350–900 mm, mostly in winter; sunny skies. Csa (hot summer, Rome, Los Angeles inland) and Csb (warm summer, Lisbon, San Francisco) are sub-types.
Vegetation and economy: drought-resistant sclerophyll evergreen woodland (maquis, chaparral, fynbos); citrus, olive and grape growing, wine making and tourism. Local winds include the sirocco and mistral.
Map: World map shading Cs regions on western margins between 30° and 45° in both hemispheres.
Köppen's basis defines Cs precisely, though it describes rather than explains the circulation behind it.
4. Global Climate Change, Applied and Urban Climatology
Example 12 (UPSC 2026, 15 marks): Write an essay on disease and global warming according to the report of Intergovernmental Panel on Climate Change (IPCC).
Paper and question: Paper I, Q6(c)
Approach: Write a short essay on how global warming affects human disease according to the IPCC (mainly the Sixth Assessment Report, Working Group II, 2022): heat-related illness, vector-borne, water- and food-borne diseases, respiratory and mental health, and unequal vulnerability, ending with the adaptation measures it stresses; include a schematic diagram.
The Intergovernmental Panel on Climate Change, in its Sixth Assessment Report (Working Group II, 2022), concluded with very high confidence that climate change has already harmed people's physical health worldwide, and their mental health in the regions assessed.
Heat: more frequent and intense heat waves raise deaths from heat stroke and worsen heart, lung and kidney disease, especially among the elderly, outdoor workers and urban poor; South Asia, including India, is a hotspot.
Vector-borne diseases: warmer, wetter conditions extend the range and season of mosquitoes and ticks, so dengue, malaria and similar diseases are spreading to higher altitudes and latitudes, such as dengue appearing in new parts of Europe and the Himalayan foothills.
Water- and food-borne diseases: floods, heavy rain and warmer water increase cholera and diarrhoeal disease, while drought and heat reduce food quality and raise undernutrition. Wildfire smoke and ground-level ozone worsen respiratory illness, and disasters cause trauma, anxiety and displacement.
The IPCC projects these risks to grow with every increment of warming, falling hardest on low-income countries, children and those with poor health systems, which widens inequality.
Diagram: Flow diagram from rising temperature to heat stress, vectors, water and food, air quality and disasters, each leading to health outcomes.
The report stresses adaptation: heat action plans (Ahmedabad, 2013), early-warning and disease surveillance, safe water and sanitation, and climate-resilient health systems, alongside deep emission cuts.
Example 13 (UPSC 2024, 20 marks): How is carbon neutrality essential for future environmental conservation? Describe various efforts taken by nations in this regard.
Paper and question: Paper I, Q4(a)
Approach: Explain carbon neutrality and why it is essential (IPCC 1.5°C pathways, Paris goals, co-benefits for ecosystems), then describe national efforts (net-zero targets and laws, renewables, carbon pricing, forests, India's measures), ending with gaps and the way forward; include a world map of net-zero target years.
Carbon neutrality or net-zero carbon dioxide means that the carbon dioxide a country or organisation emits is balanced by the amount it removes through forests, soils or technology, so that its net addition to the atmosphere is zero.
Why essential: (i) warming is roughly proportional to cumulative CO₂ emissions, so temperature stabilises only when net emissions reach zero; the IPCC Special Report on 1.5°C (2018) found that limiting warming to 1.5°C requires global net-zero CO₂ around 2050. (ii) The Paris Agreement (2015, Article 4) seeks a balance between emissions and removals in the second half of the century. (iii) Conservation depends on it: coral reefs, glaciers, mangroves and many species cannot adapt to warming beyond 1.5–2°C.
Efforts by nations: the UK became the first major economy to legislate net zero by 2050 (2019); the European Union's Climate Law (2021) binds it to climate neutrality by 2050, backed by the Emissions Trading System and the Fit for 55 package; China aims for carbon neutrality before 2060 and India for net zero by 2070 (announced at COP26, Glasgow, 2021). Bhutan and Suriname already absorb more than they emit, thanks to large forest cover.
India's measures: updated NDC (2022) to cut emissions intensity of GDP by 45% from 2005 levels and reach about 50% of installed power capacity from non-fossil sources by 2030; the National Green Hydrogen Mission (2023); the Carbon Credit Trading Scheme (2023); the International Solar Alliance; and Mission LiFE.
Map: World map shading countries by net-zero target year (2050, 2060, 2070) and marking carbon-negative Bhutan and Suriname.
Gaps: pledges are not yet matched by policies, and finance and technology transfer to developing countries remain short, raising equity concerns. Carbon neutrality must therefore combine rapid emission cuts, protection of natural sinks and climate justice.
Example 14 (UPSC 2022, 10 marks): What is pollution dome? Discuss its formation and impacts.
Paper and question: Paper I, Q1(c)
Approach: Define a pollution (dust) dome, explain its formation through the urban heat island circulation and inversions, then its impacts, with Indian and world examples and a section diagram.
A pollution dome (dust dome) is a dome-shaped mass of polluted air that sits over a city on calm days, trapped by the city's own air circulation and a temperature inversion.
Formation: the urban heat island makes the city centre warmer than its surroundings, so air rises over the centre, spreads outward aloft, sinks over the cooler outskirts and flows back inward near the ground. Pollutants from traffic, industry and burning are carried round this closed loop. An inversion acts as a lid, and light winds keep the dome in place; when winds strengthen, it is stretched downwind into a pollution plume.
Impacts: (i) smog and very poor air quality, raising respiratory and heart disease; (ii) reduced visibility and sunlight; (iii) more fog and haze, as particles act as condensation nuclei; (iv) higher night temperatures; (v) altered rainfall downwind.
Diagram: Section across a city showing rising air over the centre, outflow aloft, sinking at the edges, an inversion lid and the dome of pollutants.
Examples: Delhi's winter smog and London's Great Smog of 1952. Control needs emission cuts and green, ventilated urban design.
Example 15 (UPSC 2022, 20 marks): Rise of surface temperature brings severe consequences. Elaborate the potential changes and threats associated with it in the world.
Paper and question: Paper I, Q4(a)
Approach: Elaborate the potential changes and threats from rising surface temperature: state the observed rise (IPCC AR6), then cover cryosphere and sea level, extremes, oceans, ecosystems, food and water, health and society, with world and Indian examples; conclude on mitigation and adaptation; add a world map of hotspots.
The IPCC Sixth Assessment Report (2021) found global surface temperature in 2011–2020 about 1.1°C above 1850–1900, and the WMO reported 2024 as the warmest year on record. Even small rises in the mean bring large changes in extremes.
Cryosphere and sea level: glaciers are retreating worldwide, including the Himalayan glaciers that feed the Ganga and Indus; Arctic summer sea ice is shrinking; and the Greenland and Antarctic ice sheets are losing mass. Global mean sea level rose about 0.20 m between 1901 and 2018 (AR6) and is accelerating, threatening deltas (Ganga–Brahmaputra, Nile, Mekong), cities such as Mumbai and Kolkata, and small island states such as the Maldives and Tuvalu.
Extremes: hotter and longer heat waves (Europe 2003, India 2024), heavier downpours and floods (Kerala 2018), more intense tropical cyclones and longer droughts and wildfire seasons (Australia 2019–20).
Oceans: warming and acidification cause mass coral bleaching, as on the Great Barrier Reef, and marine heat waves that move fish stocks poleward.
Ecosystems and food: species shift upslope and poleward, mountain and polar species lose habitat, and crop yields of wheat and rice fall in tropical regions under heat stress, while water supply grows less reliable as glaciers shrink and monsoon rains become erratic.
Society: heat stress cuts labour productivity, vector-borne diseases spread, and displacement from coasts and drylands raises migration and conflict risks; the poor and developing countries are hit hardest.
Map: World map marking the Arctic, Himalaya, low-lying deltas, small island states, coral reef belts and drought-prone Sahel and Mediterranean as hotspots.
Threats grow with each increment of warming and some, such as ice-sheet loss, may become irreversible beyond tipping points. Limiting warming through net-zero emissions and building adaptation, such as heat action plans and coastal defences, are both essential.
Example 16 (UPSC 2021, 15 marks): Explaining the concept of carbon neutrality, describe the measures taken by carbon positive and negative nations.
Paper and question: Paper I, Q3(c)
Approach: Explain carbon neutrality (and carbon negative), clarify what 'carbon positive' and 'carbon negative' nations mean, then describe measures taken by net-emitting nations and by carbon-negative nations such as Bhutan and Suriname; include a simple balance diagram.
Carbon neutrality is a state in which carbon dioxide emissions are balanced by removals through sinks such as forests or by technology, so net emissions are zero. A country that removes more than it emits is carbon negative; one whose emissions exceed removals is a net emitter, here called carbon positive (some campaigns use 'carbon positive' in the opposite sense, so the meaning should be stated).
Carbon-positive nations, the large emitters such as China, the USA, the EU states and India, have taken these measures: net-zero targets (EU and UK 2050, China 2060, India 2070); carbon pricing through emission trading schemes (EU ETS since 2005); rapid expansion of solar and wind power; phase-down of coal and electric mobility; energy-efficiency standards; afforestation; and green hydrogen and carbon capture. India has added the International Solar Alliance and its 2022 NDC targets.
Carbon-negative nations: Bhutan's constitution requires at least 60% of land to remain under forest, and forests cover about 70%; it exports hydropower to India, displacing fossil electricity, and pledged in 2009 to stay carbon neutral. Suriname, with over 90% forest cover, also absorbs more than it emits. Their measures centre on protecting forests, clean hydropower and low-impact development.
Diagram: A balance scale with emissions on one side and removals (forests, oceans, technology) on the other, showing positive, neutral and negative states.
Small carbon-negative states show what forest protection can achieve, but global neutrality depends on deep cuts by the big emitters, supported by climate finance for developing countries.
Example 17 (UPSC 2019, 15 marks): Explain the nature of urban climates and their impact on global environmental change.
Paper and question: Paper I, Q2(c)
Approach: Explain the nature of urban climates (heat island, humidity, wind, rainfall, pollution, with the urban boundary layer) and then their impact on global environmental change (emissions, land-use change, aerosols, feedbacks), with examples and a temperature-profile diagram.
Cities create their own climate by replacing vegetation with concrete, releasing heat and pollutants and altering airflow. Luke Howard first described London's warmth in The Climate of London (1818–20), and T.R. Oke later explained the urban boundary layer.
Nature: (i) the urban heat island: city centres are warmer than the countryside, most strongly on calm, clear nights, as buildings store heat and release it slowly; (ii) lower relative humidity, but more fog and haze around particles; (iii) lower average wind speeds, with gusty channelling between tall buildings; (iv) more convective rain downwind, as shown by the METROMEX study of St. Louis; (v) polluted air and pollution domes, as in Delhi's winter smog.
Impact on global change: cities are home to over half of humanity (55% in 2018, projected 68% by 2050, UN DESA) and the IPCC (2022) attributes roughly two-thirds or more of global greenhouse gas emissions to urban areas through energy, transport and construction. Urban expansion converts forests, wetlands and farmland, reducing carbon sinks. Aerosols and ozone from cities affect radiation and regional climate.
Feedbacks: heat islands raise air-conditioning demand and emissions, while global warming makes urban heat waves deadlier.
Diagram: Temperature profile across a rural–suburban–urban–rural transect showing the heat island peak over the city centre.
Cities are therefore both drivers and victims of global change; green roofs, urban forests, efficient transport and heat action plans such as Ahmedabad's (2013) help on both counts.
Example 18 (UPSC 2017, 10 marks): Explain the concept of micro carbon sink and its relevance.
Paper and question: Paper I, Q1(e)
Approach: Explain micro carbon sinks as small, local stores that absorb and hold carbon (trees outside forests, urban green spaces, wetlands, farm soils, sacred groves; at the smallest scale, microbial carbon storage), then their relevance for climate mitigation and India's NDC; add a simple diagram.
A carbon sink is any reservoir that absorbs more carbon than it releases, such as forests, oceans and soils. A micro carbon sink is a small, local sink: individual trees and village woodlots, urban parks and green roofs, small wetlands and ponds, mangrove patches, sacred groves, and agricultural soils enriched by organic farming, agroforestry or biochar. At the smallest scale, soil microbes and ocean microbes (the 'microbial carbon pump') lock carbon into stable forms.
Relevance: (i) together they store significant carbon and can be created almost anywhere, including cities and farms; (ii) they support India's NDC target of an additional carbon sink of 2.5–3 billion tonnes of CO₂ equivalent through forest and tree cover by 2030; (iii) they bring co-benefits: cooler cities, groundwater recharge, soil fertility and biodiversity; (iv) they involve communities, as in Nagar Van urban forests, green belts and farm agroforestry.
Diagram: A village–city landscape showing trees, ponds, green roofs and farm soils absorbing CO₂ arrows.
Micro sinks cannot replace emission cuts, but they are a low-cost, local complement to them.
Example 19 (UPSC 2017, 20 marks): "Climate change is a reality." Explain with suitable examples.
Paper and question: Paper I, Q3(a)
Approach: Explain, with evidence and examples, that climate change is real: instrumental warming, greenhouse gas rise, cryosphere and sea level, extremes, ecological signals and Indian evidence, then address natural variability versus human attribution (IPCC) and conclude; add a graph of temperature and CO₂.
Climate change means a long-term shift in average weather conditions. Its reality rests on multiple, independent lines of evidence, and the IPCC Sixth Assessment Report (2021) states that it is unequivocal that human influence has warmed the atmosphere, ocean and land.
Temperature and greenhouse gases: global surface temperature has risen about 1.1°C since 1850–1900. Carbon dioxide measured at Mauna Loa since 1958 (the Keeling curve) has climbed from about 315 ppm to over 420 ppm, far above the pre-industrial level of about 280 ppm.
Cryosphere and sea: mountain glaciers are retreating, among them the Gangotri glacier, the source of the Bhagirathi; Arctic summer sea ice has declined sharply since satellite records began in 1979; and sea level is rising faster, threatening low islands such as the Lakshadweep and the Sundarbans.
Extreme events: heat waves, intense rainfall and droughts are becoming more frequent and severe, for example the Uttarakhand floods (2013), Chennai floods (2015) and European heat wave (2003), and attribution studies link many such events to warming.
Ecological signals: earlier flowering and bird migration, species moving upslope and poleward, and repeated coral bleaching on the Great Barrier Reef (2016, 2017) and in the Gulf of Mannar.
Diagram: Graph of global temperature anomaly and atmospheric CO₂ from 1880 to the present, both rising steeply after 1950.
Climate has always changed naturally through Milankovitch cycles, solar variation and volcanoes, but these cannot explain the present rate and pattern of warming, such as a warming lower atmosphere with a cooling stratosphere, which fits greenhouse forcing. Climate change is therefore a measurable reality, and the Paris Agreement (2015) reflects the global response.
Example 20 (UPSC 2016, 15 marks): Give a reasoned account on how the impact of Global Warming differs from one part of the Earth to the other.
Paper and question: Paper I, Q2(c)
Approach: Give a reasoned account of why global warming's impact varies across the earth: differential warming (Arctic amplification, land versus ocean) and differential effects on regions (polar, mountain, coastal and island, tropical dryland, monsoon, mid-latitude), plus differences in vulnerability; add a world map.
Global warming is a global average; its impacts differ because warming itself is uneven and because regions differ in exposure and capacity to cope.
Uneven warming: (i) Arctic amplification: the Arctic is warming at least twice as fast as the global average (IPCC AR6), as melting ice exposes dark ocean that absorbs more sunlight; (ii) land warms faster than oceans, which store heat; (iii) continental interiors and high mountains warm faster than coasts.
Polar and mountain regions: sea-ice loss, permafrost thaw releasing methane, and retreat of Himalayan and Andean glaciers threaten water supplies for millions downstream.
Coasts and islands: sea-level rise and storm surge endanger low-lying deltas (Ganga–Brahmaputra, Nile, Mekong) and small island states such as the Maldives, Kiribati and Tuvalu.
Tropics and drylands: already near heat limits, they face lower crop yields, heat stress and longer droughts, as in the Sahel; monsoon Asia faces erratic rainfall and more extreme downpours.
Mid and high latitudes: some areas such as Canada and Russia may gain longer growing seasons, though with more heat waves, wildfires and pests; the Mediterranean is drying.
Map: World map showing Arctic amplification, glacier zones, vulnerable deltas and islands, drying regions and possible agricultural gainers.
Vulnerability also differs: poorer countries with less adaptive capacity suffer more though they emitted least, which underpins the principle of common but differentiated responsibilities.
Example 21 (UPSC 2016, 20 marks): Discuss the significance of World Climate Research Programme (WCRP) and its core projects in the understanding of climatic change.
Paper and question: Paper I, Q3(a)
Approach: Discuss the WCRP: its origin, sponsors and objectives, its core projects past and present (TOGA, WOCE, GEWEX, CLIVAR, SPARC/APARC, CliC) and coordinated modelling (CMIP, CORDEX), and how each improved understanding of climate change, with Indian links; add an organisational diagram.
The World Climate Research Programme (WCRP), established in 1980, is sponsored by the World Meteorological Organization and the International Science Council (formerly ICSU), joined in 1993 by UNESCO's Intergovernmental Oceanographic Commission. Its aims are to determine how far climate can be predicted and how far humans influence it.
Significance: it coordinates research across nations and disciplines, organises global observation campaigns and model comparisons, and provides much of the science assessed by the IPCC.
Core projects: (i) TOGA (Tropical Ocean–Global Atmosphere, 1985–94) studied the tropical Pacific and laid the basis for El Niño forecasting through the moored buoy array; (ii) WOCE (World Ocean Circulation Experiment) mapped global ocean circulation and heat transport in the 1990s; (iii) CLIVAR (Climate and Ocean: Variability, Predictability and Change) studies ocean–atmosphere variability such as ENSO, the Indian Ocean Dipole and the monsoons.
(iv) GEWEX (Global Energy and Water Exchanges) studies the energy and water cycle, clouds and land–atmosphere interaction; (v) SPARC, now APARC, studies the stratosphere and ozone and their role in climate; (vi) CliC (Climate and Cryosphere) studies ice sheets, glaciers, sea ice and permafrost and their contribution to sea-level rise.
Modelling: WCRP's Coupled Model Intercomparison Project (CMIP) supplies the climate projections used in IPCC reports, and CORDEX produces regional downscaled projections; its South Asia component is coordinated by the Indian Institute of Tropical Meteorology, Pune.
Diagram: Organisational chart with WCRP at the top, sponsors (WMO, ISC, IOC-UNESCO) above, and core projects and modelling activities below, linked to the IPCC.
Thus WCRP has turned scattered observations into a coordinated understanding of how the climate system works and changes, improving seasonal monsoon and El Niño forecasts and long-term projections on which policies such as the Paris Agreement rest.
Mains points
- Climate change questions now dominate: carbon neutrality (asked in 2021 and 2024), regional impacts, health and the IPCC. Cite IPCC AR6 findings, the Paris Agreement and India's net-zero 2070 target and 2022 NDC accurately.
- Classification questions reward exact criteria: Köppen's thresholds (18°C, −3°C, 10°C) and letter code, Thornthwaite's PE formula and water balance, and Trewartha's months-above-10°C rule, each followed by a critique.
- For cyclones and anticyclones, compare point by point (origin, energy, structure, movement, weather) and draw plan views with fronts or isobars.
- Applied and urban climatology questions (heat island, pollution dome, urban climate) need a cross-section diagram and Indian cities such as Delhi and Ahmedabad.
- Attribute ideas correctly: Bjerknes (polar front), Petterssen (frontogenesis), Köppen (1918, 1936), Thornthwaite (1948) and Mather (1955), Trewartha, Luke Howard (urban climate), Oke (urban boundary layer).
- Give data only with year and source and avoid invented figures; a balanced conclusion linking mitigation, adaptation and equity scores well.
Did you know?
- Luke Howard, who first described London's urban heat island in The Climate of London (1818–20), also gave clouds the Latin names still used today: cirrus, cumulus and stratus.
Geography Optional: All chapters
- Exam Pattern, Syllabus and Strategy
- The Earth's Interior and Tectonics
- Geomorphic Processes and Landscape Development
- Climatology: Atmosphere and Circulation
- Climatology: Weather Systems, Climates and Climate Change
- Oceanography
- Biogeography
- Environmental Geography
- Perspectives in Human Geography
- Economic Geography
- Population Geography
- Settlement Geography
- Regional Planning
- Models, Theories and Laws in Human Geography
- India: Physical Setting I
- India: Physical Setting II
- Resources of India
- Agriculture in India
- Industry in India
- Transport, Communication and Trade
- Cultural Setting and Population of India
- Settlements in India
- Regional Development and Planning in India
- Political Aspects
- Contemporary Issues
- Places for the Map Question