
Geography Optional · UPSC Notes
Contemporary Issues — UPSC Geography Optional Notes
Free, exam-focused notes for UPSC Prelims and Mains, with Prelims tips and Mains points for every topic. 6 topics.
Open in the interactive reader: bookmarks, progress tracking and read-aloud.
Environmental Hazards and Disaster Management in India
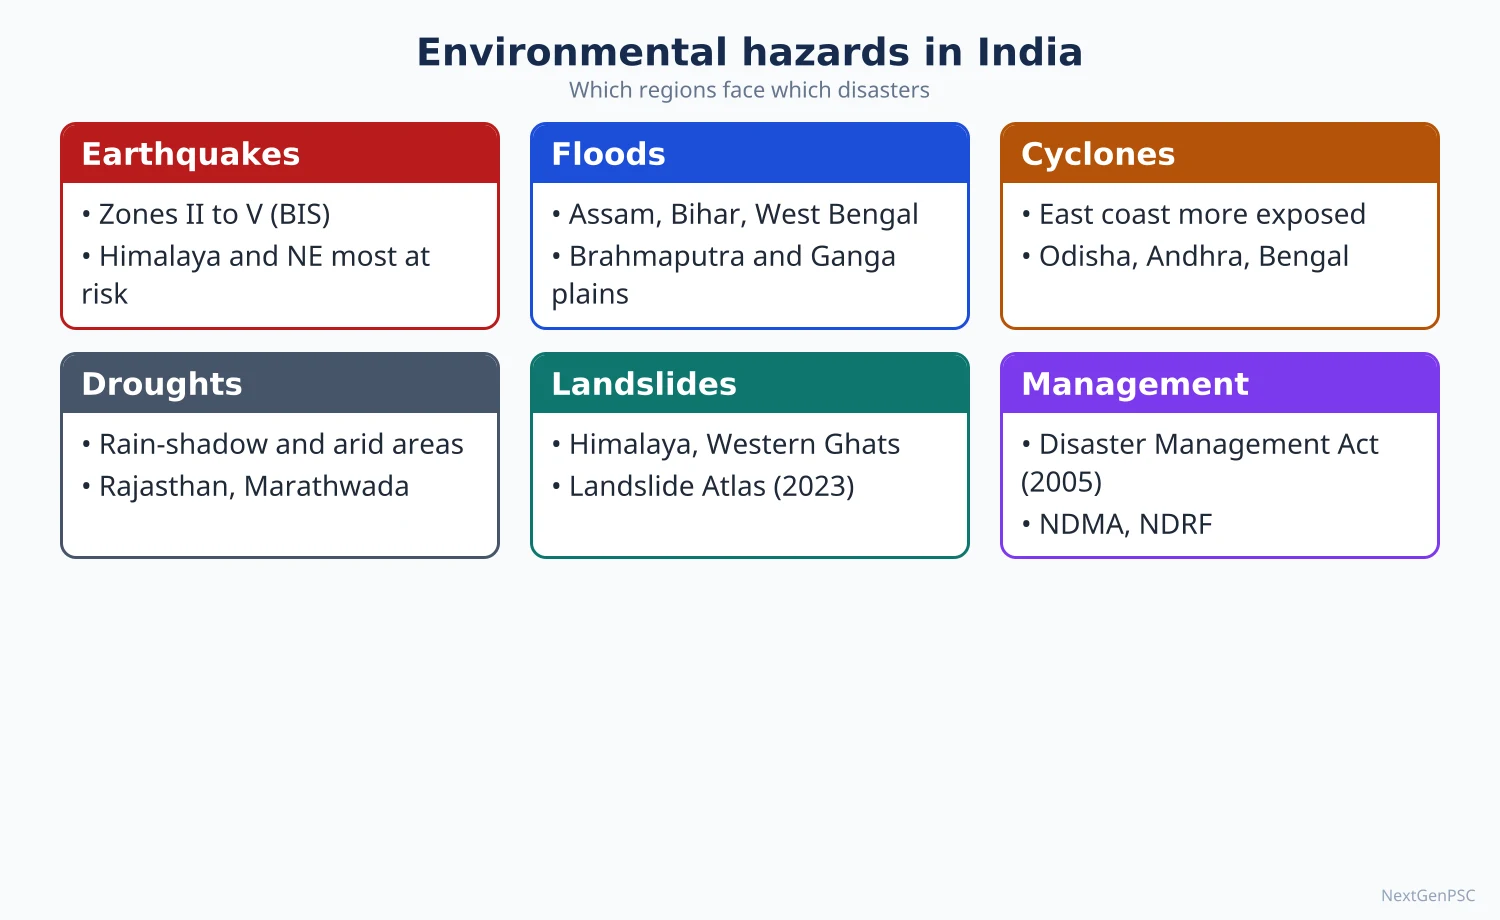
India is one of the most multi-hazard countries in the world: according to the NDMA, about 58.6% of its land is prone to earthquakes of moderate to very high intensity, about 40 million hectares (12%) to floods, about 5,700 km of its 7,516 km coastline to cyclones and tsunamis, and about 68% of its cultivable area to drought. A hazard becomes a disaster only when it meets exposed and vulnerable people, so geographers stress vulnerability and risk reduction rather than relief alone. India moved from a relief-centred approach to a risk-reduction approach with the Disaster Management Act, 2005 and the Sendai Framework (2015–2030).
In simple words
A hazard is a natural or man-made event that can cause harm, such as an earthquake, a flood or a disease outbreak.
Think of a hazard as rain and a disaster as getting soaked: the same rain hurts the person without an umbrella far more, just as a weak house or a poor village suffers more from the same earthquake.
India faces almost every hazard because of the young Himalaya, the monsoon and a long coastline, and millions live in exposed places.
UPSC asks you to explain the causes, map the vulnerable zones and suggest how to reduce risk.
1. Concepts and definitions
Hazard: a potentially damaging physical event, phenomenon or human activity that may cause loss of life, injury, property damage or environmental degradation.
Disaster: the Disaster Management Act, 2005 defines it as a catastrophe, mishap, calamity or grave occurrence from natural or man-made causes that results in substantial loss of life, property or environment and is beyond the coping capacity of the affected community.
Vulnerability: the conditions (physical, social, economic, environmental) that increase the susceptibility of a community to the impact of hazards; poverty, weak houses, illiteracy and marginal location raise it.
Risk equation: a widely used formulation is Risk = Hazard × Exposure × Vulnerability ÷ Capacity, popularised in the work of Blaikie, Cannon, Davis and Wisner (At Risk, 1994), who argued that disasters are rooted in social vulnerability, not nature alone.
Disaster management cycle: mitigation and preparedness before the event, response during it, and recovery and reconstruction after it; the aim of 'build back better' was written into the Sendai Framework.
Gilbert White (1945, Human Adjustment to Floods) founded the human-ecology approach to hazards, showing that engineering alone (levees) can raise flood losses by encouraging settlement on floodplains.
2. Earthquakes and tsunamis
Cause: the Indian Plate moves north-north-east at about 5 cm a year into the Eurasian Plate; strain builds along the Main Central Thrust, Main Boundary Thrust and Himalayan Frontal Thrust and is released as earthquakes.
Seismic zones: the BIS map (IS 1893 Part 1: 2002) divides India into Zones II to V; Zone V (very high) covers the whole North-East, Jammu and Kashmir, Himachal Pradesh, Uttarakhand, Rann of Kutch, north Bihar and the Andaman and Nicobar Islands.
Revision debate: a 2025 revision (IS 1893 Part 1: 2025) proposed a new highest Zone VI for the entire Himalayan arc; reports in March 2026 said BIS withdrew it, so students should check its current status and present it as debated.
Peninsular quakes: even the 'stable' shield has intraplate earthquakes along old faults, e.g. Koyna (Maharashtra) 1967, linked by many scientists to reservoir-induced seismicity, Latur (Killari) 1993 and Jabalpur 1997.
Major Indian earthquakes: Assam 1950 (about magnitude 8.6), Uttarkashi 1991, Latur 1993, Bhuj (Gujarat) 26 January 2001 (about Mw 7.7) and Kashmir 2005.
Tsunami: a series of long ocean waves caused by sudden displacement of the sea floor, usually by a subduction-zone earthquake; the 26 December 2004 Sumatra–Andaman earthquake (about Mw 9.1) sent waves that struck Tamil Nadu (Nagapattinam worst hit), Andaman and Nicobar, Kerala and Andhra Pradesh.
Response: the Indian Tsunami Early Warning Centre was set up at INCOIS, Hyderabad, in 2007 and now serves as a regional tsunami service provider for the Indian Ocean.
3. Landslides
Process: downslope movement of rock, debris or earth under gravity; it is triggered when shear stress exceeds shear strength, usually after intense rain saturates the soil, raises pore-water pressure and lowers friction.
Human causes: road cutting at steep angles, deforestation, quarrying, tunnelling for hydropower and unplanned construction on old landslide debris.
Distribution: the NRSC Landslide Atlas of India (2023) mapped about 80,000 landslides (1998–2022); the North-West Himalaya account for about 66.5%, the North-East Himalaya about 18.8% and the Western Ghats about 14.7%.
Most exposed districts: the same atlas ranked 147 districts and placed Rudraprayag and Tehri Garhwal (Uttarakhand) at the top, followed by Thrissur, Rajouri, Palakkad and Poonch.
Recent cases: Kedarnath (June 2013) cloudburst and debris flow; Joshimath land subsidence (January 2023); the Wayanad (Kerala) landslides of 30 July 2024 at Mundakkai and Chooralmala, which killed more than 200 people.
Glacial hazards: the South Lhonak glacial lake outburst flood (GLOF) in Sikkim in October 2023 breached the Teesta III dam at Chungthang, showing a new Himalayan risk linked to glacier retreat.
4. Floods
Causes: heavy monsoon rain concentrated in a few months, low gradient and silting of Himalayan rivers, cyclones on the east coast, cloudbursts in hills, encroachment of floodplains and drainage congestion in cities.
Flood-prone area: the Rashtriya Barh Ayog (National Flood Commission, 1980) assessed about 40 million hectares as flood-prone; Assam, Bihar, Uttar Pradesh and West Bengal are the worst affected.
River behaviour: the Kosi, called the 'sorrow of Bihar', has shifted its course westward by more than 100 km over about two centuries; the 2008 breach at Kusaha (Nepal) moved it back into an old channel.
Brahmaputra: high sediment load, braiding and earthquake-loosened slopes cause annual floods and bank erosion, e.g. the shrinking of Majuli island.
Urban floods: Mumbai (26 July 2005, about 944 mm rain in 24 hours at Santacruz), Chennai (2015) and Kerala (August 2018) show the role of concrete surfaces, blocked drains and building on wetlands.
Measures: embankments, reservoirs, flood forecasting by the Central Water Commission, floodplain zoning (a 1975 model bill that few states adopted) and 'living with floods' approaches.
5. Droughts and heat waves
Types: meteorological (rainfall deficiency), hydrological (fall in surface and groundwater), agricultural (soil moisture too low for crops) and socio-economic drought.
IMD definition: a meteorological drought occurs when seasonal rainfall is less than 75% of the long-period average; a deficiency of more than 50% is severe drought.
Drought-prone belts: western Rajasthan and Kutch, the rain-shadow interior of Maharashtra (Marathwada, Vidarbha), Karnataka, Telangana and Rayalaseema, Bundelkhand and parts of Odisha (Kalahandi–Bolangir–Koraput).
Links with El Niño: many drought years (e.g. 1987, 2002, 2009, 2015) coincided with El Niño, though not every El Niño year is a drought year; the positive Indian Ocean Dipole can offset it.
Management: the Manual for Drought Management (2016, revised 2020), Drought Prone Areas Programme (1973), watershed development, crop insurance (PMFBY 2016) and MGNREGA works.
Heat waves: declared by IMD when the maximum temperature reaches at least 40 °C in the plains and departs from normal by 4.5 °C or more; Heat Action Plans began with Ahmedabad in 2013.
6. Cyclones and epidemics
Cyclones: the Bay of Bengal produces more and stronger cyclones than the Arabian Sea because of warmer water and the funnel-shaped head of the bay; Odisha super cyclone (1999), Phailin (2013), Fani (2019) and Amphan (2020) are key cases.
Success story: Odisha's cyclone shelters, early warning and community evacuation cut deaths from about 10,000 in 1999 to a few dozen in Phailin (2013), a model praised by the UN.
Epidemics: outbreaks spreading quickly in a region; geography matters through climate (vector-borne malaria and dengue rise after monsoon), density and sanitation; examples are the Surat plague (1994), Nipah virus in Kerala (2018 onwards) and COVID-19 (2020–22).
Legal frame: the Epidemic Diseases Act, 1897 (amended 2020) and the Disaster Management Act, 2005 were both used during COVID-19.
7. Institutions and policy
Disaster Management Act, 2005: created the NDMA (chaired by the Prime Minister), State and District Disaster Management Authorities, the National Institute of Disaster Management and the National Disaster Response Force.
National Policy on Disaster Management (2009) and the National Disaster Management Plan (2016, revised 2019) are aligned with the Sendai Framework's four priorities: understanding risk, governance, investment in resilience, and preparedness.
Hyogo to Sendai: the Hyogo Framework (2005–2015) was followed by the Sendai Framework (2015–2030), which has seven targets including reducing deaths, affected people and economic loss.
India's global role: India launched the Coalition for Disaster Resilient Infrastructure (CDRI) in 2019.
8. Maps and diagrams to draw
Multi-hazard map: draw India's outline; shade Zone V (whole North-East, Himalayan states, Kutch, Andaman and Nicobar) in dark hatching; mark the Brahmaputra and Ganga plains as flood belts; shade western Rajasthan, Marathwada and Rayalaseema as drought areas; mark the east coast as the cyclone coast with arrows from the Bay of Bengal.
Landslide map: mark the Himalayan arc and Western Ghats, and dot Rudraprayag, Tehri, Joshimath, Wayanad and Kedarnath.
Risk diagram: draw three overlapping circles labelled hazard, exposure and vulnerability, with the overlap marked 'disaster risk'.
Disaster cycle: a circle with four arrows: mitigation → preparedness → response → recovery → back to mitigation.
9. Using it in the exam
10 marks (150 words): define the hazard, give two causes, one Indian case with year and a small map; end with one mitigation step.
15 marks (200 words): add spatial distribution (map), human factors and an institutional response such as NDMA guidelines.
20 marks (250 words): cause → distribution (map) → case study → vulnerability analysis → policy (DM Act 2005, Sendai) → a forward-looking conclusion on resilience and climate change.
Keywords: vulnerability, exposure, resilience, early warning, Sendai Framework, community-based disaster management.
Quotable idea: Blaikie and colleagues argued that disasters are not natural events but the meeting of a natural hazard with socially produced vulnerability (paraphrase).
Update (2026): MGNREGA was repealed on 1 July 2026 and replaced by the Viksit Bharat – Guarantee for Rozgar and Ajeevika Mission (Gramin) Act, 2025 (VB-G RAM G), which raises the rural work guarantee from 100 to 125 days a year; MGNREGA job cards verified by e-KYC stay valid and ongoing works continue under the new Act.
| Hazard | Area or extent exposed | Most affected regions | Recent example |
|---|---|---|---|
| Earthquake | About 58.6% of land (moderate to very high intensity) | Himalaya, North-East, Kutch, Andaman and Nicobar | Bhuj, 2001 |
| Flood | About 40 million ha (12% of land) | Brahmaputra and Ganga plains, coastal deltas | Kerala, 2018 |
| Cyclone and tsunami | About 5,700 km of 7,516 km coastline | Odisha, Andhra Pradesh, West Bengal, Tamil Nadu, Gujarat | Amphan, 2020 |
| Drought | About 68% of cultivable area | Rajasthan, Marathwada, Rayalaseema, Bundelkhand | 2015 drought |
| Landslide | Himalaya and Western Ghats (about 80,000 mapped events, 1998–2022) | Uttarakhand, Himachal, Sikkim, Kerala | Wayanad, 2024 |
Mains points
- Questions often ask why the Himalaya are disaster-prone (tectonics plus fragile slopes plus unplanned development); always join physical causes with human causes such as road cutting and hydropower tunnels.
- Use the Odisha cyclone story (1999 versus Phailin 2013) as proof that preparedness reduces deaths; it fits almost every disaster-management answer.
- For floods, show the debate between embankments and 'living with rivers'; cite the Kosi and the Brahmaputra.
- Draw a small map in every answer: seismic zones, flood belts or landslide-prone districts earn marks quickly.
- Mention the Disaster Management Act 2005, NDMA, NDRF and the Sendai Framework, but do not let the answer become only a list of institutions.
- A common mistake is to treat hazard and disaster as the same; define both and introduce vulnerability early.
- Link recent cases (Joshimath 2023, Sikkim GLOF 2023, Wayanad 2024) to climate change and ecologically sensitive zones of the Western Ghats and Himalaya.
Did you know?
- Memory trick for the disaster cycle: 'My Pet Rabbit Runs' = Mitigation, Preparedness, Response, Recovery.
- The Kosi has migrated so far westward over about two centuries that its old channels form a fan of abandoned courses visible on satellite images of north Bihar.
Pollution, Land-use Change and Environmental Impact Assessment
Rapid urbanisation, industrialisation and intensive farming have made air, water and soil pollution India's most widespread ecological issue, with the Indo-Gangetic plain carrying the heaviest burden of air pollution. At the same time India's land-use pattern is shifting: net sown area has stayed near 140 million hectares while land under non-agricultural uses and fallows changes. Environmental Impact Assessment (EIA), made mandatory in India in 1994 and governed by the EIA Notification 2006, is the main tool to predict and reduce the damage of new projects before they are approved.
In simple words
Pollution means harmful substances entering air, water or soil faster than nature can clean them.
It is like a room where people keep throwing rubbish faster than anyone can sweep; soon the room becomes unlivable.
EIA is a check done before building a dam, mine or factory, to see what damage it may cause and how to reduce it, just as a doctor checks a patient before surgery.
UPSC asks about Indian pollution hotspots, changing land use and the strengths and weaknesses of EIA.
1. Concepts and definitions
Pollution: the Environment (Protection) Act, 1986 defines an environmental pollutant as any solid, liquid or gaseous substance present in such concentration as may be, or tend to be, injurious to the environment.
Point and non-point sources: a factory outfall or a sewage drain is a point source; run-off of fertiliser from fields or dust from roads is a non-point (diffuse) source and is harder to control.
Carrying capacity and assimilative capacity: the maximum load of waste an environment can absorb without lasting damage; pollution is the exceeding of assimilative capacity.
Environmental Kuznets Curve: the hypothesis (Grossman and Krueger, early 1990s) that pollution first rises and then falls as income grows, forming an inverted U; it is debated because many pollutants, such as carbon dioxide, do not clearly fall.
Land use and land cover: land cover is the physical surface (forest, water, bare soil); land use is the human purpose (farming, housing, industry); India reports land use in a nine-fold classification.
2. Air pollution
Sources: vehicles, coal power plants, industries, construction dust, burning of crop residue, household use of biomass for cooking, and brick kilns.
Why the Indo-Gangetic plain is worst: in winter, low mixing height, calm winds and temperature inversion trap pollutants; the Himalaya block their escape; stubble burning in Punjab and Haryana in October–November adds smoke carried south-east by north-westerly winds.
Monitoring: the CPCB runs the National Air Quality Monitoring Programme; the National Air Quality Index (launched 2014) has six categories from good to severe.
National Clean Air Programme (NCAP), 2019: first set a target of 20–30% cut in particulate matter by 2024 over 2017 levels; the target was later revised to up to 40% reduction in PM10, or meeting the national standard of 60 µg/m³, by 2025–26 for about 130 non-attainment cities, tracked on the PRANA portal.
Delhi-NCR measures: the Graded Response Action Plan (GRAP, notified 2017), the Commission for Air Quality Management (statutory under a 2021 Act) and BS-VI fuel nationwide from April 2020.
Progress check: independent trackers such as CREA's 'Tracing the Hazy Air' reports (2025, 2026) find that many NCAP cities still exceed the national PM10 standard, so results are mixed.
3. Water pollution
Sources: untreated urban sewage (the largest source), industrial effluents (tanneries of Kanpur, textile dyeing at Tiruppur, chemical units of Vapi and Ankleshwar), agricultural run-off and religious offerings.
Polluted river stretches: the CPCB's 2022 assessment identified 311 polluted river stretches on 279 rivers, with Maharashtra having the highest number.
Indicators: biochemical oxygen demand (BOD) above 3 mg/l marks a stretch unfit for bathing in CPCB's criteria; high faecal coliform shows sewage.
Groundwater contamination: natural arsenic in the Ganga–Brahmaputra delta (West Bengal, Bihar, Assam), fluoride in Rajasthan, Telangana and Gujarat, and uranium and nitrate in parts of Punjab.
Programmes: Ganga Action Plan (1985), National River Conservation Plan, Namami Gange (2014) and AMRUT for urban sewerage.
Marine pollution: oil spills (e.g. off Mumbai in 2010 and Chennai's Ennore in 2017), plastics and coastal effluents threaten fisheries and mangroves.
4. Soil, solid waste and noise
Soil pollution: excess and unbalanced fertiliser (high urea use pushes the N:P:K ratio far from the recommended 4:2:1), pesticides, industrial heavy metals and e-waste.
Solid waste: Indian cities generate large volumes of municipal waste, much of it dumped in open landfills such as Ghazipur and Bhalswa (Delhi) and Deonar (Mumbai), which catch fire and leach into groundwater.
Rules: Solid Waste Management Rules 2016, Plastic Waste Management Rules 2016 (ban on identified single-use plastic items from 1 July 2022), E-Waste (Management) Rules 2022 and extended producer responsibility.
Noise: the Noise Pollution (Regulation and Control) Rules, 2000 fix standards for industrial, commercial, residential and silence zones.
5. Changing patterns of land use
Nine-fold classification: forests; area under non-agricultural uses; barren and unculturable land; permanent pastures; land under miscellaneous trees; culturable waste; current fallows; other fallows; net sown area.
Current figures: Land Use Statistics for 2022–23 (Ministry of Agriculture) give a net sown area of about 140.7 million ha, a gross cropped area of about 219.4 million ha and a cropping intensity of about 156%.
Trends since 1950–51: net sown area rose sharply till about 1970 and has since plateaued near 140 million ha; area under forests and non-agricultural uses rose; barren land, culturable waste and permanent pastures fell.
Drivers: urban expansion onto prime farmland (e.g. around Delhi, Bengaluru and Hyderabad), infrastructure corridors, mining, decline of commons, and fallowing where farming is unprofitable.
Impacts: loss of fertile land, shrinking grazing land for pastoralists, loss of wetlands and urban heat islands.
Policy tools: land-use planning, wasteland mapping (the Wastelands Atlas by NRSC and the Department of Land Resources), and digitisation under the Digital India Land Records Modernisation Programme.
6. Environmental Impact Assessment
Definition: EIA is a process of identifying, predicting and evaluating the likely environmental and social effects of a proposed project before decisions are taken; it began with the US National Environmental Policy Act, 1969.
Indian history: river-valley projects were appraised from 1978–79; EIA became mandatory under the Environment (Protection) Act through the 1994 notification, replaced by the EIA Notification of 14 September 2006.
Categories: Category A projects are appraised at the centre by the MoEFCC's Expert Appraisal Committee; Category B projects by State-level authorities (SEIAA), with B1 needing a full EIA report and B2 exempted from it.
Four stages (2006): screening, scoping (terms of reference), public consultation (public hearing plus written comments) and appraisal.
Principles: the International Association for Impact Assessment lists principles such as purposive, rigorous, practical, participative, transparent, interdisciplinary and cost-effective; the core ideas are prevention, the precautionary principle, the polluter-pays principle and public participation.
Methods: checklists, the Leopold matrix (Leopold and others, US Geological Survey, 1971), overlay mapping with GIS (rooted in Ian McHarg's Design with Nature, 1969), network diagrams and cost-benefit analysis.
Wider forms: strategic environmental assessment (for policies and plans) and cumulative impact assessment (for many projects in one basin, e.g. hydropower dams on the Teesta or Alaknanda).
7. Debates on EIA in India
Weaknesses: reports prepared by consultants paid by the project proponent, copy-paste baseline data, weak public hearings, poor post-clearance monitoring and dilution through exemptions.
Draft EIA Notification 2020: proposed post-facto clearance and wider exemptions; it drew strong public objections and has not replaced the 2006 notification.
Courts: in Vanashakti v. Union of India (May 2025) the Supreme Court barred ex post facto environmental clearances; later review proceedings revisited that ruling, so students should check its present status.
Environmental management: beyond EIA it includes environmental management plans, ISO 14001 systems, environmental audit, green accounting and the National Green Tribunal (2010) for quick redress.
8. Maps and diagrams to draw
Air pollution map: shade the Indo-Gangetic plain from Punjab to West Bengal; show arrows of north-westerly winter winds from Punjab–Haryana towards Delhi; mark Delhi, Ghaziabad, Kanpur, Patna as hotspots.
Water pollution map: draw the Ganga and Yamuna with dots at Kanpur, Varanasi, Delhi; mark arsenic belt in the lower Ganga delta and fluoride areas in Rajasthan and Telangana.
EIA flow chart: project proposal → screening (A or B) → scoping → baseline study and draft EIA → public hearing → final EIA → appraisal → clearance with conditions → monitoring.
Land-use bar diagram: compare the nine land-use classes for 1950–51 and 2022–23 side by side.
9. Using it in the exam
10 marks: define the issue, give two causes, one Indian example with data and one remedy.
15 marks: add spatial pattern (map) and a programme such as NCAP or Namami Gange with its target.
20 marks: causes → spatial pattern (map) → impacts → policy and its gaps → way forward (e.g. strengthen EIA independence, airshed-level management).
Keywords: assimilative capacity, non-attainment city, airshed, BOD, precautionary principle, public hearing, cumulative impact.
Quotable idea: the Brundtland Report (1987) described sustainable development as meeting the needs of the present without compromising the ability of future generations to meet their own needs; EIA is a practical tool for that aim.
| Category | Appraised by | EIA report needed | Typical examples |
|---|---|---|---|
| A | Expert Appraisal Committee, MoEFCC (centre) | Yes, with public hearing | Large dams, big mines, thermal power plants above the set threshold |
| B1 | State Expert Appraisal Committee and SEIAA | Yes | Medium mines, medium industries |
| B2 | State Expert Appraisal Committee and SEIAA | No (exempt from EIA report) | Small projects listed as B2 |
| Indicator | Value | Trend since 1950–51 |
|---|---|---|
| Net sown area | About 140.7 million ha | Rose till about 1970, then near constant |
| Gross cropped area | About 219.4 million ha | Rising through multiple cropping |
| Cropping intensity | About 156% | Up from about 111% around 1950–51 |
Mains points
- For air pollution questions, explain the geography of the Indo-Gangetic plain in winter (inversion, low mixing height, Himalayan barrier, stubble smoke) instead of only listing sources.
- Quote NCAP's revised target and admit mixed results; balanced answers score better than praise or blame.
- For water pollution, separate sewage, industry and natural contamination (arsenic, fluoride) and map them.
- For land use, use the nine-fold classification and the 2022–23 figures, and show conversion of farmland near cities.
- For EIA, write the four stages, the A/B categories and three weaknesses, then suggest reforms such as independent accredited consultants and cumulative and strategic assessment.
- A common mistake is to confuse EIA (project level) with strategic environmental assessment (policy level).
- Connect to the Brundtland idea of sustainable development and the polluter-pays and precautionary principles in the conclusion.
Did you know?
- Memory trick for EIA stages: 'SSPA' = Screening, Scoping, Public consultation, Appraisal (think 'spa' for the environment).
Deforestation, Desertification and Soil Erosion
These three processes are linked forms of land degradation: removing forest exposes soil to erosion, and in drylands erosion and salinity lead to desertification. ISRO's Desertification and Land Degradation Atlas (2021) found about 97.85 million hectares, or 29.7% of India, degraded in 2018–19, of which 83.69 million hectares in drylands counted as desertification. The India State of Forest Report 2023 puts forest and tree cover at 25.17% of the country, still short of the 33% goal of the National Forest Policy, 1988.
In simple words
Deforestation is the clearing of forests, desertification is fertile dry land turning barren, and soil erosion is the washing or blowing away of the top soil.
Picture a hillside as a bed with a blanket: trees are the blanket, and once it is pulled off, rain and wind strip the mattress of soil.
Nearly one-third of India's land is degraded, which threatens farms, water and livelihoods.
UPSC asks for causes, regional patterns, data and conservation measures.
1. Concepts and definitions
Deforestation: the permanent conversion of forest land to other uses, or the long-term reduction of tree canopy below a threshold; FAO uses a canopy cover of 10% over 0.5 ha as the forest threshold.
Forest cover (India): the Forest Survey of India counts all land of 1 ha or more with tree canopy density above 10%, whatever its ownership or legal status; recorded forest area is land notified as forest in government records, so the two differ.
Land degradation: reduction or loss of the biological or economic productivity of land through erosion, salinisation, waterlogging, vegetation loss or other processes.
Desertification: the UN Convention to Combat Desertification (1994) defines it as land degradation in arid, semi-arid and dry sub-humid areas resulting from various factors, including climatic variations and human activities; it is not the spread of existing deserts.
Soil erosion: the detachment and transport of soil particles by water, wind, ice or gravity faster than new soil forms; soil formation is very slow, often taking centuries to make a few centimetres.
Environmental degradation: the general deterioration of the environment through depletion of air, water and soil resources, loss of biodiversity and pollution.
2. Forests and deforestation in India
ISFR 2023 (Forest Survey of India, released December 2024): forest cover about 7,15,343 km² (21.76%), tree cover about 1,12,014 km² (3.41%), total forest and tree cover about 8,27,357 km² (25.17%) of the geographical area.
Change since 2021: total forest and tree cover rose by about 1,445 km², mostly tree cover outside forests (about 1,289 km²), while forest cover rose only about 156 km².
Regional pattern: Madhya Pradesh has the largest forest and tree cover by area, followed by Arunachal Pradesh and Maharashtra; Mizoram and Lakshadweep have among the highest percentages; Haryana and Punjab have very low percentages.
Hotspots of loss: the North-East (shifting cultivation or jhum, plantations, infrastructure), mining belts of Jharkhand, Odisha and Chhattisgarh (e.g. Hasdeo Arand coalfield), and Western Ghats (plantations, hydropower, roads).
Causes: agricultural expansion, shifting cultivation with shortened cycles, mining, dams and roads, fuelwood and fodder collection, forest fires, encroachment and, historically, colonial timber extraction for railways.
Debates: critics argue that 'forest cover' includes plantations, orchards and tea gardens, so net gains can hide loss of natural forest; this is a debated point between FSI and independent researchers.
Laws and policies: Indian Forest Act 1927, Forest (Conservation) Act 1980 (amended in 2023 and renamed Van (Sanrakshan Evam Samvardhan) Adhiniyam), Forest Rights Act 2006, CAMPA Act 2016 for compensatory afforestation, Green India Mission (2014) and the National Forest Policy 1988 goal of 33% area under forest or tree cover.
People's movements: Chipko (Garhwal, 1973), Appiko (Uttara Kannada, 1983) and Joint Forest Management (from 1990) show that local communities are central to conservation.
3. Desertification and land degradation
Atlas data: the Desertification and Land Degradation Atlas of India (Space Applications Centre, ISRO, 2021) found degradation of 94.53 million ha (28.76%) in 2003–05, 96.40 million ha (29.32%) in 2011–13 and 97.85 million ha (29.7%) in 2018–19.
Desertification within it: 81.48 million ha (2003–05), 82.64 million ha (2011–13) and 83.69 million ha (2018–19) in drylands.
Leading process: water erosion is the biggest single process (about 11% of India's area in 2018–19), followed by vegetation degradation and wind erosion.
States: Rajasthan, Maharashtra, Gujarat, Karnataka, Ladakh, Jharkhand, Odisha, Madhya Pradesh and Telangana together hold most of the degraded land; Rajasthan has the largest area.
Processes in drylands: overgrazing removes grass cover; ploughing marginal land loosens soil; canal irrigation without drainage causes waterlogging and salinity (e.g. Indira Gandhi Canal command, Punjab–Haryana); wind then moves sand and forms dunes.
Salinity and alkalinity: large areas of Uttar Pradesh, Gujarat, Maharashtra, West Bengal and Rajasthan suffer from salt-affected soils, called usar or reh in the Ganga plain.
Ravines: the Chambal, Yamuna and Mahi ravines are gully erosion on a large scale, among the most striking badlands in India.
Responses: the Desert Development Programme (1977–78), the Central Arid Zone Research Institute at Jodhpur (CAZRI, 1959), shelterbelts and sand-dune fixing, and India's target, announced at UNCCD COP14 (Greater Noida, 2019), to restore 26 million ha of degraded land by 2030.
Green wall idea: the Aravalli Green Wall Project (launched 2023) proposes a green belt along the Aravalli range across Gujarat, Rajasthan, Haryana and Delhi to slow the eastward spread of degradation.
4. Soil erosion: processes and pattern
Water erosion stages: raindrop splash erosion → sheet erosion (thin uniform layer removed) → rill erosion (small channels) → gully erosion (deep channels) → ravines and badlands.
Wind erosion: deflation removes fine particles, abrasion sandblasts surfaces, and saltation, suspension and surface creep move grains; it is severe in western Rajasthan and Kutch.
Universal Soil Loss Equation: Wischmeier and Smith (USDA) expressed soil loss as A = R × K × LS × C × P (rainfall erosivity, soil erodibility, slope length and steepness, cover, and support practice); it shows why slope and cover matter most.
Scale: a widely cited estimate by Narayana and Ram Babu (1983) put soil erosion in India at about 5.3 billion tonnes a year; it is old, so use it with its date.
Regions: Shivalik foothills (choes of Punjab and Himachal), north-eastern hills under jhum, Western Ghats slopes, the Chotanagpur plateau, Chambal ravines and dry western Rajasthan.
Effects: loss of fertility, siltation of reservoirs (e.g. reduced live storage in many reservoirs), floods due to raised river beds, and lower farm incomes.
5. Soil conservation
Agronomic measures: contour ploughing, strip cropping, mulching, cover crops, crop rotation and conservation tillage.
Mechanical measures: bunding, terracing on hill slopes, check dams, gully plugging and ravine reclamation.
Biological measures: afforestation, shelterbelts, grassland management and controlled grazing.
Programmes: Soil Health Card scheme (2015), watershed development under PMKSY, the National Afforestation Programme and Nagar Van Yojana; examples of community success include Ralegan Siddhi and Hiware Bazar (Maharashtra) and Sukhomajri (Haryana).
6. Maps and diagrams to draw
Degradation map: outline India; shade western Rajasthan and Kutch (wind erosion and desertification), Chambal ravines (gully erosion), the North-East hills (jhum and water erosion), salinity patches in the Indira Gandhi Canal command and the Ganga plain; label Rajasthan as the state with the largest degraded area.
Forest map: shade the high forest belts of the North-East, Western Ghats, central India (Madhya Pradesh, Chhattisgarh, Odisha) and Andaman and Nicobar; mark Hasdeo Arand as a mining–forest conflict site.
Erosion sequence diagram: draw a slope in four panels: splash, sheet, rill and gully, each with arrows of runoff.
Conservation sketch: draw a hill slope with terraces, contour bunds and a check dam across a gully at the foot.
7. Using it in the exam
10 marks: define the process, give two causes and one Indian data point with year (ISFR 2023 or ISRO Atlas 2021).
15 marks: add a regional pattern map and one policy or community example.
20 marks: show the chain deforestation → erosion → degradation → desertification; give data, map, causes, impacts and a mix of agronomic, mechanical, biological and policy remedies.
Keywords: land degradation neutrality, UNCCD, shifting cultivation, ravines, USLE, watershed approach, compensatory afforestation.
Quotable idea: UNCCD stresses that desertification is caused by both climatic variation and human activity, so it is reversible with good land management (paraphrase).
| Period | Land degradation (million ha) | Share of geographical area | Desertification in drylands (million ha) |
|---|---|---|---|
| 2003–05 | 94.53 | 28.76% | 81.48 |
| 2011–13 | 96.40 | 29.32% | 82.64 |
| 2018–19 | 97.85 | 29.7% | 83.69 |
| Category | Area (km²) | Share of geographical area |
|---|---|---|
| Forest cover | 7,15,343 | 21.76% |
| Tree cover | 1,12,014 | 3.41% |
| Total forest and tree cover | 8,27,357 | 25.17% |
Mains points
- Always define desertification as per UNCCD (degradation of drylands), not as 'deserts expanding'; examiners notice this.
- Quote the ISRO Atlas 2021 trend (28.76% → 29.32% → 29.7%) and the ISFR 2023 totals with year and source.
- Show the causal chain linking deforestation, soil erosion and desertification; a flow diagram helps.
- Give region-specific causes: jhum in the North-East, overgrazing and canal salinity in Rajasthan, ravines in Chambal, mining in Chotanagpur.
- Balance state programmes with community successes (Chipko, Ralegan Siddhi, Sukhomajri) and Joint Forest Management.
- Mention the debate over counting plantations as forest cover to show critical thinking.
- End with India's 26 million ha restoration target by 2030 and land degradation neutrality.
Did you know?
- Memory trick for water-erosion stages: 'Some Soils Run Greedily' = Splash, Sheet, Rill, Gully.
- The Chambal ravines were once famous as hideouts of dacoits because the maze of gullies made pursuit almost impossible.
Agrarian and Industrial Unrest; Regional Disparities
Agrarian unrest in India grows out of small and fragmented holdings, indebtedness, price risk, water stress and land conflicts, while industrial unrest arises from wages, contract labour, closures and land acquisition for industry. Both are sharpened by regional disparities: the western and southern states and metropolitan cores have moved ahead, while much of the central and eastern belt lags. Geographers explain such gaps with Myrdal's cumulative causation, Hirschman's polarisation and trickle-down and Friedmann's core–periphery models.
In simple words
Agrarian unrest means farmers or farm workers protesting because farming no longer gives them a secure living; industrial unrest means workers or local people protesting against factories or their employers.
Think of a class where a few students get all the tuition and books: the gap grows each year, and the left-out students get angry.
Regional disparity is that gap between rich and poor regions of India.
UPSC asks for causes, examples, mapping of the gap and the theories that explain it.
1. Concepts and definitions
Agrarian unrest: organised or spontaneous protest by peasants, tenants or agricultural labourers against conditions of land ownership, rent, prices, debt or state policy.
Agrarian distress: the underlying condition of low and unstable farm incomes, rising costs and debt; farmer suicides recorded by the NCRB are its most tragic sign.
Industrial unrest: disputes between employers and workers (strikes, lockouts, gheraos) and conflicts between industry and local communities over land, water and pollution.
Regional disparity: differences in levels of income, infrastructure, human development and opportunities between regions; it can be inter-state, intra-state (e.g. Vidarbha within Maharashtra) or rural–urban.
Uneven development: David Harvey and Neil Smith (Uneven Development, 1984) argued that capitalism naturally concentrates investment in some places and abandons others.
2. Causes of agrarian unrest
Small holdings: the Agricultural Census 2015–16 found that 86.1% of holdings are small and marginal (below 2 ha) and the average holding was only 1.08 ha, limiting income and credit.
Debt and credit: dependence on moneylenders where institutional credit is weak; high input costs for seeds, fertilisers and pumps.
Price risk: volatile market prices, limited procurement at minimum support price outside a few states and crops (mainly rice and wheat in Punjab, Haryana, Madhya Pradesh and Chhattisgarh) and distress sales.
Water and climate: falling groundwater in Punjab, Haryana and Rajasthan, monsoon failure in rain-fed Vidarbha and Marathwada, and crop loss from unseasonal rain and heat.
Land issues: tenancy insecurity, incomplete land reforms, landlessness of Dalit and tribal labourers, and land acquisition for industry and infrastructure.
Regional hotspots of distress: Vidarbha and Marathwada (cotton and soybean, rain-fed), north Karnataka, Telangana, Punjab (debt and stagnating yields) and Bundelkhand.
3. Agrarian movements: Indian examples
Historical: the Telangana armed struggle (1946–51), the Tebhaga movement in Bengal (1946–47) over sharecroppers' share, and the Naxalbari uprising (1967, Darjeeling district) which gave rise to the Naxalite movement.
New farmers' movements (1980s): Shetkari Sanghatana of Sharad Joshi in Maharashtra, Bharatiya Kisan Union of Mahendra Singh Tikait in western Uttar Pradesh and Karnataka Rajya Raitha Sangha; they focused on prices and input subsidies rather than land, a shift analysed by scholars as the 'Bharat versus India' argument made by Sharad Joshi.
Farmers' protest of 2020–21: farmers, mainly from Punjab, Haryana and western Uttar Pradesh, camped at Delhi's borders against three farm laws passed in 2020; the laws were repealed in November–December 2021.
Left-wing extremism: the 'Red Corridor' across tribal and forest areas of Chhattisgarh, Jharkhand, Odisha, Maharashtra and Andhra Pradesh has roots in land alienation, displacement and lack of services; the number of affected districts has fallen sharply since 2010 according to the Ministry of Home Affairs.
4. Industrial unrest and land conflicts
Labour disputes: the Bombay textile strike (1982–83, led by Datta Samant) closed many mills and accelerated Mumbai's de-industrialisation; the Maruti Suzuki Manesar violence (2012) highlighted contract labour issues in the Gurugram–Manesar auto belt.
Causes: low wages, contractualisation, unsafe conditions, closures of 'sick' units, automation and weak trade unions in the informal sector, which employs the large majority of workers.
Land acquisition conflicts: Singur (Tata Nano plant, West Bengal, 2006–08), Nandigram (proposed chemical hub, 2007), POSCO steel project in Jagatsinghpur, Odisha (abandoned), and Niyamgiri (Vedanta bauxite mining, Odisha; the Supreme Court in 2013 left the decision to the gram sabhas, which rejected it).
Law: the Right to Fair Compensation and Transparency in Land Acquisition, Rehabilitation and Resettlement Act, 2013 replaced the Land Acquisition Act, 1894 and required consent and social impact assessment for many projects.
Labour codes: the Code on Wages (2019), Industrial Relations Code (2020), Code on Social Security (2020) and Occupational Safety, Health and Working Conditions Code (2020) replaced 29 central labour laws and came into force on 21 November 2025; trade unions criticise easier lay-off rules, so the issue is debated.
Industrial disasters: the Bhopal gas tragedy (December 1984, Union Carbide) and the Visakhapatnam LG Polymers styrene leak (May 2020) fuel local resistance to hazardous industry.
5. Regional disparities: pattern and measurement
Indicators: per capita net state domestic product, poverty, human development index, literacy, infant mortality, infrastructure (roads, power, banking) and industrial and urban share.
Leaders and laggards: Goa, Sikkim, Delhi, Telangana, Karnataka, Haryana, Tamil Nadu and Gujarat have high per capita incomes, while Bihar has the lowest, with Uttar Pradesh and Jharkhand also low (MoSPI state accounts).
Multidimensional poverty: NITI Aayog's discussion paper (January 2024) estimated that about 24.82 crore people escaped multidimensional poverty between 2013–14 and 2022–23, with the headcount falling from 29.17% to 11.28%; the largest numbers were in Uttar Pradesh, Bihar and Madhya Pradesh, which shows where poverty was concentrated; these years are estimates projected from NFHS rounds.
SDG India Index 2023–24 (NITI Aayog): India's composite score rose to 71; Kerala and Uttarakhand topped with 79 and Bihar ranked last with 57, a clear picture of the north–south and east–west gap.
Intra-state gaps: Vidarbha and Marathwada versus western Maharashtra; north Karnataka versus Bengaluru; Bundelkhand and Purvanchal versus western Uttar Pradesh; Saurashtra–Kutch versus the Ahmedabad–Vadodara–Surat belt; the KBK districts (Kalahandi–Bolangir–Koraput) of Odisha.
Core regions: the Mumbai–Pune, Delhi NCR, Bengaluru–Chennai, Ahmedabad–Surat and Hyderabad regions concentrate industry, services and migrants.
6. Causes and theories of regional disparity
Historical: colonial investment favoured port cities (Bombay, Calcutta, Madras) and plantation and raw-material regions; the zamindari system in the east was linked to lower agricultural investment (an argument by Banerjee and Iyer, 2005).
Physical: difficult terrain in hills, aridity in Rajasthan, flood-prone plains of Bihar and Assam raise costs.
Policy: the freight equalisation policy (1952–1993) is argued to have removed the advantage of mineral-rich eastern states; the Green Revolution concentrated gains in Punjab, Haryana and western Uttar Pradesh; post-1991 private investment followed infrastructure and skilled labour to the west and south.
Myrdal (1957, Economic Theory and Under-developed Regions): cumulative causation, in which growth in a core attracts capital and skilled labour (backwash effects) more than it spreads benefits (spread effects), so gaps widen without state action.
Hirschman (1958, The Strategy of Economic Development): unbalanced growth creates polarisation at first, but trickle-down effects eventually benefit the periphery.
Friedmann (1966, Regional Development Policy): core–periphery model in four stages, from isolated centres through a single strong core and secondary cores to an integrated space economy.
Williamson (1965): regional inequality first rises and then falls as a nation develops, an inverted-U pattern; Indian evidence after 1991 suggests divergence among states, which supports Myrdal more than Williamson, though this is debated.
Policy responses: Finance Commission transfers using income-distance criteria, special category status (now limited after the 14th Finance Commission), the Backward Regions Grant Fund (2007–15), the Aspirational Districts Programme (2018, 112 districts) and the Aspirational Blocks Programme (2023, 500 blocks).
7. Maps and diagrams to draw
Disparity map: outline India and shade states in three classes of per capita income or SDG score: high (Goa, Kerala, Tamil Nadu, Karnataka, Telangana, Gujarat, Maharashtra, Haryana, Punjab), medium and low (Bihar, Uttar Pradesh, Jharkhand, Madhya Pradesh, Odisha, Chhattisgarh, Assam).
Agrarian distress map: mark Vidarbha, Marathwada, north Karnataka, Telangana, Bundelkhand and Punjab; show the 2020–21 protest flows from Punjab and Haryana to Delhi's borders.
Conflict sites map: dot Singur, Nandigram, Niyamgiri, Jagatsinghpur (POSCO), Manesar and Bhopal.
Theory diagram: Friedmann's four stages as four boxes, or Myrdal's cumulative causation as a circle of arrows: new industry → jobs → more demand → more industry, with backwash arrows pulling labour from the periphery.
8. Using it in the exam
10 marks: define, give two causes and one recent example with year.
15 marks: add a map and one theory (Myrdal or Friedmann) applied to India.
20 marks: concept → pattern (map with data) → causes (historical, physical, policy) → theory → consequences (migration, unrest, extremism) → policy and way forward (balanced regional development, agro-processing, infrastructure in lagging regions).
Keywords: cumulative causation, backwash effect, core–periphery, agrarian distress, contractualisation, social impact assessment, aspirational districts.
Quotable idea: Myrdal held that the play of market forces normally tends to increase, rather than decrease, inequalities between regions (paraphrase).
| Thinker (work, year) | Core idea | Prediction for lagging regions | Indian illustration |
|---|---|---|---|
| Myrdal (1957) | Cumulative causation; backwash stronger than spread | Gap widens without state action | Bihar losing labour to Punjab, Delhi and Mumbai |
| Hirschman (1958) | Unbalanced growth; polarisation then trickle-down | Gap narrows later | Ancillary industries spreading around Pune and Chennai |
| Friedmann (1966) | Core–periphery in four stages | Integration in the final stage | Rise of secondary cores such as Hyderabad and Ahmedabad |
| Williamson (1965) | Inverted-U of regional inequality | Inequality first rises, then falls | Post-1991 divergence among states (debated) |
Mains points
- Link agrarian unrest to geography: rain-fed regions, groundwater decline, crop choice (cotton in Vidarbha) and holding size, not only to policy.
- Use well-dated examples: Naxalbari 1967, Shetkari Sanghatana and BKU in the 1980s, Singur and Nandigram 2006–08, Niyamgiri 2013, the farm-law protests 2020–21.
- For regional disparity, give data with year and source (NITI MPI 2024, SDG India Index 2023–24) and a choropleth map.
- Apply at least one theory (Myrdal, Hirschman, Friedmann) to Indian facts; examiners reward theory plus evidence.
- Show the consequences: inter-state migration, urban congestion, left-wing extremism and demands for new states or special status.
- Do not just list schemes; evaluate them, e.g. Aspirational Districts as a data-driven approach to the lagging periphery.
- Present industrial unrest in two forms: worker–employer disputes and community–industry land conflicts.
Did you know?
- Memory trick for regional theories in order of year: 'My Hat Will Fit' = Myrdal 1957, Hirschman 1958, Williamson 1965, Friedmann 1966.
Linking of Rivers, Sustainable Development and Globalisation
The Interlinking of Rivers (ILR) programme, based on the National Perspective Plan of 1980, proposes 30 links (14 Himalayan, 16 Peninsular) to move water from surplus to deficit basins; the Ken–Betwa link became the first to start, with its foundation stone laid on 25 December 2024. Sustainable development, defined by the Brundtland Report (1987), asks whether such projects, food security for a large population and economic growth can be achieved without exhausting natural capital. Globalisation since 1991 has raised India's growth and integration with the world economy but has also widened some regional and social gaps.
In simple words
River linking means joining rivers with canals so that water from flooded areas can reach dry areas.
It is like moving water from a full bucket to an empty one through a pipe, but the pipe passes through forests and villages, so it has costs.
Sustainable development means growing today without stealing from tomorrow, and globalisation means India trading, investing and connecting more with the world.
UPSC asks you to weigh benefits against ecological and social costs.
1. Interlinking of rivers: concept and history
Idea: transfer water from surplus basins (mainly Himalayan rivers such as the Brahmaputra and Ganga tributaries, and the Mahanadi and Godavari in the peninsula) to deficit basins (Cauvery, Pennar, Krishna, Sabarmati, western Rajasthan).
Early proposals: Sir Arthur Cotton suggested linking southern rivers for navigation in the 19th century; K.L. Rao proposed a Ganga–Cauvery link (1972); Captain Dinshaw Dastur proposed a 'Garland Canal' (1977), both judged impractical.
National Perspective Plan (1980): prepared by the then Ministry of Irrigation and the Central Water Commission; it has a Himalayan component (14 links) and a Peninsular component (16 links), 30 links in all.
Institutions: the National Water Development Agency (NWDA) was set up in 1982 to carry out surveys and feasibility studies; in 2012 the Supreme Court asked the government to implement the programme in a time-bound way through a special committee.
Progress (Parliament reply, 2025): pre-feasibility reports for all 30 links, feasibility reports for 24 links and detailed project reports for 11 links had been completed.
2. Key links
Ken–Betwa (Madhya Pradesh and Uttar Pradesh): the first link under implementation; the Daudhan dam on the Ken will send water through a link canal of about 221 km to the Betwa basin to serve drought-prone Bundelkhand; foundation stone laid at Khajuraho on 25 December 2024; estimated cost about ₹44,605 crore, funded 90% by the centre.
Concerns over Ken–Betwa: the dam submerges part of the Panna Tiger Reserve, affects gharial and vulture habitat and displaces villages; critics question whether the Ken really has surplus water, so this is a debated project.
Modified Parbati–Kalisindh–Chambal link: integrated with the Eastern Rajasthan Canal Project between Rajasthan and Madhya Pradesh.
Godavari–Cauvery link: proposed to move Godavari water south through the Krishna and Pennar basins to the Cauvery, involving Telangana, Andhra Pradesh, Karnataka and Tamil Nadu.
Par–Tapi–Narmada (Gujarat and Maharashtra): DPR completed by NWDA; it faced strong tribal opposition in south Gujarat over displacement.
Himalayan links: e.g. Manas–Sankosh–Teesta–Ganga and Kosi–Mechi; they involve Nepal, Bhutan and Bangladesh and are far from implementation.
3. Benefits and costs of river linking
Claimed benefits: the NWDA projects about 35 million ha of additional irrigation and about 34,000 MW of hydropower for the full plan, plus flood moderation, drinking water and inland navigation.
Ecological costs: submergence of forests and wildlife habitat, reduced flow to deltas and estuaries (risking salinity in the Sundarbans and Krishna–Godavari delta), loss of sediment, and mixing of aquatic species between basins.
Social costs: large-scale displacement, mostly of tribal and rural people, and the poor record of rehabilitation in projects such as Sardar Sarovar.
Political and legal issues: water is a state subject (Entry 17, State List), so inter-state consensus is hard; Himalayan links need neighbours' agreement; Bangladesh fears lower Ganga and Brahmaputra flows.
Debate: critics argue that the 'surplus–deficit' idea ignores ecological flows and that local options such as watershed management, rainwater harvesting and efficient irrigation are cheaper; supporters cite climate variability and India's low per capita storage.
4. Population explosion and food security
Population: India became the most populous country in 2023 according to UN estimates; Census 2011 counted 121.09 crore people; the next census (Census 2027) has the reference date 1 March 2027 (1 October 2026 for snow-bound areas).
Fertility transition: NFHS-5 (2019–21) reported a total fertility rate of 2.0, below replacement level (2.1), though Bihar (about 3.0), Meghalaya and Uttar Pradesh remained above it; this is why 'explosion' is now a regional, not national, issue.
Food security concept: FAO (World Food Summit, 1996) defines it as existing when all people, at all times, have physical and economic access to sufficient, safe and nutritious food to meet their dietary needs and food preferences for an active and healthy life.
Indian framework: the National Food Security Act, 2013 covers up to 75% of rural and 50% of urban population; under PMGKAY free foodgrains are given to about 81 crore beneficiaries, extended for five years from 1 January 2024.
Production: India is a leading producer of rice, wheat, pulses and milk, but nutrition outcomes lag: NFHS-5 found 35.5% of children under five stunted.
Global Hunger Index caution: the GHI 2025 (Concern Worldwide and Welthungerhilfe) ranked India 102nd of 123 countries with a 'serious' score of 25.8; the Government of India has criticised the index's methodology (it uses child stunting, wasting and mortality, and an undernourishment estimate), so present it with this caveat.
Geographical threats: groundwater depletion in the north-west, soil degradation, climate change (heat stress on wheat, erratic monsoon), and loss of farmland to cities.
5. Sustainable growth and development
Definition: the Brundtland Commission's report Our Common Future (1987) defined sustainable development as development that meets the needs of the present without compromising the ability of future generations to meet their own needs.
Milestones: Stockholm Conference (1972), Rio Earth Summit and Agenda 21 (1992), the Millennium Development Goals (2000–15), the 17 Sustainable Development Goals (2015–30) and the Paris Agreement (2015).
Weak versus strong sustainability: weak sustainability allows natural capital to be replaced by man-made capital; strong sustainability (associated with Herman Daly) holds that critical natural capital cannot be replaced.
India's commitments: the updated NDC (2022) aims to reduce the emissions intensity of GDP by 45% by 2030 from 2005 levels and to reach about 50% of installed electric capacity from non-fossil sources by 2030; India's net-zero target year is 2070 (announced at COP26, 2021).
Indian programmes: National Action Plan on Climate Change (2008, eight missions), Mission LiFE (Lifestyle for Environment, 2021–22), green hydrogen mission (2023) and the SDG India Index of NITI Aayog.
Gandhian thought: Gandhi's view that the earth provides enough to satisfy every man's need, but not every man's greed, is widely quoted; the exact wording is reported second-hand, so cite it as a commonly attributed idea.
6. Environmental awareness
Constitutional base: Article 48A (state shall protect the environment) and Article 51A(g) (duty of citizens), both added by the 42nd Amendment (1976); courts read the right to a clean environment into Article 21.
Movements: Chipko (1973), Silent Valley (Kerala, late 1970s–1983, which saved the forest from a hydro project), Narmada Bachao Andolan (from 1985), and Appiko (1983).
Judicial activism: M.C. Mehta cases (Ganga pollution, Delhi CNG transition), the T.N. Godavarman case on forests (from 1995) and the National Green Tribunal (2010).
Education: the Supreme Court in 1991 (M.C. Mehta) directed environment education at all levels; NGOs such as CSE and community groups spread awareness.
7. Globalisation and the Indian economy
Meaning: the growing integration of economies through trade, capital flows, technology and migration; David Harvey (1989) called its effect 'time–space compression', and Thomas Friedman (The World Is Flat, 2005) used Bengaluru's IT industry as his example.
Indian reforms of 1991: liberalisation, privatisation and globalisation (LPG) after the balance-of-payments crisis: lower tariffs, end of most industrial licensing, opening to FDI, rupee devaluation.
Gains: faster growth, the rise of IT and business services (Bengaluru, Hyderabad, Pune, Chennai, Gurugram), auto clusters (Chennai, Pune, Manesar), pharmaceuticals (Hyderabad, Ahmedabad), and growth of ports and special economic zones (SEZ Act, 2005).
Geography of globalisation: investment has favoured coastal and metropolitan regions with skills and infrastructure, deepening the core–periphery gap that Friedmann's model predicts.
Costs and critiques: Joseph Stiglitz (Globalization and Its Discontents, 2002) argued that rapid opening can hurt developing countries; in India, critics point to jobless growth in manufacturing, informalisation, farm distress from global price swings and pollution havens.
Recent trends: 'Make in India' (2014), production-linked incentive schemes (2020 onwards), the shift of supply chains under 'China plus one', and new trade agreements such as with the UAE (2022) and the United Kingdom (signed 2025).
8. Maps and diagrams to draw
ILR map: outline India; draw the Himalayan component as arrows from the Brahmaputra and Ganga eastern tributaries westward and southward; draw the Peninsular component as arrows from the Mahanadi and Godavari south to the Krishna, Pennar and Cauvery; mark Ken–Betwa in Bundelkhand with the Daudhan dam and Panna Tiger Reserve.
Sustainability diagram: three overlapping circles labelled economy, society and environment, with sustainable development at the centre.
Globalisation map: mark IT hubs (Bengaluru, Hyderabad, Pune, Chennai, NCR), major ports (JNPA, Mundra, Chennai, Visakhapatnam) and SEZ clusters along the coast.
9. Using it in the exam
10 marks: define, give the key fact (30 links of NPP 1980; Brundtland definition; LPG 1991) and one benefit and one cost.
15 marks: add a map and one case (Ken–Betwa, Bengaluru IT, or Punjab's groundwater and food security).
20 marks: concept → map → benefits → ecological, social and political costs → alternatives → balanced conclusion linking to the SDGs.
Keywords: surplus and deficit basin, ecological flow, inter-basin transfer, food security, strong sustainability, time–space compression, core–periphery.
Quotable idea: the Brundtland definition of sustainable development is the safest exact definition to quote in this chapter.
| Aspect | Arguments for | Arguments against |
|---|---|---|
| Water and food | More irrigation for drought-prone basins; drinking water for Bundelkhand and the south | Local watershed and efficient irrigation may be cheaper and faster |
| Floods | Moderates floods in Brahmaputra and Ganga basins | Floods are short peaks; storing them needs huge dams |
| Ecology | Can revive dry rivers | Submergence of forests (Panna Tiger Reserve), lower flows to deltas, species mixing |
| People | Rural livelihoods in deficit regions | Displacement of tribal and rural communities |
| Politics | National integration of water resources | Water is a state subject; neighbours (Nepal, Bangladesh) involved |
Mains points
- For river linking, always state the NPP 1980 structure (30 links: 14 Himalayan, 16 Peninsular) and the Ken–Betwa status with date and cost, then weigh costs and benefits.
- Draw the ILR map; even a rough sketch with arrows from surplus to deficit basins earns marks.
- Food-security answers should cover availability, access, absorption (nutrition) and stability, using NFHS-5 data and NFSA 2013; quote GHI only with the government's methodological objection.
- Treat 'population explosion' carefully: national TFR is below replacement (NFHS-5), so stress regional differences (Bihar, Uttar Pradesh) and the demographic dividend.
- For sustainable development, quote the Brundtland definition exactly and link to India's NDC, SDG India Index and Mission LiFE.
- For globalisation, give a balanced view: gains in services and exports versus regional concentration, informal work and farm distress; apply the core–periphery idea.
- A common mistake is writing river linking as purely an engineering topic; examiners expect ecological flow, displacement and federal issues.
Did you know?
- Memory trick for the NPP split: 'Himalaya is higher but has fewer links' = 14 Himalayan, 16 Peninsular.
- The Ken–Betwa link was the first river-linking project in India to move from paper to construction, more than four decades after the 1980 plan.
UPSC Previous Year Questions: Contemporary Issues
From 2014 to 2026 UPSC asked 34 question parts worth 515 marks from Contemporary Issues, all in Paper II. The most-asked topics are environmental hazards and disaster management (10 parts: landslides, cloudbursts, avalanches, GLOFs, earthquakes, drought, floods) and pollution and land-use change (9 parts: air pollution in the Ganga plain and Delhi, solid and industrial waste, river and soil pollution), followed by regional disparities and agrarian unrest (7), desertification and soil erosion (4) and river linking and sustainable development (4). Every question below has a model answer written to the UPSC word limit, with a map or diagram.
In simple words
First read the question and write your own answer in the time you would get in the exam, about 7 minutes for 10 marks, 9 for 15 marks and 11 for 20 marks.
Then compare it with the model answer: check the introduction, the Indian examples and data with year and source, the map or diagram, and the conclusion.
Note what you missed in a notebook and revise those points from the chapter notes before trying the next question.
1. Environmental Hazards and Disaster Management in India
Example 1 (UPSC 2026, 10 marks): Disaster risk reduction and community resilience are the two pillars that need to be prioritized in the flood prone areas of India. Critically analyse.
Paper and question: Paper II, Q5(e)
Approach: Define both pillars, show why each is needed in India's flood belts with examples, then critically weigh their limits; a map of flood-prone India supports the answer.
Disaster risk reduction (DRR) means preventing new risk and reducing existing risk, while community resilience is the capacity of local people to absorb, recover from and adapt to a shock. The Rashtriya Barh Ayog (1980) assessed about 40 million ha as flood-prone, mostly in Assam, Bihar, Uttar Pradesh and West Bengal.
DRR pillar: Gilbert White (1945) showed that embankments alone attract settlement onto floodplains and raise losses, as the Kosi breach at Kusaha (2008) proved. DRR therefore needs floodplain zoning, Central Water Commission forecasts, raised plinths and the National Disaster Management Plan (2016, revised 2019) aligned with the Sendai Framework.
Resilience pillar: communities act first, as with the Mising stilt houses of Assam and village task forces in Bihar and Odisha.
Critique: the pillars depend on each other; few states adopted the 1975 model floodplain zoning bill, and without funds and land-use rules ‘resilience’ can shift the burden onto the poor.
Map: Outline map of India shading the Brahmaputra and Ganga flood belts, marking the Kosi, Kusaha breach site and the coastal deltas of Odisha and Andhra Pradesh.
A ‘living with floods’ approach that joins structural DRR with empowered communities is the balanced way forward.
Example 2 (UPSC 2025, 20 marks): Explain the factors that contribute to droughts in India with specific reference to food production, distribution and availability. Can Indian agricultural policies resolve the issue?
Paper and question: Paper II, Q7(a)
Approach: Explain the physical and human factors of drought, trace their effects on production, distribution and availability of food, then assess whether agricultural policies can resolve the problem; draw a drought-prone areas map.
Drought is a prolonged shortage of water relative to normal; IMD treats a monsoon deficit of more than 10% over the country as a deficient year. About three-quarters of India's rain falls between June and September, and nearly half the net sown area is rainfed, so food security rides on the monsoon.
Physical factors: monsoon variability, breaks and delayed onset; El Niño years such as 2002, 2009 and 2015 were drought years, though a positive Indian Ocean Dipole can offset it; rain-shadow areas such as Marathwada, Rayalaseema, north interior Karnataka and western Rajasthan are chronically dry.
Human factors: groundwater over-extraction in Punjab and Haryana, water-intensive sugarcane in Marathwada, loss of tanks and wetlands, and soil degradation lower the buffer against dry spells.
Effect on food: production falls (the 2002 drought cut kharif foodgrains sharply), distribution is strained when states compete for stocks, and availability drops for landless and tribal households whose purchasing power collapses, making drought a crisis of access, as Amartya Sen argued for famines.
Policy response: PMKSY (2015, ‘more crop per drop’), PMFBY crop insurance (2016), the Manual for Drought Management (2016, revised 2020), millets promotion, NICRA climate-resilient varieties, FCI buffer stocks and free grain to about 81 crore people under PMGKAY have helped; foodgrain output reached a record 357.73 million tonnes in 2024–25 (Ministry of Agriculture final estimate).
Diagram: Map of India shading drought-prone western Rajasthan, Kutch, Marathwada, Vidarbha, Rayalaseema, north interior Karnataka and Bundelkhand, with arrows showing the monsoon and rain-shadow lee of the Western Ghats.
Assessment: policies can manage, not abolish, drought: MSP and free power still favour water-guzzling paddy, and insurance claims are slow. Crop diversification, watershed development and groundwater pricing are needed to make Indian agriculture truly drought-proof.
Example 3 (UPSC 2021, 20 marks): Landslide is a major problem in Himalayan region. Discuss its causes and mitigation measures.
Paper and question: Paper II, Q2(a)
Approach: Define landslides, classify their natural and human causes in the Himalaya with recent cases, then give structural and non-structural mitigation; draw a map of landslide-prone zones.
A landslide is the downslope movement of rock, debris or earth under gravity when shear stress exceeds the shear strength of slope material. The NRSC Landslide Atlas of India (2023) mapped about 80,000 landslides between 1998 and 2022, with about 66.5% in the North-West Himalaya and 18.8% in the North-East Himalaya.
Geological causes: the Himalaya is a young fold mountain still rising as the Indian plate pushes north; thrust zones such as the Main Central Thrust and Main Boundary Thrust have crushed, jointed rocks; frequent earthquakes (Zones IV and V) loosen slopes.
Climatic causes: intense monsoon rain and cloudbursts saturate soil and raise pore-water pressure, as in Kedarnath (2013) and Himachal Pradesh (2023); freeze–thaw at high altitude and glacier retreat expose unstable moraines.
Human causes: road widening by unscientific cutting and blasting (Char Dham road), hydropower tunnels, deforestation, unplanned towns on old landslide debris, as in the Joshimath subsidence of January 2023.
Structural mitigation: retaining walls, rock bolting, wire-mesh and shotcrete, surface and sub-surface drainage, check dams on torrents and bio-engineering with grasses and bamboo.
Non-structural mitigation: the GSI's national landslide susceptibility mapping, the NDMA National Landslide Risk Management Strategy (2019), rainfall-threshold early warning, building codes and carrying-capacity limits for hill towns, and slope zoning to keep settlement off unstable slopes.
Map: Outline map of India shading the landslide-prone Himalayan arc from Jammu and Kashmir to Arunachal Pradesh and the Western Ghats, marking Kedarnath, Joshimath, Malin (Pune) and Wayanad.
Since the Himalaya cannot be made stable, the goal is to live safely with it: eco-sensitive road design, local early warning and enforcement of zoning, linked to climate adaptation.
Example 4 (UPSC 2021, 10 marks): Describe the problems of cloud burst in India giving suitable examples.
Paper and question: Paper II, Q5(b)
Approach: Define a cloudburst, explain why it occurs in Indian mountains, describe its problems with named examples and end with remedies; a sketch of orographic uplift helps.
A cloudburst is extreme, localised rainfall; IMD uses a working threshold of about 100 mm or more in an hour over a small area of roughly 20–30 km². It occurs when moist monsoon air is forced up steep slopes (orographic uplift), forming tall cumulonimbus clouds that release their water suddenly.
Problems: flash floods and debris flows in narrow valleys, landslides, destruction of roads, bridges and small hydro projects, loss of crops and pilgrim and tourist lives; forecasting is hard because the event is too small for most radars and models.
Examples: Leh (August 2010) mudflows struck a cold desert town; Kedarnath (June 2013) combined heavy rain with the Chorabari lake burst; Himachal Pradesh saw repeated cloudbursts in 2023; Dharali in Uttarkashi was buried by a flash flood in August 2025.
Diagram: Cross-section of a Himalayan valley showing moist south-westerly winds rising up the slope, a towering cumulonimbus cloud and a flash flood rushing down the narrow valley onto riverside settlements.
Remedies: Doppler weather radars in the Himalaya, nowcasting, ban on building on riverbeds and fans, and community warning systems; warming of the atmosphere may make such events more frequent.
Example 5 (UPSC 2020, 15 marks): Avalanche is a major hazard in the Himalayas. What are its causes and mitigation measures?
Paper and question: Paper II, Q6(b)
Approach: Define avalanche, explain terrain, snow and weather causes with Himalayan examples, then structural and non-structural mitigation; sketch the avalanche path zones.
An avalanche is the rapid downslope slide of a mass of snow, often mixed with ice, rock and debris. In India it threatens the Greater and Trans-Himalaya of Jammu and Kashmir, Ladakh, Himachal Pradesh, Uttarakhand, Sikkim and Arunachal Pradesh, especially soldiers, road workers and winter travellers.
Terrain causes: slopes of roughly 30°–45° are most prone; open, treeless slopes and gullies channel snow, while convex slopes create tension.
Snow and weather causes: heavy fresh snowfall overloading old snow, weak layers (depth hoar), sudden warming or rain that wets the pack, strong winds building cornices and wind slabs; human triggers include blasting, road cutting and skiers. Western disturbances bring the heaviest winter snow.
Examples: the Siachen avalanche of February 2016 buried ten soldiers; the Mana (Chamoli) avalanche of February 2025 hit a Border Roads Organisation camp; Zojila, Rohtang and Gurez are recurring hotspots.
Diagram: Profile of a mountain slope labelled starting zone (30°–45°), track and run-out zone, with snow sheds over the road and snow fences and terraces in the starting zone.
Structural mitigation: snow fences, snow bridges and nets in the starting zone, afforestation, deflecting dams and wedges, galleries and sheds over roads, and controlled artificial release by explosives.
Non-structural mitigation: avalanche forecasts and hazard mapping by the DRDO's Defence Geoinformatics Research Establishment (formerly SASE, Manali), closure of passes on warnings, training of troops and locals, and all-weather tunnels such as Atal Tunnel (2020) that bypass Rohtang.
Combining forecasting with engineering and safe route planning can reduce avalanche deaths sharply.
Example 6 (UPSC 2020, 20 marks): Demarcating the seismic zones of India, suggest suitable interventions required in most sensitive seismic zones for sustainable human settlements.
Paper and question: Paper II, Q7(a)
Approach: Demarcate India's seismic zones on a map with their tectonic basis, then suggest building, planning and institutional interventions for Zones V and IV that keep settlements safe and sustainable.
India lies on the northward-moving Indian plate, which collides with the Eurasian plate along the Himalaya; NDMA estimates that about 59% of India's land is prone to moderate to severe earthquakes. The Bureau of Indian Standards map (IS 1893 Part 1, 2002, retained in 2016) divides the country into four seismic zones, II to V.
Zone V (very high): the whole North-East, parts of Jammu and Kashmir, Himachal Pradesh and Uttarakhand, the Rann of Kutch, north Bihar and the Andaman and Nicobar Islands. Zone IV (high): the rest of the Himalayan belt, Delhi, the northern Ganga plain and parts of the west coast. Zone III (moderate): much of the peninsula's margins, Mumbai, Chennai and Kolkata. Zone II (low): the stable interior of the Deccan and parts of Rajasthan.
Debate: a 2025 BIS revision proposing a new highest zone for the Himalayan arc has been debated, and intraplate quakes at Koyna (1967) and Latur (1993) warn that no zone is risk-free.
Building interventions: strict enforcement of IS 1893, IS 4326 and IS 13920 (ductile detailing), retrofitting of schools and hospitals, and revival of proven traditional designs such as Assam-type timber houses, Kashmir's dhajji dewari and Himachal's kath-kuni.
Planning interventions: seismic microzonation (done for Delhi, Guwahati and Sikkim among others), avoiding liquefiable soils and steep slopes, height limits and open spaces in dense cores, and carrying-capacity studies for hill towns.
Institutional interventions: NDMA earthquake guidelines (2007), owner-driven reconstruction as after Bhuj (2001), the Uttarakhand earthquake early warning system with IIT Roorkee, mason training and community drills.
Map: Outline map of India with Zones II to V shaded in graded tones, marking Bhuj, Latur, Koyna, Uttarkashi, Shillong and the Main Boundary Thrust.
Sustainable settlements in high zones depend less on predicting earthquakes than on safe construction and land use; the maxim ‘earthquakes do not kill, buildings do’ should guide policy.
Example 7 (UPSC 2019, 10 marks): Examine the problems of Glacial Lake Outburst Flood (GLOF) in India.
Paper and question: Paper II, Q5(e)
Approach: Define GLOF, explain why the risk is rising in the Indian Himalaya, give cases and problems, and close with mitigation; a sketch of a moraine-dammed lake helps.
A glacial lake outburst flood (GLOF) is the sudden release of water from a lake dammed by moraine or ice, triggered by avalanches, landslides, heavy rain, earthquakes or seepage. As Himalayan glaciers retreat with warming, such lakes grow; NDMA has identified 189 high-risk lakes out of about 7,500 in the Indian Himalaya (2024).
Problems: floods arrive within minutes in narrow valleys, carrying boulders that destroy bridges, roads, villages and hydropower dams; the South Lhonak GLOF (Sikkim, October 2023) breached the Teesta III dam at Chungthang, and the Chorabari lake burst worsened the Kedarnath disaster (2013).
Transboundary risk: some lakes lie in Tibet or Nepal, such as Parechu, whose 2005 outburst flooded the Sutlej in Himachal Pradesh, so data sharing is difficult.
Diagram: Sketch of a retreating glacier with a moraine-dammed lake, a breach in the moraine and a flood wave moving down the valley towards a dam and village.
Mitigation: NDMA GLOF guidelines (2020) and a ₹150 crore programme (2024) for Himachal Pradesh, Uttarakhand, Sikkim and Arunachal Pradesh for lake lowering, automatic monitoring and early warning, plus hazard zoning before siting new dams.
Example 8 (UPSC 2019, 15 marks): Describe the altitudinal and spatial geo-environmental hazards in the Himalayas.
Paper and question: Paper II, Q8(b)
Approach: Classify Himalayan hazards first by altitude belts and then by west–central–east regions with named examples; a profile diagram of altitudinal zones carries the answer.
The Himalaya is a young, tectonically active and steep mountain system with heavy monsoon rain and glaciers, so its geo-environmental hazards vary both with height and along its 2,400 km length.
Altitudinal pattern: the high glacial belt (above about 4,500 m) faces avalanches, glacial lake outburst floods, rockfall and permafrost thaw; the middle belt (about 1,500–4,500 m) suffers landslides, cloudbursts, debris flows and forest fires; the Shiwalik and foothill belt has flash floods, gully erosion (the choes of Punjab and Himachal) and shifting rivers in the Terai. Earthquakes affect all belts.
Western Himalaya: Jammu and Kashmir and Ladakh face snow avalanches on Zojila and Gurez, the Kashmir earthquake (2005) and cold-desert flash floods such as Leh (2010).
Central Himalaya: Uttarakhand and Himachal Pradesh face cloudbursts and landslides (Kedarnath 2013, Himachal 2023), the Chamoli rock–ice avalanche (2021) and the Joshimath subsidence (2023).
Eastern Himalaya: Sikkim and Arunachal Pradesh receive very heavy rain, with landslides, the South Lhonak GLOF (2023) and great earthquakes such as Assam (1950) and Sikkim (2011).
Diagram: Profile of the Himalaya from the Terai to the Trans-Himalaya marking the Shiwalik, Lesser and Greater Himalaya and the hazards of each belt, with a strip map below showing western, central and eastern sectors.
Road building, hydropower and tourism have amplified these natural hazards, so hazard zonation and carrying-capacity limits must guide Himalayan development.
Example 9 (UPSC 2015, 15 marks): Indian island territories are vulnerable to the sea level rise. Explain.
Paper and question: Paper II, Q7(c)
Approach: Explain sea level rise, then show why Lakshadweep, Andaman and Nicobar and delta islands are vulnerable through physical, ecological and socio-economic factors, ending with adaptation; map the island territories.
Sea level rise results from thermal expansion of warming oceans and melting of glaciers and ice sheets; the IPCC Sixth Assessment Report (2021) found that global mean sea level rose about 0.20 m between 1901 and 2018, at an accelerating rate of about 3.7 mm a year in 2006–2018.
Lakshadweep: 36 small coral islands of about 32 km² in all, mostly only 1–2 m above sea level, so even small rises bring erosion and flooding; drinking water depends on a thin freshwater lens that is turning saline; coral bleaching (2010, 2016) weakens the reefs that protect the islands, and Cyclone Ockhi (2017) showed the danger of storm surges.
Andaman and Nicobar: low coasts and mangrove villages are exposed; the 2004 earthquake made parts of the southern islands subside, so sea water now enters former farmland in Car Nicobar and around Port Blair, adding tectonic to climatic rise.
Delta islands: in the Sundarbans, Ghoramara has shrunk sharply and Lohachara is reported to have disappeared, creating climate migrants.
Socio-economic effects: loss of coconut groves and land, fisheries decline, damage to tourism, and the costly shift of settlements and infrastructure on islands with no hinterland.
Map: Map of India with insets of Lakshadweep (Kavaratti, Minicoy) and Andaman and Nicobar (Port Blair, Car Nicobar), and the Sundarbans with Ghoramara marked.
Adaptation: integrated island management plans of the Island Development Agency (2017), mangrove and reef restoration, desalination (the low temperature thermal desalination plant at Kavaratti, 2005), setback lines under CRZ and Island Protection Zone rules, and global emission cuts.
Example 10 (UPSC 2014, 15 marks): Differentiate between the 'intensity' and 'magnitude' of an earthquake and explain its varying impact in different parts of India.
Paper and question: Paper II, Q7(b)
Approach: Distinguish magnitude from intensity with their scales, then explain why the same earthquake has different effects across India's regions with examples; a sketch of isoseismal lines helps.
Magnitude measures the energy released at the focus; it has one value per earthquake and is measured on the logarithmic Richter scale (Charles Richter, 1935), where each whole number means about ten times greater wave amplitude and about 32 times more energy, now largely replaced by the moment magnitude scale (Hanks and Kanamori, 1979).
Intensity measures the shaking and damage felt at a particular place; it varies with distance, geology and building quality and is graded on the Modified Mercalli scale (I–XII) or the MSK-64 scale used in Indian seismic zoning.
Himalaya and North-East: plate collision gives great earthquakes, such as Assam (1950, about magnitude 8.6) and Sikkim (2011), whose impact multiplies through landslides on steep slopes.
Ganga plain: thick, water-saturated alluvium amplifies waves and causes liquefaction, so the 1934 Bihar–Nepal quake and the 2015 Nepal quake caused high intensity far from the epicentre; Delhi in Zone IV faces similar risk.
Kutch and peninsula: the Bhuj earthquake (2001, about Mw 7.7) caused liquefaction and wide destruction in Gujarat, while the moderate Latur (Killari) quake of 1993 killed thousands because heavy stone-and-mud houses collapsed at night; the Koyna quake (1967) is linked by many to the reservoir.
Diagram: Map of concentric isoseismal lines around the Bhuj epicentre showing intensity falling with distance, beside a bar showing one magnitude value.
Hence a lower-magnitude earthquake can be more destructive than a stronger one, which is why building codes and soil studies matter as much as the earthquake itself.
2. Pollution, Land-use Change and Environmental Impact Assessment
Example 11 (UPSC 2026, 20 marks): Why is it difficult to improve the quality of air during the winter season in the Gangetic plain? Critically evaluate with suitable examples.
Paper and question: Paper II, Q7(a)
Approach: Explain the meteorological, topographic and source factors that make winter air worst in the Ganga plain, give city examples, and critically evaluate policy responses; draw a map of the plain with wind and smoke arrows.
The Indo-Gangetic plain, home to about two-fifths of India's people, records the country's worst winter air; Delhi remained the world's most polluted capital in IQAir's 2024 report, and Kanpur, Lucknow, Patna and Ghaziabad also cross ‘severe’ levels between November and January.
Meteorology: long winter nights cool the ground, producing a temperature inversion that lowers the mixing height to a few hundred metres; winds are calm, and moisture from western disturbances forms fog that turns into smog.
Topography: the plain is a closed bowl bounded by the Himalaya in the north and the peninsular uplands in the south, so north-westerly winds carry smoke south-eastwards along the plain without dispersing it.
Sources: vehicles, coal power plants, brick kilns and industries operate all year, but winter adds paddy stubble burning in Punjab and Haryana (October–November), biomass and coal burning for heating, Diwali firecrackers, and secondary aerosols formed from farm ammonia.
Policy: the National Clean Air Programme (2019), the Graded Response Action Plan (2017), the Commission for Air Quality Management (statutory under a 2021 Act), BS-VI fuel from April 2020, LPG under Ujjwala (2016) and peripheral expressways that divert trucks around Delhi.
Critical evaluation: Punjab's farm fires fell to 5,114 in 2025, 53% below 2024 (state and CAQM data), yet November 2025 stayed among the most polluted months of recent years, showing that local, year-round sources and weather dominate. Measures are seasonal and city-based, whereas the problem is a regional airshed spanning several states.
Map: Map of the Indo-Gangetic plain marking Punjab–Haryana fire zones, north-westerly wind arrows towards Delhi, Lucknow, Kanpur and Patna, the Himalayan barrier and a small inset of an inversion layer capping a city.
Lasting improvement needs an airshed-wide plan with clean cooking and heating, power-plant controls and crop diversification, not winter-only emergency steps.
Example 12 (UPSC 2024, 20 marks): Industrial waste is diversified. Discuss the potentials and challenges associated with it.
Paper and question: Paper II, Q6(a)
Approach: Classify the diverse industrial wastes with Indian sources, then discuss their potential as resources in a circular economy and the environmental, technical and governance challenges; map major industrial waste hotspots.
Industrial waste is the solid, liquid or gaseous residue of manufacturing, mining and power generation. It is highly diverse: fly ash from coal power plants (about 270 million tonnes in 2021–22, CEA), steel slag, red mud from alumina refineries (Damanjodi, Lanjigarh), phosphogypsum from fertiliser plants (Paradeep), mine overburden, hazardous chemical and pharmaceutical sludge, and e-waste.
Potential as resource: in a circular economy waste becomes raw material. Fly ash goes into bricks, blended cement and road embankments, with over 90% reported as utilised; steel slag has been used to build roads (a CSIR–CRRI steel slag road at Hazira, Surat); red mud and phosphogypsum can make bricks and cement; high-calorific waste is co-processed in cement kilns; e-waste yields gold, copper and rare earths.
Economic and spatial gains: industrial symbiosis, as at Kalundborg (Denmark), cuts costs; eco-industrial parks and extended producer responsibility under the E-Waste (Management) Rules 2022 create green jobs.
Environmental challenges: ash dyke breaches (Sasan, Singrauli, 2020) bury fields; effluents from clusters such as Vapi and Ankleshwar contaminate groundwater; informal e-waste recycling at Seelampur (Delhi) exposes workers to lead and mercury; legacy hazardous waste from the Bhopal (1984) plant took four decades to be incinerated at Pithampur.
Governance challenges: weak data, too few treatment, storage and disposal facilities, poor enforcement of the Hazardous and Other Wastes Rules 2016, and small units unable to afford clean technology.
Map: Map of India marking Singrauli and Korba (fly ash), Damanjodi and Lanjigarh (red mud), Paradeep (phosphogypsum), Vapi and Ankleshwar (chemical effluents), Jamshedpur and Bhilai (slag) and Seelampur and Moradabad (e-waste).
The way forward is ‘waste as resource’: mandatory utilisation targets, cluster-level common facilities, formalisation of recyclers and strict polluter-pays enforcement, turning a liability into an asset.
Example 13 (UPSC 2023, 20 marks): Examine the environmental challenges caused by the solid waste in metropolitan regions of India and discuss the efforts to overcome it.
Paper and question: Paper II, Q2(a)
Approach: State the scale of urban solid waste, examine its environmental challenges in metropolitan regions with named dumpsites, then discuss legal, programme and community efforts and their gaps; map the major landfills.
Municipal solid waste is the household, commercial and institutional refuse of towns. Indian urban areas generated about 1.6 lakh tonnes a day in 2020–21 (CPCB annual report), and metropolitan regions such as Delhi, Mumbai, Bengaluru and Chennai produce the largest share, rising with income and consumption.
Land and fire: unsegregated waste piles into legacy dumpsites such as Ghazipur, Bhalswa and Okhla (Delhi), Deonar (Mumbai) and Perungudi (Chennai); a slope collapse at Ghazipur (2017) killed two people, and fires at Deonar (2016) and Brahmapuram, Kochi (2023) blanketed cities in toxic smoke.
Air, water and climate: burning releases dioxins and particulates; leachate pollutes groundwater and rivers such as the Yamuna; decomposing organic waste emits methane, a potent greenhouse gas.
Urban flooding and health: plastics choke drains, as in the Mumbai deluge of 2005; open dumps breed vectors of dengue and leptospirosis, and waste pickers work without protection.
Efforts: the Solid Waste Management Rules 2016, now replaced by the SWM Rules 2026 (in force from 1 April 2026) with mandatory four-stream segregation into wet, dry, sanitary and special-care waste; Swachh Bharat Mission–Urban (2014) and SBM-U 2.0 (2021), which funds bio-mining of legacy dumps; the single-use plastic ban (1 July 2022) and extended producer responsibility; Swachh Survekshan rankings in which Indore leads through door-to-door segregated collection.
Community models: Pune's SWaCH waste-picker cooperative and decentralised composting in Alappuzha show that local systems work better than distant landfills.
Map: Map of India marking major metros and their dumpsites (Ghazipur, Bhalswa, Deonar, Perungudi, Brahmapuram) and Indore as the model city.
Gaps: weak segregation, low processing, waste-to-energy plants that burn wet waste poorly, and thin municipal finances. Segregation at source, composting and formal roles for waste pickers can turn metros towards ‘zero landfill’.
Example 14 (UPSC 2022, 10 marks): Why has extreme particulate pollution remained a festering issue in Delhi NCR region?
Paper and question: Paper II, Q1(b)
Approach: Explain why particulate pollution persists in Delhi NCR through geographic, source and governance factors in a compact answer; a sketch map of the NCR airshed helps.
Delhi NCR regularly records PM2.5 far above the national standard of 40 µg/m³ (annual), and Delhi was named the world's most polluted capital in IQAir's 2024 report. The problem festers because geography, sources and governance reinforce one another.
Geography: a landlocked site in the Ganga plain with winter inversions, calm winds and low mixing height; north-westerly winds bring stubble smoke from Punjab and Haryana in autumn, and dust from the Thar arrives in summer.
Sources: over a crore registered vehicles, construction and road dust, industries and brick kilns in the NCR, coal power plants within the region, waste burning and firecrackers.
Governance: air crosses the boundaries of Delhi, Haryana, Uttar Pradesh and Rajasthan, but action is fragmented; the Graded Response Action Plan (2017) acts only after levels spike, and the Commission for Air Quality Management (2021) has limited enforcement capacity.
Map: Sketch map of NCR with Delhi at the centre, wind arrows from Punjab–Haryana, and Gurugram, Noida, Ghaziabad, Faridabad and nearby power plants marked.
A permanent fix needs year-round, airshed-wide control of all sources, not seasonal emergency bans.
Example 15 (UPSC 2020, 10 marks): Discuss the methods of crop residue management in rural India to reduce pollution.
Paper and question: Paper II, Q1(c)
Approach: Explain why residue is burnt, then classify in-situ, ex-situ and preventive management methods with Indian schemes and data; a flow diagram of residue uses helps.
Crop residue burning is common in the rice–wheat belt of Punjab, Haryana and western Uttar Pradesh, where combine harvesting leaves loose paddy straw and the window before wheat sowing is only two to three weeks. Punjab recorded 5,114 farm fires in 2025, 53% fewer than in 2024 (state and CAQM data).
In-situ methods: Happy Seeder and Super Seeder sowing wheat into standing stubble, mulching, and the bio-decomposer developed by IARI (Pusa) that rots straw in the field, all subsidised under the central Crop Residue Management scheme (2018).
Ex-situ methods: baling straw for biomass power plants, compressed biogas plants under SATAT (2018), co-firing of biomass pellets in thermal power plants, cardboard and paper making, and cattle feed.
Preventive methods: short-duration paddy varieties such as PR 126 instead of long-duration ones, crop diversification away from paddy, and awareness drives.
Diagram: Flow chart from paddy straw to three branches: in-situ (Happy Seeder, decomposer, mulch), ex-situ (power, biogas, pellets, paper) and prevention (short-duration varieties, diversification).
Lasting success needs assured markets for straw and incentives for farmers, so that managing residue becomes cheaper than burning it.
Example 16 (UPSC 2019, 15 marks): Give a reasoned account of high level of pollution in North Indian cities as compared to South Indian cities.
Paper and question: Paper II, Q7(b)
Approach: Give reasons, physical and human, why north Indian cities are more polluted than south Indian ones, with named cities, and note exceptions; a comparative map of India is essential.
North Indian cities such as Delhi, Ghaziabad, Kanpur, Lucknow, Patna and Varanasi regularly record PM2.5 levels several times higher than Chennai, Bengaluru, Kochi or Thiruvananthapuram, and most of India's cities in IQAir's global list of the most polluted lie in the Indo-Gangetic plain.
Physical reasons: the north is a landlocked plain enclosed by the Himalaya, where winter temperature inversion, calm winds and fog trap pollutants; western disturbances add moisture that forms smog, and the Thar sends dust in summer. Southern cities are coastal or on plateaus, with sea breezes, higher mixing heights, a warmer winter without strong inversion, and rain from both monsoons that washes the air.
Human reasons: paddy stubble burning in Punjab and Haryana, a dense belt of coal power plants and brick kilns along the Ganga plain, heavier use of biomass for cooking and winter heating, very high population density and older vehicles; the south has a higher share of LPG use and a more service-based economy.
Exceptions: southern industrial pockets such as Manali (Chennai) and Visakhapatnam also suffer, and Bengaluru's traffic congestion is worsening, so the gap is not absolute.
Map: Map of India with graded circles of annual PM2.5 for Delhi, Kanpur, Patna, Lucknow, Mumbai, Hyderabad, Bengaluru, Chennai and Kochi, the Himalayan barrier, winter wind arrows over the plain and sea-breeze arrows on the southern coasts.
Conclusion: geography decides how well a city disperses its emissions; since northern cities cannot change their setting, they must cut emissions harder through the National Clean Air Programme (2019) and regional airshed planning.
Example 17 (UPSC 2018, 10 marks): Make a critical appraisal of the factors affecting river water quality in India.
Paper and question: Paper II, Q5(c)
Approach: Critically appraise point, non-point, flow-related and natural factors behind poor river water quality with Indian data and examples, and judge the policy response; a sketch of the Ganga–Yamuna hotspots helps.
River water quality is judged by dissolved oxygen, biochemical oxygen demand (BOD) and faecal coliform; the CPCB's 2022 assessment found 311 polluted river stretches on 279 rivers, with Maharashtra having the most.
Urban sewage: the largest factor; CPCB's 2021 inventory put urban sewage generation at about 72,368 million litres a day against treatment capacity of about 31,841, so most sewage enters rivers untreated, as in the Yamuna below Delhi.
Industrial effluents and farm runoff: tanneries at Kanpur, sugar and distillery units in western Uttar Pradesh, and fertiliser and pesticide runoff from irrigated plains.
Low flow: dams and canals divert water, so the lean-season river cannot dilute waste.
Natural and cultural factors: geogenic arsenic in the Ganga delta, mining silt, and immersion of idols and cremation waste.
Diagram: Sketch of the Ganga and Yamuna marking Delhi, Agra, Kanpur and Varanasi as hotspots.
Appraisal: Namami Gange (2014) has added sewage capacity, but faecal coliform stays high; treatment, reuse and ecological flows must go together.
Example 18 (UPSC 2017, 15 marks): What do you understand by soil pollution? Delineate the areas vulnerable to it in India and suggest remedial measures.
Paper and question: Paper II, Q6(c)
Approach: Define soil pollution, delineate vulnerable regions of India by cause (agrochemical, industrial, mining, irrigation-induced, geogenic, urban), and suggest remedial measures; draw a map of the vulnerable areas.
Soil pollution is the build-up of toxic chemicals, salts, heavy metals or pathogens in soil to levels that harm its fertility, organisms, crops and human health through the food chain and groundwater.
Agrochemical zones: Punjab, Haryana and western Uttar Pradesh use fertilisers in a skewed NPK ratio and heavy pesticide doses; residues and nitrates have built up in soils of the Malwa region, where a link with high cancer incidence is alleged but debated.
Irrigation-induced zones: waterlogging and salinity (usar, reh) in the Indira Gandhi Canal command, the Chambal and Sharda Sahayak commands and parts of Haryana.
Industrial and mining zones: the Vapi–Ankleshwar chemical belt (Gujarat), Patancheru (Telangana), chromium waste at Ranipet (Tamil Nadu) and Kanpur, chromite mining at Sukinda (Odisha), and coal and iron ore belts of Jharia, Singrauli, Bellary and Goa.
Geogenic and urban: arsenic carried by irrigation water into soils of West Bengal and Bihar, fluoride in Rajasthan, and landfill zones around metros.
Map: Map of India shading the Punjab–Haryana agrochemical belt and canal-command salinity patches, and marking Vapi, Ankleshwar, Patancheru, Ranipet, Kanpur, Sukinda, Jharia, Singrauli, Bellary and the arsenic belt of the lower Ganga.
Remedial measures: balanced fertiliser use guided by the Soil Health Card scheme (2015), neem-coated urea, integrated pest management, natural and organic farming, gypsum for sodic soils and drainage for waterlogged land, effluent treatment and zero liquid discharge in industrial clusters, mine reclamation, and bioremediation and phytoremediation of contaminated sites.
Since soil forms over centuries but can be poisoned in decades, prevention and a national soil-quality standard should be priorities.
Example 19 (UPSC 2015, 10 marks): Explain how change in land use can promote eco-development at different levels in the country.
Paper and question: Paper II, Q5(d)
Approach: Define eco-development, then show how planned land-use change promotes it at national, regional, village and urban levels with Indian examples; a diagram of the levels helps.
Eco-development, a concept associated with Maurice Strong and Ignacy Sachs in the 1970s, means development that uses local resources in harmony with ecology. Planned land-use change, shifting land from degrading to restorative uses, is its main tool.
National level: the National Forest Policy (1988) aims at one-third of land under forest or tree cover against 25.17% in ISFR 2023; India pledged at UNCCD COP14 (2019) to restore 26 million ha of degraded land by 2030.
Regional level: watershed programmes under PMKSY and the Aravalli Green Wall Project (2023) convert wasteland and eroded slopes into forest and pasture.
Village level: Ralegan Siddhi and Hiware Bazar (Maharashtra) and Sukhomajri (Haryana) used grazing bans, check dams and afforestation to revive farming.
Urban level: green belts, the Nagar Van Yojana (2020) and protection of the East Kolkata Wetlands treat sewage naturally.
Diagram: Pyramid of four levels (national, regional, village, urban) with one land-use change and example at each.
Success depends on community participation and secure land rights, not on targets alone.
3. Deforestation, Desertification and Soil Erosion
Example 20 (UPSC 2026, 15 marks): Deforestation in the upper reaches of a river augments the magnitude of soil erosion. Elaborate your answer citing the example of any North Indian river.
Paper and question: Paper II, Q7(b)
Approach: Explain step by step how forest loss in a catchment's upper reaches multiplies soil erosion, then elaborate with the Alaknanda (upper Ganga) case and its downstream effects; draw a catchment cross-section.
The upper reaches of a river are steep, high-rainfall catchments where forest acts as a sponge. Removing it raises soil erosion because, in the Universal Soil Loss Equation of Wischmeier and Smith, the cover factor rises sharply when canopy and litter are lost.
Mechanism: without canopy, raindrops strike bare soil directly (splash erosion); litter and roots that bind soil disappear; infiltration falls and overland flow rises, cutting rills and gullies; slopes lose root strength, so landslides multiply; peak discharge rises and sediment yield climbs.
The Alaknanda case: commercial felling and road building in the Garhwal Himalaya in the 1960s left slopes bare. In July 1970 a cloudburst-fed flood on the Alaknanda swept away bridges and the village of Belakuchi and dumped silt into the Upper Ganga Canal at Haridwar. Villagers linked the flood to deforestation, which inspired the Chipko movement at Reni (1974) and Mandal.
Downstream effects: sediment shortens the life of reservoirs such as Tehri, raises riverbeds and worsens floods in the Ganga plain, while debris-laden floods recurred at Kedarnath (2013) and Chamoli (2021).
Diagram: Two cross-sections of a Himalayan valley side by side: a forested slope with interception, infiltration and clear water, and a deforested slope with splash, rills, gullies, landslides and a silt-laden river.
Response: a ban on green felling above 1,000 m in Uttarakhand's hills (1980), catchment-area treatment, and community forestry such as Sukhomajri (Haryana), which cut silt into Chandigarh's Sukhna Lake, show that protecting upper catchments is the cheapest way to save soil and water downstream.
Example 21 (UPSC 2025, 15 marks): What are the causes and consequences of land degradation due to desertification in India? Examine with reference to various regional issues.
Paper and question: Paper II, Q7(b)
Approach: Define desertification with ISRO atlas data, explain natural and human causes and consequences, and examine them region by region (Thar, Kutch, Deccan, Chotanagpur, Ladakh, North-East); draw a degradation map.
The UNCCD (1994) defines desertification as land degradation in arid, semi-arid and dry sub-humid areas caused by climatic variations and human activities. The ISRO Desertification and Land Degradation Atlas (2021) found 97.85 million ha, or 29.7% of India, degraded in 2018–19, of which 83.69 million ha was in drylands; water erosion was the leading process.
Thar and Kutch: overgrazing, dune reactivation and wind erosion in western Rajasthan; salinity and waterlogging in the Indira Gandhi Canal command; the invasive Prosopis juliflora has degraded the Banni grassland of Kutch.
Deccan: water erosion and loss of soil moisture in Marathwada and north Karnataka, worsened by sugarcane and groundwater mining.
Chotanagpur and central India: open-cast coal and iron mining, deforestation and gullying in Jharkhand and Odisha; the Chambal ravines in Madhya Pradesh.
Ladakh and the North-East: frost action and vegetation loss in the cold desert; shortened jhum cycles cause erosion in the north-eastern hills.
Consequences: falling yields and fodder, distress migration from Bundelkhand, dust storms such as those of May 2018 in Rajasthan and Uttar Pradesh, loss of habitat for the Great Indian Bustard, and silting of tanks and reservoirs.
Map: Map of India shading wind erosion in the Thar and Kutch, salinity in canal commands, water erosion in the Deccan and Chotanagpur, ravines along the Chambal, jhum areas in the North-East and frost-affected Ladakh.
India aims to restore 26 million ha by 2030 (UNCCD COP14, 2019); success depends on region-specific action such as shelterbelts in the Thar, watershed work in the Deccan and mine reclamation in Jharkhand.
Example 22 (UPSC 2022, 10 marks): The process of desertification leads to soil desiccation and soil loss. Explain.
Paper and question: Paper II, Q1(d)
Approach: Explain the chain from vegetation loss to soil drying (desiccation) and then to soil loss by wind and water, with Indian examples and data; a flow diagram of the feedback loop helps.
Desertification is land degradation in drylands; the ISRO Atlas (2021) found 29.7% of India degraded in 2018–19, with water erosion the leading process, followed by vegetation degradation and wind erosion.
Soil desiccation: when overgrazing, felling or over-cultivation strip vegetation, bare soil heats up, evaporation rises and organic matter, which holds moisture, oxidises; soil structure collapses and a surface crust forms. Jule Charney (1975) argued that higher albedo of bare land can reduce rainfall, a debated feedback that makes drying self-reinforcing.
Soil loss: dry, loose particles are lifted by wind (deflation) in the Thar, while a crusted surface sheds intense monsoon showers as runoff, cutting rills and gullies, as in the Chambal ravines; capillary rise leaves salts in irrigated pockets.
Diagram: Loop diagram: vegetation loss → bare soil → heating and evaporation → desiccation and crusting → wind and water erosion → lower fertility → less vegetation.
Breaking the loop through shelterbelts, mulching and grazing control, as practised by CAZRI (Jodhpur), restores moisture and halts soil loss.
Example 23 (UPSC 2015, 15 marks): How does climate change affect the process of desertification of India?
Paper and question: Paper II, Q4(b)
Approach: Explain the pathways by which climate change intensifies desertification in India (temperature, rainfall variability, extremes, glacier and sea-level change, feedbacks), region by region, and close with adaptation; map India's drylands.
Desertification is caused by both climatic variations and human activities (UNCCD, 1994). Climate change acts as a ‘threat multiplier’: the IPCC Special Report on Climate Change and Land (2019) concluded that warming is already worsening land degradation in drylands, which cover more than two-thirds of India.
Higher temperature: warmer air raises evapotranspiration, drying soils faster in western Rajasthan, Gujarat and the rain-shadow Deccan; more frequent heat waves stress vegetation.
Erratic monsoon: fewer rainy days but more intense downpours mean longer dry spells and more erosive storms, so drylands suffer both drought and water erosion, the largest degradation process in the ISRO Atlas (2021).
Cryosphere and coasts: glacier retreat threatens meltwater-fed farming in cold-desert Ladakh; sea level rise and storm surges salinise coastal soils of Gujarat, the Sundarbans and Odisha.
Feedback: degraded soils lose carbon and vegetation, adding greenhouse gases and raising surface heating, which further dries the land.
Map: Map of India shading arid, semi-arid and dry sub-humid zones, with arrows showing warming in the Thar, rain-shadow areas of the Deccan, Ladakh's cold desert and salinising coasts.
Adaptation: the National Action Plan on Climate Change (2008) and its National Mission for Sustainable Agriculture, drought-tolerant millets, watershed development, the land degradation neutrality target of 26 million ha by 2030 and the Aravalli Green Wall must be scaled up to keep climate change from turning degraded land into desert.
4. Agrarian and Industrial Unrest; Regional Disparities
Example 24 (UPSC 2024, 20 marks): India has wide-ranging regional disparities in economic development. Explain the patterns, implications and challenges.
Paper and question: Paper II, Q3(a)
Approach: Describe the inter-state, intra-state and rural–urban patterns of disparity with current data, then explain their implications and the challenges of reducing them, linking to Myrdal and Friedmann; draw a choropleth map of India.
Regional disparity is the uneven spread of income, infrastructure and human development across space. Gunnar Myrdal's theory of cumulative causation (1957) explains how growing cores draw capital and labour from lagging peripheries (backwash effects); Indian states have largely diverged since 1991, a debated finding.
Inter-state pattern: a prosperous west and south (Goa, Maharashtra, Gujarat, Karnataka, Tamil Nadu, Telangana, Kerala) and the north-west (Punjab, Haryana, Delhi) contrast with a lagging east and centre (Bihar, Jharkhand, Uttar Pradesh, Madhya Pradesh, Odisha) and parts of the North-East. NITI Aayog's National MPI (2023) put the multidimensional poverty headcount at 33.76% in Bihar against 0.55% in Kerala (NFHS-5 data), and the SDG India Index 2023–24 scored Kerala and Uttarakhand 79 against Bihar's 57.
Intra-state and rural–urban patterns: Vidarbha and Marathwada lag behind western Maharashtra; the Kalyana-Karnataka region needed special status under Article 371J (2012); Saurashtra trails the Ahmedabad–Vadodara corridor; and rural incomes trail urban ones everywhere, while metros such as Mumbai, Bengaluru and the NCR form cores.
Implications: large migration from Bihar and eastern Uttar Pradesh to Delhi, Punjab, Surat and Mumbai; demands for new states (Telangana, 2014; Vidarbha); Left-wing extremism in deprived tribal belts; and fiscal friction, as southern states object that Finance Commission criteria reward population growth.
Challenges: capital follows agglomeration and skilled labour; weak governance and infrastructure in lagging states; and demographic divergence (TFR about 3.0 in Bihar against 1.8 in Kerala, NFHS-5).
Policies: Finance Commission equalisation transfers, the Aspirational Districts (2018) and Aspirational Blocks (2023) programmes, PM-DevINE for the North-East (2022) and the Purvodaya plan for eastern states (2024).
Map: Choropleth map of India by state per capita income or MPI headcount, with arrows of migration from Bihar and Uttar Pradesh to Delhi, Punjab, Mumbai and Surat.
Balanced development needs place-based investment in the east and centre, as Friedmann's model implies, so that secondary cores emerge beyond the existing metropolitan regions.
Example 25 (UPSC 2020, 15 marks): What kind of skill promotion programmes have been initiated for job deficient regions in India? Explain.
Paper and question: Paper II, Q8(c)
Approach: Identify India's job-deficient regions, then explain national and region-targeted skill programmes (Skill India, PMKVY, DDU-GKY with Roshni and Himayat, Udaan, LWE ITIs, RSETIs, PM Vishwakarma) and assess them; map the target regions.
Job-deficient regions are areas where local employment cannot absorb the labour force, causing distress migration: Bihar, eastern Uttar Pradesh, Jharkhand and western Odisha, the Left-wing extremism belt, Jammu and Kashmir, and the North-East.
National framework: the Skill India Mission and the National Policy for Skill Development and Entrepreneurship (2015) set up the Ministry of Skill Development and Entrepreneurship and the National Skill Development Corporation; PMKVY (2015, now in its fourth phase from 2023) gives short-term certified training, with Pradhan Mantri Kaushal Kendras planned in every district.
Rural poor: Deen Dayal Upadhyaya Grameen Kaushalya Yojana (DDU-GKY, 2014) offers placement-linked training to poor rural youth; its sub-schemes Roshni targets LWE-affected districts and Himayat targets Jammu and Kashmir. Rural Self Employment Training Institutes run by banks train youth for self-employment.
Region-specific schemes: Udaan (2011), a special industry initiative for Jammu and Kashmir graduates; a central scheme to build ITIs and skill development centres in LWE-affected districts; and skilling projects for the North-East and aspirational districts, which use the SANKALP programme (2018) to strengthen district skill planning.
Traditional crafts: PM Vishwakarma (2023) trains and credits artisans such as carpenters and potters, important in lagging rural areas.
Map: Map of India shading job-deficient states and the LWE belt, marking Jammu and Kashmir (Himayat, Udaan) and the North-East, with arrows of out-migration to Delhi, Mumbai, Surat and Punjab.
Assessment: evaluations point to low placement rates, a mismatch between courses and local demand, and limited reach to women. Linking skills to local clusters, apprenticeships and industry in these regions would reduce migration more than generic training.
Example 26 (UPSC 2017, 15 marks): Identify the Naxal-affected areas in India and discuss their socio-economic problems.
Paper and question: Paper II, Q2(b)
Approach: Identify the Naxal-affected belt with current MHA data and a map, then discuss the socio-economic problems that both feed and result from the insurgency, ending with the policy response.
Naxalism, or Left-wing extremism (LWE), began with the Naxalbari uprising (1967, Darjeeling district). The affected ‘Red Corridor’ has shrunk sharply: MHA reported LWE-affected districts falling from 126 in 2018 to 18 in April 2025 and 11 in October 2025, with only three ‘most affected’ districts, Bijapur, Sukma and Narayanpur in Chhattisgarh.
Affected areas: the Dandakaranya forests of south Chhattisgarh (Bastar), Gadchiroli (Maharashtra) and Malkangiri (Odisha); the Andhra–Odisha border; the Chotanagpur plateau of Jharkhand, including the Saranda forest of West Singhbhum; and earlier pockets in Bihar (Gaya, Aurangabad) and Jangalmahal in West Bengal.
Socio-economic problems: the belt is mainly tribal, forested and mineral-rich; land alienation and displacement by mines and dams without fair rehabilitation; denial of forest rights before the Forest Rights Act (2006) and weak use of PESA (1996); exploitation by traders in tendu leaf and minor forest produce; high poverty; and few roads, schools, hospitals or banks.
Problems caused by the conflict: violence against civilians and security forces, destruction of schools and roads, a halt to development projects, and tribal people caught between both sides.
Map: Map of India shading the LWE belt from south Chhattisgarh and Gadchiroli through Malkangiri to West Singhbhum, marking Bijapur, Sukma, Narayanpur and Naxalbari.
Response: the National Policy and Action Plan (2015) and SAMADHAN strategy (2017) combine security with roads, mobile towers, Eklavya schools and banking, and the government set 31 March 2026 as its target to end LWE. Lasting peace needs land rights, PESA and tribal-centred development.
Example 27 (UPSC 2017, 15 marks): Farmers' suicide is one of the major agrarian problems in India. Bring out its causes and suggest the remedial measures with special reference to Maharashtra, Andhra Pradesh and Punjab.
Paper and question: Paper II, Q4(b)
Approach: Give the scale with NCRB data, explain general causes and then the specific causes in Maharashtra, Andhra Pradesh and Punjab, and suggest remedies; map the distress districts.
Farmers' suicides are the starkest sign of agrarian distress. NCRB's Accidental Deaths and Suicides in India 2023 recorded 10,786 suicides in the farm sector (4,690 farmers and 6,096 agricultural labourers), with Maharashtra reporting the largest share, followed by Karnataka.
General causes: small holdings (86.1% small and marginal, Agricultural Census 2015–16), rainfed farming exposed to drought, rising input costs, volatile prices, debt to private moneylenders, crop failure from pests, and weak insurance and social support.
Maharashtra: in Vidarbha and Marathwada, rainfed cotton and soybean on black soils face erratic rain, the pink bollworm's resistance to Bt cotton and price crashes, while costly inputs push farmers into debt.
Andhra Pradesh: in Anantapur and other Rayalaseema districts, groundnut and cotton fail in drought and borewells run dry; tenant farmers, who cultivate much of the coastal delta land, cannot get bank credit or crop insurance because they lack title.
Punjab: in the Malwa districts of Bathinda, Mansa and Sangrur, Green Revolution yields have plateaued, costs of machinery and inputs are high, groundwater is falling, and debts to commission agents (arhtiyas) mount; the whitefly attack on cotton (2015) triggered a wave of suicides.
Map: Map of India marking Vidarbha and Marathwada (Maharashtra), Anantapur (Andhra Pradesh) and Bathinda, Mansa and Sangrur (Punjab) as distress hotspots, with cotton and rainfed belts shaded.
Remedies: income support (PM-KISAN, 2019; Andhra's Rythu Bharosa, 2019), better PMFBY crop insurance (2016), institutional credit for tenants through cultivator rights laws, crop diversification and water-saving irrigation, MSP with assured procurement, the Swaminathan Commission's (2004–06) proposals, and rural mental-health counselling.
Example 28 (UPSC 2017, 10 marks): Goods and Services Tax (GST) has differential impact on developed and backward States of the country. How and why?
Paper and question: Paper II, Q5(e)
Approach: Explain how the destination-based design of GST shifts revenue between producing and consuming states and how it affects developed and backward states differently, and why; a simple flow diagram helps.
The Goods and Services Tax, introduced on 1 July 2017, is a destination-based consumption tax: revenue accrues to the state where goods are consumed, not where they are made, which affects states differently.
Developed manufacturing states: Maharashtra, Gujarat, Tamil Nadu and Karnataka lost the origin-based Central Sales Tax and feared losses, so the GST (Compensation to States) Act, 2017 guaranteed 14% annual revenue growth for five years, until June 2022. Their large markets and formal firms adapted quickly.
Backward consuming states: Uttar Pradesh, Bihar and others gain in principle as consumers, but their low incomes limit the tax base; they also lost the power to offer tax holidays to attract industry, and their many informal small firms face compliance costs.
Common gain: removal of check-posts created a single market and cut freight time, helping landlocked states.
Diagram: Flow diagram showing goods made in Gujarat and sold in Bihar, with tax shifting from the producing to the consuming state.
Overall, GST has made revenue follow consumption, so backward states gain only as their incomes rise.
Example 29 (UPSC 2016, 15 marks): Examine the causes of regional disparities in economic development in India.
Paper and question: Paper II, Q7(c)
Approach: Examine the historical, physical, policy, market, human-capital and governance causes of regional disparity with Indian examples, framed by Myrdal and Hirschman; a core–periphery map of India supports it.
Regional disparity in India shows a developed west, south and north-west against a lagging east, centre and North-East. Myrdal's cumulative causation (1957) and Hirschman's polarisation (1958) explain why early advantages tend to persist.
Historical causes: colonial investment favoured port cities such as Bombay, Calcutta and Madras and their hinterlands; the zamindari system in the east has been linked to lower later investment in farming (Banerjee and Iyer, 2005).
Physical causes: rugged terrain and isolation in the North-East and Himalaya, aridity in the Thar, and drought in rain-shadow areas raise costs and limit farming.
Policy causes: the freight equalisation policy (1952–1993) removed the cost advantage of mineral-rich Jharkhand and Odisha; the Green Revolution concentrated gains in Punjab, Haryana and western Uttar Pradesh.
Market causes: after 1991 private and foreign investment chose coastal states with ports, power and skilled labour, such as Gujarat, Maharashtra, Tamil Nadu and Karnataka, while mineral-rich states suffered a ‘resource curse’.
Human and governance causes: literacy of 94% in Kerala against 61.8% in Bihar (Census 2011), weaker institutions, social inequalities and conflict (Left-wing extremism, insurgency) deter investment.
Map: Core–periphery map of India showing developed cores (Mumbai–Pune, Ahmedabad, Bengaluru, Chennai, NCR, Punjab) and lagging peripheries (Bihar, Jharkhand, Odisha, eastern Uttar Pradesh, the North-East).
Since causes are cumulative, correcting disparities requires sustained public investment in lagging regions, not reliance on trickle-down.
Example 30 (UPSC 2015, 20 marks): Reduction in regional disparities has been one of the priority goals of national planning in India. How the proposed new Smart urban centres may contribute to the process?
Paper and question: Paper II, Q7(a)
Approach: Link the planning goal of balanced regional development to the Smart Cities Mission and industrial-corridor smart cities, explain how they can work as growth poles and counter-magnets, then assess their limits; map the smart cities against lagging regions.
Balanced regional development has been a planning goal since the Third Five Year Plan, pursued through backward-area programmes and new industrial towns such as Bhilai and Rourkela. The Smart Cities Mission (launched 25 June 2015) selected 100 cities by competition for area-based development and pan-city digital solutions, while smart industrial cities are being built along the industrial corridors, such as Dholera (Gujarat) and Shendra–Bidkin (Maharashtra) on the Delhi–Mumbai corridor.
Growth poles: following Perroux and Boudeville, investment in modern infrastructure and services can make a city a growth pole whose spread effects reach its hinterland through markets, jobs and services.
Spatial spread: the mission allotted cities to every state, so lagging regions received smart cities too: Patna, Bhagalpur, Muzaffarpur and Biharsharif in Bihar, Ranchi in Jharkhand, Bhubaneswar (first in the first round, 2016), and north-eastern towns such as Agartala, Imphal, Kohima, Aizawl, Pasighat and Gangtok.
Counter-magnets: better services in second-tier cities can divert migrants and investment away from overcrowded metros, easing primacy of Mumbai, Delhi and Kolkata.
Industrial cities: corridor nodes such as Dholera and Shendra–Bidkin aim to bring manufacturing jobs to new locations, though most lie in already advanced states.
Limits: area-based projects cover small pockets of each city; competitive selection favoured cities with stronger administrations; the mission has few links to rural areas, so Myrdal's backwash effects may concentrate gains; and enclave development can widen gaps within cities.
Map: Map of India marking the 100 smart cities as dots and industrial corridors as lines, over a shaded base of lagging districts, highlighting Bihar, Jharkhand, Odisha and the North-East.
Smart cities can reduce disparities only if linked to small towns and villages through rural clusters (Shyama Prasad Mukherji Rurban Mission, 2016), corridors and local industry; otherwise they risk becoming islands of prosperity.
5. Linking of Rivers, Sustainable Development and Globalisation
Example 31 (UPSC 2021, 15 marks): Discuss the ecological and economic challenges of river linking in India.
Paper and question: Paper II, Q2(c)
Approach: Briefly introduce the ILR programme, then discuss its ecological and economic challenges separately with named links (Ken–Betwa, Himalayan links, Par–Tapi–Narmada) and end with a balanced view; draw the ILR map.
The Interlinking of Rivers (ILR) programme, based on the National Perspective Plan (1980), proposes 30 links (14 Himalayan, 16 peninsular) to move water from ‘surplus’ to ‘deficit’ basins; the Ken–Betwa link, whose foundation stone was laid at Khajuraho on 25 December 2024, is the first under construction.
Ecological challenges: submergence of forests and wildlife habitat, such as part of the Panna Tiger Reserve under the Daudhan dam; reduced flow and sediment to deltas, raising salinity and erosion in the Sundarbans and the Krishna–Godavari delta; mixing of fish and invasive species between basins; waterlogging and salinity in new command areas; and seismic risk for large Himalayan dams.
Economic challenges: very high cost (Ken–Betwa alone is estimated at about ₹44,605 crore); large energy needs to lift water across the Vindhyan and peninsular watersheds; long gestation and cost overruns; and resettlement of displaced, often tribal, communities, as the protests that stalled the Par–Tapi–Narmada link showed.
Institutional challenges with economic cost: water is a state subject, so disputes (Odisha questions any Mahanadi surplus) delay projects, and Himalayan links need Nepal, Bhutan and Bangladesh.
Map: Map of India showing Himalayan links as arrows from the Brahmaputra and eastern Ganga tributaries westward and peninsular links from the Mahanadi and Godavari south to the Krishna, Pennar and Cauvery, with Ken–Betwa and Panna marked.
ILR should proceed link by link after rigorous cost–benefit and environmental assessment, with cheaper options such as watershed development and efficient irrigation explored first.
Example 32 (UPSC 2019, 20 marks): "Intrabasins linkages of rivers are more feasible economically, socially and ecologically". Discuss with suitable examples from India.
Paper and question: Paper II, Q6(a)
Approach: Define intra-basin and inter-basin linkage, then test the statement on economic, social and ecological grounds with Indian examples of both, and conclude with a qualified judgement; a schematic diagram and map help.
An intra-basin linkage transfers water between tributaries or sub-basins of the same river system, while an inter-basin transfer moves water across a major watershed into another river system. The National Perspective Plan (1980) relies mostly on inter-basin links, but smaller intra-basin schemes are often easier to build.
Economic feasibility: intra-basin canals are shorter, mostly follow the natural gradient and need little lifting, so costs and gestation are lower. The Parbati–Kalisindh–Chambal link integrated with the Eastern Rajasthan Canal Project, agreed by Rajasthan and Madhya Pradesh in 2024, stays within the Chambal sub-basin.
Social feasibility: fewer states and no foreign country are involved, so agreements come faster; Telangana's Kaleshwaram lift scheme redistributes Godavari water within one state, and the proposed Kosi–Mechi link lies within Bihar and the Ganga basin.
Ecological feasibility: flow regimes, sediment and aquatic species are similar within one basin, so the risk of mixing alien species and starving deltas is lower than in inter-basin links such as Mahanadi–Godavari or Manas–Sankosh–Teesta–Ganga.
Counter-view: intra-basin links are not automatically benign. Ken–Betwa lies within the Yamuna sub-basin, yet it submerges part of the Panna Tiger Reserve and displaces villages; Kaleshwaram's barrages suffered structural damage in 2023; and some deficits, as in the Cauvery or Saurashtra, can only be met from other basins, as the Godavari–Krishna Pattiseema lift (2015) and Narmada water through the SAUNI scheme show.
Diagram: Schematic of two river systems separated by a watershed line, showing a short intra-basin link between two tributaries and a long inter-basin canal crossing the divide with a lift station; beside it a map marking Ken–Betwa, PKC–ERCP, Kosi–Mechi, Pattiseema and SAUNI.
Thus the statement is largely valid: intra-basin links are generally cheaper, quicker and less disruptive, but each project still needs site-specific environmental and social assessment.
Example 33 (UPSC 2017, 20 marks): Interlinking of rivers may serve as a major source of assured irrigation and all-weather inland navigation in India. Comment on its feasibility taking into account physical, economic and ecological implication.
Paper and question: Paper II, Q6(a)
Approach: State the claimed irrigation and navigation benefits of ILR with NWDA figures, then comment on feasibility under physical, economic and ecological heads, and give a balanced conclusion; draw the ILR map with national waterways.
The Interlinking of Rivers programme of the National Water Development Agency (set up 1982) plans 30 links under the National Perspective Plan (1980). NWDA projects about 35 million ha of additional irrigation (25 million ha from surface water and 10 million ha from groundwater) and about 34,000 MW of hydropower, besides flood moderation and navigation.
Assured irrigation: transfers from the Brahmaputra, eastern Ganga tributaries, Mahanadi and Godavari could serve drought-prone Bundelkhand, Rayalaseema, Tamil Nadu and western Rajasthan; Ken–Betwa alone is planned to irrigate about 10.6 lakh ha a year.
All-weather navigation: link canals with assured flow could join the 111 national waterways declared in 2016, such as NW-1 on the Ganga, giving cheap bulk transport.
Physical feasibility: the Himalayan links need huge storage dams in seismic zones and in Nepal and Bhutan; peninsular canals must cross the Vindhyan and Eastern Ghats divides, needing high lifts; and monsoon floods and lean flows often occur in all basins at the same time, questioning the very idea of ‘surplus’. Canals with varying gradients and lifts cannot easily carry ships all year, so continuous navigation is doubtful.
Economic feasibility: the 2002 task force put the cost at about ₹5.6 lakh crore at then prices; pumping costs, evaporation losses, long gestation and resettlement raise it further, while cheaper options such as drip irrigation and watershed development give quicker returns.
Ecological feasibility: submergence of forests (Panna Tiger Reserve under Ken–Betwa), loss of sediment to deltas such as the Sundarbans and Krishna–Godavari, salinity intrusion, species mixing and waterlogging in new commands.
Map: Map of India showing the 14 Himalayan and 16 peninsular links as arrows, NW-1 (Ganga), NW-2 (Brahmaputra) and NW-3 (West Coast Canal), and drought-prone target regions shaded.
ILR can add assured irrigation in specific deficit regions, but nationwide all-weather navigation is doubtful; a selective, link-by-link approach with strict appraisal is more realistic.
Example 34 (UPSC 2016, 15 marks): Explain the impact of economic development on environmental degradation in India.
Paper and question: Paper II, Q4(b)
Approach: Use the Environmental Kuznets Curve to frame the link, explain sector-wise impacts of India's growth on air, water, land and forests with examples and data, then note the counter-trends and a sustainable way forward; draw the EKC diagram.
The Environmental Kuznets Curve (Grossman and Krueger, early 1990s) suggests that pollution first rises and then falls as income grows; fast-growing India sits on the rising limb for many pollutants, though the hypothesis itself is debated.
Industrialisation: clusters such as Vapi, Ankleshwar and Korba were identified as critically polluted under CPCB's Comprehensive Environmental Pollution Index; coal power drives air pollution and makes India the third-largest emitter of carbon dioxide, though its per capita emissions remain low.
Urbanisation: growing cities produce about 1.6 lakh tonnes of solid waste a day (CPCB, 2020–21), untreated sewage and vehicle smog; wetlands and lakes in Bengaluru and Chennai have been built over, worsening floods.
Agriculture: Green Revolution intensification has caused groundwater depletion in Punjab and Haryana, soil degradation and salinity, and stubble burning; 29.7% of India's land was degraded in 2018–19 (ISRO Atlas, 2021).
Mining and infrastructure: iron ore mining in Goa and Bellary, illegal mining in the Aravallis, and roads and hydropower in the Himalaya have increased landslides, as Joshimath (2023) showed.
Counter-trends: growth also funds clean technology; forest and tree cover rose to 25.17% (ISFR 2023), and non-fossil sources reached about half of installed power capacity in 2025.
Diagram: Inverted-U curve of environmental degradation against per capita income, marking India on the rising limb and showing a tunnel through the curve for leapfrogging with clean technology.
India's challenge is to ‘tunnel through’ the curve using the polluter-pays principle, EIA, green finance and Mission LiFE, so that growth does not wait for wealth to clean up.
Mains points
- Himalayan hazards recur almost every year (landslide 2021, cloudburst 2021, avalanche 2020, GLOF 2019, altitudinal hazards 2019); always name recent events such as Kedarnath 2013, Joshimath 2023 and South Lhonak 2023 and draw a map of the Himalayan arc.
- Pollution questions are geographic, not just environmental: explain why the Ganga plain and Delhi suffer (inversion, landlocked bowl, wind direction) before listing sources and policies such as NCAP 2019, GRAP and CAQM.
- For desertification and degradation, quote the ISRO Desertification and Land Degradation Atlas (2021) figure of 29.7% and the UNCCD definition, and organise the answer region by region.
- Regional disparity answers score higher when they use theory (Myrdal, Hirschman, Friedmann), current data (NITI MPI, SDG India Index 2023–24) and a choropleth map, and end with place-based policy.
- River linking questions ask for feasibility: separate physical, economic, ecological and social or political heads, use Ken–Betwa as the case study and give a balanced, link-by-link conclusion.
- Directive words matter: ‘critically analyse’ and ‘comment on feasibility’ need a counter-view; examiners reward answers that weigh limits, not only list measures.
Did you know?
- The Chipko movement grew out of a river flood: villagers blamed the July 1970 Alaknanda flood on deforestation upstream, and that memory fed the tree-hugging protest at Reni in 1974.
Geography Optional: All chapters
- Exam Pattern, Syllabus and Strategy
- The Earth's Interior and Tectonics
- Geomorphic Processes and Landscape Development
- Climatology: Atmosphere and Circulation
- Climatology: Weather Systems, Climates and Climate Change
- Oceanography
- Biogeography
- Environmental Geography
- Perspectives in Human Geography
- Economic Geography
- Population Geography
- Settlement Geography
- Regional Planning
- Models, Theories and Laws in Human Geography
- India: Physical Setting I
- India: Physical Setting II
- Resources of India
- Agriculture in India
- Industry in India
- Transport, Communication and Trade
- Cultural Setting and Population of India
- Settlements in India
- Regional Development and Planning in India
- Political Aspects
- Contemporary Issues
- Places for the Map Question