
Geography Optional · UPSC Notes
Cultural Setting and Population of India — UPSC Geography Optional Notes
Free, exam-focused notes for UPSC Prelims and Mains, with Prelims tips and Mains points for every topic. 5 topics.
Open in the interactive reader: bookmarks, progress tracking and read-aloud.
Racial, Linguistic, Ethnic and Religious Diversity; Cultural Regions
India's society was built by successive waves of people and ideas over five thousand years, which left a mosaic of races, languages, faiths and regional cultures. Census 2011 grouped mother tongues into 121 languages (22 scheduled) belonging to four main language families, and recorded six notified religious minorities forming about 20% of the people. Geographers combine language, religion, ethnicity and history to divide India into cultural regions, and explain the pattern through B. Subbarao's areas of attraction, relative isolation and isolation.
In simple words
India is like a huge patchwork quilt: each patch is a region with its own language, food, dress, festivals and faith, stitched together by a shared history.
Different groups of people came at different times, through the north-western passes, the north-eastern hills and the sea, and settled in different corners.
Knowing where each language and religion is concentrated helps explain state boundaries, regional movements and how plans must be tailored to each region.
UPSC asks you to map this diversity, classify it and explain how India keeps unity within it.
1. Historical perspective of Indian society
Peopling of India: the subcontinent was open to movement through the north-western passes (Khyber, Bolan), the north-eastern hill routes and the sea, while the Himalaya gave it a broad physical unity.
Harappan base (about 2600–1900 BCE): an urban culture in the Indus–Ghaggar basin; its people are thought to have contributed much of the ancestry of later north and south Indians (debated in detail).
Vedic period: Indo-Aryan speakers spread from the north-west into the Ganga plain; the varna idea and Sanskritic culture took shape and later spread south and east.
Later waves: Greeks, Shakas, Kushanas and Hunas (ancient), Arabs on the west coast, Turks, Afghans and Mughals (medieval), then Portuguese, Dutch, French and British traders by sea.
Regional kingdoms (Cholas, Pallavas, Rashtrakutas, Kakatiyas, Ahoms) gave regional languages, temple styles and identities that still define cultural regions.
Caste and jati: occupational, endogamous groups that fixed people to land and craft; M.N. Srinivas described upward mobility through imitation of upper-caste ways as Sanskritisation (1952).
Colonial period: census classification from 1871–72 onwards, plantation and mining labour migration, railways and English education reshaped identities and regional economies.
Unity in diversity: pilgrimage circuits (char dham, jyotirlingas, shakti peethas, Sufi dargahs), shared epics, the monsoon farm calendar and a common political history bind regions together.
2. Racial diversity
Race: a group defined by shared inherited physical traits; modern genetics shows human variation is continuous, so racial labels are now treated as historical classifications, not biological boxes.
Risley's scheme: H.H. Risley (The People of India, 1908; based on the 1901 Census) gave seven types using the cephalic and nasal indices: Turko-Iranian, Indo-Aryan, Scytho-Dravidian, Aryo-Dravidian, Mongolo-Dravidian, Mongoloid and Dravidian.
Criticism of Risley: his measurements were used to rank castes and fitted colonial ideas; terms like Aryan and Dravidian are language families, not races.
Guha's scheme: B.S. Guha, using the 1931 Census, gave six main racial elements: Negrito, Proto-Australoid, Mongoloid, Mediterranean, Western Brachycephals and Nordic, the most widely quoted scheme in Indian texts.
Negrito: traces among Andaman groups (Onge, Jarawa, Great Andamanese); Proto-Australoid: many central Indian tribes (Munda, Santhal, Ho, Bhil); Mongoloid: Himalaya and north-east (Naga, Mizo, Bhotia, Lepcha).
Mediterranean: large parts of the plains and south; Western Brachycephals: Gujarat, Maharashtra coast, Kannada region; Nordic: north-west (Punjab, Rajasthan, Kashmir), as described by Guha.
Genetic view: Reich and colleagues (Nature, 2009) showed most Indians descend from a mix of two ancestral groups, Ancestral North Indians and Ancestral South Indians, in varying proportions; the timing of mixing is still debated.
3. Linguistic diversity
Census 2011: 19,569 raw returns were rationalised into 1,369 mother tongues, then grouped into 121 languages with at least 10,000 speakers: 22 scheduled and 99 non-scheduled.
Eighth Schedule: began with 14 languages; Sindhi (1967), Konkani, Manipuri, Nepali (1992), and Bodo, Dogri, Maithili, Santali (2003) took it to 22.
Leading languages (Census 2011, share of population): Hindi 43.6%, Bengali 8.0%, Marathi 6.9%, Telugu 6.7%, Tamil 5.7%, Gujarati 4.6%, Urdu 4.2%.
Indo-Aryan family (about 78%): the northern plains, Gujarat, Maharashtra, Bengal, Odisha, Assam; includes Hindi, Bengali, Marathi, Gujarati, Punjabi, Odia, Assamese, Kashmiri.
Dravidian family (about 20%): peninsular south (Tamil, Telugu, Kannada, Malayalam) with tribal outliers such as Gondi, Kurukh (Oraon) and Malto in central India and Brahui in Pakistan.
Austro-Asiatic family (about 1%): Munda languages (Santali, Mundari, Ho) of the Chota Nagpur plateau and Khasi in Meghalaya, regarded as very old in India.
Tibeto-Burman family (about 1%): Himalaya and north-east: Bodo, Manipuri (Meitei), Mizo, Naga languages, Garo, Lepcha, Bhotia.
Classical languages: Tamil (2004), Sanskrit, Telugu, Kannada, Malayalam, Odia, and from October 2024 Marathi, Pali, Prakrit, Assamese and Bengali, making 11.
Linguistic reorganisation: the States Reorganisation Act 1956 drew most boundaries on language lines, making language the strongest basis of regional identity.
4. Ethnic and religious diversity
Ethnic group: a community that sees itself as sharing descent, history, language or culture; in India ethnicity overlaps with tribe, caste, language and religion (for example Nagas, Bodos, Meiteis, Gorkhas).
Religion (Census 2011): Hindus 79.8%, Muslims 14.2%, Christians 2.3%, Sikhs 1.7%, Buddhists 0.7%, Jains 0.4%, others 0.7%.
Notified minorities: Muslims, Christians, Sikhs, Buddhists and Parsis (Zoroastrians) under the National Commission for Minorities Act 1992, and Jains added in 2014.
Muslims: majority in Lakshadweep (96.6%) and J and K (68.3%), large shares in Assam (34.2%), West Bengal (27.0%) and Kerala (26.6%); largest number in Uttar Pradesh (Census 2011).
Christians: majority in Nagaland (87.9%), Mizoram (87.2%) and Meghalaya (74.6%), with large communities in Kerala, Goa and Tamil Nadu (Census 2011).
Sikhs: 57.7% of Punjab; Buddhists: largest number in Maharashtra (Navayana Buddhists after 1956), and significant shares in Sikkim, Arunachal Pradesh and Ladakh; Jains: mainly Maharashtra, Rajasthan, Gujarat, Karnataka.
Parsis: a very small, ageing community concentrated in Mumbai and Gujarat; the Jiyo Parsi scheme (2013) addresses their falling numbers.
5. Cultural regions
Cultural region: an area whose people share a set of cultural traits (language, religion, customs, house types, diet); Carl Sauer's Berkeley school treated culture as the agent that shapes the landscape (1925).
Subbarao's scheme: B. Subbarao (The Personality of India, 1958) identified areas of attraction (nuclear regions such as the Indus–Ganga divide, middle Ganga valley, Raichur doab, Kaveri delta), areas of relative isolation (Kalinga, Gujarat) and areas of isolation (north-east hills, central Indian forest tracts).
Joseph Schwartzberg (A Historical Atlas of South Asia, 1978) mapped how nuclear regions of power and culture persisted across centuries; core regions repeatedly hosted empires.
Commonly used macro cultural regions: Kashmiri–Dardic and Ladakhi Buddhist north, Punjabi north-west, Hindi heartland, Rajasthani desert, Gujarati, Marathi, Bengali–Odia–Assamese east, Dravidian south (four sub-regions) and the tribal north-east and central belt.
Transition zones: Bundelkhand, Malwa, Telangana–Vidarbha borders, the Himalayan foothills and the Assam valley margins show mixed traits and often have demands for separate identity.
6. Theory and debates
Melting pot vs salad bowl: Indian diversity is usually described as a salad bowl where groups keep distinct identities; the integration model of the Constitution protects this pluralism.
Aryan migration debate: genetic and linguistic evidence supports the arrival of Indo-European speakers from the steppe around the second millennium BCE; the indigenous origin view is held by some; treat it as debated.
Language and politics: three-language formula (1968 policy, retained in NEP 2020) vs resistance to Hindi in Tamil Nadu; debated as unity vs regional autonomy.
7. Maps and diagrams to draw
Language family map: outline of India; shade the Indo-Aryan north, Dravidian south below a line roughly along the Vindhya–Satpura and the Maharashtra–Karnataka border, Austro-Asiatic patches on Chota Nagpur and Meghalaya, Tibeto-Burman in the Himalaya and north-east.
Religion map: mark Muslim-majority J and K and Lakshadweep, Christian-majority Nagaland, Mizoram and Meghalaya, Sikh-majority Punjab, and Buddhist pockets of Ladakh, Sikkim, Arunachal and Maharashtra.
Subbarao diagram: India outline with three shades: core nuclear regions (dark), relative isolation (medium), isolation (light), with arrows showing culture spreading from cores.
8. Using it in the exam
10-mark (150 words): define the diversity, give two or three Census 2011 figures, insert a small map, end with one line on unity.
15–20 marks: introduction with history, classification (Guha or language families), spatial pattern with map, regional examples, problems and integrating factors, conclusion on pluralism.
Keywords: nuclear regions, linguistic reorganisation, Eighth Schedule, notified minorities, Sanskritisation, unity in diversity.
Quotation: the historian Vincent Smith wrote of a profound underlying fundamental unity in India despite its diversity (paraphrased); use it in conclusions.
| Family | Share of speakers | Main region | Example languages |
|---|---|---|---|
| Indo-Aryan (Indo-European) | about 78% | Northern plains, west, east | Hindi, Bengali, Marathi, Gujarati, Punjabi, Odia |
| Dravidian | about 20% | Peninsular south, tribal central India | Tamil, Telugu, Kannada, Malayalam, Gondi, Kurukh |
| Austro-Asiatic | about 1% | Chota Nagpur, Meghalaya | Santali, Mundari, Ho, Khasi |
| Tibeto-Burman (Sino-Tibetan) | about 1% | Himalaya, north-east | Bodo, Manipuri, Mizo, Garo, Naga languages |
| Aspect | H.H. Risley | B.S. Guha |
|---|---|---|
| Data base | 1901 Census, anthropometry | 1931 Census, anthropometry |
| Number of types | Seven | Six main elements (with sub-types) |
| Types | Turko-Iranian, Indo-Aryan, Scytho-Dravidian, Aryo-Dravidian, Mongolo-Dravidian, Mongoloid, Dravidian | Negrito, Proto-Australoid, Mongoloid, Mediterranean, Western Brachycephals, Nordic |
| Main criticism | Mixed language names with race; used to rank castes | Still based on physical measurement; superseded by genetics |
Mains points
- Typical questions: the bases of cultural regionalisation of India; the spatial pattern of language families or religious minorities; how diversity shaped state reorganisation.
- Always give Census 2011 figures with the year, and say the Census 2027 results are awaited.
- Do not call Aryan or Dravidian a race; call them language families and mention the genetic ANI–ASI evidence.
- A map of language families or religious concentration is expected in every answer above 10 marks.
- Use Subbarao's areas of attraction, relative isolation and isolation to explain why cultural regions persist.
- End with integrating forces (pilgrimage, polity, economy, migration) to show unity within diversity.
Did you know?
- Memory trick for Guha's six races: 'No Proper Map Means Wrong Notes' = Negrito, Proto-Australoid, Mongoloid, Mediterranean, Western Brachycephals, Nordic.
- Census 2011 recorded 19,569 raw names of mother tongues before experts rationalised them into 1,369.
Tribes, Tribal Areas and Their Problems
Census 2011 counted 10.43 crore Scheduled Tribes (8.6% of India), about 90% of them rural, in over 700 notified communities. They are concentrated in the central Indian belt (Madhya Pradesh to Odisha), the north-east, the western hills and the islands. Their key problems are land alienation, displacement, forest rights, indebtedness, poor health and education, and identity, which policy tries to address through the Fifth and Sixth Schedules, PESA 1996, the Forest Rights Act 2006 and targeted missions such as PM-JANMAN.
In simple words
Tribes are communities with their own language, customs and close ties to forests, hills and land, often living in remote areas.
Think of them as the original caretakers of India's forests: the forest is their market, pharmacy and temple at once.
When mines, dams and roads arrive, they often lose land and livelihood, so their protection is a big development and justice issue.
UPSC asks you to map tribal regions, explain their problems and judge laws like PESA and the Forest Rights Act.
1. Concepts and definitions
Tribe: a social group with a common name, territory, dialect, cultural homogeneity and a simple economy, usually endogamous and organised by kinship; the Constitution does not define it.
Scheduled Tribe: communities notified by the President under Article 342 for each state or UT; Parliament can add or remove groups by law.
Lokur Committee (1965) criteria: primitive traits, distinctive culture, geographical isolation, shyness of contact with the wider community, and backwardness; still used in practice.
PVTG (Particularly Vulnerable Tribal Group): the Dhebar Commission (1960–61) pointed to the most backward groups; the category began in 1975 as Primitive Tribal Groups and was renamed PVTG in 2006; there are 75 PVTGs in 18 states and Andaman and Nicobar.
PVTG criteria: pre-agricultural level of technology, low literacy, stagnant or declining population and a subsistence economy.
Tribe–caste continuum: anthropologists such as F.G. Bailey (1960) saw tribe and caste as two ends of a scale rather than separate boxes, because many tribes absorbed caste practices.
2. Numbers and distribution (Census 2011)
Total: 10.43 crore STs, 8.6% of the population; about 89.97% live in rural areas; ST sex ratio 990, above the national 943.
Largest numbers: Madhya Pradesh (about 1.53 crore), followed by Maharashtra, Odisha, Rajasthan, Gujarat, Jharkhand and Chhattisgarh.
Highest shares: Lakshadweep (94.8%), Mizoram (94.4%), Nagaland (86.5%), Meghalaya (86.1%) and Arunachal Pradesh (68.8%).
No notified STs: Punjab, Haryana, Delhi, Chandigarh and Puducherry.
Largest tribes: Bhils (western and central India) and Gonds (central India) are the two largest; Santhals of Jharkhand, West Bengal and Odisha are among the next largest.
ST literacy: 59% in 2011 against 73% for all India, with female ST literacy near 49%.
3. Tribal regions
North-eastern zone: Assam hills, Arunachal, Nagaland, Manipur, Mizoram, Meghalaya, Tripura: Nagas, Mizos, Khasis, Garos, Bodos, Adis, Apatanis, Karbis; mostly Mongoloid, Tibeto-Burman speech, high ST share.
Central zone (largest by numbers): Chota Nagpur, Bastar, Satpura–Maikal hills and the Odisha highlands: Santhal, Munda, Oraon, Ho, Gond, Baiga, Kondh, Juang, Bhumij.
Western zone: Aravalli, Vindhya and western Satpura in Rajasthan, Gujarat, Madhya Pradesh and Maharashtra: Bhil, Meena, Garasia, Warli, Kokna.
Southern zone: Nilgiris, Western Ghats and Nallamala: Toda, Kota, Kurumba, Irula, Paniya, Chenchu, Koraga, Kadar.
Himalayan zone: Gaddi and Gujjar (Himachal), Bhotia, Jaunsari, Tharu, Raji (Uttarakhand), Lepcha and Bhutia (Sikkim), Changpa and Brokpa (Ladakh).
Island zone: Great Andamanese, Onge, Jarawa and Sentinelese (Negrito), Shompen and Nicobarese (Mongoloid) in Andaman and Nicobar.
4. Problems of tribal areas
Land alienation: transfer of tribal land to outsiders through debt, fraud and benami deals despite state laws banning it; a central cause of unrest in Jharkhand, Odisha and Andhra Pradesh.
Displacement: tribal areas hold most of India's coal, iron ore, bauxite and dam sites; scholars such as Walter Fernandes estimate tribals form around 40% of the people displaced by development projects since 1947 (an estimate, debated).
Forest rights: colonial forest laws made traditional users encroachers; the Forest Rights Act 2006 recognises individual and community forest rights but implementation is uneven and many claims are rejected.
Shifting cultivation (jhum, podu, bewar): shrinking fallow cycles in the north-east and Odisha cause soil erosion and low yields.
Indebtedness and exploitation: moneylenders and traders pay low prices for minor forest produce (tendu leaves, mahua, sal seeds); MSP for MFP (2013) and Van Dhan Kendras try to help.
Health: malnutrition, malaria, tuberculosis and sickle cell disease; the National Sickle Cell Anaemia Elimination Mission was launched at Shahdol on 1 July 2023 with a 2047 target.
Education and language: instruction in the state language, distant schools and seasonal migration cause dropouts; Eklavya Model Residential Schools are the main central response.
Identity and unrest: erosion of culture, insurgency in parts of the north-east, Left-Wing Extremism in the central belt, and ethnic clashes such as the Manipur violence of 2023.
Vulnerable groups: PVTGs such as Jarawa and Shompen face contact risks and disease; Great Nicobar development is debated for its effect on the Shompen.
5. Constitutional and legal protection
Fifth Schedule: Scheduled Areas in ten states (Andhra Pradesh, Telangana, Chhattisgarh, Gujarat, Himachal Pradesh, Jharkhand, Madhya Pradesh, Maharashtra, Odisha, Rajasthan) with a Tribes Advisory Council and Governor's special powers.
Sixth Schedule: Autonomous District Councils in Assam, Meghalaya, Tripura and Mizoram with law-making powers over land, forests and customs.
PESA Act 1996: extends Panchayati Raj to Fifth Schedule areas and makes the gram sabha central to consent on land acquisition, minor minerals and minor forest produce.
Landmark cases: Samatha (1997) barred lease of tribal land to private mining in Scheduled Areas of Andhra Pradesh; the Niyamgiri judgement (2013) let Dongria Kondh gram sabhas decide on bauxite mining, and they rejected it.
Other laws: SC and ST (Prevention of Atrocities) Act 1989; Article 275(1) grants; Article 244 for administration of Scheduled and Tribal Areas.
6. Policy approaches and schemes
Isolation: Verrier Elwin (The Baiga, 1939) argued for protecting tribals from outside exploitation, sometimes called the national park approach.
Assimilation: G.S. Ghurye (The Aborigines So-called and Their Future, 1943) called tribals backward Hindus to be absorbed into the mainstream.
Integration: Nehru's Tribal Panchsheel (foreword to Elwin's A Philosophy for NEFA, 1959): develop along their own genius, respect land and forest rights, avoid over-administration.
Tribal Sub-Plan (Fifth Plan, 1974–75): earmarked funds in proportion to ST population; now called the Development Action Plan for STs.
Xaxa Committee (2014): high-level committee on the socio-economic, health and educational status of tribals; highlighted displacement and weak PESA and FRA implementation.
PM-JANMAN (November 2023): mission for PVTG habitations covering housing, roads, water, health and education, with an outlay of about 24,104 crore rupees.
Dharti Aaba Janjatiya Gram Utkarsh Abhiyan (September 2024): convergence of central schemes in tribal-majority villages; 15 November is observed as Janjatiya Gaurav Divas since 2021.
7. Maps and diagrams to draw
Tribal regions map: outline of India; shade the six zones: north-east, central belt from Gujarat to Odisha, western Aravalli–Satpura, southern Nilgiri–Ghats, Himalaya, and islands; write two tribes in each.
Overlay map: on the central belt mark coal (Jharia, Korba), iron ore (Bailadila, Keonjhar), bauxite (Niyamgiri, Koraput) and dams (Sardar Sarovar, Polavaram) to show why displacement is concentrated there.
Flow diagram: mine or dam → land acquisition → displacement → loss of forest access → migration and indebtedness → unrest; then a second arrow chain for remedies: gram sabha consent → FRA titles → rehabilitation.
8. Using it in the exam
10-mark: define ST and PVTG, give Census 2011 numbers, a small regions map, two key problems and one law.
15–20 marks: distribution with map, region-wise problems, evaluation of Fifth and Sixth Schedules, PESA and FRA, then a forward-looking conclusion on consent-based development.
Keywords: land alienation, Scheduled Areas, gram sabha consent, community forest rights, PVTG, integration not assimilation.
Quotation: Nehru held that tribal people should develop along the lines of their own genius and that nothing should be imposed on them (paraphrase of the Tribal Panchsheel).
| Region | States or area | Major tribes | Key issue |
|---|---|---|---|
| North-east | Arunachal, Nagaland, Mizoram, Meghalaya, Manipur, Assam hills | Naga, Mizo, Khasi, Garo, Bodo, Adi | Identity, autonomy, jhum |
| Central | Jharkhand, Chhattisgarh, Odisha, MP, West Bengal | Santhal, Munda, Oraon, Gond, Kondh, Baiga | Mining displacement, LWE |
| Western | Rajasthan, Gujarat, west MP, Maharashtra | Bhil, Meena, Warli, Garasia | Land alienation, seasonal migration |
| Southern | Nilgiris, Western Ghats, Nallamala | Toda, Kurumba, Irula, Paniya, Chenchu | Small numbers, forest access |
| Himalayan | HP, Uttarakhand, Sikkim, Ladakh | Gaddi, Bhotia, Tharu, Lepcha, Changpa | Pastoral routes, hydro projects |
| Islands | Andaman and Nicobar | Jarawa, Onge, Sentinelese, Shompen | Contact, disease, survival |
| Aspect | Fifth Schedule | Sixth Schedule |
|---|---|---|
| Area | Scheduled Areas in 10 states | Tribal Areas of Assam, Meghalaya, Tripura, Mizoram |
| Body | Tribes Advisory Council (advisory) | Autonomous District Councils (elected, legislative) |
| Key power | Governor can modify laws for the area | Councils make laws on land, forests, customs |
| Related law | PESA 1996 | Councils' own laws and customary courts |
Mains points
- Typical questions: problems of tribal areas and remedies; evaluation of PESA or the Forest Rights Act; why tribal areas coincide with mineral belts and unrest.
- Use Census 2011 numbers with the year; avoid inventing post-2011 tribal population figures.
- Draw the tribal regions map and overlay mines and dams; this single sketch earns marks in most tribal questions.
- Common mistake: listing problems without regional examples; tie each problem to a named area (Niyamgiri, Bastar, Jharia, Manipur).
- Contrast Elwin, Ghurye and Nehru's approaches, then show how present schemes reflect integration.
- Conclude with consent-based, rights-based development and the role of gram sabhas.
Did you know?
- The Toda of the Nilgiris build barrel-vaulted huts called munds and centre their life on sacred buffaloes.
- Memory trick for Sixth Schedule states: 'ATM-M' = Assam, Tripura, Meghalaya, Mizoram.
Growth, Distribution, Density and Demographic Attributes of Population
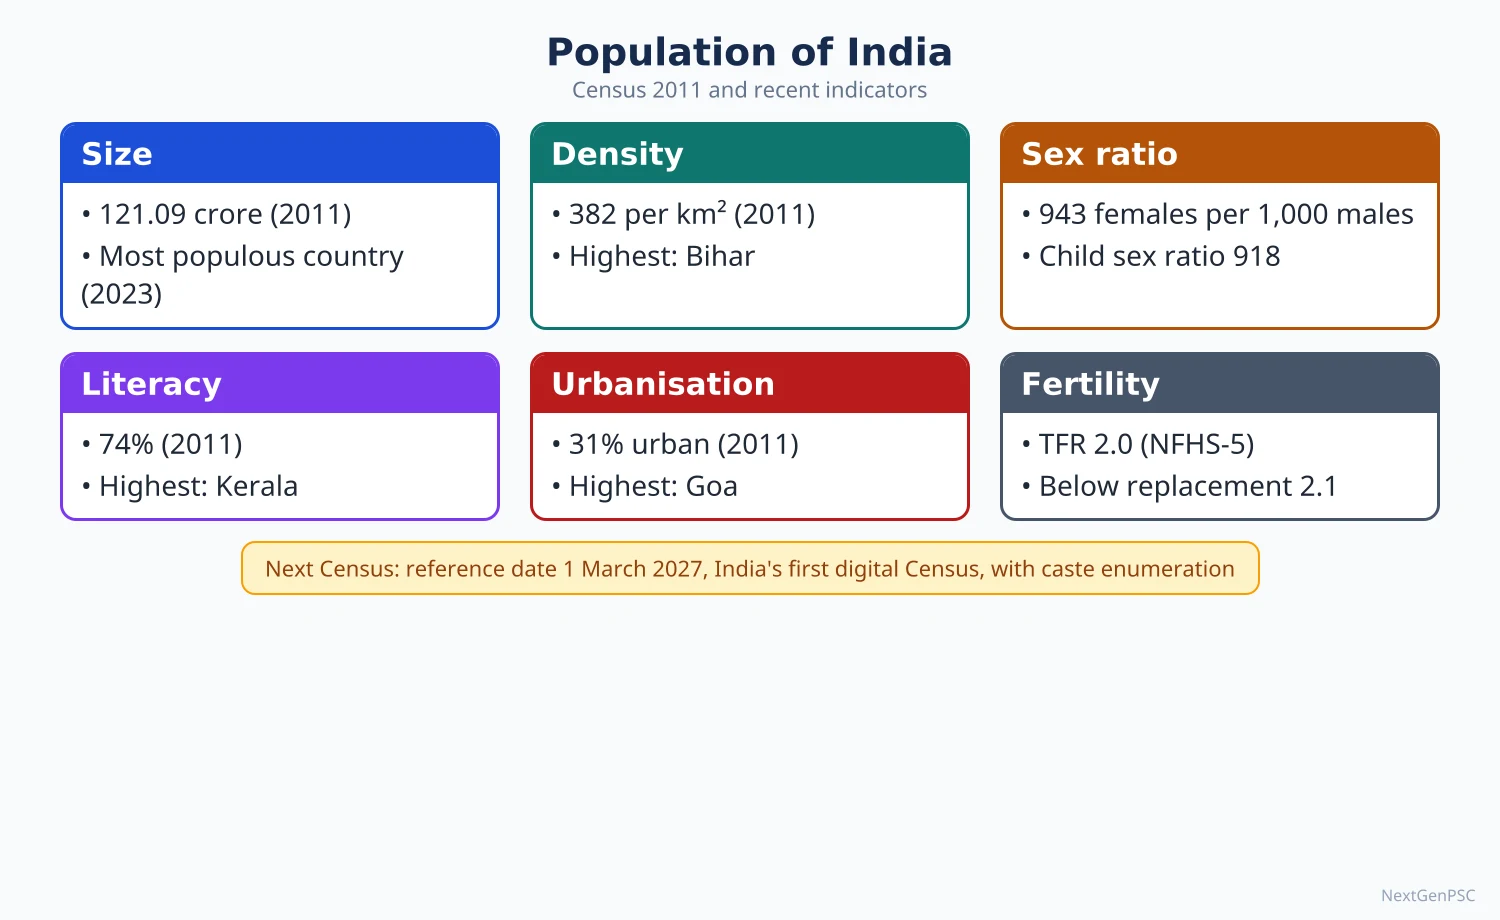
Census 2011 counted 121.09 crore people, with a decadal growth of 17.7% (2001–11), a density of 382 persons per km², a sex ratio of 943 and literacy of 74.04%; UNFPA estimated about 146 crore in 2025. India's growth passed through four phases, from stagnation before 1921 to the population explosion of 1951–81 and steady decline since, and the SRS put the total fertility rate at 1.9 in 2024, below replacement. Distribution follows water, flat fertile land and economic opportunity, so the Ganga plain and coasts are crowded while the Himalaya, Thar and north-eastern hills are sparse.
In simple words
Population geography asks how many people live where, how fast their numbers change and what kind of people they are: young or old, men or women, literate or not.
Think of India as a crowded train: some coaches (the Ganga plain) are packed, others (the Himalaya, Thar desert) have empty seats.
These patterns decide where schools, jobs, hospitals and pensions are needed and how the demographic dividend can be used.
UPSC asks you to explain growth phases, regional patterns and attributes like sex ratio, with Census data and maps.
1. Concepts and definitions
Population geography: G.T. Trewartha's 1953 presidential address to the Association of American Geographers (A Case for Population Geography) made it a distinct field; J.I. Clarke (1965) and W. Zelinsky (1966) developed it.
Decadal growth rate: percentage change in population between two censuses; India's 2001–11 rate was 17.7%, the lowest since independence.
Arithmetic density: persons per km² of total area; physiological density: persons per km² of cultivated land; agricultural density: farm population per km² of cultivated land.
Sex ratio: in India, females per 1,000 males (the reverse of the international convention); child sex ratio: the same for age 0–6; sex ratio at birth: female births per 1,000 male births.
Dependency ratio: (persons aged 0–14 + 60 and above) ÷ persons aged 15–59 × 100 in Indian usage (many international sources use 15–64 and 65+).
Literacy rate (Census): percentage of persons aged seven and above who can read and write with understanding in any language.
Work participation rate: workers as a percentage of total population; main workers worked six months or more in the year, marginal workers less than six months.
Longevity: measured by life expectancy at birth, the average years a newborn would live at current age-specific death rates.
2. Growth: four phases
1901–1921, stagnant: high birth and death rates, famines, plague and the 1918 influenza; 1911–21 showed negative growth (−0.31%), so 1921 is called the year of the great divide.
1921–1951, steady growth: fall in death rates through better sanitation, famine relief and transport; growth rose to about 11–14% per decade.
1951–1981, rapid growth (population explosion): death rates fell sharply with antibiotics, vaccination and malaria control while birth rates stayed high; 1961–71 recorded the highest decadal growth, about 24.8%.
1981–2011, high but slowing: birth rates fell with literacy, urbanisation and family planning; decadal growth dropped from about 24.7% (1971–81) to 17.7% (2001–11).
After 2011: SRS 2024 gives a crude birth rate of 18.3, crude death rate of 6.4 and TFR of 1.9 (rural 2.1, urban 1.5); UNFPA (State of World Population 2025) estimated India at about 146 crore and expects a peak around 170 crore in the early 2060s.
Demographic transition model (W.S. Thompson 1929, F.W. Notestein 1945): India moved from stage 2 (falling deaths) into late stage 3 (falling births); Kerala, Tamil Nadu and Goa are entering stage 4 while Bihar and Uttar Pradesh lag behind.
Population momentum: even with TFR below 2.1, numbers keep rising for decades because of the large share of young adults.
3. Distribution and density
Census 2011 density: 382 persons per km²; highest state Bihar (1,106), then West Bengal (1,028) and Kerala (860); lowest Arunachal Pradesh (17); among UTs Delhi (11,320).
Most populous: Uttar Pradesh (about 19.98 crore, 16.5% of India), followed by Maharashtra, Bihar, West Bengal and Andhra Pradesh (undivided).
Very high density (above 500): the Ganga plain from Punjab to West Bengal, coastal Kerala and Tamil Nadu deltas, due to alluvial soils, irrigation, rivers and long settlement history.
Moderate density (250–500): Deccan plateau states, Gujarat, Odisha and Assam valley, with patches of high density around cities and irrigated deltas (Krishna–Godavari).
Low density (below 250): Himalaya, Thar desert, Chota Nagpur forests, north-eastern hills and the islands, limited by relief, cold, aridity, forests and poor access.
Factors: physical (relief, climate, water, soil), economic (irrigation, minerals, industry, urbanisation), social and historical (old kingdoms, pilgrimage, migration), political (border areas, planned towns).
Physiological density is very high in Kerala and West Bengal, showing heavy pressure on farmland, while Rajasthan looks low on arithmetic density but its usable land is also scarce.
4. Sex ratio and age structure
Sex ratio (Census 2011): 943 overall; highest Kerala (1,084), lowest among states Haryana (879); child sex ratio fell to 918, the lowest since independence.
Regional pattern: low ratios in Punjab, Haryana, Delhi, western Uttar Pradesh and Rajasthan (son preference, sex-selective abortion, male in-migration to cities); high ratios in Kerala, Tamil Nadu and tribal districts.
Recent data: NFHS-5 (2019–21) reported a total sex ratio of 1,020 for its household population and a sex ratio at birth of 929 for the five years before the survey; SRS gives a sex ratio at birth of 917 for 2021–23.
Causes of low sex ratio: son preference, dowry, female infanticide, sex-selective abortion despite the PCPNDT Act 1994, neglect of girl children, maternal mortality, and male-selective migration.
Age structure: Census 2011 shows about 31% aged 0–14 and about 8.6% aged 60 and above (about 10.4 crore elderly); the population pyramid is narrowing at the base.
Demographic dividend: the working-age share keeps rising and is expected to peak around the 2040s (Economic Survey 2018–19 discussed a peak near 2041); timing differs: the south ages first, the Hindi belt later.
Ageing: the UNFPA–IIPS India Ageing Report 2023 projects the share of those aged 60 and above to rise from about 10.5% (2022) to about 20.8% by 2050.
5. Literacy, work-force, dependency and longevity
Literacy (Census 2011): 74.04% (male 82.14%, female 65.46%); highest Kerala (94.0%), lowest Bihar (61.8%); NSO 75th round (2017–18) estimated 77.7%.
Literacy gaps: gender, rural–urban, SC and ST gaps; low female literacy in Rajasthan, Bihar and Jharkhand links to high fertility and low sex ratio.
Work-force (Census 2011): work participation rate 39.8%; of total workers, cultivators 24.6%, agricultural labourers 30.0%, household industry 3.8% and other workers 41.6%.
PLFS 2023–24 (July–June): labour force participation rate (usual status, age 15 and above) 60.1%, male 78.8%, female 41.7%, up from a female rate of 23.3% in 2017–18 (MoSPI).
Debate on female work: the rise in female participation is mostly self-employment and unpaid family work in rural areas, so some economists call part of it distress-driven (debated).
Dependency ratio: falling as the child share drops; high in Bihar and Uttar Pradesh (many children), and old-age dependency rising in Kerala, Tamil Nadu and Himachal Pradesh.
Longevity: SRS abridged life tables give life expectancy at birth of about 70.0 years for 2016–20 (male 68.6, female 71.4); Kerala is highest, while Uttar Pradesh, Madhya Pradesh and Chhattisgarh are among the lowest.
6. Theory and debates
Malthus (An Essay on the Principle of Population, 1798): population grows geometrically and food arithmetically; India's Green Revolution weakened this in practice, though neo-Malthusians still stress resource pressure.
Ester Boserup (1965): population pressure drives agricultural intensification, an optimistic counterpoint visible in intensive rice farming of Kerala and West Bengal.
Optimum population: the size at which per capita output is highest (Edwin Cannan); hard to measure, so the term is used loosely.
North–south divide: lower fertility in the south raises the delimitation question when seats are reallocated after the first census after 2026 (debated).
7. Maps and diagrams to draw
Density map: India outline with three shades: above 500, 250–500 and below 250 persons per km² (Census 2011); label Bihar, West Bengal, Kerala as high and Arunachal, Mizoram, Sikkim, Ladakh as low.
Growth graph: line graph of population 1901–2011 with the 1921 dip and the steep rise after 1951; mark the four phases.
Population pyramids: two pyramids side by side: a broad-based one for Bihar and a narrower, bulging one for Kerala, to show the transition.
Sex ratio map: shade states below 900 (Haryana, Punjab, Delhi) and above 1,000 (Kerala) and add a note on child sex ratio.
8. Using it in the exam
10-mark: define the attribute, give the Census 2011 national figure and two state extremes, one cause, one policy and a small map.
15–20 marks: trend with graph, spatial pattern with map, causes, consequences, recent survey data (SRS, NFHS-5, PLFS) and policy suggestions.
Keywords: demographic transition, population momentum, demographic dividend, physiological density, child sex ratio, feminisation of agriculture.
Quotation: Trewartha argued that population is the point of reference from which all other elements of geography are observed (paraphrased from his 1953 address).
| Indicator | Value | Year and source |
|---|---|---|
| Population | 121.09 crore | Census 2011 |
| Decadal growth | 17.7% | Census 2001–11 |
| Density | 382 per km² | Census 2011 |
| Sex ratio / child sex ratio | 943 / 918 | Census 2011 |
| Literacy | 74.04% (M 82.14, F 65.46) | Census 2011 |
| Total fertility rate | 1.9 (rural 2.1, urban 1.5) | SRS 2024 |
| Crude birth / death rate | 18.3 / 6.4 per 1,000 | SRS 2024 |
| Female labour force participation | 41.7% (age 15+) | PLFS 2023–24 |
| Estimated population | about 146 crore | UNFPA, 2025 |
| Phase | Period | Nature | Main reason |
|---|---|---|---|
| I | 1901–1921 | Stagnant (negative in 1911–21) | Famine, plague, influenza; high death rate |
| II | 1921–1951 | Steady growth | Falling death rate, better sanitation and relief |
| III | 1951–1981 | Rapid growth (explosion) | Sharp fall in deaths, high births |
| IV | 1981–2011 | High but slowing | Falling births with literacy, urbanisation, family planning |
Mains points
- Typical questions: regional variations in density or sex ratio; India's demographic dividend and ageing; spatial pattern of literacy; changing work-force structure.
- Always name the source and year (Census 2011, SRS 2024, NFHS-5, PLFS 2023–24); never mix them up or present estimates as census counts.
- Draw a density or sex ratio map and a population pyramid; graphs of the four growth phases fetch easy marks.
- Explain the north–south demographic divide and its implications for federal finance and delimitation, marking it as debated.
- Common mistake: treating the demographic dividend as automatic; stress skills, health, female work and jobs.
- Link attributes to each other: low female literacy → high fertility → high child dependency.
Did you know?
- India counts sex ratio as females per 1,000 males, while most countries count males per 100 females, so always state the definition in your answer.
- Memory trick for growth phases: 'Stop, Steady, Speed, Slow' = 1901–21, 1921–51, 1951–81, 1981–2011.
Migration, Population Problems, Policies and Health Indicators
Census 2011 recorded about 45 crore migrants by place of last residence (roughly 37% of the people), most of them women moving within their own district on marriage; the economically important streams are male labour flows from Uttar Pradesh, Bihar and Odisha to Maharashtra, Delhi, Gujarat and the south. India is also the world's largest recipient of remittances (about 129 billion US dollars in 2024). Population policy moved from target-based family planning (1952) to the rights-based National Population Policy 2000, and health indicators have improved sharply (SRS 2024: IMR 24; MMR 88 in 2021–23) but with wide regional gaps.
In simple words
Migration means people changing their usual place of living, for marriage, work, study or safety, within a district, across states or abroad.
It works like water flowing from a full tank to an empty one: people move from places with few jobs to places with more.
Migrants build cities and send money home, but they also face poor housing, low wages and hostility, while home regions lose young workers.
UPSC asks you to map migration streams, explain causes and problems, and link them with population policy and health.
1. Concepts and definitions
Migration: a change of usual residence across an administrative boundary; the Census records it by place of birth and by place of last residence, along with duration and reason.
Streams: rural to rural, rural to urban, urban to urban and urban to rural; rural to rural is the largest in India because of marriage migration of women.
Intra-regional migration: within a state or region (intra-district and inter-district); inter-regional: across states; international: across national borders (emigration and immigration).
Circular and seasonal migration: temporary moves for work with return home, such as Odisha's brick-kiln workers to Telangana or sugarcane cutters from Marathwada to western Maharashtra and Karnataka.
Net migration: in-migrants minus out-migrants for an area; remittances: money sent home by migrants.
2. Theories of migration
Ravenstein's laws: E.G. Ravenstein (The Laws of Migration, 1885, 1889) held that most migrants move short distances, migration proceeds step by step, each stream has a counter-stream, women dominate short-distance moves and economic motives dominate.
Everett Lee (A Theory of Migration, 1966): plus and minus factors at origin and destination, intervening obstacles and personal factors (the push–pull framework).
Stouffer's model (1940): S.A. Stouffer proposed intervening opportunities: the number of migrants depends on opportunities at the destination and those in between.
Wilbur Zelinsky (1971): mobility transition: forms of mobility change with the stages of demographic transition, from rural–urban moves to urban–urban and circulation.
Michael Todaro (1969): people migrate on expected, not actual, urban income, which explains rural–urban migration despite urban unemployment.
3. Patterns of migration in India
Scale (Census 2011): about 45 crore migrants by last residence, roughly 37% of the population, up from about 31 crore in 2001.
Reasons: marriage is the leading reason for women; work and employment the leading reason for men; others include moving with household, education and business.
Distance: most migrants move within the same district; inter-state migrants are a smaller share but dominate the labour market of big cities.
Major origin states: Uttar Pradesh and Bihar, then Rajasthan, Madhya Pradesh, Odisha, Jharkhand and West Bengal.
Major destinations: Maharashtra (Mumbai, Pune), Delhi NCR, Gujarat (Surat, Ahmedabad), Karnataka (Bengaluru), Tamil Nadu (Tiruppur, Chennai) and Kerala, which now attracts many workers from the east.
Railway data: the Economic Survey 2016–17 used railway passenger data to estimate inter-state work migration of about 90 lakh people a year during 2011–16.
Kerala paradox: Kerala sends many workers to the Gulf and receives many from Bengal, Assam and Odisha, a replacement migration.
International: India has the largest diaspora in the world (about 3.5 crore NRIs and PIOs, MEA estimate); major destinations are the Gulf (UAE, Saudi Arabia, Kuwait, Qatar, Oman), USA, UK, Canada and Australia.
Remittances: World Bank estimated about 129 billion US dollars in 2024, the highest for any country; RBI data put it at about 129.4 billion US dollars.
Immigration: from Nepal (open border under the 1950 treaty), Bangladesh (irregular migration to Assam, West Bengal, Tripura), and refugees such as Tibetans, Sri Lankan Tamils and Chakmas.
4. Problems associated with migration
At destination: slums, overcrowding, pressure on water and transport, informal low-paid jobs, lack of social security and political voice; Census 2011 counted 6.55 crore slum dwellers.
At origin: loss of young men (feminisation of agriculture), left-behind elderly, but also remittance-led consumption and house building, visible in Siwan and Gopalganj (Bihar) and Kerala's Gulf pockets.
COVID-19 lockdown (2020): the mass return journeys of migrant workers exposed missing data, portability gaps and lack of shelter.
Nativism: sons-of-the-soil demands in Maharashtra and Assam, and local job quota laws; Haryana's 2020 law reserving 75% of private jobs for locals was struck down by the Punjab and Haryana High Court in November 2023.
Border migration: the Assam NRC final list (31 August 2019) left out about 19 lakh people; illegal immigration remains a political issue in the north-east.
Brain drain vs brain gain: loss of doctors, nurses and engineers abroad, balanced by remittances, return of skills and diaspora investment.
Responses: One Nation One Ration Card (portability across states), e-Shram portal (2021) for unorganised workers, Affordable Rental Housing Complexes, and the eMigrate system for overseas workers.
5. Population problems
Size and pressure: about 18% of the world's people on about 2.4% of its land, causing pressure on land, water and forests.
Regional imbalance: NFHS-5 (2019–21) TFR ranged from about 3.0 in Bihar to about 1.1 in Sikkim; the Hindi belt still adds most of the growth.
Gender imbalance: low child sex ratio and missing women in the north-west, with marriage squeeze and bride trafficking from eastern states.
Youth bulge without jobs: the demographic dividend may turn into a burden if skills and employment lag.
Ageing: rising old-age dependency in Kerala, Tamil Nadu, Himachal Pradesh and Punjab requires pensions and geriatric care.
Malnutrition: NFHS-5 found 35.5% of children under five stunted, 19.3% wasted and 32.1% underweight, and 57.0% of women aged 15–49 anaemic.
6. Population policies
1952: India became the first country to launch a national family planning programme; clinic-based approach at first, then the extension approach in the 1960s.
National Population Policy 1976: raised the age of marriage and linked central assistance and seats to the 1971 population; the coercive sterilisation drive of the Emergency (1975–77) damaged trust and the programme was renamed family welfare in 1977.
Freeze on seats: the 42nd Amendment (1976) froze the allocation of Lok Sabha seats among states on the 1971 Census until 2001; the 84th Amendment (2001) extended it until the first census after 2026.
ICPD Cairo (1994): shift from targets to reproductive rights; India dropped method-specific targets in 1996 (target-free approach).
National Population Policy 2000: immediate objective to meet the unmet need for contraception and health infrastructure; medium-term objective to bring TFR to replacement level by 2010; long-term objective of a stable population by 2045; it set up a National Commission on Population.
Later programmes: National Rural Health Mission (2005), National Health Mission (2013), Mission Parivar Vikas (2016) for high-fertility districts in seven states, and Beti Bachao Beti Padhao (January 2015) for the child sex ratio.
Debate: some states proposed two-child norms for local elections and jobs; demographers argue that education, health and women's work lower fertility better than coercion (debated).
7. Health indicators
Mortality (SRS 2024): infant mortality rate 24 per 1,000 live births (rural 27, urban 17) and under-five mortality rate 28.
Maternal mortality ratio: 88 per lakh live births in 2021–23 (SRS special bulletin), down from 130 in 2014–16; Kerala lowest, Assam, Madhya Pradesh and Uttar Pradesh among the highest.
Epidemiological transition: in A.R. Omran's model (1971), India has moved from infectious diseases towards non-communicable diseases (heart disease, diabetes, cancer, stroke), which WHO estimates cause roughly six in ten deaths, while TB and vector-borne diseases persist.
Health care: Ayushman Bharat (2018): Ayushman Arogya Mandirs (former Health and Wellness Centres) for primary care and PM-JAY insurance of up to 5 lakh rupees per family a year, extended in October 2024 to all citizens aged 70 and above.
Financing: the National Health Policy 2017 targeted public health spending of 2.5% of GDP by 2025; out-of-pocket spending remains high.
Regional pattern: Kerala, Tamil Nadu and Goa have the best indicators; the EAG states (Bihar, Jharkhand, Madhya Pradesh, Chhattisgarh, Rajasthan, Uttar Pradesh, Uttarakhand, Odisha) and Assam lag.
8. Maps and diagrams to draw
Migration flow map: India outline; draw thick arrows from Uttar Pradesh and Bihar to Delhi, Mumbai, Surat and Punjab, from Odisha to Gujarat and Telangana, from the east to Kerala, and from Kerala and Uttar Pradesh to the Gulf; arrow width shows volume.
Lee's diagram: two circles (origin and destination) with plus, minus and zero signs, and a band of intervening obstacles between them.
Health map: shade states by IMR or MMR, showing the low southern block and the high central and eastern block.
9. Using it in the exam
10-mark: define the type of migration, give Census 2011 scale and reasons, one stream with example, one problem and one remedy.
15–20 marks: theory (Ravenstein, Lee, Todaro), spatial pattern with flow map, causes, consequences at origin and destination, policy responses.
Keywords: push–pull, circular migration, remittance economy, feminisation of agriculture, NPP 2000, epidemiological transition.
Quotation: Ravenstein's law that the major causes of migration are economic is the standard opening line, stated in his own terms as a law rather than a quotation.
| Type | Main cause | Example | Main problem |
|---|---|---|---|
| Intra-district, rural to rural | Marriage (women) | Across villages of the Ganga plain | Little data on women's work |
| Inter-state, rural to urban | Work (men) | Bihar and UP to Delhi, Mumbai, Surat | Slums, informal jobs, no portability |
| Seasonal or circular | Farm and kiln work | Odisha to Telangana kilns; Marathwada cane cutters | Debt bondage, child dropouts |
| International emigration | Higher wages | Kerala and UP to the Gulf; engineers to USA | Exploitation abroad, brain drain |
| Immigration | Open border, conflict | Nepal to India; Bangladesh to Assam | Identity conflict, NRC |
| Indicator | Value | Year and source |
|---|---|---|
| Infant mortality rate | 24 per 1,000 live births | SRS 2024 |
| Under-five mortality rate | 28 per 1,000 live births | SRS 2024 |
| Maternal mortality ratio | 88 per lakh live births | SRS 2021–23 |
| Life expectancy at birth | about 70.0 years | SRS 2016–20 |
| Stunting (under 5) | 35.5% | NFHS-5, 2019–21 |
| Anaemia (women 15–49) | 57.0% | NFHS-5, 2019–21 |
Mains points
- Typical questions: causes and consequences of rural–urban migration; inter-state migration and its problems; India's population policy and its evaluation; regional disparity in health indicators.
- Open with a theory (Ravenstein, Lee or Todaro) and close with policy; examiners reward the theory–data–map–policy chain.
- Give Census 2011 migration data with the year and say Census 2027 data are awaited; use SRS and NFHS-5 for health with their years.
- Draw a migration flow map with arrows of varying width; it is the most expected diagram on this topic.
- Common mistake: treating migration only as a problem; show remittances, skill transfer and urban growth as benefits.
- On population policy, contrast the coercive 1975–77 phase with the rights-based NPP 2000 and note today's low TFR and ageing challenge.
Did you know?
- India launched the world's first national family planning programme in 1952, and seven decades later its TFR has fallen below the replacement level of 2.1.
- Memory trick for NPP 2000 goals: '2010 replace, 2045 stable' = replacement TFR by 2010, stable population by 2045.
UPSC Previous Year Questions: Cultural Setting and Population of India
From 2014 to 2026 UPSC asked 35 question parts worth 490 marks from this chapter, all in Paper II. The most-asked areas are migration, population problems and health (12 parts) and growth and demographic attributes such as sex ratio, fertility, age structure and workforce (11 parts), followed by racial, linguistic and religious diversity (8) and tribes (4). Every question below has a model answer written to the UPSC word limit, with Indian data and a map or diagram.
In simple words
Read the question and the Approach line, then write your own answer in the time limit: about 7 minutes for 10 marks, 9 for 15 and 11 for 20.
Now compare with the model answer: check your introduction, the data you used (with year and source), the map or diagram and the conclusion.
Note what you missed in a notebook and revise those facts, such as Census 2011 and NFHS-5 figures, before trying the next question.
1. Racial, Linguistic, Ethnic and Religious Diversity; Cultural Regions
Example 1 (UPSC 2025, 10 marks): "Spatial distribution of religious groups in India does not show any specific pattern." Illustrate with arguments.
Paper and question: Paper II, Q5(b)
Approach: Test the statement against Census 2011 data: show that religions have clear regional cores, explain why, and concede where the distribution is mixed. Draw a map of religious cores.
Census 2011 recorded Hindus at 79.8%, Muslims 14.2%, Christians 2.3%, Sikhs 1.7%, Buddhists 0.7% and Jains 0.4% of India’s population. At the macro scale their spatial distribution shows clear patterns, so the statement is only partly true.
Regional cores: Muslims are concentrated in Lakshadweep (96.6%), Jammu and Kashmir (68.3%), Assam (34.2%), West Bengal (27.0%) and Kerala (26.6%). Christians form majorities in Nagaland, Mizoram and Meghalaya, with pockets in Kerala and Goa. Sikhs are a majority only in Punjab (57.7%); Buddhists cluster in Ladakh, Sikkim, Arunachal Pradesh and Maharashtra; Jains in Gujarat and Rajasthan.
Causes: routes of diffusion (Islam through the north-west passes and Bengal; Christianity through the Malabar coast and colonial missions in the north-eastern hills), conversion movements such as the 1956 Ambedkarite Buddhist conversions, and the 1947 Partition.
Where the statement holds: Hindus are spread everywhere, Muslims form a dispersed minority in almost every district, and metropolitan cities like Mumbai and Hyderabad are religiously mixed.
Map: Outline map of India shading the Kashmir valley and Lakshadweep (Muslim), Assam–West Bengal border districts, the Christian-majority north-eastern states, Sikh Punjab and Buddhist Ladakh, Sikkim and Arunachal Pradesh.
Thus India shows distinct religious cores with mixed transition zones rather than no pattern.
Example 2 (UPSC 2025, 10 marks): Is North East India a geo-political or geo-cultural region? Justify your answer.
Paper and question: Paper II, Q5(d)
Approach: Define both terms, give evidence for the geo-political view (borders, Siliguri corridor, security) and the geo-cultural view (ethnic, linguistic diversity), and conclude that it is primarily a geo-political construct containing many cultural regions. Draw a map of the North East.
A geo-political region is defined by political-strategic location and administration; a geo-cultural region by shared language, religion and way of life. North East India (eight states, about 8% of India’s area and 3.8% of its population, Census 2011) fits the first definition better.
Geo-political: about 98% of its boundary is international (China, Myanmar, Bangladesh, Bhutan, Nepal), and it joins the mainland only through the Siliguri corridor, about 22 km wide. The North Eastern Council (1971), the Ministry of DoNER (2001) and the Act East Policy (2014) treat it as one strategic unit.
Geo-cultural: the region is not culturally uniform. It holds over 200 tribes, Tibeto-Burman, Austro-Asiatic and Indo-Aryan languages, Christian majorities in Nagaland, Mizoram and Meghalaya, Vaishnavite Assam, and Buddhist Arunachal and Sikkim. Hill–valley contrasts (Meitei versus Naga and Kuki in Manipur) are sharp.
Common traits do exist: Mongoloid physical features, jhum cultivation, tribal customary laws protected by the Sixth Schedule and Article 371 provisions.
Map: Outline of the eight north-eastern states with the Siliguri corridor, international borders and major ethnic homelands (Naga, Mizo, Khasi–Garo, Bodo).
Hence the North East is basically a geo-political region that contains several distinct geo-cultural sub-regions.
Example 3 (UPSC 2024, 10 marks): Indian population belongs to large number of races. Discuss the spatial distribution of major races.
Paper and question: Paper II, Q5(b)
Approach: Introduce racial classifications (Risley, B.S. Guha), describe the regional distribution of each major racial element with examples, and add the modern genetic view. Draw a map of racial elements.
India is called an ‘ethnological museum’ because successive migrations mixed many racial stocks. H.H. Risley (1915) identified seven types, but the most accepted scheme is B.S. Guha’s (1930s) six major racial elements.
Negrito: the oldest stock, surviving among the Onge, Jarawa and Great Andamanese of the Andaman Islands; traces are claimed among the Kadar and Irula of the southern hills. Proto-Australoid: the tribal belt of central India (Munda, Santhal, Ho, Oraon, Bhil, Chenchu).
Mongoloid: Palaeo-Mongoloids in the North East (Naga, Mizo, Garo) and Tibeto-Mongoloids in Ladakh, Sikkim and Bhutan borders. Mediterranean: the largest element, forming the Dravidian-speaking south and much of the Ganga plain.
Western Brachycephals (Alpinoid, Dinaric, Armenoid) occur in Gujarat, Maharashtra coast, Coorg and Bengal, while the Nordic element appears in the north-west, in Punjab, Haryana and Rajasthan.
Map: Outline map of India showing Negrito (Andamans), Proto-Australoid (central tribal belt), Mongoloid (North East, Ladakh), Mediterranean (south and Ganga plain), Brachycephal (western coast, Bengal) and Nordic (north-west) zones.
Genetic studies (Reich and others, 2009) show that most Indians descend from a mix of Ancestral North Indian and Ancestral South Indian populations, so ‘race’ is a zone of admixture rather than a fixed boundary.
Example 4 (UPSC 2023, 10 marks): Explain the cultural regions of India based on their cultural attributes.
Paper and question: Paper II, Q5(d)
Approach: Define a cultural region, state the attributes used (language, religion, ethnicity, livelihood), describe the major cultural regions and conclude on their overlapping nature. Draw a cultural regions map.
A cultural region is an area whose people share traits such as language, religion, ethnicity, food, dress and livelihood, giving it a distinct identity. In India, language families and religion are the most useful attributes for delimiting them.
Indo-Aryan north: the Hindi heartland of the Ganga plain, with Punjabi, Rajasthani, Gujarati, Marathi, Bengali and Odia sub-regions; Hindu majority with a Sikh core in Punjab and Muslim concentration in the western Ganga plain.
Dravidian south: Tamil, Telugu, Kannada and Malayalam regions with Dravidian temple architecture, rice-based diet and a Christian and Muslim presence on the Kerala coast.
Austric tribal heartland: the Chota Nagpur–Bastar belt of Munda, Santhal and Gond peoples, with animist Sarna traditions and forest economies. Tibeto-Burman Himalaya and North East: Buddhist Ladakh, Sikkim and Arunachal, and Christian tribal Nagaland, Mizoram and Meghalaya.
Map: Outline map of India marking the Indo-Aryan north, Dravidian south, Austric central tribal belt, Tibeto-Burman Himalaya and North East, and the Kashmir and Punjab cultural cores.
These regions overlap at the margins (for example the Marathi–Kannada border belt), so boundaries are transition zones rather than sharp lines.
Example 5 (UPSC 2018, 15 marks): Critically assess the vanishing ethnic linguistic plurality of India.
Paper and question: Paper II, Q3(c)
Approach: Show the evidence of shrinking ethnic-linguistic plurality (endangered languages, assimilation of tribes), explain the causes, then critically weigh the counter-trends and policies. Draw a map of endangered-language hotspots.
India’s ethnic-linguistic plurality is exceptional: Census 2011 rationalised 19,569 raw mother-tongue returns into 1,369 mother tongues and 121 languages with 10,000 or more speakers. Yet this diversity is eroding.
Evidence: UNESCO’s Atlas of the World’s Languages in Danger (2010) lists 197 Indian languages as endangered, the highest for any country. The People’s Linguistic Survey of India led by G.N. Devy reported about 780 living languages and estimated that around 220 had disappeared in the previous five decades. Bo, a Great Andamanese language, died with its last speaker in 2010.
Causes: dominance of Hindi, English and state languages in schooling, jobs and media; the census rule of counting only languages with 10,000 speakers, which makes small tongues invisible; migration and urbanisation; displacement of tribes by mines and dams; and religious conversion and Sanskritisation (M.N. Srinivas), which pull small groups towards dominant cultures.
Critical view: plurality is also being reasserted. The Eighth Schedule grew from 14 to 22 languages (Bodo, Dogri, Maithili and Santhali added in 2003), Ol Chiki script for Santhali and Warang Citi for Ho are spreading, and NEP 2020 promotes mother-tongue teaching up to Class 5. The Scheme for Protection and Preservation of Endangered Languages (2013) documents threatened tongues.
Map: Outline map of India marking endangered-language hotspots in the North East, the Andaman and Nicobar Islands, the Chota Nagpur plateau and the Nilgiris.
So the decline is real for small tribal and island languages, while larger regional identities are strengthening; the balance depends on mother-tongue education and community ownership.
Example 6 (UPSC 2017, 15 marks): "Linguistic diversity is an asset as well as a challenge in India." Explain the statement focussing on the distribution of languages and the major steps taken to address the related issues.
Paper and question: Paper II, Q3(b)
Approach: Describe the distribution of language families and major languages with Census 2011 data, explain why diversity is both an asset and a challenge, and list the constitutional and policy steps. Draw a language-family map.
India has four major language families: Indo-Aryan (about 78% of speakers), Dravidian (about 20%), Austro-Asiatic and Tibeto-Burman (about 1% each). Census 2011 recorded 22 scheduled languages; Hindi is spoken by 43.6% of the population, followed by Bengali (8.0%), Marathi (6.9%), Telugu (6.7%) and Tamil (5.7%).
Distribution: Indo-Aryan languages occupy the northern plains, Gujarat, Maharashtra and the east; Dravidian languages the peninsula south of the Krishna–Godavari; Austro-Asiatic (Santhali, Mundari, Ho, Khasi) the Chota Nagpur plateau and Meghalaya; Tibeto-Burman the Himalaya and the North East.
Asset: rich literature and cultural heritage, a multilingual workforce for services and tourism, and linguistic states that made administration closer to the people.
Challenge: language agitations (anti-Hindi movement in Tamil Nadu, 1965), border disputes such as Belagavi, demands for new states and scheduling of more languages, neglect of tribal tongues, and difficulties in national communication.
Steps taken: States Reorganisation Act, 1956 on the Fazl Ali Commission’s advice; the Eighth Schedule (now 22 languages); Article 350A (primary education in the mother tongue) and Article 350B (Commissioner for Linguistic Minorities); the three-language formula (1968, retained flexibly in NEP 2020); and classical-language status, extended to 11 languages by 2024.
Map: Outline map of India shading the Indo-Aryan, Dravidian, Austro-Asiatic and Tibeto-Burman zones, with major languages labelled in each.
Managed through federal accommodation, linguistic diversity has strengthened rather than weakened national unity.
Example 7 (UPSC 2017, 15 marks): Religious minorities are largely concentrated in border States of India. Discuss its causes and consequences.
Paper and question: Paper II, Q6(b)
Approach: Verify the statement with Census 2011 data on minority concentration in border states, then explain historical-geographical causes and the security, political and developmental consequences. Draw a map of border states with minority shares.
Religious minorities form about 20% of India’s population (Census 2011), but they are spatially concentrated along the frontier states: Muslims in Jammu and Kashmir (68.3%), Assam (34.2%) and West Bengal (27.0%); Sikhs in Punjab (57.7%); Christians in Nagaland (87.9%), Mizoram (87.2%) and Meghalaya (74.6%); Buddhists in Ladakh, Sikkim and Arunachal Pradesh. Lakshadweep (96.6% Muslim) is a maritime frontier.
Causes: (i) diffusion routes: Islam entered through the north-western passes and the Bengal delta; Tibetan Buddhism spread across the Himalaya. (ii) Partition (1947) drew the boundary through Punjab and Bengal, leaving mixed populations on both sides. (iii) Colonial policy of ‘excluded areas’ allowed missionary work in the north-eastern hills. (iv) Continued migration from Bangladesh into Assam and West Bengal. (v) Isolated hill and island settings protected distinct identities.
Consequences: security concerns, since cross-border ethnic and religious ties can be exploited by hostile states; identity-based movements and insurgency (Khalistan in the 1980s, Naga and Mizo insurgencies); contested citizenship issues such as the Assam NRC (final list of August 2019 excluded about 19 lakh people) and the Citizenship (Amendment) Act, 2019.
Positively, constitutional safeguards (Sixth Schedule, Articles 371A and 371G) and cultural links support soft-power diplomacy with neighbours, for example Buddhist circuits with Bhutan and Myanmar.
Map: Outline map of India shading border states and labelling the dominant minority and its share (Census 2011).
Inclusive development, border-area programmes such as the Vibrant Villages Programme (2023) and respect for identity are the way to turn these frontiers into bridges.
Example 8 (UPSC 2016, 15 marks): Point out the ethnic disparities in the N-E India.
Paper and question: Paper II, Q3(b)
Approach: Outline the ethnic mosaic of the North East, then point out disparities in numbers, land, political power and development among groups (hill–valley, tribal–non-tribal, indigenous–migrant) with state examples. Draw an ethnic map.
North East India is an ethnic mosaic of over 200 tribes and several non-tribal groups speaking Tibeto-Burman, Austro-Asiatic and Indo-Aryan languages. Scheduled Tribes form 94.4% of Mizoram’s population but only 12.4% of Assam’s (Census 2011), so ethnic shares and fortunes differ sharply.
Hill–valley disparity: in Manipur the Meitei occupy the central valley, about 10% of the area, while Naga and Kuki-Zo tribes hold the hills; land laws, development and political power are unequal, and the conflict since May 2023 reflects this divide.
Tribal–non-tribal disparity: in Tripura migration from East Bengal reduced tribal people to a minority (31.8% in 2011), fuelling insurgency and the Tripura Tribal Areas Autonomous District Council. In Assam, Bodo, Karbi and Dimasa movements arose against the dominance of the Assamese-speaking plains people; the Bodo Accord (2020) created the Bodoland Territorial Region.
Indigenous–migrant tension: the Assam Movement (1979–85) against Bangladeshi immigrants and the Inner Line Permit demands in Meghalaya and Manipur show fear of demographic swamping.
Development gaps: remote groups such as the Chakma and Bru (Reang) refugees and hill tribes of Arunachal lag in literacy, roads and health compared with Imphal, Guwahati or Aizawl.
Map: Outline map of the North East marking the Manipur valley and hills, Bodoland, Karbi Anglong, Tripura tribal council areas and Naga, Mizo and Khasi–Garo homelands.
Decentralised autonomy, fair land rights and connectivity under the Act East Policy can narrow these disparities.
2. Tribes, Tribal Areas and Their Problems
Example 9 (UPSC 2026, 15 marks): Assess the role of geographical isolation in preserving tribal culture, as well as hindering their socio-economic development in India.
Paper and question: Paper II, Q7(c)
Approach: Explain isolation as a geographical condition, show how it preserved tribal culture (examples) and how it hinders development (data), then weigh the isolation–assimilation–integration debate. Draw a map of isolated tribal areas.
Most of India’s 10.4 crore Scheduled Tribes (8.6% of the population, Census 2011) live in hills, forests, plateaus and islands where relief, dense forest and poor transport create geographical isolation. About 90% of them are rural.
Isolation as protector of culture: remoteness kept languages, customary laws, religions and ecological knowledge intact. The Sentinelese and Jarawa of the Andamans retain hunting-gathering lifeways; the Dongria Kondh of the Niyamgiri hills (Odisha) preserve sacred-mountain beliefs; the Apatani of Ziro valley (Arunachal Pradesh) maintain wet-rice and fish farming.
Isolation as barrier to development: ST literacy was only 59.0% against 73.0% nationally (Census 2011); in 2011–12 about 45% of rural STs were below the Tendulkar poverty line. Remote habitations lack roads, schools and health care, so anaemia, sickle-cell disease and malnutrition are high. Many of the 75 Particularly Vulnerable Tribal Groups (PVTGs) are the most isolated.
Isolation has also made tribes vulnerable when it breaks suddenly: roads, mines and dams bring land alienation, displacement (Sardar Sarovar, Chhattisgarh coalfields) and cultural erosion, and remote forests have sheltered Left-Wing Extremism.
Debate: Verrier Elwin favoured protection, G.S. Ghurye assimilation, and Nehru’s Tribal Panchsheel chose integration on tribal terms, reflected in the Fifth and Sixth Schedules, PESA 1996, the Forest Rights Act 2006 and PM-JANMAN (2023) for PVTG habitations.
Map: Outline map of India marking the Andaman Islands, Niyamgiri, Bastar, Ziro valley and the central tribal belt.
The goal is selective connectivity: services and livelihoods should reach tribal areas without dissolving their identity.
Example 10 (UPSC 2025, 20 marks): Why is the pattern of population distribution of scheduled castes and scheduled tribes different in India? Compare their socio-economic problems with examples.
Paper and question: Paper II, Q3(a)
Approach: Contrast the distribution of SCs (plains, agrarian, dispersed) and STs (hills, forests, clustered) with Census 2011 data and explain the historical-geographical reasons; then compare their socio-economic problems with examples. Draw a two-panel map.
Census 2011 counted 20.1 crore Scheduled Castes (16.6%) and 10.4 crore Scheduled Tribes (8.6%). Their patterns differ because SCs are a part of caste society, while STs are distinct ethnic communities tied to particular habitats.
SC distribution: dispersed through fertile, densely settled agricultural plains where they served as landless labourers and artisans. Uttar Pradesh has the largest number; Punjab has the highest share (31.9%), followed by Himachal Pradesh and West Bengal. SCs are nearly absent in the tribal North East and Lakshadweep, and about 24% live in towns.
ST distribution: clustered in hills, forests and plateaus away from the plains: the central belt (Madhya Pradesh has the largest number, then Maharashtra, Odisha, Rajasthan, Gujarat and Jharkhand) and the North East, where STs form majorities (Mizoram 94.4%, Lakshadweep 94.8%). Punjab, Haryana and Delhi have no notified STs, and about 90% of STs are rural.
Common problems: poverty (rural poverty 31.5% for SCs and 45.3% for STs in 2011–12, Tendulkar method), low literacy (SC 66.1%, ST 59.0% in 2011) and poor health.
SC-specific problems arise from social hierarchy: untouchability, atrocities (hence the SC/ST Prevention of Atrocities Act, 1989), landlessness and manual scavenging. ST-specific problems arise from habitat loss: land alienation, displacement by dams and mines (Sardar Sarovar, Niyamgiri), loss of forest rights, isolation, sickle-cell disease and Left-Wing Extremism in Bastar.
Map: Two outline maps of India: one shading states by SC share (high in Punjab, Himachal Pradesh, West Bengal, Uttar Pradesh), the other by ST share (high in the North East, central tribal belt and Lakshadweep).
Thus SC deprivation is social and economic within mainstream space, while ST deprivation is ecological and spatial; policy must combine dignity and land reform for SCs with forest rights, PESA and area development for STs.
Example 11 (UPSC 2022, 10 marks): Discuss the impact of Forest Rights Act, 2006 on the local forest communities in India.
Paper and question: Paper II, Q5(a)
Approach: State the purpose and provisions of the FRA 2006, assess positive impacts with examples and data, then the shortcomings. Draw a map of key FRA cases.
The Forest Rights Act, 2006 sought to undo the ‘historical injustice’ to forest dwellers by recognising individual rights over cultivated forest land and community forest resource rights to use, manage and protect forests, with the Gram Sabha as the key authority.
Positive impacts: by May 2025 about 51 lakh claims had been filed and over 25 lakh titles distributed (Ministry of Tribal Affairs). Mendha Lekha in Gadchiroli (Maharashtra) won rights over bamboo and earned income from its sale; the Supreme Court’s Niyamgiri judgment (2013) let Dongria Kondh Gram Sabhas reject bauxite mining.
Shortcomings: about 36% of claims were rejected, often without reasons; community rights lag far behind individual titles; other traditional forest dwellers struggle to prove 75 years of residence; and diversion of forest land for mines and projects, along with the Forest (Conservation) Amendment Act, 2023, is seen by critics as diluting Gram Sabha consent.
Map: Outline map of India marking Mendha Lekha (Gadchiroli), Niyamgiri (Odisha), Hasdeo Arand (Chhattisgarh) and the states with most titles (Odisha, Chhattisgarh, Madhya Pradesh).
The Act has empowered communities where Gram Sabhas are active; full implementation of community rights is the next step.
Example 12 (UPSC 2016, 15 marks): Describe the major tribal regions of India and their problems.
Paper and question: Paper II, Q7(b)
Approach: Classify the tribal regions of India with major tribes in each, then describe the problems typical of each region and common problems. Draw a map of tribal regions.
India has 705 notified Scheduled Tribe communities, forming 8.6% of the population (Census 2011). Their homelands can be grouped into five tribal regions based on location and ethnic affinity.
North-eastern region: Naga, Mizo, Khasi, Garo, Bodo, Adi; problems: insurgency, ethnic conflict, shifting cultivation (jhum) with shortened cycles, and poor connectivity. Himalayan region: Bhotia, Gaddi, Gujjar-Bakarwal, Tharu, Lepcha; problems: pastoral decline, landslides and out-migration.
Central region, the largest, covering Jharkhand, Odisha, Chhattisgarh and Madhya Pradesh: Santhal, Munda, Ho, Oraon, Gond, Baiga; problems: displacement by mines, dams and industry, land alienation, indebtedness and Left-Wing Extremism. Western region: Bhil, Meena, Warli and Dubla in Rajasthan, Gujarat and Maharashtra; problems: drought, seasonal migration and malnutrition.
Southern region: Toda, Kota, Kurumba, Irula of the Nilgiris, Chenchu of the Nallamala and Kadar of the Western Ghats; problems: loss of forest access to plantations and protected areas. Island region: Jarawa, Onge, Sentinelese, Shompen and Nicobarese; problems: tiny numbers, disease from contact and tourism pressure.
Common problems: low literacy (59.0% in 2011), poor health including anaemia and sickle-cell disease, erosion of language and culture, and weak implementation of PESA 1996 and the Forest Rights Act 2006. Of the 705 groups, 75 are classed as Particularly Vulnerable Tribal Groups.
Map: Outline map of India shading the five tribal regions and naming two or three tribes in each.
Region-specific plans, such as the Tribal Sub-Plan and PM-JANMAN for PVTGs, should respect tribal autonomy and ecology.
3. Growth, Distribution, Density and Demographic Attributes of Population
Example 13 (UPSC 2026, 20 marks): Examine the trends in fertility rates across Indian states over time. How are they projected to evolve by 2050?
Paper and question: Paper II, Q6(a)
Approach: Trace the national TFR decline with NFHS and SRS data, explain the north–south divergence with state figures and causes, then present projections to 2050 (Lancet GBD, UN) and their implications. Draw a choropleth of state TFR.
The total fertility rate (TFR) is the average number of children a woman would bear in her reproductive years; 2.1 is the replacement level. India’s TFR fell from 5.2 in 1971 (SRS) to 3.4 in NFHS-1 (1992–93), 2.2 in NFHS-4 (2015–16) and 2.0 in NFHS-5 (2019–21).
Spatial trend: the decline began in the south. Kerala fell below replacement by the late 1980s and Tamil Nadu in the 1990s. In NFHS-5, 31 of 36 states and UTs were at or below 2.1; Sikkim (1.1), Goa (1.3), Jammu and Kashmir (1.4), West Bengal and Punjab (1.6), and Kerala and Tamil Nadu (1.8) were lowest. Only Bihar (3.0), Meghalaya (2.9), Uttar Pradesh (2.4), Jharkhand (2.3) and Manipur (2.2) remained above replacement.
Causes of divergence: female literacy and later marriage, better child survival, women’s autonomy (the north–south kinship contrast of Dyson and Moore, 1983), health-system reach and urbanisation.
Projection to 2050: the Lancet GBD 2021 fertility study (2024) estimates India’s TFR at 1.91 in 2021, falling to about 1.29 by 2050. The UN World Population Prospects 2024 expects India’s population to peak at about 1.7 billion in the early 2060s because of population momentum. The lagging states will converge, so the north–south gap will narrow but not vanish.
Implications: the working-age share will peak around 2041 (Economic Survey 2018–19), then ageing will accelerate, first in the south; migration from young northern states to ageing southern ones will grow, and the delimitation of Lok Sabha seats will be politically sensitive.
Map: Choropleth of Indian states by NFHS-5 TFR in three classes (below 1.8, 1.8–2.1, above 2.1), highlighting the high-fertility Bihar–Uttar Pradesh–Jharkhand core and Meghalaya.
Diagram: Line graph of India’s TFR from 1971 to 2021 with the projected path to 2050 and a horizontal line at 2.1.
India has completed its fertility transition nationally; the task ahead is to manage ageing in the south and accelerate female education and health in the Hindi heartland.
Example 14 (UPSC 2025, 15 marks): What are the key features of sex-ratio of population in India? Evaluate the impacts of child sex-ratio on general sex-ratio in the country.
Paper and question: Paper II, Q6(c)
Approach: Give the key features of India’s sex ratio (trend, rural–urban, regional, age-specific) with Census 2011, NFHS-5 and SRS data, then evaluate how a falling child sex ratio feeds into the general sex ratio. Draw a map and a trend graph.
India measures sex ratio as females per 1,000 males. Census 2011 recorded 943 overall and a child sex ratio (0–6 years) of only 918.
Key features: (i) a long-term deficit of women, from 972 in 1901 to 927 in 1991 before recovering; (ii) rural ratio (949) above urban (929) because men migrate to towns; (iii) a north-west–south contrast, with Haryana lowest among states (879) and Kerala highest (1,084); (iv) an elderly sex ratio above 1,000 because women live longer.
Child sex ratio trend: it fell from 945 in 1991 to 927 in 2001 and 918 in 2011, lowest in Haryana (834) and Punjab (846), because of son preference and sex-selective abortion. SRS shows sex ratio at birth improving from 899 in 2014 to 913 in 2021.
Impact on the general sex ratio: today’s children are tomorrow’s adults, so each deficient cohort moves up the age pyramid and lowers the ratio at working and reproductive ages, leading to a marriage squeeze and bride trafficking into Haryana. The overall ratio still rose in 2011 because female life expectancy gains and lower maternal mortality raised the number of adult and elderly women; this masks the damage at young ages.
Map: Choropleth of states by child sex ratio (Census 2011), marking the Punjab–Haryana–Delhi–western Uttar Pradesh low belt.
Diagram: Line graph of general and child sex ratios from 1961 to 2011 showing the widening gap.
Sustained enforcement of the PCPNDT Act (1994) and Beti Bachao Beti Padhao (2015) is needed so that improving birth ratios translate into a balanced population.
Example 15 (UPSC 2024, 15 marks): How is cultural background of States of India reflected in the attributes of sex and age structure?
Paper and question: Paper II, Q6(b)
Approach: Link cultural attributes (kinship, son preference, female autonomy, marriage age, religion-linked fertility) to regional differences in sex ratio and age structure, using the north–south model of Dyson and Moore and state data. Draw a map.
Sex and age structure are demographic outcomes, but they are filtered through culture. Dyson and Moore (1983) showed that India’s kinship systems divide it into a north-west with strong patriliny and low female autonomy and a south and east with more female autonomy, and this is mirrored in demographic attributes.
Sex composition: in the patrilineal north-west, son preference, dowry and inheritance through sons produce low sex ratios: Haryana 879 and Punjab 895 overall, with child sex ratios of 834 and 846 (Census 2011). Kerala (1,084), with a matrilineal past and high female literacy, and Tamil Nadu (996) show near-balanced ratios. Tribal states such as Chhattisgarh (991) and Meghalaya (989), where bride price and women’s economic roles are common, also have favourable ratios.
Age structure: the Hindi heartland, where early marriage persists (about 41% of women aged 20–24 in Bihar married before 18, NFHS-5), has high fertility and a broad-based young pyramid. Kerala, Tamil Nadu and Himachal Pradesh, where women marry later and are educated, have narrow bases and the highest share of elderly people. Matrilineal Meghalaya is an exception: women’s status is high but fertility (2.9) is too, owing to pronatalist clan values, so its population is young.
Map: Outline map of India dividing the north-western patrilineal zone (low sex ratio, young population) from the southern and eastern zone (high sex ratio, older population), with Meghalaya and the tribal belt marked.
Thus culture shapes who is born, who survives and when families stop having children; female education and autonomy are the levers that change these patterns.
Example 16 (UPSC 2023, 20 marks): With falling fertility rate and rising median age, how can India translate demographic dividend to economic dividend?
Paper and question: Paper II, Q4(a)
Approach: Define demographic dividend and show India’s window with data on fertility, median age and working-age share; identify the barriers (skills, female work, jobs, health, regional mismatch) and give a strategy with schemes. Draw an age pyramid comparison.
The demographic dividend is the growth potential that arises when the working-age share of the population rises relative to dependants. With TFR at 2.0 (NFHS-5, 2019–21) and a median age of about 28 years, India is in this window; the Economic Survey 2018–19 projects the working-age share to peak around 2041, after which ageing (60+ rising from 10.5% in 2022 to 20.8% in 2050, India Ageing Report 2023) will close it.
Barriers: (i) low female labour force participation, 41.7% in PLFS 2023–24, though rising; (ii) a large informal sector and heavy dependence on agriculture (46.1% of workers); (iii) skill deficits and weak learning outcomes; (iv) malnutrition, with 35.5% of children stunted (NFHS-5), which lowers future productivity; (v) a regional mismatch: the young population is in Bihar and Uttar Pradesh, while jobs and ageing are in the south and west.
Strategy: human capital first: foundational learning and vocational streams under NEP 2020, Skill India and PMKVY (2015), and nutrition through Poshan 2.0. Job creation through labour-intensive manufacturing (PLI schemes from 2020, textile parks, electronics), MSME credit and the services sector, with infrastructure in lagging states so that jobs move closer to workers.
Women’s work: childcare, safe transport, hostels and flexible work can lift female participation, the largest untapped source of the dividend. Mobility: portable welfare (One Nation One Ration Card, e-Shram registration) eases migration from young to ageing regions.
Health and savings: Ayushman Bharat PM-JAY and preventive care keep workers productive, while pension coverage prepares for the ageing that follows.
Diagram: Two age–sex pyramids: India 2011 (broad base) and projected 2041 (bulging middle), with the working-age band 15–59 shaded.
India’s window is time-bound and regionally staggered; converting it into an economic dividend depends on jobs, skills, health and women’s participation in the next two decades.
Example 17 (UPSC 2022, 10 marks): How would decline in Total Fertility Rate (TFR) below the replacement level, in many states of India affect the future population structure of the country?
Paper and question: Paper II, Q5(d)
Approach: State the extent of sub-replacement fertility (NFHS-5) and explain its effects on age structure, dependency, workforce, regional balance and politics. Draw comparative pyramids.
NFHS-5 (2019–21) found India’s TFR at 2.0, below the replacement level of 2.1, with 31 of 36 states and UTs at or below it; Sikkim (1.1) and Goa (1.3) are lowest, while Bihar (3.0) and Uttar Pradesh (2.4) remain above.
Effects on structure: the base of the age pyramid narrows, the share of children falls and the working-age bulge peaks around 2041. Because of population momentum, numbers keep growing until the early 2060s before declining.
Ageing: the elderly share is projected to double from 10.5% in 2022 to 20.8% in 2050 (India Ageing Report 2023), with more widows and older women (feminisation of ageing) and a rising old-age dependency ratio.
Regional imbalance: southern states such as Kerala and Tamil Nadu will age first and face labour shortages, drawing migrants from the younger Hindi heartland; the fixed share of Lok Sabha seats until delimitation after the first census after 2026 makes this politically sensitive.
Diagram: Age pyramids of Kerala (narrow base, wide top) and Bihar (broad base) for comparison.
India must use the remaining dividend years for jobs and skills while building pensions and elder care.
Example 18 (UPSC 2020, 15 marks): The process of demographic transition is not uniform in India. Examine this statement in the context of demographic transition theory.
Paper and question: Paper II, Q6(c)
Approach: Explain the demographic transition model (Thompson, Notestein) and its stages, place India and its states in different stages with data, give reasons for non-uniformity and critique the model in the Indian context. Draw the DTM diagram.
The demographic transition theory, developed from the work of W.S. Thompson (1929) and F.W. Notestein (1945), states that with modernisation a population moves from high birth and death rates (stage 1), through falling death rates and rapid growth (stage 2), to falling birth rates (stage 3) and finally low birth and death rates (stage 4).
India’s path: before 1921 it was in stage 1; 1921, the ‘great divide’, began stage 2 as famine and epidemic control lowered mortality; from the 1970s fertility started to fall (stage 3). In 2021 the crude birth rate was about 19 and the death rate about 7.5 (SRS), and TFR is 2.0, so India as a whole is at the end of stage 3.
Non-uniform transition: Kerala, Tamil Nadu, Goa, Punjab and West Bengal have TFRs of 1.6–1.8 or less (NFHS-5), placing them in stage 4. Bihar (TFR 3.0), Uttar Pradesh, Jharkhand and Meghalaya are still in late stage 3.
Reasons: differences in female literacy and age at marriage, health-system strength, women’s autonomy, urbanisation and the reach of family planning.
Critique: the model was built on Western Europe’s industrial experience, but Kerala and Tamil Nadu reached stage 4 at low incomes through social development, showing that education and health can substitute for industrialisation.
Diagram: The DTM graph with birth and death rate curves over four stages, with Indian states placed at their stage.
The transition in India is therefore real but regionally staggered, which calls for region-specific population and health policies.
Example 19 (UPSC 2020, 20 marks): Analyse the changing nature of workforce composition vis-à-vis rural-urban divide in India.
Paper and question: Paper II, Q8(a)
Approach: Describe workforce composition by sector and status from Census 2011 and PLFS, then analyse how it differs and is changing in rural and urban India (agriculture, non-farm shift, women, informality) and why. Draw a comparative bar diagram.
Workforce composition means the distribution of workers by sector, occupation and employment status. Census 2011 counted about 48 crore workers (work participation rate 39.8%), of whom cultivators were 24.6%, agricultural labourers 30.0%, household industry workers 3.8% and other workers 41.6%. For the first time agricultural labourers outnumbered cultivators.
Rural India: agriculture still dominates; nationally it employed 46.1% of workers in PLFS 2023–24, most of them rural. Shrinking holdings have pushed men into rural construction, transport and trade, the so-called non-farm diversification, while women stay in farming, producing a feminisation of agriculture. Rural female labour force participation rose from 24.6% in 2017–18 to 47.6% in 2023–24 (PLFS), largely as unpaid family helpers and self-employed workers.
Urban India: workers are concentrated in manufacturing, construction and services such as trade, transport, IT and finance. Regular salaried jobs are far more common than in villages, but informality remains high and new forms such as gig and platform work are expanding. Urban female participation is only about half the rural level, reflecting social norms and lack of suitable jobs.
Changing nature: the share of agriculture fell from about 70% of workers in 1951 to under half today, but the shift has been mainly to construction and informal services rather than factory jobs. Self-employment (58.4% of workers in 2023–24) remains the main status, and casual work is widespread in both areas. The rural–urban gap in productivity and wages drives migration and circular mobility.
Regional pattern: the agricultural share is highest in Bihar, Chhattisgarh and Madhya Pradesh and lowest in Kerala, Goa and Delhi, where services dominate.
Diagram: Paired bar chart of rural and urban workers by sector (agriculture, manufacturing, construction, services) and by status (self-employed, regular, casual).
The divide is narrowing slowly; labour-intensive manufacturing in small towns, rural non-farm enterprises and skilling are needed for a structural transformation.
Example 20 (UPSC 2019, 15 marks): Explain the present status of age-structure and availability of workforce in India.
Paper and question: Paper II, Q4(c)
Approach: Present India’s present age structure with Census and recent estimates, explain what it means for workforce availability (dividend, participation, regional differences) and the constraints. Draw an age pyramid.
Age structure is the distribution of population across age groups. Census 2011 showed 30.8% of Indians aged 0–14, 60.3% aged 15–59 and 8.6% aged 60 and above. Falling fertility (TFR 2.0, NFHS-5) has since shrunk the child share and enlarged the working-age group, while the elderly reached about 10.5% in 2022 (India Ageing Report 2023).
Workforce availability: India has one of the world’s largest working-age populations, adding millions of entrants each year, and a median age of about 28. This creates a demographic dividend window expected to last until around 2041 (Economic Survey 2018–19).
Constraints: a large potential workforce does not mean actual workers. Female labour force participation was only 41.7% in PLFS 2023–24, many youths are in education or not in employment, and skill levels and health (35.5% of children stunted, NFHS-5) limit productivity.
Regional contrast: Bihar, Uttar Pradesh and Jharkhand have young, fast-growing labour pools, while Kerala, Tamil Nadu and Himachal Pradesh are ageing and already import workers; Kerala hosts lakhs of migrant workers from the east.
Diagram: Age–sex pyramid of India showing a narrowing base, broad middle (15–59) and a widening top.
With the right investment in skills, jobs and women’s work, India’s age structure is an asset; without it, the bulge could become a burden of unemployment.
Example 21 (UPSC 2016, 10 marks): Discuss the factors influencing the distribution of sex ratio in India.
Paper and question: Paper II, Q5(a)
Approach: Give the regional pattern of sex ratio (Census 2011) and explain the biological, social-cultural, economic and migration factors behind it. Draw a choropleth.
India’s sex ratio was 943 females per 1,000 males in 2011, ranging from 1,084 in Kerala to 879 in Haryana and 618 in Daman and Diu (Census 2011).
Biological factors: about 105 boys are born for every 100 girls, but women live longer, so ratios rise with age.
Socio-cultural factors: son preference, dowry and patrilineal inheritance in the north-west lead to sex-selective abortion and neglect of girls, depressing ratios in Haryana, Punjab and Delhi. Female literacy and autonomy in Kerala and Tamil Nadu and women’s economic role in tribal areas (Chhattisgarh 991) favour balance.
Mortality: high maternal mortality and anaemia once reduced women’s survival in states such as Uttar Pradesh and Bihar.
Migration: male-selective migration lowers ratios at destinations (Delhi 868, Surat, industrial UTs) and raises them at origins such as the Uttarakhand hills and Kerala.
Map: Choropleth of states by sex ratio (Census 2011) in three classes, marking the low north-western belt and high south and hill states.
Sex ratio thus reflects both social attitudes and economic mobility; balanced ratios need gender equity, not just enforcement.
Example 22 (UPSC 2015, 10 marks): "Age-sex pyramid is representative of the history of a region." Explain.
Paper and question: Paper II, Q5(b)
Approach: Explain what an age-sex pyramid shows and how past events (fertility change, wars, epidemics, migration, policy) leave marks on it, with Indian and world examples. Draw an annotated pyramid.
An age-sex pyramid is a pair of horizontal bar graphs showing males and females in successive age groups. Because every cohort carries the experience of its birth years through life, the pyramid is a record of a region’s demographic history.
Fertility history: a broad base shows past high fertility; a narrowing base shows fertility decline, as in India since the 1990s and very sharply in China after the one-child policy (1980).
Wars and disasters: notches mark cohorts lost or unborn; Russia’s pyramid still shows the male deficit and birth dip of the Second World War, and post-war ‘baby boom’ bulges appear in the USA and Europe.
Migration: Gulf states show a huge male bulge at working ages; Kerala and the Uttarakhand hills show deficits of working-age men; Delhi and Surat show male excess at 20–39.
Social practices: a narrow female bar at 0–6 years in Haryana records son preference.
Diagram: India’s pyramid annotated with the narrowing base (fertility decline), the bulge at 15–59 and female excess at old ages.
Thus the pyramid summarises a region’s past and forecasts its future.
Example 23 (UPSC 2014, 10 marks): Highlight the implications of declining child sex ratio in India.
Paper and question: Paper II, Q5(b)
Approach: Give the trend and pattern of the child sex ratio (Census 1991–2011, SRS), then highlight its demographic, social and economic implications and the policy response. Draw a map of low-CSR districts.
The child sex ratio (girls per 1,000 boys aged 0–6) fell from 945 in 1991 to 927 in 2001 and 918 in 2011, the lowest since independence. It is lowest in Haryana (834), Punjab (846) and Jammu and Kashmir (862), and the decline has spread from the north-west to Maharashtra and Gujarat.
Demographic implications: a growing deficit of women in future adult cohorts, fewer mothers and a lower general sex ratio as these children age.
Social implications: a marriage squeeze leaving many men unmarried; bride trafficking into Haryana and Punjab from Assam, West Bengal and Odisha; and a higher risk of violence against women.
Economic and ethical implications: loss of women’s labour and human capital, and normalisation of gender discrimination through sex-selective abortion.
Response: the PCPNDT Act (1994, amended 2003) and Beti Bachao Beti Padhao (2015, launched in 100 low-ratio districts) have helped: the sex ratio at birth rose from 899 in 2014 to 913 in 2021 (SRS).
Map: Outline map of India shading states with child sex ratio below 900 in 2011 (Haryana, Punjab, Jammu and Kashmir, Delhi, Chandigarh).
Changing son preference through education and women’s property rights is the lasting solution.
4. Migration, Population Problems, Policies and Health Indicators
Example 24 (UPSC 2026, 10 marks): Analyse the consequences of circular migration in India. How does it influence both rural development and the urban economy?
Paper and question: Paper II, Q5(a)
Approach: Define circular migration with Indian examples, then analyse its consequences for rural areas (remittances, labour, gender) and for the urban economy (flexible labour, informality, vulnerability). Draw a flow map.
Circular migration is repeated, temporary movement between a home village and work destinations without permanent settlement. Examples are Odisha’s Bolangir and Nuapada workers going to brick kilns in Telangana and Andhra Pradesh, Beed’s sugarcane cutters moving to western Maharashtra and Karnataka, and Bihar’s workers in Punjab’s farms and Delhi’s construction sites. Deshingkar and Akter (2009) estimated about 100 million circular migrants in India.
Rural development: remittances repay debts and finance food, housing, education and farm inputs; families keep land and village ties. Negatives include labour shortages in peak seasons, women and the elderly left to manage farms, and interrupted schooling for children who accompany parents.
Urban economy: migrants provide cheap, flexible labour for construction, manufacturing, transport and domestic work, keeping costs low. But they live in slums and worksite camps, lack social security and are invisible to city planning; the 2020 lockdown exodus exposed this fragility.
Map: Flow map of India showing arrows from Bihar, eastern Uttar Pradesh, Odisha and Jharkhand to Delhi, Punjab, Mumbai, Surat and the Telangana–Andhra brick-kiln belt.
Portable entitlements (One Nation One Ration Card, e-Shram) and rental housing can make circular migration a bridge between rural and urban economies.
Example 25 (UPSC 2024, 20 marks): Migration is the reflection of regional disparities. What socio-economic and demographic consequences are experienced at the place of origin and destination?
Paper and question: Paper II, Q4(a)
Approach: Link migration to regional disparities using push–pull theory and Indian flow data, then discuss socio-economic and demographic consequences at origin and destination separately. Draw a flow map.
Migration responds to spatial differences in wages, jobs and services: in E.S. Lee’s (1966) push–pull framework, poverty and underemployment push people out of lagging regions and opportunities pull them to developed ones. Census 2011 counted about 45 crore migrants by place of last residence (37% of the population), and the Economic Survey 2016–17 estimated about 90 lakh inter-state migrants a year. The main flows run from Uttar Pradesh, Bihar, Rajasthan, Madhya Pradesh and Odisha to Delhi, Maharashtra, Gujarat, Punjab, Karnataka and Kerala, mirroring the map of disparity.
At origin, socio-economic: remittances raise consumption, housing and schooling (Siwan and Gopalganj in Bihar, coastal Kerala); underemployment falls; new skills and ideas return. But out-migration of the young and educated causes a brain drain, labour shortages and dependence on money orders rather than local investment.
At origin, demographic: male-selective migration raises the sex ratio and the share of children and elderly, leaves women as de facto household heads and contributes to the feminisation of agriculture; hill villages in Uttarakhand have become depopulated.
At destination, socio-economic: migrants fuel construction, industry and services in Mumbai, Surat, Delhi and Bengaluru, but they also add to slums, water and transport stress and informal work, and provoke nativist politics such as demands for local job quotas.
At destination, demographic: a younger, male-dominated population (Delhi’s sex ratio 868 and Surat’s still lower, Census 2011), faster urban growth and greater cultural diversity.
Map: Flow map of India with arrow widths proportional to inter-state migration from the Hindi heartland and Odisha to the western, southern and north-western destinations.
Migration thus both reflects and partly corrects disparity; balanced regional development and portable social security would make it a choice rather than a compulsion.
Example 26 (UPSC 2024, 15 marks): Health is the outcome of interaction between physical setting, cultural traits and ecological connection. Explain.
Paper and question: Paper II, Q8(b)
Approach: Introduce medical geography (Jacques May’s disease ecology), then explain with Indian examples how physical setting, cultural traits and ecological links produce health outcomes, and conclude with the One Health approach. Draw a disease-region map.
Medical geography treats health as the product of the disease ecology of a place: Jacques May (1950s) argued that disease arises where pathogens, the physical environment and human behaviour meet. A.T.A. Learmonth applied this approach to South Asia.
Physical setting: iodine-poor soils of the Himalaya and Ganga plain created a goitre belt; fluoride-rich groundwater causes fluorosis in Rajasthan and Nalgonda (Telangana); arsenic in the aquifers of the Ganga–Brahmaputra delta affects West Bengal and Bihar; humid forested hills of Odisha, Chhattisgarh and the North East carry the highest malaria burden.
Cultural traits: diet, habits and social organisation shape risk: tobacco and areca chewing contribute to high oral and throat cancer rates in the North East; rice-heavy and sedentary lifestyles add to diabetes in Kerala and Tamil Nadu; open defecation spread diarrhoeal disease and stunting; sickle-cell anaemia is concentrated among central Indian tribes partly through endogamy.
Ecological connection: human–animal–environment links generate zoonoses. Kyasanur Forest Disease spread as Western Ghats forests were cleared in Karnataka; Japanese encephalitis in Gorakhpur is linked to paddy fields, pig rearing and Culex mosquitoes; Nipah in Kerala spills over from fruit bats; kala-azar persists in the sandfly habitats of Bihar.
Map: Outline map of India marking the goitre belt, fluorosis and arsenic zones, the malaria-endemic tribal belt, Gorakhpur (JE), the Western Ghats (KFD) and Kerala (Nipah).
Health planning must therefore be place-based; the One Health approach that links human, animal and environmental health is the logical response.
Example 27 (UPSC 2023, 15 marks): Describe the regional variations of health indicators among the Indian States.
Paper and question: Paper II, Q8(c)
Approach: Select key health indicators (IMR, MMR, life expectancy, nutrition), describe their regional variation with SRS and NFHS-5 data, explain the causes and identify regional groupings. Draw a choropleth.
Health indicators such as infant mortality, maternal mortality, life expectancy and child nutrition measure a population’s well-being. India has improved steadily, with IMR at 27 in 2021 (SRS) and MMR at 97 in 2018–20, but the regional gaps are wide.
Mortality: in SRS 2020 the infant mortality rate ranged from 6 in Kerala to 43 in Madhya Pradesh. The maternal mortality ratio in 2018–20 ranged from 19 in Kerala to 195 in Assam. Life expectancy at birth (2016–20) varied from 65.1 years in Chhattisgarh to 75.8 in Delhi, against 70.0 nationally.
Nutrition: NFHS-5 (2019–21) found 35.5% of children stunted nationally, but 46.5% in Meghalaya and 42.9% in Bihar compared with about 23% in Kerala.
Regional groupings: (i) the southern states, Punjab, Himachal Pradesh and Delhi with good indicators; (ii) the central and eastern belt of Uttar Pradesh, Bihar, Madhya Pradesh, Chhattisgarh, Jharkhand, Odisha and Assam with the worst; (iii) the North East and tribal areas with mixed results. NITI Aayog’s Health Index ranked Kerala top and Uttar Pradesh bottom among large states (2019–20).
Causes: female literacy, health-system strength (doctors, institutional delivery, immunisation), income, sanitation, nutrition and remoteness.
Map: Choropleth of states by IMR (SRS 2020) in three classes, showing the southern low-mortality zone and the central high-mortality belt.
Focused investment through the National Health Mission, Ayushman Bharat and nutrition missions in the central belt is the key to narrowing these gaps.
Example 28 (UPSC 2021, 10 marks): Critically examine the relevance of Ravenstein's law of population migration with reference to India.
Paper and question: Paper II, Q5(d)
Approach: State Ravenstein’s laws briefly, test each important law against Indian migration evidence, then critically note where they fail and what later models add. Draw a diagram of step migration.
E.G. Ravenstein’s laws of migration (1885, 1889), based on British census data, include: most migrants move short distances; migration proceeds step by step; long-distance migrants go to large commercial centres; every stream has a counter-stream; women migrate more over short distances; and economic motives dominate.
Relevance to India: most moves are short: in Census 2001 about three-fifths of migrants moved within their own district. Women dominate short-distance flows because of marriage migration. Long-distance migrants head for Mumbai, Delhi, Kolkata and Bengaluru. Step migration from village to district town to metropolis is common, and the 2020 lockdown reverse flow illustrated the counter-stream.
Limitations: Indian migration is shaped by caste and kin networks, marriage customs, displacement by dams and conflict (Kashmiri Pandits, Sardar Sarovar oustees), and policy, which Ravenstein ignored. Circular and seasonal migration does not fit his permanent moves, and E.S. Lee’s push–pull model (1966) and network theories explain Indian flows better.
Diagram: Step migration from village to small town to city to metropolis, with a counter-stream arrow returning.
Ravenstein’s laws remain broadly relevant as descriptive generalisations, but not as a full explanation.
Example 29 (UPSC 2020, 15 marks): Stunting and wasting among children are major consequences of food insecurity. Discuss various schemes of Government of India to address these problems and their achievements.
Paper and question: Paper II, Q4(b)
Approach: Define stunting and wasting, give NFHS data and link them to food insecurity, then discuss the main government schemes and assess their achievements and gaps. Draw a map of high-stunting states.
Stunting (low height for age) reflects chronic undernutrition, and wasting (low weight for height) reflects acute food shortage or illness. NFHS-5 (2019–21) found 35.5% of children under five stunted and 19.3% wasted, down from 38.4% and 21.0% in NFHS-4 (2015–16). Meghalaya (46.5%) and Bihar (42.9%) had the highest stunting.
Schemes: (i) the National Food Security Act, 2013 gives subsidised grain to about two-thirds of the population, made free under PM Garib Kalyan Anna Yojana; (ii) ICDS (1975), now Saksham Anganwadi and Poshan 2.0 (2021), provides supplementary nutrition and growth monitoring through the Poshan Tracker; (iii) POSHAN Abhiyaan (2018) set targets to cut stunting and undernutrition; (iv) PM POSHAN (2021, formerly Mid-Day Meal) feeds schoolchildren; (v) PM Matru Vandana Yojana (2017) gives cash support to pregnant women; (vi) Anaemia Mukt Bharat (2018) and rice fortification target micronutrients.
Achievements: steady declines in stunting, wasting and underweight; near-universal food grain access during the COVID-19 pandemic; better institutional delivery and immunisation.
Gaps: the pace is slow and POSHAN targets were missed; anaemia rose between NFHS-4 and NFHS-5; diets lack protein and diversity; sanitation and maternal health remain weak in the central belt.
Map: Choropleth of states by stunting (NFHS-5), highlighting Meghalaya, Bihar, Uttar Pradesh, Jharkhand and Gujarat.
A shift from calorie security to nutrition security, with the first 1,000 days in focus, is needed.
Example 30 (UPSC 2019, 20 marks): Analyse the role of interstate migration in regional disparity in India.
Paper and question: Paper II, Q7(a)
Approach: Describe the pattern of inter-state migration, then analyse whether it narrows disparity (convergence view) or widens it (Myrdal’s cumulative causation), with Indian evidence, and conclude with policy. Draw a flow map.
Inter-state migration in India runs from poorer, labour-surplus states to richer, labour-deficit ones. The Economic Survey 2016–17 estimated about 90 lakh inter-state migrants a year (2011–16); the main sources are Uttar Pradesh and Bihar, followed by Madhya Pradesh, Rajasthan, Odisha and Jharkhand, and the main destinations are Delhi, Maharashtra, Gujarat, Haryana, Punjab, Karnataka, Tamil Nadu and Kerala.
Migration as a symptom of disparity: Bihar has the lowest per capita income among major states (MoSPI), low industrialisation and small holdings, while the western and southern states offer industrial, construction and service jobs and higher wages. The direction of flows therefore maps the core–periphery structure of the Indian economy.
Narrowing effects (convergence view): neoclassical theory expects labour to move until wages equalise. Remittances raise consumption, housing and schooling in source districts such as Siwan, Gopalganj and Ganjam; migrants return with skills; and labour shortages raise wages in Punjab’s farms and Kerala’s construction.
Widening effects: Gunnar Myrdal’s cumulative causation (1957) predicts ‘backwash’ effects: the young, skilled and enterprising leave, capital and talent concentrate in Mumbai, Bengaluru and Delhi, and remittances are spent on consumption rather than productive investment, so the core keeps growing faster. Bihar and Uttar Pradesh remain at the bottom of income rankings despite decades of out-migration.
Other consequences: destination states face slum growth and service stress and sometimes nativist demands for local job quotas, while source areas see feminisation of agriculture and ageing villages.
Map: Flow map of India with arrows proportional to inter-state migration from the Hindi heartland and Odisha to the western, north-western and southern states, and a shading of per capita NSDP.
On balance, migration eases distress but does not by itself close the gap; investment in lagging states (Aspirational Districts Programme, industrial corridors, skilling) and portable social security are needed alongside free mobility.
Example 31 (UPSC 2018, 10 marks): Discuss the socio-economic problems associated with the left behind families of international migrants from India.
Paper and question: Paper II, Q5(a)
Approach: Identify the main source regions of international emigration and the left-behind families, then discuss their social, economic and psychological problems with examples. Draw a map of source regions.
India has the world’s largest diaspora (about 18 million emigrants, UN DESA 2020) and received about 129 billion dollars in remittances in 2024 (World Bank). Most low-skilled emigrants go to the Gulf alone, leaving left-behind families in Kerala, Punjab, Goa, coastal Andhra Pradesh, Tamil Nadu and now Uttar Pradesh and Bihar.
Social problems: ‘Gulf wives’ in Kerala carry the burden of managing households, farms and children alone, face loneliness and social surveillance; elderly parents lack care; children may suffer weaker supervision and schooling problems. In Punjab, brides abandoned by NRI husbands are a recognised problem.
Economic problems: dependence on remittances, debts taken to pay recruiting agents, and sudden income loss when workers return, as during the Saudi Nitaqat policy (2011) and the COVID-19 return of 2020.
Psychological and health problems: anxiety, depression and stress-related illness among spouses, which the Kerala Migration Surveys have highlighted.
Map: Outline map of India marking Kerala’s Malappuram and Thrissur, Punjab’s Doaba, Goa, and eastern Uttar Pradesh–Bihar emigration districts with arrows to the Gulf.
Counselling, financial literacy, the e-Migrate system and welfare funds for families can reduce these costs.
Example 32 (UPSC 2018, 10 marks): Describe the socio-spatial consequences of the recent Nipah viral encephalitis in India.
Paper and question: Paper II, Q5(e)
Approach: Describe the 2018 Nipah outbreak (place, cause, cases), then discuss its social consequences (fear, stigma, economy) and spatial consequences (localised cluster, hospital spread, later recurrence, risk zones). Draw a location map.
Nipah virus is a zoonotic virus whose natural reservoir is the fruit bat (Pteropus). In May–June 2018 it caused encephalitis in Kozhikode and Malappuram districts of Kerala, with 19 cases and 17 deaths reported by the WHO; a nurse, Lini Puthussery, died after treating the first patients.
Social consequences: panic and avoidance of Kozhikode; stigma against the families of victims and health workers; closure of schools and gatherings; a fall in tourism; and some Gulf countries temporarily restricted imports of Kerala fruit and vegetables. Positively, rapid contact tracing, isolation and community cooperation contained the outbreak within weeks, earning international praise.
Spatial consequences: the outbreak began in a single cluster at Perambra and spread mainly through hospitals (nosocomial transmission) to Kozhikode Medical College, showing how health facilities become nodes of diffusion. Later outbreaks in Ernakulam (2019), Kozhikode (2021, 2023) and Malappuram (2024) established Kerala as a Nipah hotspot.
Map: Map of Kerala marking Perambra, Kozhikode and Malappuram, with the later outbreak sites.
The episode underlined the need for One Health surveillance of bat habitats and hospital infection control.
Example 33 (UPSC 2015, 10 marks): Discuss the social and spatial ramifications of increasing longevity.
Paper and question: Paper II, Q5(e)
Approach: Give data on rising life expectancy and the elderly population, then discuss the social and spatial ramifications with examples and the policy response. Draw a map of ageing states.
Longevity in India has risen from about 32 years at birth in 1951 to 70.0 years in 2016–20 (SRS). The population aged 60 and above was 10.4 crore (8.6%) in 2011 and is projected to reach 20.8% by 2050 (India Ageing Report 2023).
Social ramifications: feminisation of ageing, since women live longer (elderly sex ratio 1,033 in 2011), with many poor widows; weakening joint families and migration of children leave elders alone; and rising chronic diseases and care costs.
Spatial ramifications: ageing is fastest in Kerala, Tamil Nadu and Himachal Pradesh, and slowest in Bihar and Uttar Pradesh. Out-migration of youth has created ageing villages in Kerala and the Uttarakhand hills, while cities see new demand for old-age homes and geriatric hospitals.
Response: the Maintenance and Welfare of Parents and Senior Citizens Act (2007), the National Programme for Health Care of the Elderly (2010) and the extension of Ayushman Bharat PM-JAY to all people aged 70 and above (2024).
Map: Choropleth of states by share of elderly population, highlighting Kerala and the southern states.
Longevity is an achievement that needs pension, health and community-care planning.
Example 34 (UPSC 2015, 15 marks): In population planning, the thrust of the Government has been 'planning the population' not 'plan for the population'. Elaborate.
Paper and question: Paper II, Q6(b)
Approach: Explain the two phrases, trace India’s population policy from target-driven control to a rights-based approach with dates, critically assess the statement and conclude. Draw a timeline diagram.
‘Planning the population’ means controlling numbers through targets for births and sterilisations; ‘planning for the population’ means providing the health, education, jobs and services that people need. India’s policy has long been criticised for emphasising the first.
Evidence for the statement: India launched the world’s first national family planning programme in 1952. From the 1960s it became target-driven and sterilisation-centred, culminating in the coercive mass sterilisations of the Emergency (1975–77). Even today female sterilisation dominates: 37.9% of married women against 0.3% of men (NFHS-5), and deaths at the Bilaspur sterilisation camp (Chhattisgarh, 2014) showed the human cost.
The shift: after the Cairo ICPD (1994), India adopted the Target Free Approach (1996) and the National Population Policy 2000, which aimed at replacement fertility through reproductive and child health, girls’ education and later marriage, with stabilisation by 2045. The National Rural Health Mission (2005), Janani Suraksha Yojana and Mission Parivar Vikas (2016) for high-fertility districts focus on services and choice.
Assessment: the transition to TFR 2.0 (NFHS-5) came mainly where states planned for people, as in Kerala and Tamil Nadu. Yet gaps in jobs, housing, nutrition and urban services show that planning for the population remains incomplete, and calls for two-child norms show the old mindset persists.
Diagram: Timeline from 1952 (family planning) through 1975–77 (Emergency), 1994 (ICPD), 2000 (NPP) to 2021 (TFR 2.0).
Now that numbers are stabilising, the focus must shift fully to planning for people: skills, health, ageing and urban services.
Example 35 (UPSC 2014, 20 marks): Discuss the trends in emigration focusing on its major thrust.
Paper and question: Paper II, Q6(a)
Approach: Trace the phases of Indian emigration (indentured, post-colonial skilled, Gulf labour, IT and students), identify the major destinations and source states with data, and assess the main thrust and its consequences. Draw a world flow map.
Emigration from India has passed through distinct phases, and India now has the world’s largest diaspora, about 18 million emigrants (UN DESA, 2020).
Colonial phase (1834–1920s): indentured labourers from Bihar, eastern Uttar Pradesh and Tamil Nadu went to plantations in Mauritius, Fiji, Trinidad, Guyana, Suriname and Natal, and kangani labour went to Sri Lanka and Malaya.
Post-independence skilled phase (1950s–1980s): Punjabis and Gujaratis moved to Britain, and after the US immigration reform of 1965 doctors, engineers and scientists went to the USA, Canada and Australia, raising concern about brain drain.
Gulf phase (from the 1970s oil boom): large flows of semi-skilled and unskilled workers from Kerala, Tamil Nadu, Andhra Pradesh and later Uttar Pradesh and Bihar to the GCC countries, mainly on temporary contracts; the Gulf now hosts the largest number of Indian workers.
Knowledge phase (1990s onward): IT professionals on US H-1B visas, students heading to the USA, Canada, the UK and Australia, and new labour-mobility agreements with Germany, Japan and Israel.
Major thrust: two streams dominate: temporary labour to the Gulf and skilled and student migration to the West. Their main outcome is remittances, about 129 billion dollars in 2024 (World Bank), the highest of any country, along with diaspora investment and soft power. Problems include exploitation under the kafala system, wage theft, return shocks such as the Saudi Nitaqat policy (2011) and the COVID-19 return, and skill loss.
Map: World flow map with arrows from India to the Caribbean, Fiji and Mauritius (colonial), the UK and North America (skilled), and the Gulf (labour), labelled by period.
The Emigration Act (1983), the e-Migrate system and diaspora policies such as OCI cards (2005) seek to make emigration safer and to turn brain drain into brain gain.
Mains points
- Sex ratio, child sex ratio and fertility appear almost every year; memorise Census 2011 (943, 918), NFHS-5 (TFR 2.0, state extremes) and SRS 2021 (sex ratio at birth 913, IMR 27) figures with their sources.
- Migration questions reward theory plus Indian evidence: Ravenstein, Lee’s push–pull, Myrdal’s cumulative causation, Economic Survey 2016–17 flows, remittances and the 2020 lockdown exodus.
- Diversity and North East questions need a map of language families, religious cores or ethnic homelands, and a balanced verdict rather than a one-sided view.
- Tribal questions are scored on specific tribes, regions and laws: Fifth and Sixth Schedules, PESA 1996, Forest Rights Act 2006 and PVTGs.
- Examiners reward a regional lens: always contrast the south and the Hindi heartland, rural and urban, and end with a policy-linked conclusion.
Did you know?
- Census 2011 recorded 19,569 raw mother-tongue names before linguists grouped them into 1,369 mother tongues, which shows how hard it is even to count India’s languages.
Geography Optional: All chapters
- Exam Pattern, Syllabus and Strategy
- The Earth's Interior and Tectonics
- Geomorphic Processes and Landscape Development
- Climatology: Atmosphere and Circulation
- Climatology: Weather Systems, Climates and Climate Change
- Oceanography
- Biogeography
- Environmental Geography
- Perspectives in Human Geography
- Economic Geography
- Population Geography
- Settlement Geography
- Regional Planning
- Models, Theories and Laws in Human Geography
- India: Physical Setting I
- India: Physical Setting II
- Resources of India
- Agriculture in India
- Industry in India
- Transport, Communication and Trade
- Cultural Setting and Population of India
- Settlements in India
- Regional Development and Planning in India
- Political Aspects
- Contemporary Issues
- Places for the Map Question