
Geography Optional · UPSC Notes
Industry in India — UPSC Geography Optional Notes
Free, exam-focused notes for UPSC Prelims and Mains, with Prelims tips and Mains points for every topic. 5 topics.
Open in the interactive reader: bookmarks, progress tracking and read-aloud.
Evolution of Industries and Industrial Regionalisation
Indian industry evolved from renowned cottage crafts (Dhaka muslin, Banaras silk) through colonial deindustrialisation and the first modern mills (cotton in Bombay, 1854; jute at Rishra, 1855; steel at Jamshedpur, 1907), to the state-led heavy industry of the Mahalanobis Second Plan and the market-led growth after 1991. Industry remains concentrated in a few industrial regions (Mumbai–Pune, Hugli, Bengaluru–Chennai, Gujarat, Chota Nagpur and others), while industrial corridors and 12 new industrial smart cities (approved 2024) aim to spread it more widely.
In simple words
India was once famous for handmade cloth and metalwork, but colonial rule hurt these crafts.
After 1947 the government built big steel plants and factories, and after 1991 private and foreign companies grew fast.
Factories tend to cluster where raw materials, ports, power and workers are available, like shops gathering in a busy market street; these clusters are industrial regions.
UPSC asks how industry developed, where it is concentrated and why, and how to spread it to backward areas.
1. Concepts and Definitions
Industry: economic activity concerned with processing raw materials into goods (manufacturing), along with mining, construction and utilities in broader usage; classified by raw material (agro-based, mineral-based, forest-based), ownership (public, private, joint, cooperative), size (large, MSME, cottage) and function (basic/capital goods, consumer goods).
Industrial region: an area where several industries cluster with linked activities, a large industrial workforce and infrastructure; identified using indicators such as number of factories, industrial workers, power use and output value.
Agglomeration economies: cost advantages from clustering (shared infrastructure, skilled labour, suppliers and knowledge spillovers), discussed by Alfred Marshall (1890) as 'industrial districts'.
Deindustrialisation: the decline of traditional Indian handicraft industries in the 19th century due to competition from British machine-made goods and colonial policy, discussed by Romesh Chunder Dutt and Dadabhai Naoroji; its extent is debated by economic historians.
Industrial corridor: a linear zone along a major transport artery (freight corridor, expressway) with planned industrial nodes, logistics hubs and new cities.
2. Evolution of Industries
Pre-colonial phase: textiles of Dhaka, Murshidabad, Masulipatnam and Surat, metal crafts, shipbuilding and wootz steel made India a major manufacturing exporter in the 17th century.
Colonial phase (1850–1947): first cotton mill in Bombay (1854, Cowasji Nanabhai Davar), first jute mill at Rishra near Kolkata (1855), coal mining at Raniganj, Tata Iron and Steel Company at Sakchi, later Jamshedpur (1907), Indian Iron and Steel Company at Burnpur (1918) and Mysore Iron Works at Bhadravati (1923); industry was concentrated in port cities (Bombay, Calcutta, Madras) and around coalfields.
Planned phase (1951–1991): the Industrial Policy Resolutions of 1948 and 1956 gave the public sector the 'commanding heights'; the Second Five Year Plan (1956–61, P.C. Mahalanobis model) set up integrated steel plants at Bhilai (USSR aid), Rourkela (West German aid) and Durgapur (British aid), followed by Bokaro (Soviet aid); BHEL, HAL, fertiliser and oil refineries; licensing and import substitution.
Policy of dispersal: backward area incentives, industrial estates and growth centres (1980s) tried to spread industry, with limited success.
Role of MSMEs and clusters: small-scale reservation (from 1967, largely dereserved by 2015) and cluster development (Tiruppur knitwear, Ludhiana hosiery, Moradabad brassware, Morbi ceramics) created dispersed industrial districts outside the big metros.
Liberalisation phase (1991 onwards): the New Industrial Policy 1991 abolished licensing for most industries, opened sectors to foreign investment and reduced the public sector's reserved list; growth of automobiles, pharmaceuticals, IT and electronics.
Recent phase (2014 onwards): Make in India (2014), Production Linked Incentive schemes (from 2020, 14 sectors), PM Gati Shakti (2021), semiconductor mission (2021), and the National Manufacturing Mission announced in the Union Budget 2025–26.
3. Industrial Regions of India
Classification (NCERT, based on industrial concentration): 8 major industrial regions, 13 minor industrial regions and 15 industrial districts.
Mumbai–Pune region: Mumbai, Thane, Pune, Nashik, Aurangabad (Chhatrapati Sambhajinagar); cotton textiles (historic), engineering, automobiles, petrochemicals (Trombay), pharmaceuticals, IT; advantages: port, capital, entrepreneurs, Mumbai High.
Hugli region: along the Hugli river from Bansberia to Budge Budge; jute, engineering, paper, chemicals; colonial origin; declined due to partition (jute areas went to East Pakistan), labour issues and obsolete plant, now partly revived.
Bengaluru–Chennai region: textiles (Coimbatore), engineering, automobiles (Chennai, Hosur), aircraft (HAL Bengaluru), electronics and IT (Bengaluru), railway coaches (Perambur).
Gujarat region: Ahmedabad–Vadodara–Surat–Bharuch–Jamnagar; textiles, petrochemicals (Jamnagar, Hazira), chemicals, diamonds (Surat), automobiles (Sanand), ports (Kandla/Deendayal, Mundra).
Chota Nagpur region: Jamshedpur, Bokaro, Dhanbad, Ranchi, Durgapur, Asansol, Rourkela; iron and steel, heavy engineering, coal-based industries; based on Damodar valley coal and Singhbhum–Keonjhar iron ore.
Other major regions: Visakhapatnam–Guntur (shipbuilding, steel, refinery, fertilisers), Gurugram–Delhi–Meerut (automobiles, electronics, light engineering), Kollam–Thiruvananthapuram (agro-processing, coir, cashew, plantations, rare earths).
Minor regions and districts (examples): Ambala–Amritsar, Saharanpur–Muzaffarnagar–Bijnor, Indore–Dewas–Ujjain, Jaipur–Ajmer, Kolhapur–south Kannada, northern Malabar, middle Malabar, Adilabad–Nizamabad, Allahabad–Varanasi–Mirzapur, Bhojpur–Munger, Durg–Raipur, Bilaspur–Korba, Brahmaputra valley.
4. Industrial Corridors and New Cities
National Industrial Corridor Development Programme: Delhi–Mumbai Industrial Corridor (DMIC, launched 2007, along the Western Dedicated Freight Corridor) with nodes such as Dholera (Gujarat), Shendra–Bidkin (Maharashtra), Greater Noida (Uttar Pradesh) and Vikram Udyogpuri (Madhya Pradesh); Chennai–Bengaluru, Amritsar–Kolkata, East Coast (Vizag–Chennai), Bengaluru–Mumbai and other corridors.
12 new industrial smart cities: approved by the Union Cabinet in August 2024 (about ₹28,600 crore) across 10 states, including Khurpia (Uttarakhand), Rajpura–Patiala (Punjab), Dighi (Maharashtra), Palakkad (Kerala), Agra and Prayagraj (Uttar Pradesh), Gaya (Bihar), Zaheerabad (Telangana), Orvakal and Kopparthy (Andhra Pradesh) and Jodhpur–Pali (Rajasthan).
Logistics: Dedicated Freight Corridors, Sagarmala ports and PM Gati Shakti National Master Plan support these corridors.
Concerns: land acquisition disputes, slow occupancy of nodes such as Dholera, and environmental clearances show that corridors need anchor investors and social acceptance, not only infrastructure.
5. Theory and Debates
Cumulative causation (Gunnar Myrdal, 1957): initial advantages of Mumbai, Kolkata and Chennai attracted more investment (backwash effects), widening regional inequality; spread effects reached hinterlands slowly.
Unbalanced growth (Albert Hirschman, 1958): investment in key sectors with strong backward and forward linkages (steel) would trigger wider industrialisation, the logic behind Bhilai and Bokaro.
Growth poles (François Perroux, 1955; Boudeville's regional version): applied in India's growth centre programmes; critics note that steel towns often became 'enclaves' with limited regional spread.
Core–periphery (John Friedmann, 1966): explains the dominance of western and southern industrial cores over the mineral-rich but less industrialised eastern periphery.
Premature deindustrialisation (Dani Rodrik, 2016): India's manufacturing share of employment peaked early and services led growth; whether recent PLI and corridor policies can reverse this is debated.
6. Maps and Diagrams to Draw
Industrial regions map: outline India and shade the 8 major regions with labels; add dots for minor regions and major plants (Bhilai, Rourkela, Durgapur, Bokaro, Jamshedpur, Jamnagar).
Corridor map: DMIC along the Western DFC with nodes, the Eastern DFC, Chennai–Bengaluru and East Coast corridors, and the 12 new industrial cities.
Timeline: 1854 cotton mill → 1855 jute → 1907 TISCO → 1948 and 1956 IPRs → 1956–61 steel plants → 1991 NIP → 2014 Make in India → 2020 PLI → 2024 new industrial cities → 2025 National Manufacturing Mission.
Cumulative causation diagram: circular flow showing new industry → jobs → demand → services and infrastructure → more industry, with backwash arrows from the periphery.
7. Using It in the Exam
10 marks: short note on one industrial region with factors and a map.
15 marks: evolution of industries in phases with policy milestones and spatial effects.
20 marks: industrial regionalisation: criteria, major regions, regional imbalance, corridors as a strategy, with theory (Myrdal, Perroux, Friedmann) and a map.
Keywords: deindustrialisation, commanding heights, Mahalanobis model, agglomeration, industrial region, industrial corridor, cumulative causation, growth pole.
Attributed idea: Myrdal argued that market forces tend to increase rather than decrease regional inequalities unless the state intervenes (paraphrased).
Common mistake: listing regions without explaining location factors; always pair each region with its raw material, port, market or labour advantage.
| Region | Key centres | Main industries | Location advantage |
|---|---|---|---|
| Mumbai–Pune | Mumbai, Thane, Pune, Nashik | Engineering, automobiles, petrochemicals, pharma, IT | Port, capital, Mumbai High |
| Hugli | Kolkata, Howrah, Serampore | Jute, engineering, paper | River port, colonial capital, cheap labour |
| Bengaluru–Chennai | Bengaluru, Chennai, Coimbatore, Hosur | Electronics, IT, automobiles, aircraft, textiles | Skilled labour, ports, policy support |
| Gujarat | Ahmedabad, Vadodara, Surat, Jamnagar | Textiles, petrochemicals, diamonds, chemicals | Cotton, oil and gas, ports |
| Chota Nagpur | Jamshedpur, Bokaro, Dhanbad, Durgapur, Rourkela | Iron and steel, heavy engineering | Coal and iron ore, Damodar water |
| Visakhapatnam–Guntur | Visakhapatnam, Vijayawada, Guntur | Steel, shipbuilding, refinery, fertilisers | Deep-water port, KG gas |
| Gurugram–Delhi–Meerut | Gurugram, Noida, Faridabad, Meerut | Automobiles, electronics, light engineering | Capital market, skilled labour |
| Kollam–Thiruvananthapuram | Kollam, Thiruvananthapuram, Alappuzha | Coir, cashew, agro-processing | Plantation raw materials, beach minerals |
Mains points
- Questions ask for the evolution of industry in phases, factors behind industrial concentration, the decline of the Hugli region, or industrial corridors as a strategy.
- Present evolution as phases with dates and spatial outcomes (port cities → coalfields → planned steel towns → corridors).
- Draw an industrial regions map with the 8 major regions; add corridors where relevant.
- Use theory: Myrdal's cumulative causation, Hirschman's linkages, Perroux's growth poles, Friedmann's core–periphery.
- Add current policy: PLI (2020), National Manufacturing Mission (Budget 2025–26), 12 industrial smart cities (August 2024), Gati Shakti.
- Common mistake: ignoring regional imbalance; always discuss why mineral-rich eastern India remains less industrialised.
Did you know?
- Each of the first three public sector steel plants had a different foreign partner: Bhilai (Soviet Union), Rourkela (West Germany) and Durgapur (Britain), reflecting India's non-aligned diplomacy.
Location of Major Industries
Industrial location depends on raw materials, power, transport, labour, markets, capital and policy. Following Alfred Weber (1909), weight-losing industries such as iron and steel and aluminium locate near raw materials or cheap power (Chota Nagpur, Odisha), while pure-material or market-oriented industries such as cotton textiles, pharmaceuticals and automobiles cluster near markets, ports and skilled labour (Mumbai–Pune, Ahmedabad, Hyderabad, Chennai, NCR). India produced about 170 million tonnes of crude steel in 2025–26 (provisional, Ministry of Steel), and policy tools such as PLI schemes, PM MITRA textile parks and bulk drug parks are reshaping the map.
In simple words
A factory chooses its home like a family chooses a house: close to what it needs most.
A steel plant needs tonnes of heavy iron ore and coal, so it sits near the mines.
A car or medicine factory needs skilled workers and buyers, so it sits near big cities and ports.
This logic of least cost, explained by Weber, helps UPSC students say why each industry is found where it is and how new policies are changing locations.
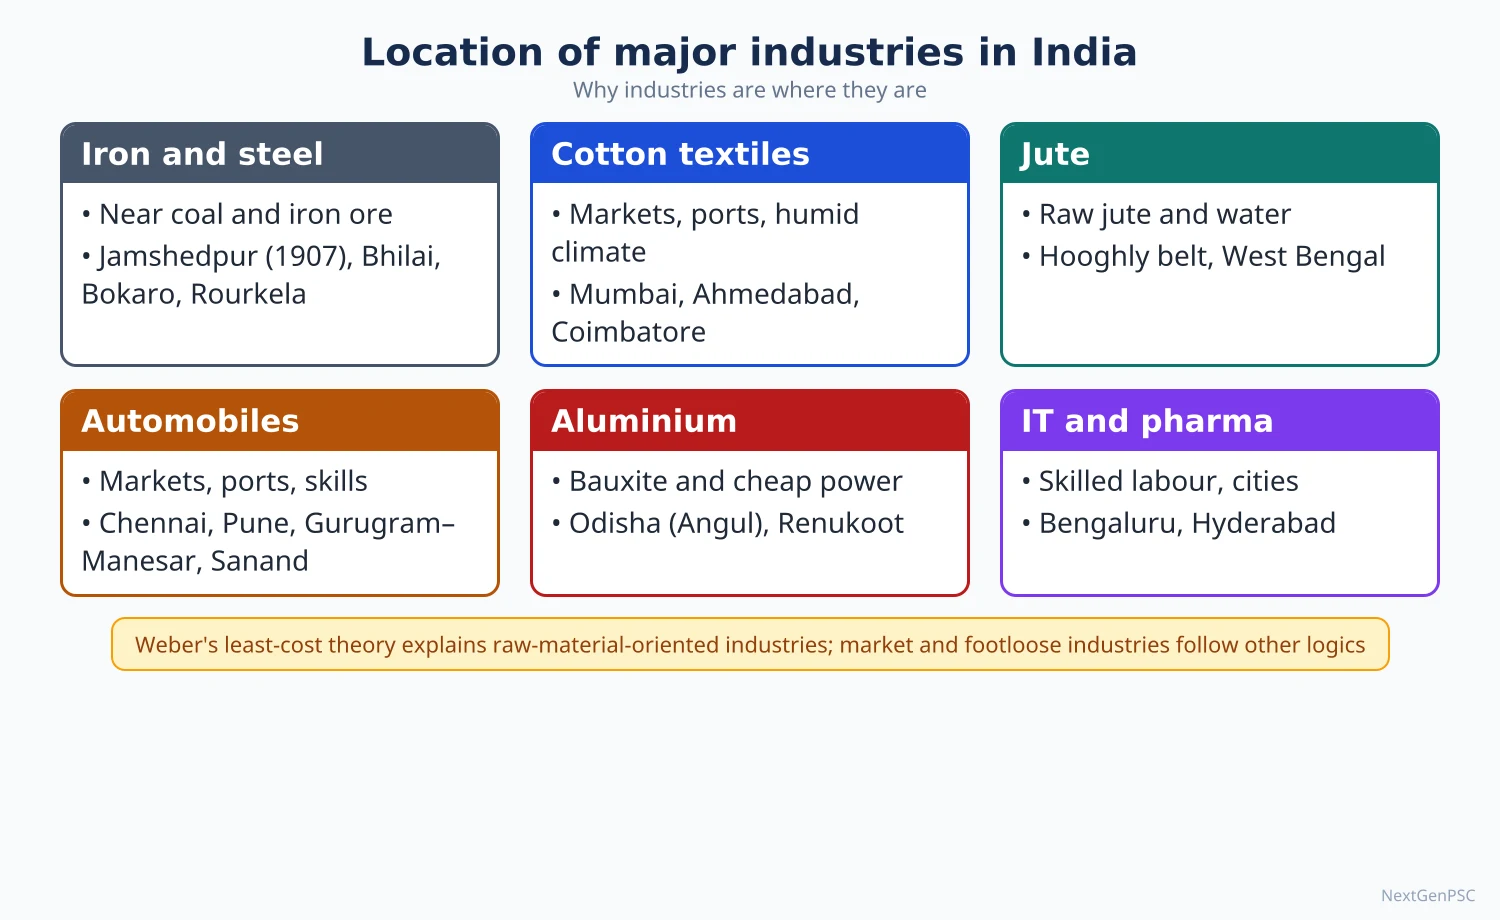
1. Concepts and Locational Theory
Locational factors: physical (raw materials, power, water, climate) and human (labour, market, transport, capital, entrepreneurship, government policy, agglomeration, historical inertia).
Weber's least-cost theory (Über den Standort der Industrien, 1909): an industry locates where total transport and labour costs are minimum; the material index (weight of localised raw materials ÷ weight of product) above 1 pulls industry to raw materials, below 1 to the market; isodapanes (lines of equal extra cost) show when cheap labour or agglomeration justifies deviation.
Later theories: Hoover (1948) added terminal costs and transfer points (ports); Lösch (1940) stressed maximum profit through market areas; D.M. Smith (1966, 1971) and E.M. Rawstron (1958) developed spatial margins of profitability; Allan Pred (1967) introduced behavioural factors.
Industrial inertia: industries remain at an established location even after original advantages fade (Hugli jute mills, Mumbai's older textile mills until the 1980s).
Footloose industries: industries with low transport costs relative to value (electronics, IT, pharmaceuticals) that can locate almost anywhere with skilled labour and infrastructure.
2. Cotton and Other Textiles
Origins: first mill in Bombay (1854) because of port access for machinery imports and exports, capital from merchants, humid climate (thought helpful for spinning), and raw cotton from the Deccan black soils.
Dispersal: after the 1920s and especially after 1947 the industry spread to Ahmedabad ('Manchester of India'), Coimbatore, Madurai, Indore, Nagpur, Kanpur and Solapur, because raw cotton loses little weight (pure raw material) and markets are nationwide; electricity replaced coal.
Present clusters: Tiruppur (knitwear exports), Surat (synthetics and art silk), Bhiwandi and Malegaon (powerlooms), Ludhiana (hosiery and woollens), Panipat (handloom and recycled textiles), Erode and Karur (home textiles).
Policy: PM MITRA (Mega Integrated Textile Region and Apparel) parks announced in March 2023 at seven sites: Virudhunagar (Tamil Nadu), Warangal (Telangana), Navsari (Gujarat), Kalaburagi (Karnataka), Dhar (Madhya Pradesh), Lucknow (Uttar Pradesh) and Amravati (Maharashtra); PLI for man-made fibre and technical textiles.
Problems: fragmented powerloom sector, obsolete machinery, competition from Bangladesh and Vietnam, and US tariff pressure on apparel exports in 2025.
3. Jute
Location: concentrated in the Hugli belt (West Bengal) near raw jute from the Ganga–Brahmaputra delta (West Bengal, Assam, Bihar), with abundant water for retting, cheap labour, coal from Raniganj and the port of Kolkata.
Partition shock (1947): most jute-growing areas went to East Pakistan while mills stayed in India; India expanded jute cultivation in West Bengal, Assam and Bihar.
Present status: India is the world's largest producer of raw jute and jute goods; demand is supported by the Jute Packaging Materials (Compulsory Use in Packing Commodities) Act 1987 for foodgrain and sugar sacking; diversification into geotextiles and eco-friendly bags.
4. Iron and Steel
Location logic: iron ore, coking coal and limestone are heavy and lose weight in smelting, so classic plants lie in the Chota Nagpur–Odisha triangle; coastal plants use imported coking coal and export markets (Visakhapatnam, JSW Dolvi); some plants are market-oriented (Bhushan, mini steel plants near cities).
Integrated plants: Jamshedpur (Tata, 1907; Subarnarekha and Kharkai rivers, Noamundi ore, Jharia coal), Burnpur (IISCO, SAIL), Bhilai (Chhattisgarh), Rourkela (Odisha), Durgapur (West Bengal), Bokaro (Jharkhand), Visakhapatnam (RINL, coastal), Vijayanagar (JSW, Karnataka, near Bellary ore), Kalinganagar (Tata, Odisha), Angul (Jindal, Odisha); special steel at Salem and Bhadravati.
Data: crude steel production about 170.15 million tonnes in 2025–26 (provisional, JPC data in the Ministry of Steel overview, July 2026), against about 152 MT in 2024–25; capacity about 220 MT; India is the world's second-largest crude steel producer.
Policy: National Steel Policy 2017 targets 300 MT capacity by 2030–31; PLI for specialty steel (2021); green steel taxonomy (2024) and hydrogen-based steel pilots.
Issues: dependence on imported coking coal, high carbon emissions, land and displacement conflicts in Odisha and Jharkhand, and cheap imports.
5. Aluminium
Location logic: bauxite is refined to alumina (about 2–3 tonnes of bauxite per tonne of alumina) near mines, while smelting needs huge amounts of cheap electricity, so smelters lie near coal-based or hydro power.
Plants: NALCO (Damanjodi refinery near Panchpatmali mines and Angul smelter, Odisha), Vedanta (Lanjigarh refinery and Jharsuguda smelter, Odisha), BALCO (Korba, Chhattisgarh), Hindalco (Renukoot, Uttar Pradesh; Hirakud and Aditya at Lapanga, Odisha; Mahan, Madhya Pradesh).
Status: India is the world's second-largest primary aluminium producer; Odisha dominates because it combines bauxite, coal and water.
6. Fertiliser, Paper, Chemical and Pharmaceutical Industries
Fertilisers: nitrogenous plants depend on natural gas or naphtha and locate along gas pipelines (Vijaipur, Aonla, Jagdishpur, Babrala on the HVJ line) or near ports and refineries (Hazira, Trombay, Paradip, Kakinada); Sindri (1951) was the first large public sector plant; recently revived urea plants at Gorakhpur, Ramagundam, Barauni and Sindri, and coal gasification at Talcher; phosphatic plants near ports for imported rock phosphate.
Paper: needs bamboo, softwood, bagasse or recycled fibre, plus water and power; older mills at Titagarh (West Bengal), Ballarpur (Maharashtra), Dandeli (Karnataka), Rajahmundry (Andhra Pradesh) and Nepanagar (Madhya Pradesh, newsprint); the industry is shifting to recycled fibre and farm forestry (eucalyptus, subabul).
Petrochemicals and chemicals: located near refineries and ports: Jamnagar, Vadodara, Hazira, Dahej (PCPIR), Trombay, Panipat, Haldia; the Gujarat coast is the chemical heartland.
Pharmaceuticals: market and skill-oriented, footloose; clusters in Hyderabad (Genome Valley, a major bulk drug hub), Ahmedabad–Vadodara, Mumbai–Thane–Pune, Visakhapatnam, Baddi (Himachal Pradesh, earlier tax incentives) and Sikkim; three bulk drug parks approved in 2022 at Bharuch (Gujarat), Una (Himachal Pradesh) and Kakinada (Andhra Pradesh); India is often called the 'pharmacy of the world' for generic medicines and vaccines.
7. Automobile, Cottage and Agro-based Industries
Automobiles: assembly industries locate near markets, component suppliers, skilled labour and ports: NCR (Gurugram, Manesar, Noida), Pune–Chakan–Aurangabad, Chennai–Sriperumbudur–Hosur (export base), Sanand (Gujarat), Jamshedpur (trucks) and Pantnagar (Uttarakhand); India became the third-largest vehicle market in 2022; PLI for automobiles and advanced chemistry cell batteries and PM E-DRIVE (2024) push electric vehicles.
Sugar: a weight-losing, perishable raw material (cane must be crushed within about 24 hours) ties mills to cane areas; the industry has shifted from Uttar Pradesh–Bihar towards Maharashtra, Karnataka and Tamil Nadu because of higher sucrose content, longer crushing season and cooperative organisation; ethanol blending (20% target achieved in 2025) adds demand.
Cottage and handloom: located by tradition, skill and local raw materials: Varanasi and Kanchipuram silk, Pochampally ikat, Bhadohi carpets, Moradabad brassware, Channapatna toys; supported by KVIC, Geographical Indication tags and One District One Product (UP 2018, later national).
Food processing: PM Kisan Sampada Yojana (2017), PM Formalisation of Micro Food Processing Enterprises (2020) and mega food parks link farms to markets; clusters include Punjab and Haryana (grain milling), Kerala (spices, cashew), Maharashtra (fruit), Gujarat (dairy).
8. Theory and Debates
Relevance of Weber today: Weber explains steel and aluminium well but not footloose industries, where skills, policy incentives, agglomeration and global value chains dominate.
Policy-led location: tax holidays (Baddi, Uttarakhand), SEZs and PLI show that state incentives can override classical factors; critics warn that firms may leave when incentives end.
Environment and justice: steel, aluminium and chemicals in tribal and coastal areas generate pollution and displacement (Niyamgiri, Kalinganagar firing 2006, Vizag gas leak 2020), raising questions of environmental justice.
Agglomeration vs dispersal: clustering raises efficiency but widens regional gaps; policy debates whether to strengthen existing clusters or create new ones in lagging states.
9. Maps and Diagrams to Draw
Iron and steel map: plants with arrows from iron ore (Noamundi, Bailadila, Keonjhar, Bellary) and coal (Jharia, Talcher, Korba) and ports for imported coal.
Textile and jute map: cotton textile centres (Mumbai, Ahmedabad, Coimbatore, Tiruppur, Surat, Ludhiana), the Hugli jute belt and the seven PM MITRA parks.
Aluminium and fertiliser map: bauxite mines, refineries and smelters in Odisha and Chhattisgarh; fertiliser plants along the HVJ pipeline and coast.
Weber's triangle: two raw material sources and one market at the corners, the least-cost point inside, with isodapanes and a cheap labour site.
10. Using It in the Exam
10 marks: locational factors of one industry (e.g. aluminium or jute) with a map.
15 marks: shifting location of an industry (cotton textiles from Mumbai to the hinterland; sugar from north to south) with reasons.
20 marks: 'Weber's theory and its relevance for Indian industries', using iron and steel versus pharmaceuticals and automobiles, with maps and current data.
Keywords: material index, weight-losing raw material, isodapane, industrial inertia, footloose, agglomeration, PLI, PM MITRA.
Attributed idea: Weber argued that industries seek the point of minimum transport and labour cost, pulled towards raw materials when they lose weight in processing.
| Industry | Dominant pull | Main centres | Policy or recent development |
|---|---|---|---|
| Cotton textiles | Market and labour (pure raw material) | Ahmedabad, Mumbai, Coimbatore, Tiruppur, Surat | PM MITRA parks (2023) |
| Jute | Raw material, water, port | Hugli belt | Jute Packaging Materials Act 1987 |
| Iron and steel | Raw materials (weight-losing) | Jamshedpur, Bhilai, Rourkela, Bokaro, Vizag, Vijayanagar | National Steel Policy 2017; about 170 MT in 2025–26 |
| Aluminium | Bauxite and cheap power | Angul, Jharsuguda, Korba, Renukoot | Odisha cluster expansion |
| Fertiliser | Gas pipelines, ports | Vijaipur, Hazira, Paradip, Gorakhpur, Talcher | Revival of urea plants, coal gasification |
| Pharmaceuticals | Skilled labour, policy (footloose) | Hyderabad, Ahmedabad, Baddi, Visakhapatnam | Bulk drug parks (2022), PLI |
| Automobiles | Market, suppliers, ports | NCR, Pune, Chennai–Hosur, Sanand | PLI, PM E-DRIVE (2024) |
| Sugar | Perishable raw material | Western UP, Maharashtra, Karnataka | Ethanol blending 20% (2025) |
Mains points
- Typical questions: locational factors of a named industry, shift in location (cotton, sugar), relevance of Weber, problems of an industry (jute, steel).
- Always link location to theory (material index, isodapanes, inertia, footloose) and give named centres.
- Use current data with year: crude steel about 170 MT in 2025–26 (provisional), PM MITRA parks (2023), bulk drug parks (2022), ethanol 20% (2025).
- Draw at least one map with raw material sources, plants and arrows of movement.
- Add environmental and social dimensions (pollution, displacement, green steel).
- Common mistake: describing all textile industries as raw-material oriented; cotton textiles are market and labour oriented because cotton is a pure raw material.
Did you know?
- Jamshedpur was chosen after a long survey because it lay close to Noamundi iron ore, Jharia coal and the Subarnarekha and Kharkai rivers, and near the Kolkata–Mumbai railway line.
Industrial Policies, Public Sector, Multinationals and Liberalisation
India's industrial policy moved from a state-led, licence-based model (Industrial Policy Resolutions 1948 and 1956) to liberalisation, privatisation and globalisation after the New Industrial Policy of 1991, and more recently to targeted manufacturing support (Make in India 2014, Production Linked Incentive schemes from 2020, National Manufacturing Mission 2025). Public sector undertakings built steel, heavy engineering and oil industries in backward regions, while industrial houses and multinationals have favoured coastal, metropolitan and southern–western states, raising questions of regional balance.
In simple words
After independence the government acted like the head of a joint family, deciding who could open which factory through licences and building steel plants itself.
In 1991 the rules were relaxed: private and foreign companies could invest freely, which is called liberalisation.
Now the government offers rewards for producing more in India, like phones and solar panels.
UPSC asks how these policies changed where industries are located and whether they helped backward regions.
1. Concepts and Definitions
Industrial policy: government strategy that shapes the pattern, ownership, technology and location of industry through laws, licences, incentives, public investment and trade measures.
Public sector undertaking (PSU): an enterprise in which the government holds a majority stake; central PSUs are grouped as Maharatna, Navratna and Miniratna by size and autonomy (e.g. SAIL, ONGC, NTPC, BHEL, Coal India).
Industrial house: a family-controlled business group operating many firms across sectors (Tata, Birla, Reliance, Mahindra, Bajaj, Adani, TVS, Murugappa).
Multinational corporation (MNC): a firm that owns or controls production or services in more than one country; enters through FDI, joint ventures, subsidiaries or contract manufacturing.
Liberalisation, privatisation, globalisation (LPG): removal of controls, transfer of state ownership or functions to private hands, and integration with the world economy through trade and investment.
2. The Planned, Licence-based Phase (1948–1990)
Industrial Policy Resolution 1948: a mixed economy; arms, atomic energy and railways reserved for the state; key industries (coal, iron and steel, aircraft, shipbuilding) for new state investment.
Industrial (Development and Regulation) Act 1951: licensing for setting up or expanding industries, used to direct location and capacity.
Industrial Policy Resolution 1956: Schedule A (17 industries exclusively for the state), Schedule B (12 industries progressively state-owned, with private participation) and Schedule C (rest for the private sector); the public sector to reach the 'commanding heights'; balanced regional development as an explicit goal.
Controls of the 1960s–70s: MRTP Act 1969 (to curb concentration of economic power), FERA 1973 (restricting foreign equity), reservation of items for small-scale industry (from 1967).
Industrial Policy Statements 1977 and 1980: emphasis on small and village industries, District Industries Centres (1978) and backward-area development; partial relaxation in the 1980s.
Spatial outcome: PSU steel towns (Bhilai, Rourkela, Durgapur, Bokaro), heavy engineering at Ranchi, BHEL at Bhopal, Haridwar, Tiruchirappalli and Hyderabad, refineries at Barauni, Mathura and Guwahati spread industry to interior regions, though often as enclaves.
3. The New Industrial Policy 1991 and After
Main features: abolition of industrial licensing except for a small list (now only a few hazardous and strategic items); public sector reserved list cut sharply (now limited to atomic energy and railway operations); automatic approval for FDI in many sectors; MRTP restrictions on large firms removed (replaced by the Competition Act 2002); FERA replaced by FEMA (1999).
Disinvestment and privatisation: partial sale of PSU shares from 1991; strategic sales such as Air India to the Tata group (January 2022); the New Public Sector Enterprise Policy (2021) keeps a minimum presence only in four broad strategic sectors.
Manufacturing push: National Manufacturing Policy (2011, National Investment and Manufacturing Zones), Make in India (2014), Ease of Doing Business reforms, the Jan Vishwas Act (2023) decriminalising minor offences, and Production Linked Incentive schemes for 14 sectors approved in 2020–21 (mobile phones, pharmaceuticals, automobiles, solar modules, advanced chemistry cells, textiles, food processing and others).
Semiconductors and electronics: India Semiconductor Mission (2021); Micron's assembly and test plant at Sanand (Gujarat), the Tata–PSMC fab at Dholera (approved 2024) and assembly units in Assam and Gujarat; mobile phone manufacturing hubs at Noida, Sriperumbudur and Hosur (Apple's contract manufacturers).
National Manufacturing Mission: announced in the Union Budget 2025–26 to support small, medium and large industries, including clean-tech manufacturing.
4. Multinationals and FDI
Inflows: gross FDI inflows were about USD 81 billion in 2024–25 (DPIIT data as reported); leading sources are Singapore, Mauritius, the USA, the Netherlands, Japan and the UAE; services, computer software and hardware, trading, automobiles and non-conventional energy attract large shares.
Spatial pattern: Maharashtra, Karnataka, Gujarat, Delhi NCR and Tamil Nadu receive most FDI, reinforcing existing industrial cores; eastern and central states receive little.
Examples: Maruti Suzuki (Gurugram–Manesar, Gujarat), Hyundai (Chennai), Samsung (Noida, Sriperumbudur), Foxconn (Sriperumbudur, Bengaluru region), Toyota (Bidadi), and over 1,500 Global Capability Centres concentrated in Bengaluru, Hyderabad, Pune, Chennai and NCR.
Effects: technology transfer, exports, employment and supplier development (Gurugram–Manesar auto component belt), but also concerns about profit repatriation, competition with domestic firms, and limited linkages in some enclaves.
5. Regional Effects of Liberalisation
Divergence: studies by economists and geographers find that post-1991 growth favoured states with ports, urban infrastructure and skilled labour (Gujarat, Maharashtra, Tamil Nadu, Karnataka, Telangana), while mineral-rich Bihar, Jharkhand, Odisha and Chhattisgarh lagged in manufacturing jobs; this is widely documented but its extent is debated.
Shift to coasts and corridors: new investment concentrated along the western coast, the Delhi–Mumbai axis and the Chennai–Bengaluru belt.
Decline of PSU-centred towns: some old public sector townships stagnated, while private steel and aluminium plants expanded in Odisha and Chhattisgarh close to raw materials.
Policy responses: special category state incentives (Himalayan and North-Eastern states), North East Industrial Development Scheme (2017), Aspirational Districts Programme (2018), industrial corridors and PM Gati Shakti.
6. Theory and Debates
State vs market: the Nehru–Mahalanobis strategy assumed market failure and strategic needs; Jagdish Bhagwati and T.N. Srinivasan criticised the 'licence raj' for inefficiency; supporters credit it with creating the industrial base.
New international division of labour (Fröbel, Heinrichs and Kreye, 1980): MNCs relocate labour-intensive stages to low-wage countries; India's attraction has been more in services and skill-intensive manufacturing than in mass assembly, though electronics assembly is now growing.
Uneven development (David Harvey, Neil Smith): capital moves to places offering the highest returns, producing uneven geographies; liberalisation in India illustrates this.
Jobless growth and premature deindustrialisation: manufacturing's share of employment remains low; critics question whether PLI-driven assembly creates enough jobs and domestic value added.
Industrial policy revival: global trends (US CHIPS Act, China's industrial policy) and supply-chain diversification ('China plus one') have renewed acceptance of targeted industrial policy, which India's PLI reflects.
7. Maps and Diagrams to Draw
PSU map: mark public sector steel plants, BHEL units, refineries and heavy engineering units in interior states.
FDI map: shade states by share of cumulative FDI and mark major MNC clusters (NCR, Pune, Chennai, Bengaluru, Hyderabad, Ahmedabad).
Policy timeline: 1948 IPR → 1951 IDRA → 1956 IPR → 1969 MRTP → 1973 FERA → 1991 NIP → 1999 FEMA → 2002 Competition Act → 2011 NMP → 2014 Make in India → 2020 PLI → 2021 NPSE Policy → 2025 National Manufacturing Mission.
Comparison diagram: two columns, pre-1991 (licensing, PSU dominance, import substitution, dispersal goal) vs post-1991 (delicensing, private and foreign investment, export orientation, market-led concentration).
8. Using It in the Exam
10 marks: features of the New Industrial Policy 1991 and its spatial impact.
15 marks: role of the public sector in the industrial geography of India with examples.
20 marks: 'Liberalisation and regional imbalance in Indian industry': policies, FDI pattern, MNC clusters, PLI, regional outcomes, theory and a map.
Keywords: commanding heights, licence raj, delicensing, disinvestment, FDI, MNC clusters, PLI, regional divergence.
Attributed idea: the Industrial Policy Resolution of 1956 declared the aim of a 'socialistic pattern of society' with the state taking primary responsibility for basic and strategic industries (paraphrased).
| Aspect | 1948–1990 | 1991 onwards | Spatial effect |
|---|---|---|---|
| Ownership | Public sector dominance | Private and foreign investment lead | PSU towns vs private coastal clusters |
| Entry | Industrial licensing (IDRA 1951) | Delicensing; few items licensed | Firms choose market-friendly sites |
| Foreign capital | Restricted (FERA 1973) | Liberalised (FEMA 1999, automatic route) | FDI concentrated in metros and coasts |
| Trade orientation | Import substitution | Export orientation, SEZs, PLI | Port-based and corridor-based growth |
| Regional aim | Explicit dispersal to backward areas | Market-led, with special incentives | Rising regional divergence |
| Current tools | Plans, licences, PSUs | PLI (2020), corridors, Gati Shakti, NMM (2025) | New nodes in Gujarat, UP, Tamil Nadu |
Mains points
- Questions ask about the impact of liberalisation on industrial location, the role of the public sector or MNCs, or evaluate Make in India and PLI.
- Always connect policy to geography: where did PSUs locate, where did FDI go, which regions gained or lost.
- Use a timeline and a comparison table; include current data (FDI 2024–25, PLI 2020, NMM 2025, semiconductor plants).
- Bring theory: Myrdal, Harvey's uneven development, new international division of labour.
- Give balanced conclusions: efficiency gains vs regional divergence and jobless growth.
- Common mistake: writing pure economics; examiners want spatial patterns and maps.
Did you know?
- Of the 17 industries reserved exclusively for the state in 1956, only atomic energy and railway operations remain reserved for the public sector today.
Special Economic Zones and Tourism
Special Economic Zones are duty-free enclaves treated as foreign territory for trade, evolved from India's first Export Processing Zone at Kandla (1965) to the SEZ Act 2005; as of 31 March 2026 there were 368 notified and 277 operational SEZs, mostly IT and services zones in the southern and western states. Tourism uses India's cultural, natural and religious diversity (44 UNESCO World Heritage Sites as of 2025); foreign tourist arrivals were about 9 million in 2025 (provisional, Ministry of Tourism). Eco-tourism seeks to conserve nature and benefit local communities, but carrying capacity limits in the Himalaya and protected areas demand careful planning.
In simple words
An SEZ is like a special fenced campus where companies get easy rules and no import taxes so that they can make goods and services for export.
Tourism is the business of visitors: pilgrims to Varanasi, families to Goa, trekkers to Ladakh.
Eco-tourism means visiting nature gently, so that forests survive and local people earn money.
UPSC asks where SEZs are located, whether they work, and how tourism can grow without harming fragile places.
1. Concepts and Definitions
Export Processing Zone (EPZ): an industrial estate with duty-free import of inputs and simplified procedures, producing mainly for export; Kandla EPZ (1965, Gujarat) was among Asia's first, followed by Santacruz Electronics EPZ (SEEPZ, Mumbai, 1973), Falta, Noida, Chennai, Cochin and Visakhapatnam.
Special Economic Zone (SEZ): a specifically delineated duty-free enclave deemed foreign territory for trade operations, duties and tariffs; it may be multi-product, sector-specific, IT/ITES, free trade and warehousing zones.
Tourism (UN Tourism, formerly UNWTO): activities of persons travelling to and staying outside their usual environment for not more than one consecutive year for leisure, business or other purposes.
Eco-tourism: 'responsible travel to natural areas that conserves the environment, sustains the well-being of local people and involves interpretation and education' (The International Ecotourism Society, 1990, revised 2015); the term is credited to Héctor Ceballos-Lascuráin in the 1980s.
Carrying capacity: the maximum number of visitors an area can support without unacceptable environmental, social or experiential damage.
2. SEZ Policy and Performance
Evolution: SEZ policy announced in April 2000 (EPZs converted to SEZs), SEZ Act 2005 and SEZ Rules 2006 offered tax holidays, duty exemptions, single-window clearance and permission for private developers.
Status (SEZ India fact sheet, 31 March 2026): 368 notified SEZs, 277 operational SEZs and about 7,013 approved units; a parliamentary reply in July 2026 reported 95 notified SEZs as non-operational.
Exports: exports from SEZs were about ₹11.70 lakh crore in April–December 2025, up about 32% over the previous year (Ministry of Commerce, March 2026); IT and ITES dominate, with engineering, gems and jewellery, pharmaceuticals and electronics.
Spatial pattern: operational SEZs are concentrated in Tamil Nadu, Telangana, Karnataka, Maharashtra, Gujarat, Andhra Pradesh and Kerala; few exist in the eastern and north-eastern states.
Major SEZs: Kandla and Mundra (Gujarat), SEEPZ (Mumbai), Sri City (Andhra Pradesh), Mahindra World City (Chennai and Jaipur), Visakhapatnam, Cochin, Noida, Falta (West Bengal); GIFT City (Gujarat) houses India's International Financial Services Centre in a multi-service SEZ.
Problems: land acquisition conflicts (Nandigram and Singur in West Bengal, 2006–07), large tracts notified but unused, real-estate motives, revenue loss, and reduced attractiveness after the income-tax holiday was ended for units starting after 31 March 2020 (sunset clause).
Reform proposals: the Baba Kalyani Committee (2018) recommended linking SEZs with employment and economic enclaves; a Development of Enterprise and Service Hubs (DESH) Bill was proposed in 2022 but has not been enacted.
3. Tourism Resources and Regions
Cultural and heritage tourism: 44 UNESCO World Heritage Sites (2025, after the Maratha Military Landscapes were inscribed), including the Taj Mahal, Ajanta and Ellora, Hampi, Khajuraho, Konark, Rani-ki-Vav, the Moidams of Assam (2024) and Santiniketan (2023).
Religious tourism: Varanasi, Prayagraj (Kumbh Mela, inscribed on UNESCO's intangible heritage list in 2017), Ayodhya, Tirupati, Vaishno Devi, Char Dham (Uttarakhand), Amritsar, Bodh Gaya (Buddhist circuit), Ajmer Sharif.
Nature and adventure tourism: Himalaya (Ladakh, Himachal, Uttarakhand, Sikkim), Western Ghats hill stations (Munnar, Ooty), beaches (Goa, Kerala, Andaman), deserts (Jaisalmer), wildlife reserves (Corbett, Ranthambore, Kaziranga).
Other forms: medical and wellness tourism (Chennai, Delhi NCR, Kerala Ayurveda), MICE tourism, rural and homestay tourism, cruise tourism.
Data: foreign tourist arrivals about 9.02 million in 2025 and foreign exchange earnings about ₹2.74 lakh crore (provisional, Ministry of Tourism Annual Report 2025–26); sources differ slightly between editions, and earnings fell from 2024; domestic tourism is far larger in volume.
Schemes: Incredible India campaign (2002), Swadesh Darshan (2014–15; Swadesh Darshan 2.0 from 2022 for sustainable destinations), PRASHAD (2014–15, pilgrimage infrastructure), Dekho Apna Desh (2020), e-Visa, UDAN regional air connectivity, and iconic site development.
4. Eco-tourism in India
Examples: Thenmala (Kerala, often called India's first planned eco-tourism destination), Periyar Tiger Reserve community eco-tourism with former poachers as guides, Khonoma (Nagaland, a 'green village' with hunting bans), Mawlynnong (Meghalaya), Sikkim's community-based homestays near Khangchendzonga, Spiti and Ladakh homestays, Sundarbans and Bhitarkanika mangrove tours.
Policy: National Strategy for Ecotourism (Ministry of Tourism, 2022), NTCA guidelines regulating tourism in tiger reserves (after the Supreme Court's 2012 orders on core-area tourism), and state eco-tourism policies (Kerala, Sikkim, Madhya Pradesh).
Benefits: livelihoods for local and tribal communities, incentives for conservation, environmental education, and diversification of rural economies.
Risks: 'greenwashing' where mass tourism is labelled eco-tourism, disturbance to wildlife, waste and water stress in hill towns, and loss of local control to outside operators.
5. Tourism, Environment and Carrying Capacity
Himalayan pressure: Joshimath land subsidence (January 2023), traffic and waste in Shimla, Manali and Mussoorie, and crowding at Char Dham and Kedarnath show the limits of fragile mountains; Supreme Court and NGT directions have asked for carrying capacity studies in Himalayan states.
Coastal pressure: Coastal Regulation Zone rules (2019) and Blue Flag beach certification (India has about a dozen certified beaches, including Shivrajpur, Radhanagar and Kappad) seek to manage beach tourism; Goa faces sand mining, sewage and crowding.
Over-tourism and cultural impacts: commodification of culture, rising land prices and displacement of local residents in popular towns.
Sustainable tourism tools: permits and caps (Valley of Flowers, Rohtang), green taxes, homestays, community management, and Swadesh Darshan 2.0's destination-based sustainability approach.
6. Theory and Debates
Butler's Tourism Area Life Cycle (Richard Butler, 1980): destinations pass through exploration, involvement, development, consolidation, stagnation and then decline or rejuvenation; Goa and Shimla show consolidation and stagnation symptoms, while Ladakh moved rapidly from exploration to development after the 2000s.
Doxey's Irridex (George Doxey, 1975): host attitudes move from euphoria to apathy, annoyance and antagonism as tourism grows; useful for understanding local resistance in Himalayan villages.
Plog's psychographic model (Stanley Plog, 1974): adventurous 'allocentric' travellers discover places that later attract 'psychocentric' mass tourists.
SEZ debate: supporters see SEZs as growth poles for exports and jobs (as in China's Shenzhen); critics see them as enclaves with land dispossession and limited linkages; India's experience shows strong IT exports but weak manufacturing SEZs.
7. Maps and Diagrams to Draw
SEZ map: mark major SEZs (Kandla, Mundra, SEEPZ, GIFT City, Sri City, Mahindra World City, Visakhapatnam, Cochin, Noida, Falta) and shade states with the most operational SEZs.
Tourism map: tourist circuits (Golden Triangle Delhi–Agra–Jaipur, Buddhist circuit, Char Dham, Kerala backwaters, North-East eco-tourism) and selected UNESCO sites.
Butler's curve: number of visitors on the y-axis and time on the x-axis with the six stages and the alternative paths of rejuvenation or decline; label an Indian example at each stage.
Eco-tourism model: a triangle linking conservation, community benefit and visitor experience, with education at the centre.
8. Using It in the Exam
10 marks: SEZs: concept, status (2026 data) and regional distribution; or a note on eco-tourism with Indian examples.
15 marks: tourism potential and problems of the Himalaya or the North-East with a map.
20 marks: evaluate SEZs as instruments of regional development, or tourism and sustainable development using Butler and Doxey with case studies.
Keywords: deemed foreign territory, sunset clause, land acquisition, tourism circuits, carrying capacity, Butler's TALC, Irridex, community-based eco-tourism.
Attributed idea: Butler (1980) argued that tourist areas evolve through a predictable life cycle and may decline unless rejuvenated.
| Indicator | Value | Date | Source |
|---|---|---|---|
| Notified SEZs | 368 | 31 March 2026 | SEZ India fact sheet |
| Operational SEZs | 277 | 31 March 2026 | SEZ India fact sheet |
| SEZ exports | About ₹11.70 lakh crore (April–December) | 2025 | Ministry of Commerce |
| Foreign tourist arrivals | About 9.02 million (provisional) | 2025 | Ministry of Tourism Annual Report 2025–26 |
| Foreign exchange earnings from tourism | About ₹2.74 lakh crore (provisional) | 2025 | Ministry of Tourism |
| UNESCO World Heritage Sites | 44 | 2025 | UNESCO |
Mains points
- Questions ask about the role and failures of SEZs, regional distribution of SEZs, tourism potential of a region, or eco-tourism and carrying capacity.
- For SEZs, use the latest fact sheet (31 March 2026), explain the sunset clause and land conflicts, and evaluate employment and linkages.
- For tourism, organise by resource type (heritage, religious, nature, medical) and region, with circuits on a map.
- Use theory: Butler's life cycle, Doxey's Irridex, Plog's model; link to Himalayan case studies (Joshimath, Shimla).
- Distinguish genuine eco-tourism (community benefit, conservation, education) from nature-based mass tourism.
- Common mistake: quoting pre-2020 FTA figures or old SEZ counts; give dates.
Did you know?
- Kandla's Export Processing Zone, set up in 1965, is often cited as the first in Asia, more than a decade before China opened Shenzhen as a Special Economic Zone in 1980.
UPSC Previous Year Questions: Industry in India
From 2014 to 2026 UPSC asked 33 question parts worth 485 marks from this chapter in Paper II. Location of major industries (14 parts, with pharmaceuticals asked five times) and SEZs and tourism (10 parts) dominate, followed by industrial policy, multinationals and start-ups (6) and industrial regions and corridors (3). Every question below has a model answer written to the UPSC word limit, with the map or diagram an examiner expects.
In simple words
Read the question and write your own answer first, keeping to the word limit (10 marks about 150 words, 15 marks about 200, 20 marks about 250).
Then compare it with the model answer: did you explain location with Weber-type factors, name real clusters and plants, cite policies with their year and recent data, and draw a map?
Note what you missed in one line and reread that part of the notes before trying the next question.
1. Evolution of Industries and Industrial Regionalisation
Example 1 (UPSC 2021, 15 marks): Identify the major industrial corridors of India and discuss the characteristics of Bengaluru-Mumbai Corridor.
Paper and question: Paper II, Q7(b)
Approach: Explain the concept of industrial corridors and list the major corridors under the National Industrial Corridor Development Programme, then discuss the characteristics of the Bengaluru–Mumbai corridor. Draw a map of the corridors.
An industrial corridor is a linear zone of planned industrial development along a high-capacity transport spine (freight corridor, expressway, port links), with industrial nodes, smart cities and logistics hubs. India's programme is run by the National Industrial Corridor Development Corporation (NICDC).
Major corridors: the Delhi–Mumbai Industrial Corridor (along the Western Dedicated Freight Corridor, with nodes such as Dholera, Shendra–Bidkin and Greater Noida), Amritsar–Kolkata, Chennai–Bengaluru (extended to Kochi), the East Coast corridor (Visakhapatnam–Chennai), Bengaluru–Mumbai, Hyderabad–Bengaluru, Hyderabad–Nagpur, Hyderabad–Warangal, Odisha Economic Corridor and Delhi–Nagpur, with twelve new industrial smart cities approved in 2024.
Bengaluru–Mumbai Economic Corridor: (i) alignment: along NH-48 through Tumakuru, Chitradurga, Davanagere, Hubballi–Dharwad, Belagavi, Kolhapur, Satara and Pune, with Dharwad and Satara as planned nodes; (ii) anchor cities: it links two of India's largest economies, Mumbai (finance, port, pharmaceuticals) and Bengaluru (IT, aerospace, electronics); (iii) industries: automobiles and engineering at Pune–Chakan, machine tools and foundries at Kolhapur and Belagavi, textiles at Ichalkaranji, sugar and agro-processing in western Maharashtra and north Karnataka; (iv) connectivity: JNPA port, Mumbai and Bengaluru airports and rail links; (v) potential: to spread industry into the backward northern Karnataka and southern Maharashtra hinterland.
Challenges: land acquisition, water scarcity in the Deccan, and slow progress of the nodes.
Map: Map of India showing the main industrial corridors, with the Bengaluru–Mumbai corridor, its towns and the Dharwad and Satara nodes highlighted.
Corridors can spread industry more evenly if infrastructure and land issues are resolved.
Example 2 (UPSC 2017, 20 marks): Name the major industrial regions of India indicating the bases of their identification. Highlight their basic problems.
Paper and question: Paper II, Q8(a)
Approach: State the bases (criteria) for identifying industrial regions, name the major regions with their main industries, then highlight their common and specific problems. Draw a map of industrial regions.
An industrial region is an area where industries cluster densely with strong linkages. Indian regions are usually identified on the basis of the number of industrial units, the number of industrial workers, power used in industry, the value of industrial output and value added, often measured at district level (as in the NCERT classification of 8 major regions, 13 minor regions and 15 industrial districts).
Major industrial regions: (i) Mumbai–Pune: cotton textiles, petrochemicals, engineering, automobiles, pharmaceuticals; (ii) Hugli: jute, engineering, chemicals, paper; (iii) Bengaluru–Tamil Nadu: IT, aircraft, automobiles (Chennai, Hosur), textiles (Coimbatore, Tiruppur); (iv) Gujarat: textiles (Ahmedabad, Surat), petrochemicals and refining (Jamnagar, Vadodara, Ankleshwar), pharmaceuticals; (v) Chotanagpur: iron and steel (Jamshedpur, Bokaro, Durgapur), coal-based industries, heavy engineering; (vi) Visakhapatnam–Guntur: shipbuilding, steel, refining, fertilisers; (vii) Gurugram–Delhi–Meerut: automobiles, electronics, light engineering; (viii) Kollam–Thiruvananthapuram: coir, cashew, rubber products and IT.
Common problems: congestion, slums and pollution in metropolitan cores; high land and labour costs; shortage of water and power; and pressure on transport.
Specific problems: the Hugli region suffers from declining jute mills, obsolete plants, labour unrest and siltation of Kolkata port; Mumbai has seen textile mill closures since the 1980s and land scarcity; Chotanagpur faces mining-related displacement, pollution, Left-wing extremism and weak diversification; and Gujarat's Golden Corridor (Vapi, Ankleshwar) has severe industrial pollution.
Regional imbalance: industry remains concentrated in a few regions, leaving much of the north-east, Bihar, eastern Uttar Pradesh and central India industrially backward.
Map: Map of India marking the eight major industrial regions with their key centres and dominant industries.
Decongestion, modernisation, clean technology and new corridors that take industry to lagging regions can address these problems.
Example 3 (UPSC 2015, 15 marks): Why is the traditional crafts industry in India on the decline?
Paper and question: Paper II, Q2(b)
Approach: Introduce India's traditional crafts and their importance, then explain the economic, technological, social and institutional causes of decline with examples, ending with revival measures. Draw a map of major craft clusters.
India's traditional crafts (handloom weaving, pottery, metalware, wood carving, carpets, embroidery, toys) are rooted in local raw materials and hereditary skills and employ millions, many of them women and rural artisans, as in Varanasi silk, Moradabad brassware, Channapatna toys and Bhadohi carpets.
Causes of decline: (i) competition from machine-made goods and cheap imports, such as powerloom fabrics and Chinese toys and festive goods; (ii) changing consumer tastes towards modern, branded products; (iii) exploitation by middlemen, who capture most of the price, leaving artisans with low wages; (iv) rising raw-material costs and scarcity of silk yarn, wood, cane and clay; (v) lack of credit, design innovation and marketing, so products do not reach urban or export markets; (vi) poor working conditions and low social status, which push the younger generation to other jobs; (vii) weak institutional support and slow adoption of e-commerce and branding.
Revival measures: GI tags (such as Banarasi sarees and Channapatna toys), One District One Product (2018), PM Vishwakarma (2023), handloom clusters, design institutes, cooperatives, crafts tourism and online marketplaces.
Map: Map of India marking craft clusters: Varanasi, Moradabad, Bhadohi, Channapatna, Kanchipuram, Pochampally, Kutch and Srinagar.
Linking crafts to modern design, markets and tourism can turn decline into revival.
2. Location of Major Industries
Example 4 (UPSC 2026, 15 marks): Explain the global supply chain for the fertilizer industry in India. How do international prices of key inputs affect domestic production?
Paper and question: Paper II, Q2(c)
Approach: Describe the input structure of the fertiliser industry and India's dependence on global supply chains for each input, then explain how international prices affect domestic production, subsidy and farmers, with responses. Draw a map of import sources and domestic plants.
India is one of the world's largest consumers of fertilisers, but its fertiliser industry depends heavily on imported raw materials and finished products, tying it closely to global supply chains.
Global supply chain: (i) urea is made from natural gas, much of it imported as LNG from Qatar and other suppliers, while finished urea is also imported to meet the gap; (ii) phosphatic fertilisers (DAP) depend on imported rock phosphate and phosphoric acid from Morocco, Jordan and others, and on finished DAP from China, Saudi Arabia and Russia; (iii) potash (MOP) is fully imported, from Canada, Belarus, Russia and Israel, because India has no workable potash reserves.
Effect of international prices: (i) when global gas, ammonia and DAP prices spiked after the Russia–Ukraine war in 2022, production costs and import bills rose sharply; (ii) because urea prices for farmers are fixed and other fertilisers are covered by the Nutrient Based Subsidy (2010), the government absorbs the rise, and the subsidy bill soared in 2022–23; (iii) high prices and export restrictions by China caused temporary DAP shortages in some states.
Responses: revival of urea plants at Gorakhpur, Sindri, Barauni and Ramagundam; coal-gasification urea at Talcher; joint ventures abroad for raw materials; nano urea and nano DAP; and promotion of balanced and organic nutrients.
Map: World map showing India's import sources for gas, rock phosphate and potash, with India's major fertiliser plants at Hazira, Kakinada, Paradip, Gorakhpur and Talcher.
Reducing import dependence through domestic capacity and efficient use is vital for food security.
Example 5 (UPSC 2026, 20 marks): Analyse the spatial distribution of India's automobile industry. How have the clusters like Chennai, Pune and Gurugram emerged as key auto-hubs?
Paper and question: Paper II, Q4(a)
Approach: Describe the spatial distribution of the automobile industry, then explain the factors behind the emergence of the Chennai, Pune and Gurugram hubs individually, ending with new trends (EVs, new clusters). Draw a map of auto clusters.
India is the world's largest two-wheeler producer and the third-largest car market. Its automobile industry, an assembly industry dependent on thousands of component suppliers, is concentrated in a few clusters where agglomeration economies are strong.
Spatial distribution: (i) the north, around Gurugram–Manesar, Faridabad and Noida, with Pantnagar in Uttarakhand; (ii) the west, around Pune–Chakan, Nashik and Aurangabad in Maharashtra and Sanand, Becharaji and Halol in Gujarat; (iii) the south, around Chennai–Sriperumbudur–Oragadam, Hosur, Bengaluru (Bidadi) and Anantapur (Kia); (iv) the east, mainly Jamshedpur (Tata commercial vehicles); and (v) Pithampur near Indore in central India.
Chennai ('Detroit of Asia'): (i) ports at Chennai and Ennore (Kamarajar) for exports and imported parts; (ii) a strong engineering and component base built by TVS and Ashok Leyland; (iii) skilled labour from engineering colleges and ITIs; (iv) proactive state policies and SEZs that attracted Hyundai (1998), Renault–Nissan, BMW and Daimler.
Pune: (i) early anchor firms such as Tata Motors (Pimpri) and Bajaj Auto (Akurdi), and later Mercedes-Benz, Volkswagen and Mahindra at Chakan; (ii) research and testing institutions (ARAI) and engineering colleges; (iii) proximity to the Mumbai market, finance and JNPA port.
Gurugram–Manesar: (i) the government-backed Maruti Udyog (1983) with Suzuki, followed by Hero Honda and Honda; (ii) a huge market in the National Capital Region and north India; (iii) a dense vendor network in Haryana and Delhi.
New trends: Gujarat (Sanand, Becharaji) and Andhra Pradesh are emerging, electric vehicles and batteries are attracting PLI-backed investment in Tamil Nadu, Karnataka and Maharashtra, and congestion in Gurugram pushes new plants to Kharkhoda (Haryana).
Map: Map of India marking auto clusters: Gurugram–Manesar, Pune–Chakan, Chennai–Sriperumbudur, Sanand, Hosur–Bengaluru, Jamshedpur, Pithampur and Anantapur.
These hubs show how anchor firms, ports, skills and policy create self-reinforcing industrial clusters, in line with agglomeration theory.
Example 6 (UPSC 2025, 20 marks): Explain the factors which contribute to the growth of India's pharmaceutical industry with specific reference to its concentration in western region of India.
Paper and question: Paper II, Q2(a)
Approach: Show the scale of India's pharmaceutical industry and the general factors of its growth, then explain specifically why it concentrates in western India (Gujarat and Maharashtra), ending with other emerging hubs. Draw a map of pharma clusters.
India is often called the 'pharmacy of the world': it is the third-largest producer of medicines by volume and supplies a large share of the world's generic medicines and vaccines, though it ranks lower by value.
General growth factors: (i) the Patents Act, 1970, which allowed process patents and the reverse engineering of drugs until 2005, letting Indian firms master generics; (ii) a large pool of chemists, pharmacists and low-cost skilled labour; (iii) strong entrepreneurship, with firms such as Cipla, Sun Pharma, Dr. Reddy's, Lupin and Zydus; (iv) the largest number of US FDA-approved plants outside the United States; (v) government support through PLI for bulk drugs (2020) and bulk drug parks.
Concentration in western India: (i) early start: the Haffkine Institute in Mumbai (1899) and Alembic in Vadodara (1907) began the industry, and Cipla was founded in Mumbai in 1935; (ii) chemical base: Gujarat's petrochemical and chemical complexes at Vadodara, Ankleshwar, Vapi and Dahej supply solvents and intermediates; (iii) capital and markets: Mumbai provides finance, corporate headquarters and a large market; (iv) ports: JNPA, Mundra and Kandla aid the import of raw materials and the export of formulations; (v) infrastructure and policy: GIDC and MIDC estates, reliable power and pro-industry governments in Gujarat and Maharashtra; (vi) clusters: Ahmedabad, Vadodara and Ankleshwar in Gujarat, and Mumbai, Thane, Pune and Aurangabad in Maharashtra, with strong supplier networks and skilled labour.
Other hubs: Hyderabad (the 'bulk drug capital'), Baddi in Himachal Pradesh and Sikkim, which grew on tax incentives.
Challenges: dependence on Chinese APIs, quality and regulatory lapses, and pollution in chemical clusters.
Map: Map of India marking pharma clusters: Ahmedabad–Vadodara–Ankleshwar, Mumbai–Thane–Pune, Hyderabad, Baddi, Sikkim, Visakhapatnam and Goa, with the bulk drug parks.
Western India's advantage rests on history, chemicals, capital and ports, and future growth depends on API self-reliance and innovation.
Example 7 (UPSC 2025, 15 marks): Why cottage industries in India are an integral part of Indian socio-economic structure? Assess this with reference to different types of cottage industries in rural India.
Paper and question: Paper II, Q4(b)
Approach: Define cottage industries and explain why they are integral to India's socio-economic structure, then assess this through the main types of rural cottage industries, with problems and support. Draw a map of cottage industry clusters.
Cottage industries are small units run mainly by family labour at home, with little capital, using local raw materials and traditional skills. They are integral to India's socio-economic structure because they combine livelihood, culture and community.
Why integral: (i) employment: they provide work close to home for landless labourers, women and artisans, and supplementary income in the agricultural off-season; (ii) decentralisation: they spread non-farm activity to villages and reduce distress migration; (iii) low capital and local resources: they use local cotton, clay, bamboo, coir and other materials; (iv) culture: they preserve skills and identity, often linked to caste and community traditions.
Types in rural India: (i) handloom and khadi, such as Pochampally, Chanderi, Maheshwar and Assam's silk (muga, eri), with the Handloom Census (2019–20) counting about 35 lakh handloom workers; (ii) pottery and terracotta (Khurja, Bankura); (iii) bamboo and cane in the north-east; (iv) coir in Kerala; (v) food processing: papad, pickles and jaggery; (vi) forest-based work: lac, bidi, agarbatti and honey in tribal belts; (vii) metal and woodwork, carpets and embroidery (Bhadohi, Kutch).
Assessment: they remain vital, but they face competition from factory goods, low incomes, middlemen and weak marketing, and many artisans are leaving. Support comes from KVIC, One District One Product (2018), PM Vishwakarma (2023), GI tags and e-commerce.
Map: Map of India marking cottage industry clusters: Pochampally, Chanderi, Sualkuchi (Assam silk), Khurja, Bankura, Kerala coir, Bhadohi and Kutch.
Cottage industries remain a pillar of inclusive, decentralised rural development.
Example 8 (UPSC 2023, 20 marks): Indian Pharma Industry has to move from 'volume' to 'value' leadership to capture global market. Discuss.
Paper and question: Paper II, Q3(a)
Approach: Explain what volume and value leadership mean, show India's current volume strength and value gap, then discuss the requirements for the shift (R&D, innovation, quality, APIs, biologics, policy), with examples. Draw a diagram of the pharma value chain.
India is the third-largest producer of medicines by volume, supplying a large share of global generics and vaccines, but it ranks much lower by value because it mainly makes low-margin, off-patent generics.
Why the value gap exists: (i) low spending on research and development compared with global innovators; (ii) dependence on China for many APIs and key starting materials; (iii) a focus on simple generics rather than new molecules, biologics or complex generics; (iv) periodic quality and regulatory lapses, such as US FDA warning letters and contaminated cough syrup exports linked to child deaths abroad in 2022; (v) price competition that keeps margins low.
What the shift to value requires: (i) innovation: drug discovery, new chemical entities and incentives under the Scheme for Promotion of Research and Innovation in Pharma MedTech (2023); (ii) complex products: biosimilars, specialty generics, vaccines and cell and gene therapies, building on successes such as Serum Institute and Biocon; (iii) backward integration: PLI for bulk drugs (2020) and bulk drug parks to reduce API imports; (iv) quality: stricter Schedule M good manufacturing practice standards and a stronger regulator; (v) academia–industry links: research clusters such as Hyderabad's Genome Valley and Pune; (vi) intellectual property and branding: moving from copying to creating, while protecting affordable access through India's patent law.
Opportunities: patent expiries of blockbuster drugs, the global push to diversify supply chains away from China, the medical devices market and contract research and manufacturing.
Diagram: Smile curve of the pharmaceutical value chain, with R&D and discovery and branding at the high-value ends and generic formulation in the low-value middle, showing India's movement towards the ends.
By combining its manufacturing scale with innovation and quality, India can move from being the world's pharmacy to its innovation hub.
Example 9 (UPSC 2023, 10 marks): Identify the jute-producing areas and discuss the major causes of decline of jute mill industry in India.
Paper and question: Paper II, Q5(a)
Approach: Identify the jute-growing areas and the location of the mill industry, then discuss the major causes of the decline of jute mills. Draw a map of jute areas and Hugli mills.
Jute needs a hot, humid climate, heavy rain and fertile, annually renewed alluvium, with plenty of water for retting. It is grown mainly in the lower Ganga–Brahmaputra delta: West Bengal (Nadia, Murshidabad, North 24 Parganas, Hooghly), which produces most of India's jute, followed by Bihar (Purnia, Katihar), Assam (Nagaon, Barpeta) and Odisha, with smaller areas in Meghalaya, Tripura and Andhra Pradesh (mesta).
Mills: most jute mills lie along both banks of the Hugli near Kolkata, a location chosen for raw material, cheap water transport, coal, labour and the port.
Causes of decline: (i) Partition (1947) left most jute-growing land in East Pakistan while the mills stayed in India; (ii) competition from synthetic packaging (plastic and polypropylene bags); (iii) obsolete machinery and low productivity; (iv) labour unrest, frequent lockouts and mill closures; (v) volatile raw-jute prices and poor fibre quality; (vi) competition from Bangladesh; (vii) dependence on government orders for sacks under the Jute Packaging Materials Act (1987).
Map: Map of eastern India showing jute-growing districts of West Bengal, Bihar, Assam and Odisha, with the Hugli mill belt.
Diversified, eco-friendly jute products could revive the industry.
Example 10 (UPSC 2021, 10 marks): Give a reasoned account of difference between sugar industry of North and Peninsular India.
Paper and question: Paper II, Q1(d)
Approach: Compare the sugar industry of the north (Uttar Pradesh, Bihar, Punjab, Haryana) and the Peninsula (Maharashtra, Karnataka, Tamil Nadu, Andhra Pradesh) point by point, explaining each difference geographically. Draw a map of sugar belts.
Sugar mills locate near cane fields because cane is bulky, perishable and loses sucrose quickly after cutting, a classic weight-losing raw material in Weber's terms. Yet the industry differs between the north and the Peninsula.
Climate and cane quality: the tropical Peninsula, with no frost and a long growing season, produces cane with higher sucrose content and yield, whereas northern subtropical cane faces cold winters and hot, dry summers.
Crushing season: it is longer in the Peninsula (often about six months) than in the north (about four to five months), so southern mills use capacity better.
Mill size and age: the north has many older mills established in colonial times, while Peninsular mills are generally newer and larger, although Uttar Pradesh has modernised and is now a leading sugar producer.
Ownership: Maharashtra's industry is dominated by cooperative mills, while the north has more private and state mills.
Location: nearness to ports helps Peninsular mills export.
Map: Map of India showing the northern sugar belt (western and eastern Uttar Pradesh, north Bihar) and the Peninsular belt (western Maharashtra, north Karnataka, Tamil Nadu).
Both regions now face water stress and need drip irrigation.
Example 11 (UPSC 2020, 15 marks): The pharmaceutical industry in India depends on the import of raw materials. Evaluate this statement in view of the Indo-Chinese relationship.
Paper and question: Paper II, Q2(c)
Approach: Show the extent of the industry's dependence on imported APIs and intermediates, especially from China, evaluate the risks in light of Indo-Chinese relations (Galwan, COVID-19 disruptions), and assess the policy response. Draw a diagram of the pharma supply chain.
India's pharmaceutical industry is a global leader in generic formulations, but it depends heavily on imported active pharmaceutical ingredients (APIs), key starting materials and intermediates, most of them from China.
Extent of dependence: industry estimates commonly put China's share of India's bulk drug imports at about two-thirds or more, and for some essential antibiotics, such as penicillin and other fermentation-based drugs, and vitamins, dependence is almost total. India once made many of these but lost out to cheaper Chinese production with state subsidies and economies of scale.
Evaluation in light of Indo-Chinese relations: (i) the early COVID-19 lockdown in Hubei (2020) disrupted supplies and raised API prices, forcing India to restrict exports of some drugs temporarily; (ii) the Galwan clash (June 2020) exposed the strategic risk of depending on a rival for medicines; (iii) yet trade continued because Chinese inputs remain cheaper, showing deep economic interdependence; so the statement is valid, but the risk is managed, not absolute.
Policy response: PLI for critical key starting materials, intermediates and APIs (2020), three bulk drug parks approved in Gujarat, Himachal Pradesh and Andhra Pradesh, revival of fermentation-based production such as penicillin G, and diversification of import sources.
Diagram: Supply-chain diagram showing Chinese key starting materials and APIs flowing to Indian formulation clusters (Gujarat, Maharashtra, Hyderabad) and then to export markets, with planned domestic API parks.
Reducing dependence will take years, but it is essential for both health and strategic security.
Example 12 (UPSC 2019, 10 marks): Assess the importance of foot-loose industries in the development of backward regions in India.
Paper and question: Paper II, Q5(d)
Approach: Define footloose industries, explain why they can locate in backward regions, give Indian examples, and assess their benefits and limits for regional development. Draw a map of examples.
Footloose industries are not tied to raw materials or a particular power source; they use light, high-value inputs and products, so transport costs matter little and they can locate almost anywhere with good connectivity, skilled labour and incentives. Examples are electronics assembly, software and IT services, pharmaceutical formulations, garments and precision engineering.
Importance for backward regions: (i) they can be steered to lagging areas through tax incentives, as in the special industrial packages for Himachal Pradesh and Uttarakhand (2003), which created the Baddi pharma cluster and the SIDCUL estates at Pantnagar and Haridwar, and for the north-east and Sikkim; (ii) they create employment and diversify agrarian economies; (iii) they are often cleaner than heavy industry and suit fragile hill regions; (iv) IT and BPO units in tier-2 and tier-3 towns, such as Mohali and Bhubaneswar, spread services.
Limits: units may leave when incentives end, local linkages are weak, and skilled workers are often brought from outside.
Map: Map of India marking Baddi, Pantnagar, Haridwar, Sikkim, Mohali and Bhubaneswar.
With skills and connectivity, footloose industries can reduce regional imbalance.
Example 13 (UPSC 2017, 10 marks): Mini steel plants can act as an instrument of decentralization of iron and steel industry in India. Explain.
Paper and question: Paper II, Q5(d)
Approach: Explain what mini steel plants are and how their technology frees them from the coal–iron belt, then show how they decentralise the industry with examples, noting limits. Draw a map of integrated plants versus mini-steel clusters.
Mini steel plants are small units that make steel in electric arc or induction furnaces from scrap and sponge iron (direct reduced iron) instead of iron ore and coking coal in blast furnaces.
Why they decentralise the industry: (i) they do not need large coking coal and iron ore sources, so they can locate near markets, ports or scrap sources rather than only in the Chotanagpur–Odisha belt; (ii) their small capital needs and short gestation suit regional entrepreneurs; (iii) they serve local demand for bars, rods and castings, cutting transport costs; (iv) they use electricity, which can be transmitted to any region.
Examples: Mandi Gobindgarh and Ludhiana (Punjab), Jalna (Maharashtra), Raipur and Raigarh (Chhattisgarh), Durgapur, and clusters in Gujarat and Tamil Nadu. India is the world's largest producer of sponge iron, and the secondary steel sector produces a large share of national output.
Limits: high power costs, dependence on imported scrap, and pollution from coal-based sponge iron units.
Map: Map of India contrasting integrated plants in the eastern mineral belt with mini-steel clusters in Punjab, Maharashtra, Chhattisgarh, Gujarat and Tamil Nadu.
Mini plants thus spread steel-making beyond the mineral belt.
Example 14 (UPSC 2016, 10 marks): "The Bokaro Iron and Steel Plant is an example of Industrial Complex." Explain.
Paper and question: Paper II, Q5(b)
Approach: Define an industrial complex (Isard), describe Bokaro's location and raw-material links, then show the interlinked activities that make it a complex. Draw a sketch of the Bokaro complex and its raw-material sources.
An industrial complex, in Walter Isard's analysis, is a set of activities at one location that are linked by technical, production and marketing flows, so that each gains from being close to the others.
Bokaro: the Bokaro Steel Plant in Jharkhand, built by the public sector with Soviet collaboration in the late 1960s and 1970s and now part of SAIL, lies in the Damodar valley close to its raw materials: coking coal from the Jharia and Bokaro coalfields, iron ore from Kiriburu–Meghahatuburu, limestone and dolomite from Jharkhand and Odisha, and water from the Damodar system.
Why it is a complex: (i) vertical linkages: coke ovens, sinter plant, blast furnaces, steel melting shops and rolling mills on one site; (ii) by-product industries: coal chemicals from the coke ovens and slag used for cement; (iii) energy links: captive power and nearby DVC thermal plants; (iv) downstream and ancillary units that use its steel; (v) a planned township with services and transport.
Diagram: Sketch of the Bokaro complex linked to Jharia coal, Kiriburu iron ore and limestone sources, with by-product, cement, power and ancillary units around the plant.
Bokaro thus shows how linked activities create agglomeration economies.
Example 15 (UPSC 2016, 20 marks): Analyze the location, distributional pattern and problems of cotton textile industries in India.
Paper and question: Paper II, Q7(a)
Approach: Explain the location factors of the cotton textile industry and how they have changed, describe its distributional pattern with named centres, then analyse its problems and responses. Draw a map of cotton textile centres.
The cotton textile industry is India's oldest modern industry, beginning with the first mill in Mumbai in 1854, and it remains one of the largest employers in manufacturing.
Location factors: (i) raw cotton: cotton loses little weight in processing, so the industry is not tied to cotton fields, though mills in Gujarat and Maharashtra benefit from black-soil cotton; (ii) market: textiles are market-oriented, so mills cluster near large cities; (iii) port, capital and labour: Mumbai had a port for importing machinery and exporting cloth, merchant capital and cheap migrant labour; (iv) power: hydroelectricity helped Coimbatore.
Distributional pattern: (i) Maharashtra: Mumbai, Solapur, Nagpur, Ichalkaranji and Bhiwandi (powerlooms); (ii) Gujarat: Ahmedabad (the 'Manchester of India') and Surat (synthetics); (iii) Tamil Nadu: Coimbatore (the 'Manchester of South India'), Tiruppur (knitwear exports) and Erode, now the leading spinning state; (iv) north: Kanpur (now declined), Ludhiana (hosiery) and Panipat (home textiles). Over time the industry has dispersed from Mumbai to cotton-growing interiors and the south, and from composite mills to decentralised powerlooms.
Problems: (i) obsolete machinery and sick mills, with the closure of most Mumbai mills after the 1982 strike; (ii) competition between the mill sector and powerlooms, and from synthetic fibres; (iii) volatile raw cotton prices and pest damage; (iv) high power and logistics costs; (v) a fragmented, small-scale structure; (vi) competition from Bangladesh, Vietnam and China in global markets; (vii) labour problems and pollution from dyeing units, as in Tiruppur.
Responses: PM MITRA mega textile parks (seven approved in 2023), PLI for man-made fibre and technical textiles, the Amended Technology Upgradation Fund Scheme and new trade agreements.
Map: Map of India marking cotton textile centres: Mumbai, Ahmedabad, Surat, Solapur, Coimbatore, Tiruppur, Kanpur, Ludhiana, Indore and the PM MITRA park sites.
Modernisation, integrated parks and a focus on value-added garments can restore the industry's competitiveness.
Example 16 (UPSC 2015, 10 marks): Why does the pharmaceutical industry concentrate largely in the western region of the country?
Paper and question: Paper II, Q1(b)
Approach: Give the main reasons (history, chemicals, capital, ports, policy, clusters) for the concentration of pharma in Maharashtra and Gujarat. Draw a map of western pharma clusters.
Maharashtra and Gujarat together account for a large share of India's pharmaceutical units, output and exports, making the western region the core of the industry.
Reasons: (i) early start: the Haffkine Institute in Mumbai (1899), Alembic in Vadodara (1907) and Cipla in Mumbai (1935) created an early base and skills; (ii) chemical and petrochemical base: complexes at Vadodara, Ankleshwar, Vapi and Dahej supply solvents and intermediates; (iii) capital and enterprise: Mumbai's finance and Gujarati and Marwari entrepreneurship produced firms such as Sun Pharma, Zydus, Torrent and Lupin; (iv) ports: JNPA, Mundra and Kandla ease raw-material imports and formulation exports; (v) infrastructure and policy: GIDC and MIDC estates, reliable power and quick approvals; (vi) agglomeration: clusters at Ahmedabad, Vadodara, Ankleshwar, Mumbai–Thane and Pune share suppliers, testing labs and skilled labour.
Map: Map of western India marking Ahmedabad, Vadodara, Ankleshwar, Vapi, Dahej, Mumbai–Thane, Pune and Aurangabad, with the ports.
These cumulative advantages keep the west ahead, though Hyderabad and Baddi are strong competitors.
Example 17 (UPSC 2014, 15 marks): Describe the problems of agro-based industries in India in general and cotton textiles in particular.
Paper and question: Paper II, Q2(c)
Approach: Describe the general problems of agro-based industries (raw material, seasonality, technology, finance, markets), then the specific problems of the cotton textile industry. Draw a map of major agro-based industries.
Agro-based industries use agricultural raw materials: cotton and jute textiles, sugar, vegetable oils, food processing, tea and coffee processing, tobacco and rubber goods. They are numerous, labour-intensive and largely rural or small-town based.
General problems: (i) raw material uncertainty: output and quality depend on the monsoon, and prices fluctuate; (ii) seasonality: sugar mills and cotton ginneries work only part of the year, leaving capacity idle; (iii) obsolete technology and low productivity in many old units; (iv) small scale and finance: limited credit and poor economies of scale; (v) weak infrastructure: storage, cold chains, power and roads; (vi) government controls on prices, such as cane pricing, and policy uncertainty; (vii) competition from synthetics and imports.
Cotton textiles in particular: (i) dependence on rain-fed cotton with volatile yields and prices, worsened by pink bollworm attacks on Bt cotton; (ii) sick and closed composite mills, especially in Mumbai, Kanpur and Ahmedabad; (iii) an unbalanced structure, with modern spinning but fragmented, low-tech weaving and processing; (iv) competition from powerlooms and synthetics at home and from Bangladesh and Vietnam abroad; (v) high power and logistics costs; (vi) pollution from dyeing, as in Tiruppur.
Map: Map of India marking cotton textile centres, the sugar belts of Uttar Pradesh and Maharashtra, the Hugli jute mills, and Assam tea.
Modernisation, integrated value chains and stable raw-material supply can revive agro-based industries.
3. Industrial Policies, Public Sector, Multinationals and Liberalisation
Example 18 (UPSC 2026, 15 marks): Discuss the role of the private sector in the technological advancements of the defence industry in India.
Paper and question: Paper II, Q2(b)
Approach: Outline the policy changes that opened defence manufacturing to private firms, then discuss the private sector's role in technological advancement with named examples, and its constraints. Draw a map of defence corridors and private defence hubs.
For decades India's defence production was dominated by ordnance factories and defence public sector undertakings such as HAL and BEL, and India became one of the world's largest arms importers. Since 2001, when the sector was opened to private firms, and especially since 2014, the private sector has been brought in to drive technology and self-reliance.
Policy enablers: FDI up to 74% through the automatic route (2020); the Defence Acquisition Procedure (2020) with preference for indigenous design; positive indigenisation lists that ban the import of listed items; iDEX (2018) for start-ups and MSMEs; defence industrial corridors in Uttar Pradesh and Tamil Nadu (2018).
Role in technological advancement: (i) platforms: Tata Advanced Systems builds the C-295 transport aircraft with Airbus at Vadodara (final assembly line opened in 2024), and L&T produces the K9 Vajra self-propelled howitzer; (ii) artillery and systems: Bharat Forge and Tata developed the ATAGS gun with DRDO; (iii) drones and munitions: private firms and start-ups make loitering munitions, surveillance drones and counter-drone systems; (iv) exports: India's defence exports reached a record of over ₹23,000 crore in 2024–25, with a significant private contribution.
Constraints: low private R&D spending, dependence on foreign engines and critical components, long procurement cycles and limited orders.
Map: Map of India marking the Uttar Pradesh and Tamil Nadu defence corridors and private defence hubs such as Vadodara, Hyderabad, Bengaluru, Pune and Nagpur.
A stable order pipeline, R&D incentives and co-development with global partners can make the private sector the engine of defence innovation.
Example 19 (UPSC 2021, 15 marks): Assess the growth of multinational corporations in liberalized economic environment of India.
Paper and question: Paper II, Q7(c)
Approach: Explain how liberalisation (1991 onwards) opened India to MNCs, assess their growth with data and sectoral and spatial examples, and evaluate the pattern. Draw a map of MNC concentration.
Multinational corporations (MNCs) are firms that own or control production in more than one country. Before 1991, licensing, the FERA (1973) cap on foreign equity and import controls limited their role; the New Industrial Policy (1991) abolished most licensing, allowed automatic approval of FDI and opened sector after sector.
Growth: cumulative FDI inflows since 2000 crossed 1 trillion US dollars in 2024, and gross inflows were about 81 billion US dollars in 2024–25 (DPIIT). Services, computer software and hardware, trading, telecommunications, automobiles, construction and pharmaceuticals are the leading sectors.
Sectoral examples: automobiles (Suzuki, Hyundai, Toyota, Kia), consumer goods (Hindustan Unilever, Nestlé), IT and global capability centres (Microsoft, Google, IBM and hundreds of GCCs in Bengaluru and Hyderabad), electronics (Samsung in Noida and Apple's contract manufacturers in Tamil Nadu and Karnataka), and e-commerce (Amazon, Walmart through Flipkart).
Spatial pattern: FDI is concentrated in Maharashtra, Karnataka, Gujarat, Delhi NCR and Tamil Nadu, reflecting markets, skills, ports and infrastructure, while eastern and north-eastern states receive little.
Evaluation: MNCs have brought capital, technology, jobs and exports and integrated India into global value chains, but their benefits are regionally uneven, profit repatriation is high, and there are concerns over tax disputes, market dominance and competition with domestic firms.
Map: Map of India showing the states with the highest FDI equity inflows (Maharashtra, Karnataka, Gujarat, Delhi, Tamil Nadu) and major MNC clusters.
Policies that spread FDI to lagging states and deepen local linkages can maximise MNC benefits.
Example 20 (UPSC 2019, 15 marks): Critically analyse the role of multinational corporations in India's economic development with suitable examples.
Paper and question: Paper II, Q2(b)
Approach: Analyse critically the positive contributions of MNCs to India's development with examples, then their negative effects, ending with a balanced conclusion. Draw a diagram of MNC impacts.
MNCs became major actors in India after the 1991 reforms and now account for a large share of investment, technology and exports in many sectors.
Positive role: (i) capital: FDI supplements domestic savings, with cumulative inflows crossing 1 trillion US dollars since 2000; (ii) technology and management: Maruti Suzuki transformed India's car industry and vendor base, and Hyundai made Chennai an export hub; (iii) employment and skills: IT and global capability centres in Bengaluru and Hyderabad employ large numbers of professionals; (iv) exports and value chains: mobile phone exports surged after Apple's suppliers and Samsung expanded under the PLI scheme; (v) competition and consumer choice: better products and services in telecommunications, retail and consumer goods.
Negative role: (i) regional imbalance: investment concentrates in a few metropolitan states; (ii) crowding out: domestic firms in soft drinks, consumer goods and retail faced intense competition; (iii) profit repatriation and transfer pricing reduce net gains, and tax disputes (Vodafone) arise; (iv) environmental and safety lapses: the Bhopal gas tragedy (Union Carbide, 1984) remains the starkest example; (v) market power in e-commerce and digital platforms raises competition concerns; (vi) limited technology transfer in some sectors.
Diagram: Two-column diagram of MNC impacts on India: benefits (capital, technology, jobs, exports, competition) against costs (regional imbalance, crowding out, repatriation, environmental risk, market power).
MNCs have been net contributors to growth, but strong regulation, local content and spatial dispersal are needed to align them with inclusive development.
Example 21 (UPSC 2018, 15 marks): Startups may play important role in giving fillip to economic growth in India. Illustrate with examples.
Paper and question: Paper II, Q8(b)
Approach: Define start-ups and the policy ecosystem, then illustrate with examples how they boost growth (jobs, innovation, inclusion, exports, regional spread), noting challenges. Draw a map of start-up hubs.
Start-ups are young, innovative firms that seek to scale a new product, service or business model. Since the Startup India initiative (2016), India has become one of the world's largest start-up ecosystems, with well over a lakh DPIIT-recognised start-ups and more than a hundred unicorns.
Role in economic growth: (i) jobs: recognised start-ups report lakhs of direct jobs, and platforms such as Zomato, Swiggy and Urban Company create gig work; (ii) innovation and productivity: fintech firms such as Paytm and PhonePe, built on UPI, transformed payments, and edtech and healthtech widened access; (iii) inclusion: agritech start-ups such as DeHaat and Ninjacart link farmers to markets, and women-led start-ups are rising; (iv) exports and global reach: software-as-a-service firms such as Freshworks and Zoho sell worldwide; (v) deep tech and strategic sectors: space start-ups such as Skyroot and Agnikul, opened up by IN-SPACe (2020), and drone and electric-vehicle start-ups (Ola Electric, Ather); (vi) regional spread: beyond Bengaluru, Delhi NCR and Mumbai, many start-ups now come from tier-2 and tier-3 cities.
Challenges: funding cycles and valuation corrections, regulatory uncertainty, gig-worker welfare, and the concentration of capital in a few hubs.
Map: Map of India marking start-up hubs (Bengaluru, Delhi NCR, Mumbai, Pune, Hyderabad, Chennai) and emerging tier-2 centres (Jaipur, Ahmedabad, Kochi, Indore).
With patient capital and supportive regulation, start-ups can become a major engine of growth and jobs.
Example 22 (UPSC 2016, 15 marks): Explain the New Industrial Policies in India.
Paper and question: Paper II, Q2(c)
Approach: Trace India's industrial policies from 1948 to the New Industrial Policy of 1991, explain its main features, and then the later policies (2011 onwards), with a brief evaluation. Draw a timeline diagram.
India's early industrial policies (1948, and the Industrial Policy Resolution of 1956) gave the public sector the 'commanding heights', reserved key industries for the state and controlled private industry through licensing under the Industries (Development and Regulation) Act, 1951. The result was a diversified base but also inefficiency, the 'licence raj' and slow growth.
New Industrial Policy, 1991: amid a balance-of-payments crisis, it (i) abolished industrial licensing for all but a few industries; (ii) reduced the industries reserved for the public sector, now essentially atomic energy and railway operations; (iii) permitted automatic approval of foreign direct investment, later raised in most sectors; (iv) removed the MRTP restrictions on large firms; (v) began disinvestment and reform of public enterprises; (vi) liberalised technology imports and trade.
Later policies: the National Manufacturing Policy (2011) targeting a 25% share of manufacturing in GDP and National Investment and Manufacturing Zones; Make in India (2014); Startup India (2016); GST (2017); Atmanirbhar Bharat (2020) with PLI schemes in 14 sectors; and the National Logistics Policy and PM Gati Shakti (2021–22) to cut logistics costs.
Evaluation: liberalisation raised growth, FDI and competition, but manufacturing's share of GDP has stayed around 15–17%, employment creation has been weak, and industry remains concentrated in a few states.
Diagram: Timeline from 1948 and 1956 (state-led), through 1991 (liberalisation), to 2011, 2014 and 2020 (manufacturing push), showing the shift from control to facilitation.
New industrial policy must now focus on jobs, regional balance and green manufacturing.
Example 23 (UPSC 2014, 15 marks): Explain the concept of 'Make in India' and indicate the essential inputs for its success.
Paper and question: Paper II, Q3(c)
Approach: Explain the concept and goals of Make in India (2014), then indicate the essential inputs for its success (infrastructure, ease of business, skills, land and labour, finance, R&D, policy stability), with an assessment. Draw a diagram of the essential inputs.
Make in India, launched in September 2014, aims to turn India into a global manufacturing hub by attracting domestic and foreign investment, raising manufacturing's share of GDP and creating jobs for a young workforce. It initially covered 25 sectors, from automobiles and electronics to defence and textiles, and was later strengthened by the PLI schemes (2020).
Essential inputs for success: (i) infrastructure: power, ports, dedicated freight corridors, industrial corridors and logistics (PM Gati Shakti, National Logistics Policy) to cut costs; (ii) ease of doing business: single-window clearances, fewer compliances and faster contract enforcement (India rose from 142nd in 2014 to 63rd in 2019 in the World Bank's Doing Business ranking); (iii) skilled labour: Skill India and vocational training matched to industry; (iv) land and labour reforms: easier land acquisition and flexible labour codes; (v) finance: affordable credit, especially for MSMEs; (vi) technology and R&D: innovation, design and quality standards; (vii) stable trade and tax policy, including GST and predictable tariffs.
Assessment: successes include mobile phone manufacturing and exports, defence production and record FDI, but manufacturing's share of GDP has not risen much, and jobs and MSME participation lag.
Diagram: Diagram with Make in India at the centre surrounded by its essential inputs: infrastructure, ease of business, skills, land and labour, finance, R&D and policy stability.
Sustained reform on all these inputs is needed for Make in India to deliver jobs at scale.
4. Special Economic Zones and Tourism
Example 24 (UPSC 2025, 10 marks): Write a critically argued essay on nautical tourism and its infrastructure in India.
Paper and question: Paper II, Q1(d)
Approach: Define nautical tourism and its forms, survey India's potential and infrastructure (cruise terminals, marinas, river cruises, island water sports), then argue critically about constraints and the way forward. Draw a map of nautical tourism sites.
Nautical tourism covers leisure travel on water: ocean and river cruises, yachting and sailing, marinas, houseboats, diving and water sports. With a long coastline, island groups and large rivers, India has great potential but a small share of the global market.
Infrastructure and initiatives: modern cruise terminals at Mumbai (2024), Kochi, Goa (Mormugao), Chennai and Visakhapatnam; the Cruise Bharat Mission (2024) to expand ocean, river and island cruising; the Ganga Vilas river cruise (2023) from Varanasi to Dibrugarh; Kerala's backwater houseboats; and diving and water sports in the Andamans and Lakshadweep.
Critical view: India has very few marinas and yacht facilities, procedures for foreign yachts and cruise ships are complex, and costs are high. CRZ rules and ecological fragility limit construction, while untreated waste and overcrowding threaten fragile coasts and reefs.
Map: Map of India marking cruise terminals (Mumbai, Goa, Kochi, Chennai, Visakhapatnam), the Ganga and Brahmaputra cruise routes, Kerala backwaters and island diving sites.
Simpler regulation, eco-sensitive marinas and community benefits can make nautical tourism sustainable.
Example 25 (UPSC 2024, 15 marks): Domestic tourism in India has immense local resource potential. Discuss the reasons and its various dimensions.
Paper and question: Paper II, Q3(c)
Approach: Show the scale of domestic tourism, explain the reasons for its local resource potential, then discuss its dimensions (religious, cultural, nature, rural, health, adventure, MICE and wedding tourism), with policy support. Draw a map of major domestic tourist circuits.
Domestic tourism is the backbone of Indian tourism: India Tourism Statistics (2024) recorded about 2.5 billion domestic tourist visits in 2023, far more than foreign tourist arrivals.
Reasons for its local resource potential: (i) India's diversity of landscapes, from the Himalaya and deserts to beaches, forests and islands, within one country; (ii) a dense network of pilgrimage centres and festivals rooted in local culture; (iii) rising incomes, a growing middle class and paid holidays; (iv) better connectivity through highways, Vande Bharat trains and UDAN regional flights; (v) local resources such as crafts, cuisine and homestays that need little capital.
Dimensions: (i) religious tourism: Varanasi, Tirupati, the Char Dham and the Kumbh Mela at Prayagraj (2025); (ii) heritage and cultural tourism: Rajasthan's forts, Hampi and Khajuraho; (iii) nature and wildlife tourism: hill stations, national parks and beaches; (iv) rural and community tourism: homestays in Uttarakhand, Kerala and the north-east; (v) health and wellness: Ayurveda in Kerala and yoga at Rishikesh; (vi) adventure tourism: trekking, rafting and skiing in the Himalaya.
Benefits and concerns: it creates local jobs and markets for crafts and food, but overcrowding and waste, as in Shimla and the Char Dham, strain fragile areas.
Policy support: Dekho Apna Desh (2020), Swadesh Darshan 2.0 and PRASHAD.
Map: Map of India marking major domestic circuits: the Buddhist circuit, Char Dham, the Golden Triangle, Kerala backwaters, Goa beaches and north-eastern ecotourism sites.
With carrying-capacity planning, domestic tourism can spread prosperity widely.
Example 26 (UPSC 2022, 20 marks): Discuss the salient characteristics of industrial complexes of Western India. Examine the impact of SEZ policy on the region.
Paper and question: Paper II, Q7(a)
Approach: Describe the industrial complexes of western India and their salient characteristics, then examine the impact of the SEZ policy on the region (investment, exports, employment, land, environment), with a balanced conclusion. Draw a map of western industrial complexes and SEZs.
Western India, comprising Maharashtra, Gujarat and Goa, is the country's most industrialised region, with large industrial complexes in which refineries, petrochemicals, chemicals, engineering and pharmaceuticals are closely linked.
Major complexes: (i) the Mumbai–Thane–Pune complex of engineering, automobiles, pharmaceuticals, finance and IT; (ii) Gujarat's 'Golden Corridor' from Ahmedabad through Vadodara, Bharuch–Ankleshwar and Surat to Vapi, with textiles, chemicals, petrochemicals, fertilisers and pharmaceuticals; (iii) the Jamnagar refinery complex of Reliance, among the world's largest refining sites; (iv) Hazira and Dahej, with steel, LNG terminals and the petroleum, chemicals and petrochemicals investment region (PCPIR); (v) port-led clusters at Kandla and Mundra.
Salient characteristics: (i) strong backward and forward linkages based on petroleum feedstock; (ii) a port-led location along the coast; (iii) large-scale capital-intensive plants alongside dense MSME networks; (iv) entrepreneurial and financial capital in Mumbai and Gujarat; (v) supportive state agencies such as GIDC and MIDC; (vi) high environmental pressure.
Impact of SEZ policy: following the SEZ Act (2005), western India received a large share of approved SEZs, including Kandla (India's first export processing zone, 1965), SEEPZ in Mumbai, Mundra (a multi-product port-based SEZ), Dahej and GIFT City (an International Financial Services Centre). Positive effects: new investment, export growth in engineering, gems and jewellery, chemicals and IT, port development and employment. Negative effects: land acquisition conflicts, as when large proposed SEZs in Raigad (Maharashtra) were abandoned after farmer opposition; many notified SEZs remained unused; tax exemptions caused revenue losses; enclave-type development had weak local linkages; and coastal ecosystems and mangroves near Mundra and Hazira were damaged.
Map: Map of western India marking the Mumbai–Pune complex, the Golden Corridor, Jamnagar, Hazira, Dahej, Kandla, Mundra, SEEPZ and GIFT City.
SEZs have reinforced western India's industrial lead, but greater regional spread and environmental safeguards are needed.
Example 27 (UPSC 2021, 15 marks): Examine the significance of ecotourism in relation to socio-economic development and biodiversity conservation in India.
Paper and question: Paper II, Q3(c)
Approach: Define ecotourism (with its principles), then examine its significance for socio-economic development and for biodiversity conservation with Indian examples, and note the risks. Draw a map of ecotourism sites.
Ecotourism is responsible travel to natural areas that conserves the environment, sustains the well-being of local people and involves interpretation and education (as defined by The International Ecotourism Society). India's protected areas, hills, coasts and tribal cultures give it great scope.
Socio-economic significance: (i) livelihoods: jobs for local guides, drivers, homestay owners and craftspeople, as in Periyar's eco-development committees and Sikkim's homestays; (ii) income diversification for remote villages with few alternatives; (iii) infrastructure: roads, communication and services follow tourism; (iv) women's empowerment through homestays and crafts; (v) cultural pride in local traditions and cuisine.
Conservation significance: (i) tourism revenue funds protected-area management and anti-poaching; (ii) local communities gain a stake in protecting wildlife, as at Periyar, where former poachers became guides; (iii) community conservation, such as Khonoma in Nagaland and Mangalajodi in Odisha, where bird hunters became bird guides; (iv) awareness among visitors builds public support for conservation.
Risks: mass tourism disguised as ecotourism can cause habitat disturbance, waste and resort construction near tiger reserves; the Supreme Court has restricted tourism in the core zones of tiger reserves.
Map: Map of India marking ecotourism sites: Periyar, Sikkim, Khonoma, Mangalajodi, Hemis (snow leopard homestays), Sundarbans and Kaziranga.
Community-based, carrying-capacity-bound ecotourism can align development with conservation.
Example 28 (UPSC 2020, 15 marks): What are the characteristics of Blue Flag certified beaches? Discuss their significance for beach tourism in India.
Paper and question: Paper II, Q7(b)
Approach: Explain the Blue Flag certification and its criteria, name India's certified beaches, then discuss their significance for beach tourism and coastal management, with limitations. Draw a map of Blue Flag beaches.
The Blue Flag is an international eco-label awarded by the Foundation for Environmental Education (Denmark) to beaches, marinas and boats that meet strict standards; it must be renewed every year.
Characteristics (criteria): about 33 criteria in four groups: (i) environmental education and information; (ii) bathing water quality, meeting microbiological standards and regular testing; (iii) environmental management, including waste segregation, no untreated sewage discharge, and clean, plastic-free sands; (iv) safety and services, such as lifeguards, first aid, clean toilets and access for disabled persons.
India's Blue Flag beaches: eight beaches were certified in 2020: Shivrajpur (Gujarat), Ghoghla (Diu), Kasarkod and Padubidri (Karnataka), Kappad (Kerala), Rushikonda (Andhra Pradesh), Golden Beach (Puri, Odisha) and Radhanagar (Andaman). Kovalam (Tamil Nadu) and Eden (Puducherry) followed in 2021, and Minicoy Thundi and Kadmat (Lakshadweep) in 2023, making twelve.
Significance for beach tourism: (i) international recognition attracts domestic and foreign tourists and premium spending; (ii) a model of clean, safe and accessible beaches that other beaches can copy; (iii) jobs for local communities in services and beach management; (iv) better waste management and pollution control that protect coastal ecosystems and turtle nesting.
Limitations: a small number of beaches out of thousands, high maintenance costs, the need for annual renewal and the risk of excluding traditional fishers.
Map: Map of India's coasts marking the twelve Blue Flag beaches.
Scaling up Blue Flag standards can make India's beaches cleaner, safer and more competitive.
Example 29 (UPSC 2019, 15 marks): Explain the relevance of green tourism for sustainable development of mountain environment in India.
Paper and question: Paper II, Q6(c)
Approach: Define green tourism, explain why mountain environments are fragile and how conventional tourism harms them, then show the relevance of green tourism for sustainable mountain development with Indian examples. Draw a map of Himalayan green tourism initiatives.
Green tourism is tourism that minimises environmental impact (low energy, low waste, local materials) and maximises local benefit. It is especially relevant to India's mountains, which are ecologically fragile, seismically active and home to communities with few livelihood options.
Why it is needed: conventional mass tourism has overloaded hill stations and pilgrim routes. Shimla, Manali, Nainital and Mussoorie face water shortages, traffic and garbage, and unplanned construction contributed to land subsidence at Joshimath (2023). Waste piles up on trekking routes and around Himalayan lakes.
Relevance for sustainable development: (i) carrying capacity: regulating visitor numbers, as with permits for Rohtang Pass and limits on the Char Dham yatra; (ii) eco-friendly infrastructure: green buildings, solar energy and electric vehicles; (iii) waste management: 'leave no trace' trekking, plastic bans (Sikkim) and waste collection on peaks; (iv) community homestays in Ladakh (Hemis snow leopard homestays), Uttarakhand and Sikkim that spread income to villages; (v) conservation: revenue and awareness support forests and wildlife; (vi) climate resilience: keeping construction away from unstable slopes and river banks.
Challenges: weak enforcement, pressure from road and hotel construction, and seasonal crowding.
Map: Map of the Indian Himalaya marking crowded hill stations (Shimla, Manali, Nainital), Joshimath, and green tourism models in Sikkim, Ladakh and Uttarakhand.
Green tourism offers mountain regions a way to earn from tourism without destroying the environment that attracts it.
Example 30 (UPSC 2018, 15 marks): Assess the suitability of Special Economic Zones (SEZs) for the sustainable economic development in India.
Paper and question: Paper II, Q2(c)
Approach: Explain the objectives of SEZs, then assess their suitability for sustainable development on economic, social, environmental and regional criteria with evidence, ending with a judgement. Draw a map of SEZ distribution.
Special Economic Zones (SEZs), set up under the SEZ Act (2005) after earlier export processing zones such as Kandla (1965), are enclaves with simpler rules, tax incentives and better infrastructure meant to boost exports, investment and jobs. More than 250 SEZs are operational.
Economic suitability: SEZs have attracted investment and contributed a substantial share of India's exports, especially in IT and IT-enabled services (Bengaluru, Hyderabad, Pune, Chennai), gems and jewellery (SEEPZ, Mumbai), engineering and pharmaceuticals. However, many notified SEZs remained unused, tax exemptions cost revenue, and units often relocated from domestic areas rather than adding new activity.
Social suitability: they created formal jobs, but land acquisition from farmers caused protests and the abandonment of large SEZs, as in Raigad (Maharashtra) and Goa; labour-law relaxations raised concerns about workers' rights.
Environmental suitability: port-based and chemical SEZs such as Mundra and Dahej have damaged mangroves and coastal ecosystems, and few SEZs follow green-industry standards.
Regional suitability: SEZs are concentrated in Maharashtra, Tamil Nadu, Telangana, Karnataka, Gujarat and Andhra Pradesh, which widens regional disparities.
Judgement: SEZs are suitable as export platforms but not yet as instruments of sustainable development. Reforms such as the proposed DESH legislation to convert them into broader development hubs, the use of degraded land, green standards and links with local MSMEs are needed.
Map: Map of India showing the concentration of operational SEZs, with major ones marked: SEEPZ, Kandla, Mundra, GIFT City, Dahej, Visakhapatnam and the IT SEZs of Bengaluru, Hyderabad and Chennai.
Well-located, green and inclusive SEZs can support sustainable growth.
Example 31 (UPSC 2018, 15 marks): Give a critical account of region specific constraints of sustainable tourism in India.
Paper and question: Paper II, Q4(c)
Approach: Define sustainable tourism, then give a critical, region-by-region account of the constraints (Himalaya, coasts and islands, deserts, north-east, heritage cities, forests), ending with solutions. Draw a map of regional constraints.
Sustainable tourism meets the needs of present tourists and host communities while protecting resources for the future (UNWTO). In India its constraints differ sharply from region to region.
Himalaya: fragile, seismic slopes, landslides and floods (Kedarnath 2013, Joshimath 2023), with overcrowded hill stations and pilgrim routes, water scarcity, waste, traffic jams on routes such as Manali–Rohtang, and unregulated construction.
Coasts and islands: CRZ restrictions, cyclones, sea-level rise, beach erosion, coral bleaching and fresh water shortages in Lakshadweep and the Andamans; Goa faces overcrowding and waste.
Thar desert: water scarcity, extreme heat and a short tourist season, with pressure on fragile dunes and heritage towns such as Jaisalmer.
North-east: poor connectivity, permit requirements in some areas, insurgency in parts, and limited infrastructure and waste handling, despite rich natural and cultural assets.
Heritage cities: congestion, encroachment and pollution damage monuments, as with the Taj Mahal and Varanasi's ghats.
Forests and wildlife areas: conflicts between tourism and conservation, with resorts crowding the edges of tiger reserves.
Map: Map of India marking region-specific constraints in the Himalaya, coasts and islands, the Thar, the north-east, heritage cities and tiger reserves.
Region-specific carrying-capacity limits, community participation and green infrastructure are needed to overcome these constraints.
Example 32 (UPSC 2017, 15 marks): How may tourism in hilly areas of India be developed as an important source of economy?
Paper and question: Paper II, Q3(c)
Approach: Show the tourism assets of India's hilly areas, then explain how tourism can become an important economic source (forms of tourism, linkages, jobs), with strategies and safeguards. Draw a map of hill tourism destinations.
India's hilly areas, including the Himalaya, the north-eastern hills, the Western Ghats and the Nilgiris, have scenic landscapes, a cool climate, snow, forests, wildlife, pilgrimage sites and distinct cultures, but limited farmland and industry. Tourism is therefore one of their best economic options.
Forms of tourism to develop: (i) leisure and hill-station tourism (Shimla, Darjeeling, Ooty, Munnar); (ii) pilgrimage tourism (Char Dham, Vaishno Devi, Amarnath, Hemkund Sahib); (iii) adventure tourism: trekking, mountaineering, river rafting at Rishikesh, paragliding at Bir Billing and skiing at Gulmarg and Auli; (iv) ecotourism and wildlife tourism (Corbett, Kaziranga, the Valley of Flowers); (v) cultural and rural tourism through homestays, festivals such as Hornbill (Nagaland) and crafts; (vi) wellness tourism: yoga and Ayurveda.
How it supports the economy: direct jobs in hotels, transport and guiding; demand for local produce (apples, tea, handicrafts); income for women and youth, reducing outmigration from the hills of Uttarakhand; and revenue for local bodies.
Strategies: better all-weather roads, ropeways and air links (UDAN); homestay schemes; skill training for guides; branding of lesser-known destinations to spread visitors; and year-round circuits.
Safeguards: carrying-capacity limits, waste management, building codes on unstable slopes and protection of forests and water sources.
Map: Map of India marking hill tourism destinations: Gulmarg, Shimla, Manali, Rishikesh, Auli, Darjeeling, Gangtok, Shillong, Munnar and Ooty.
Planned, community-based and green hill tourism can make tourism a sustainable economic base for India's mountains.
Example 33 (UPSC 2014, 10 marks): Explain how eco-tourism activities could be important livelihood options in the Himalayan and North-Eastern regions of the country.
Paper and question: Paper II, Q1(b)
Approach: Show why the Himalayan and north-eastern regions suit ecotourism and how it creates livelihoods, with named community examples, and note safeguards. Draw a map of ecotourism livelihood sites.
The Himalayan and north-eastern regions have rich biodiversity, mountain landscapes and living tribal cultures, but limited farmland, few industries and high outmigration. Ecotourism can turn these natural and cultural assets into livelihoods without heavy capital or ecological damage.
Livelihood options: (i) homestays, which bring income directly to households, as in Ladakh's snow leopard homestays around Hemis, Uttarakhand's homestay scheme and Sikkim's villages; (ii) guiding and porterage for trekking, birding and wildlife viewing; (iii) sale of local produce and crafts, such as organic food, weaving and bamboo products; (iv) community-managed sites: Khonoma (Nagaland), Mawlynnong, often called the cleanest village (Meghalaya), the living root bridges and Ziro (Arunachal Pradesh); (v) cultural tourism around festivals such as Hornbill and Losar.
Benefits: income for women and youth, reduced dependence on hunting and logging, and an incentive for conservation.
Map: Map marking Hemis, Uttarakhand homestay areas, Sikkim, Khonoma, Mawlynnong, the root bridges and Ziro.
With connectivity, training and carrying-capacity rules, ecotourism can sustain both people and ecosystems.
Mains points
- Industry location answers should combine theory (Weber's raw material and market orientation, agglomeration, footloose industries, Isard's industrial complex) with named Indian clusters and a location map.
- Pharmaceuticals, automobiles, steel, textiles, sugar, jute and fertilisers recur: know their clusters, the reasons for concentration or shift, and current problems such as API imports or obsolete mills.
- Policy questions expect the sequence 1948, 1956, 1991, Make in India (2014), PLI (2020) and the National Logistics Policy (2022), with a critical view of outcomes and regional imbalance.
- SEZ and tourism questions reward balanced evaluation (exports and jobs versus land conflicts, enclaves and ecological costs) and named examples (Kandla, Mundra, GIFT City, Blue Flag beaches, Himalayan homestays).
- Always draw a map: industrial regions and corridors, auto and pharma clusters, sugar and cotton belts, SEZs and tourist circuits.
Did you know?
- India's first export processing zone, at Kandla in Gujarat (1965), was also one of the first in Asia, decades before the SEZ Act of 2005.
Geography Optional: All chapters
- Exam Pattern, Syllabus and Strategy
- The Earth's Interior and Tectonics
- Geomorphic Processes and Landscape Development
- Climatology: Atmosphere and Circulation
- Climatology: Weather Systems, Climates and Climate Change
- Oceanography
- Biogeography
- Environmental Geography
- Perspectives in Human Geography
- Economic Geography
- Population Geography
- Settlement Geography
- Regional Planning
- Models, Theories and Laws in Human Geography
- India: Physical Setting I
- India: Physical Setting II
- Resources of India
- Agriculture in India
- Industry in India
- Transport, Communication and Trade
- Cultural Setting and Population of India
- Settlements in India
- Regional Development and Planning in India
- Political Aspects
- Contemporary Issues
- Places for the Map Question