
Geography Optional · UPSC Notes
Resources of India — UPSC Geography Optional Notes
Free, exam-focused notes for UPSC Prelims and Mains, with Prelims tips and Mains points for every topic. 5 topics.
Open in the interactive reader: bookmarks, progress tracking and read-aloud.
Land, Surface Water and Groundwater Resources
India has about 2.4% of the world's land but supports about 18% of its people, so land and water are under intense pressure. Net sown area is about 140 million hectares (Land Use Statistics, 2022–23), and the Central Water Commission's 2019 reassessment puts average annual water resources at about 1,999 billion cubic metres, of which about 1,122 bcm is utilisable. The Dynamic Ground Water Resources Assessment 2025 reports annual extraction of 247.22 bcm against a recharge of 448.52 bcm (stage of extraction 60.63%), but with severe over-exploitation in Punjab, Haryana, Rajasthan and parts of the south.
In simple words
Land and water are like a family's savings account: we can use the interest (yearly rain and recharge) but should not spend the capital.
India uses rivers and reservoirs (surface water) and wells and tube wells (groundwater).
In many places we pump out groundwater faster than rain refills it, so water tables fall.
UPSC asks how land is used, how much water India has, why it is stressed and how to manage it sustainably.
1. Concepts and Definitions
Land resource: land as a factor of production and a base for settlement, forests and ecosystems; India's geographical area is about 328.7 million hectares, of which about 305–307 Mha is 'reporting area' for land use statistics.
Nine-fold land use classification (Directorate of Economics and Statistics, Ministry of Agriculture): forests; area under non-agricultural uses; barren and unculturable land; permanent pastures and grazing land; land under miscellaneous tree crops; culturable waste land; current fallow; fallow other than current fallow; net sown area.
Net sown area (NSA): area sown at least once in a year; gross cropped area (GCA): total area sown counting each crop season separately; cropping intensity = GCA ÷ NSA × 100.
Water resources potential: the average annual natural flow in rivers; utilisable water is what can be harnessed given topography and storage limits.
Groundwater terms: aquifer (water-bearing formation), water table, recharge, extractable resource, stage of groundwater extraction = annual extraction ÷ annual extractable resource × 100; blocks are 'safe' (up to 70%), 'semi-critical' (70–90%), 'critical' (90–100%) and 'over-exploited' (above 100%).
Water stress (Malin Falkenmark, 1989): per capita renewable water below 1,700 m³ per year indicates stress and below 1,000 m³ scarcity.
2. Land Resources and Land Use
Land use 2022–23 (Land Use Statistics, DES): net sown area about 140.7 Mha (roughly 46% of reporting area); gross cropped area about 219.4 Mha, giving a cropping intensity of about 156%; forests about 23% of reporting area as recorded in land records.
Trends: area under non-agricultural uses (urban, roads, industry) is rising; culturable waste and permanent pastures are shrinking; net sown area has been nearly stable at about 140 Mha for decades, so output growth must come from intensity and yield.
Regional pattern: NSA is above 80% of reporting area in Punjab and Haryana, but low in the hill and North-Eastern states where forests dominate.
Wastelands: the Wastelands Atlas of India (Department of Land Resources and NRSC, 2019 edition) mapped about 55.8 Mha (about 17% of geographical area) as wasteland in 2015–16; reclamation through watershed programmes and afforestation.
Land degradation: about 97.85 Mha (29.7%) affected in 2018–19 (ISRO SAC atlas, 2021); India targets restoration of 26 Mha by 2030.
3. Surface Water Resources
Endowment: average annual precipitation of about 4,000 bcm (including snowfall); water resources potential about 1,999 bcm (CWC, Reassessment of Water Availability in India using Space Inputs, 2019); utilisable surface water about 690 bcm and replenishable groundwater about 432 bcm (often quoted together as 1,122 bcm).
Uneven distribution: the Ganga–Brahmaputra–Meghna system holds about 60% of the water resources potential; the Brahmaputra basin alone has very high per capita availability while the Sabarmati, Pennar and east-flowing rivers between Pennar and Kanyakumari are water-short.
Temporal concentration: about 75% of runoff occurs in the four monsoon months, which makes storage essential.
Storage: large dams such as Bhakra (Sutlej), Tehri (Bhagirathi, the highest dam in India), Hirakud (Mahanadi, a long earthen dam), Nagarjuna Sagar (Krishna), Sardar Sarovar (Narmada) and Indira Sagar (Narmada, the largest reservoir by capacity); India's per capita storage remains far below that of China or the USA.
Per capita availability: Ministry of Jal Shakti estimates show average annual per capita availability falling from about 1,816 m³ in 2001 to about 1,486 m³ in 2021 and a projected about 1,367 m³ in 2031, below the stress threshold.
Irrigation infrastructure: major and medium canal systems (Bhakra–Nangal, Indira Gandhi Canal, Sardar Sarovar canals, Nagarjuna Sagar), tanks in Tamil Nadu, Telangana and Karnataka, and wells; net irrigated area was about 79.3 Mha in 2022–23 (Land Use Statistics), a little over half of net sown area.
4. Groundwater Resources
National picture (DGWRA 2025, CGWB with states): total annual recharge 448.52 bcm; extractable resource 407.75 bcm; annual extraction 247.22 bcm; stage of extraction 60.63%; 6,762 assessment units, with the share of over-exploited units at about 10.8% (down from 17.2% in 2017) and safe units at about 73%.
Use: irrigation accounts for close to 87% of annual groundwater extraction; groundwater supplies most rural drinking water and over 60% of irrigated area.
Hotspots: Punjab, Haryana, Rajasthan and Delhi have a stage of extraction above 100%; Tamil Nadu, Karnataka, Telangana and parts of Gujarat and Uttar Pradesh have many critical blocks; hard-rock aquifers of the Peninsula store little water.
Quality: arsenic in the Ganga–Brahmaputra alluvium (West Bengal, Bihar, Assam, eastern Uttar Pradesh), fluoride in Rajasthan, Telangana and Andhra Pradesh, nitrate from fertilisers, salinity in coastal and arid aquifers, and uranium reported in parts of Punjab.
Policies: Atal Bhujal Yojana (2019, community groundwater management in seven states), National Aquifer Mapping and Management Programme (NAQUIM), Model Groundwater Bill, Jal Shakti Abhiyan 'Catch the Rain', Mission Amrit Sarovar (2022, at least 75 ponds per district) and Jal Jeevan Mission (2019, tap water to rural households).
5. Theory and Debates
Tragedy of the commons (Garrett Hardin, 1968): groundwater is a common pool resource; free or flat-rate electricity encourages over-pumping; Elinor Ostrom's work (Governing the Commons, 1990) suggests community institutions can manage commons, which is the logic of Atal Bhujal.
Supply-side vs demand-side management: dams and interlinking (supply) vs drip and sprinkler irrigation, crop diversification away from paddy and sugarcane, water pricing and recycling (demand); the Mihir Shah Committee (2016) recommended restructuring CWC and CGWB into a National Water Commission, still debated.
Virtual water: concept by J.A. Allan (1990s); India effectively exports water through rice and sugar exports from water-scarce regions.
Water as a state subject: water is in the State List (Entry 17) with inter-state rivers under the Union List (Entry 56), which complicates basin-level planning.
Urban water debate: cities such as Chennai (2019 'Day Zero' crisis) and Bengaluru (2024 shortage) show that loss of lakes and wetlands, unplanned growth and over-reliance on borewells convert rainfall variability into urban water crises.
6. Maps and Diagrams to Draw
Land use pie or bar chart: show the nine-fold classification shares for the latest year.
River basin water availability map: shade basins by per capita availability, marking the Brahmaputra (surplus) and Sabarmati, Pennar and east-flowing southern rivers (deficit).
Groundwater stage map: colour states by stage of extraction (above 100% in Punjab, Haryana, Rajasthan, Delhi) and mark arsenic and fluoride belts.
Aquifer sketch: cross-section showing an unconfined alluvial aquifer, a confined aquifer, the water table and a cone of depression around a tube well.
Hydrological cycle diagram adapted to India: monsoon rain → runoff to rivers and reservoirs → infiltration and recharge → extraction for irrigation → evapotranspiration.
7. Using It in the Exam
10 marks: define land use categories and give latest NSA, GCA and cropping intensity with source.
15 marks: surface water distribution across basins with a map and storage issues.
20 marks: groundwater: assessment data (2025), regional over-exploitation, quality, causes (power subsidies, paddy), solutions (Atal Bhujal, micro-irrigation, recharge), theory (commons).
Keywords: net sown area, cropping intensity, utilisable water, stage of extraction, over-exploited blocks, aquifer mapping, demand-side management.
Attributed idea: Falkenmark's thresholds (1,700 and 1,000 m³ per person per year) are the standard measure of water stress and scarcity.
Always quote the year and source for every water figure; numbers change with each assessment.
| Indicator | Value | Year | Source |
|---|---|---|---|
| Net sown area | About 140.7 million ha | 2022–23 | Land Use Statistics, DES |
| Gross cropped area | About 219.4 million ha | 2022–23 | Land Use Statistics, DES |
| Net irrigated area | About 79.3 million ha | 2022–23 | Land Use Statistics, DES |
| Average annual water resources | About 1,999 bcm | 2019 reassessment | Central Water Commission |
| Annual groundwater recharge | 448.52 bcm | 2025 | DGWRA 2025, CGWB |
| Annual groundwater extraction | 247.22 bcm (stage 60.63%) | 2025 | DGWRA 2025, CGWB |
| Land under degradation | 97.85 million ha (29.7%) | 2018–19 | ISRO SAC Atlas 2021 |
Mains points
- Typical questions: land use changes, water stress, groundwater depletion in north-west India, interlinking or watershed approaches.
- Quote the latest assessments with year: Land Use Statistics 2022–23, CWC 2019, DGWRA 2025; examiners value current data.
- Explain regional contrasts with a map (Brahmaputra surplus vs southern deficit; Punjab–Haryana groundwater crisis).
- Discuss causes in a structured way: physical (monsoon concentration, hard rocks) and human (free power, paddy–wheat, urban demand).
- Use theory: tragedy of the commons and Ostrom's community management; Falkenmark indicator for stress.
- Avoid only listing schemes; evaluate them (e.g. Atal Bhujal's community budgeting, Jal Jeevan Mission's source sustainability).
Did you know?
- India is the world's largest user of groundwater, extracting more each year than the USA and China combined (often cited from World Bank and UNESCO water reports).
Mineral Resources
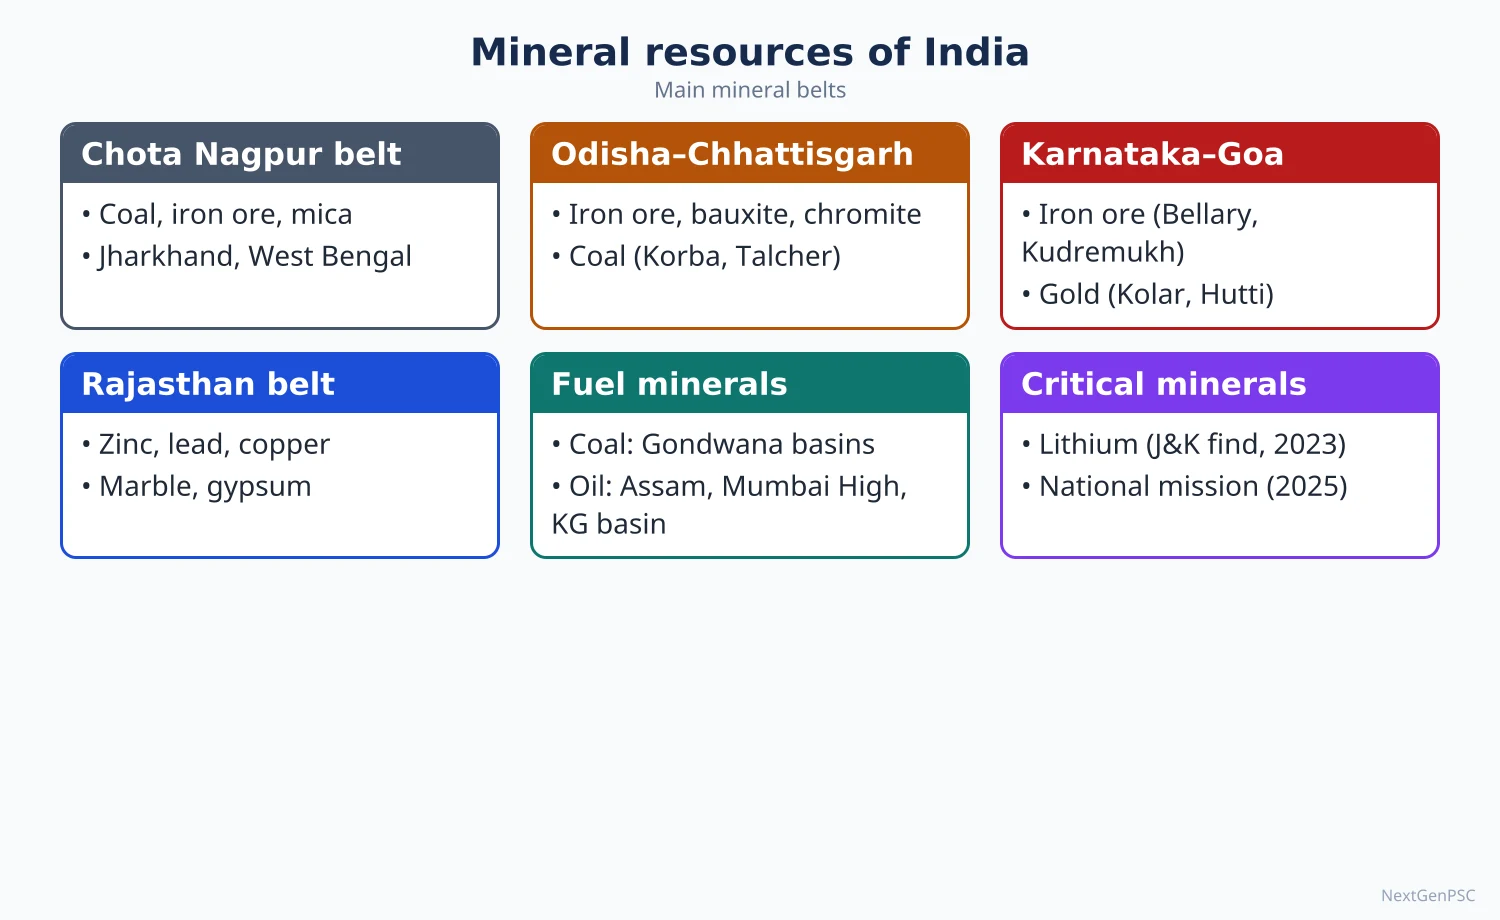
India's minerals are concentrated in the ancient Peninsular rocks: the Chota Nagpur–Odisha belt, the Karnataka–Goa belt and the Aravalli belt in Rajasthan, while coal lies in Gondwana basins and petroleum in Tertiary sedimentary basins. Odisha, Jharkhand, Chhattisgarh, Karnataka and Rajasthan lead in production. Policy now focuses on auction-based allocation (MMDR Amendment 2015), the list of 30 critical minerals (2023) and the National Critical Mineral Mission (January 2025) for lithium, cobalt and rare earths needed for the energy transition.
In simple words
Minerals are the hidden treasure in rocks: iron for steel, bauxite for aluminium, copper for wires, coal for power.
In India most of this treasure lies in the old rocks of the east and south, like a buried chest in Jharkhand, Odisha and Karnataka.
Newer critical minerals such as lithium are needed for phone and car batteries.
UPSC asks where minerals are found, why they are found there, and how to mine them without harming forests and tribal people.
1. Concepts and Definitions
Mineral: a naturally occurring inorganic substance with a definite chemical composition and crystal structure; an ore is a mineral aggregate from which a metal can be extracted profitably.
Classification: metallic ferrous (iron ore, manganese, chromite), metallic non-ferrous (bauxite, copper, lead, zinc, gold), non-metallic (limestone, mica, gypsum, dolomite), mineral fuels (coal, lignite, petroleum, natural gas) and atomic minerals (uranium, thorium).
Reserves vs resources: the United Nations Framework Classification (UNFC), adopted by the Indian Bureau of Mines, separates proved and probable reserves (economically mineable) from remaining resources; exploration stages run from G4 (reconnaissance) to G1 (detailed).
Resource concept: Erich Zimmermann (World Resources and Industries, 1933) argued that 'resources are not, they become': a material becomes a resource only when technology and demand make it useful.
Critical minerals: minerals essential for economic development and national security whose supply is concentrated or at risk; the Ministry of Mines notified a list of 30 critical minerals in June 2023 (including lithium, cobalt, nickel, graphite, rare earth elements, tungsten, vanadium).
2. Mineral Belts of India
North-Eastern Peninsular belt (Chota Nagpur–Odisha): Jharkhand, Odisha, Chhattisgarh, West Bengal; iron ore, manganese, bauxite, coal, mica, copper, chromite, uranium; the mineral heartland of India.
Central belt: Chhattisgarh, Madhya Pradesh, eastern Maharashtra; iron ore (Bailadila), manganese (Balaghat), coal (Korba, Singrauli), copper (Malanjkhand), diamonds (Panna), limestone.
South-Western belt (Karnataka–Goa): iron ore (Bellary–Hospet, Goa), manganese, gold (Hutti), bauxite on laterite caps.
North-Western belt (Aravalli, Rajasthan–Gujarat): zinc and lead (Rampura Agucha, Zawar), copper (Khetri), gypsum, marble (Makrana), petroleum and lignite (Barmer, Gujarat).
Himalayan and coastal belts: the Himalaya has small, scattered deposits because of complex geology; coastal placers in Kerala, Tamil Nadu and Odisha supply ilmenite, rutile, zircon and monazite.
3. Major Minerals and Their Distribution
Iron ore: high-grade haematite and magnetite; Odisha is the largest producer (Keonjhar, Sundargarh, Mayurbhanj), followed by Chhattisgarh (Bailadila, Dalli–Rajhara), Karnataka (Bellary–Hospet, Sandur) and Jharkhand (Noamundi, Gua, Kiriburu); Goa's mines export through Mormugao; India is among the top five iron ore producers.
Manganese: used in steel making; Odisha, Madhya Pradesh (Balaghat), Maharashtra (Nagpur–Bhandara) and Karnataka.
Bauxite: found in laterite caps; Odisha (Panchpatmali in Koraput, the NALCO mine) is the largest producer, followed by Jharkhand, Gujarat, Chhattisgarh (Mainpat), Maharashtra and Madhya Pradesh (Amarkantak plateau).
Copper: Madhya Pradesh (Malanjkhand, the largest open-cast copper mine), Rajasthan (Khetri–Singhana) and Jharkhand (Singhbhum); India depends heavily on imported copper concentrate.
Lead–zinc: Rajasthan accounts for almost all production (Rampura Agucha, Sindesar Khurd, Zawar; Hindustan Zinc).
Gold: Hutti (Karnataka) is the main working mine; Kolar Gold Fields closed in 2001.
Mica: Jharkhand (Koderma–Giridih), Andhra Pradesh (Nellore), Rajasthan; India was once the leading world producer of sheet mica.
Limestone and dolomite: widespread in Vindhyan, Cuddapah and other sedimentary rocks; Rajasthan, Madhya Pradesh, Andhra Pradesh, Telangana, Chhattisgarh, Karnataka; base of the cement industry.
Atomic minerals: uranium at Jaduguda and Turamdih (Jharkhand) and Tummalapalle (Andhra Pradesh); thorium-bearing monazite in beach sands of Kerala (Chavara), Tamil Nadu and Odisha (Chhatrapur); India has among the largest thorium resources, the basis of the three-stage nuclear programme.
Lithium: the Geological Survey of India reported inferred resources of about 5.9 million tonnes at Salal–Haimana in Reasi district, Jammu and Kashmir (February 2023), at an early (G3) exploration stage.
4. Policy and Recent Developments
Legal framework: Mines and Minerals (Development and Regulation) Act 1957; MMDR Amendment 2015 introduced auctions, the District Mineral Foundation (DMF) for mining-affected areas and the National Mineral Exploration Trust; further amendments in 2021 (removing the captive/merchant distinction) and 2023 (critical minerals, exploration licence).
National Mineral Policy 2019: emphasises exploration, private participation, sustainable mining and inter-generational equity.
National Critical Mineral Mission (approved January 2025): outlay of about ₹16,300 crore with about ₹18,000 crore expected from public sector undertakings, covering exploration, auctions, processing, recycling and overseas acquisition; KABIL (Khanij Bidesh India Ltd, 2019) acquires overseas assets such as lithium blocks in Argentina.
District Mineral Foundation and PMKKKY (2015): a share of royalty is spent on drinking water, health, education and livelihoods in mining-affected districts.
Offshore minerals: the Offshore Areas Mineral (Development and Regulation) Amendment Act 2023 opened offshore blocks (construction sand, lime mud, polymetallic nodules) to auction.
5. Theory and Debates
Resource curse (Richard Auty, 1993): mineral-rich regions often show poor development; Jharkhand, Odisha and Chhattisgarh have high mineral output but high poverty, conflict (Left-Wing Extremism) and displacement.
Hotelling's rule (1931): the price of a non-renewable resource should rise over time at the rate of interest; it frames debates on depletion and inter-generational equity.
Tribal rights: the Niyamgiri case (Supreme Court, 2013) let gram sabhas of the Dongria Kondh decide on bauxite mining under the Forest Rights Act and PESA; it is a landmark for consent-based mining.
Illegal mining: Bellary (Lokayukta report 2011) and Goa (Shah Commission, 2012) led to Supreme Court bans and caps, showing governance failures.
Value addition vs export: debate over exporting iron ore versus using it for domestic steel; export duties have been used to conserve high-grade ore.
6. Maps and Diagrams to Draw
Mineral belts map: outline India and shade the north-eastern, central, south-western and north-western belts; mark Bailadila, Noamundi, Bellary, Panchpatmali, Malanjkhand, Khetri, Rampura Agucha, Hutti, Jaduguda and Reasi.
Iron ore and bauxite map: symbols for mines and arrows to steel and aluminium plants (Rourkela, Bhilai, Jamshedpur; Angul, Renukoot, Korba).
Coal and oil map: Gondwana coalfields along the Damodar, Mahanadi and Godavari; oilfields at Mumbai High, Ankleshwar, Digboi, Barmer and the KG basin.
Flow chart: exploration (G4 → G1) → auction → mining → beneficiation → processing → use, with DMF funds flowing back to local communities.
7. Using It in the Exam
10 marks: distribution of one mineral with a map and production-ranking states.
15 marks: mineral belts and their geological basis (Dharwar, Gondwana, laterite), with a map.
20 marks: critical minerals and India's strategy (2023 list, NCMM 2025, KABIL, lithium), or mining and development (resource curse, tribal rights, DMF), with a map.
Keywords: mineral belts, Dharwar and Gondwana, laterite bauxite, UNFC, auction regime, DMF, critical minerals, resource curse.
Attributed idea: Zimmermann's view that 'resources are not, they become' captures why lithium has suddenly become strategic.
Common mistake: placing bauxite in alluvial areas or copper mainly in Jharkhand; state the largest producer correctly (Odisha for iron ore and bauxite, Rajasthan for zinc–lead, Madhya Pradesh for copper).
| Mineral | Leading states | Key mines/areas | Main use |
|---|---|---|---|
| Iron ore | Odisha, Chhattisgarh, Karnataka, Jharkhand | Keonjhar, Bailadila, Bellary, Noamundi | Steel |
| Bauxite | Odisha, Jharkhand, Gujarat, Chhattisgarh | Panchpatmali, Lohardaga, Mainpat | Aluminium |
| Manganese | Odisha, Madhya Pradesh, Maharashtra | Balaghat, Nagpur–Bhandara | Steel alloys, batteries |
| Copper | Madhya Pradesh, Rajasthan, Jharkhand | Malanjkhand, Khetri, Singhbhum | Electrical wiring |
| Lead–zinc | Rajasthan | Rampura Agucha, Zawar | Galvanising, batteries |
| Uranium | Jharkhand, Andhra Pradesh | Jaduguda, Tummalapalle | Nuclear fuel |
| Lithium (resource) | Jammu and Kashmir | Salal–Haimana, Reasi (G3 stage, 2023) | Batteries |
Mains points
- Questions ask for distribution with reasons (geological basis), mineral belts, critical minerals strategy, or mining–development conflicts.
- Always link minerals to rock systems (Dharwar for iron and gold, Gondwana for coal, laterite for bauxite, Tertiary for oil).
- Draw a mineral map with named mines; answers without maps lose marks in Paper II.
- Bring current policy: 2023 critical minerals list, NCMM (January 2025), MMDR amendments, KABIL, DMF.
- Give a balanced view on mining in tribal regions using Niyamgiri (2013) and the resource curse idea.
- Avoid outdated facts such as Kolar as an active mine or Kudremukh as a working iron ore mine (closed in 2005).
Did you know?
- Memory trick for Odisha's lead in minerals: 'Odisha IBM' — Iron ore, Bauxite and Manganese, the three minerals in which Odisha is the top or near-top producer.
Energy Resources and the Energy Crisis
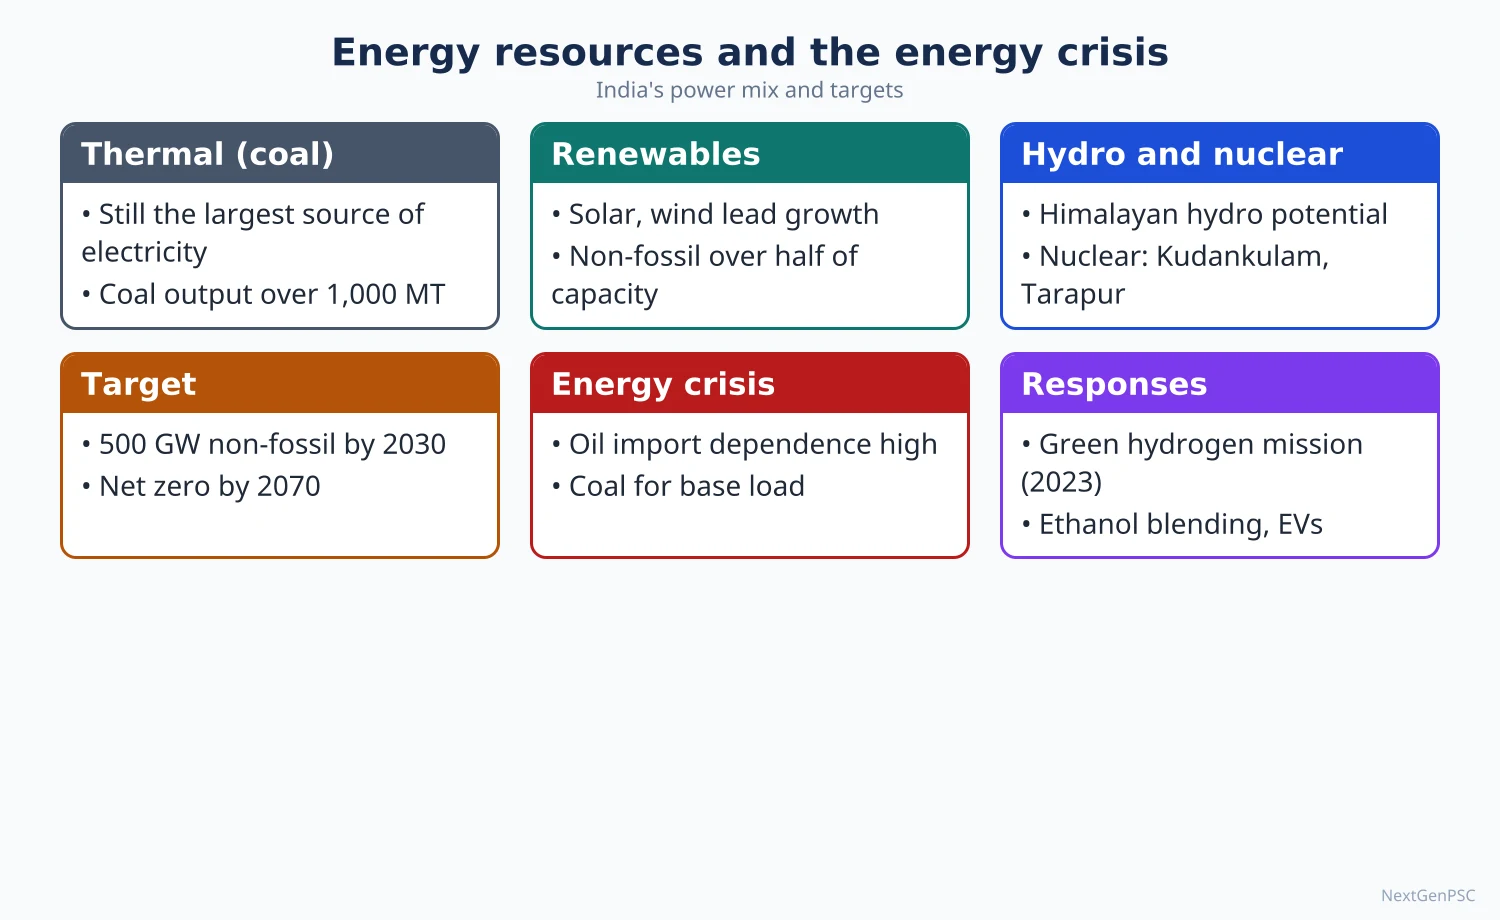
India is the world's third-largest energy consumer; coal still generates most electricity, while about 85–90% of crude oil is imported. Installed power capacity reached about 552 GW by August 2026, with non-fossil sources above 54% (300.5 GW at end-July 2026, MNRE), led by solar (164.6 GW) and wind (58.1 GW). The energy crisis in India means import dependence, peak-demand stress (a record 256 GW on 25 April 2026), energy poverty and the challenge of moving to 500 GW non-fossil capacity by 2030 and net zero by 2070.
In simple words
Energy is the fuel of development: it runs fans, factories, trains and farm pumps.
India gets most electricity from burning coal, buys most of its oil from abroad, and is now rapidly building solar and wind farms.
An energy crisis is like a household whose income cannot keep pace with its rising bills.
UPSC asks where India's energy resources are, why there is a crisis, and how the shift to clean energy can be made fair and secure.
1. Concepts and Definitions
Commercial vs non-commercial energy: commercial (coal, oil, gas, electricity) is traded; non-commercial (firewood, crop residue, dung) is still used by poorer rural households for cooking.
Conventional vs non-conventional (renewable): conventional sources are coal, petroleum, natural gas, large hydro and nuclear; renewable sources are solar, wind, small hydro, biomass, geothermal and tidal.
Primary energy mix: coal provides over half of India's primary energy supply, followed by oil, biomass, natural gas and renewables (broad shares from IEA and Economic Survey; exact numbers vary by year and source).
Energy crisis: a situation where energy supply fails to meet demand at affordable prices or reliability, due to resource shortage, import dependence, price shocks or infrastructure limits.
Energy security (IEA definition): uninterrupted availability of energy sources at an affordable price.
Energy transition: the shift from fossil fuels to low-carbon sources; India's updated NDC (2022) commits to 50% of installed capacity from non-fossil sources by 2030 (achieved in June 2025) and reducing emissions intensity of GDP by 45% from 2005 levels by 2030; the Panchamrit announced at COP26 (2021) includes 500 GW non-fossil capacity by 2030 and net zero by 2070.
2. Coal and Lignite
Distribution: Gondwana coal (about 98% of reserves) in the Damodar valley (Jharia, Raniganj, Bokaro, Giridih, Karanpura), Mahanadi valley (Talcher, Ib valley), Son valley (Singrauli), Korba and Mand–Raigarh (Chhattisgarh), Wardha valley (Maharashtra) and Godavari valley (Singareni, Telangana); Tertiary coal in Assam and Meghalaya.
Production: India produced about 1,047.5 million tonnes of coal in 2024–25 (Ministry of Coal), crossing one billion tonnes for the first time; Jharkhand, Odisha and Chhattisgarh hold most reserves; captive and commercial mines produced a record 210 MT in 2025–26.
Lignite: Neyveli (Tamil Nadu), Kutch and Bhavnagar (Gujarat), Barmer and Bikaner (Rajasthan).
Issues: high ash content, mine fires (Jharia), displacement, air pollution near thermal plants, imports of coking coal for steel and the need for a 'just transition' in coal districts.
3. Petroleum and Natural Gas
Sedimentary basins: Mumbai High (offshore, the largest producing field), Gujarat (Ankleshwar, Kalol, Cambay), Assam (Digboi, Naharkatiya, Moran), Rajasthan (Barmer–Mangala), Krishna–Godavari basin (offshore gas), Cauvery basin.
Import dependence: India imports roughly 85–90% of its crude oil (Petroleum Planning and Analysis Cell data for recent years) and about half of its natural gas as LNG; this makes India vulnerable to price shocks and West Asian instability.
Refining: India is a net exporter of petroleum products; Jamnagar (Gujarat) is one of the world's largest refining complexes; other refineries at Mathura, Panipat, Barauni, Paradip, Kochi and Numaligarh.
Gas network: Hazira–Vijaipur–Jagdishpur pipeline, One Nation One Gas Grid, LNG terminals at Dahej, Hazira, Kochi, Ennore, Dabhol and Mundra; city gas distribution is expanding.
Strategic petroleum reserves: underground caverns at Visakhapatnam, Mangaluru and Padur (5.33 million tonnes in phase I).
4. Hydro and Nuclear Power
Hydropower: the Himalaya holds most potential (Brahmaputra basin in Arunachal Pradesh, Indus and Ganga basins); major projects include Bhakra–Nangal, Tehri, Nathpa Jhakri, Koyna, Sardar Sarovar and Subansiri Lower; pumped storage plants are being promoted to balance solar and wind.
Constraints: geological fragility, seismicity, displacement, glacial lake outburst floods (Chungthang dam damaged in the October 2023 Sikkim GLOF), inter-state and international river issues.
Nuclear power: about 8.8 GW installed (July 2026, MNRE figures); plants at Tarapur, Rawatbhata, Kaiga, Kudankulam, Kakrapar, Narora, Kalpakkam; the three-stage programme (Homi Bhabha) aims to use India's large thorium resources; the Nuclear Energy Mission (Budget 2025–26) targets 100 GW by 2047 including small modular reactors.
5. Renewable Energy
Solar: about 164.6 GW installed by July 2026 (MNRE); high insolation (about 4–7 kWh per m² per day) in Rajasthan, Gujarat, Karnataka and Andhra Pradesh; major parks at Bhadla (Rajasthan), Pavagada (Karnataka), Kurnool (Andhra Pradesh), and the Khavda renewable energy park in the Rann of Kutch (Gujarat).
Wind: about 58.1 GW (July 2026); best sites in Tamil Nadu (Muppandal, Palghat gap), Gujarat, Karnataka, Maharashtra and Rajasthan; offshore wind zones identified off Gujarat and Tamil Nadu.
Schemes: PM-KUSUM (2019) for solar pumps, PM Surya Ghar Muft Bijli Yojana (February 2024, rooftop solar for one crore households), production-linked incentive for solar modules, National Green Hydrogen Mission (January 2023, 5 million tonnes per year green hydrogen capacity by 2030), Green Energy Corridors for transmission.
Pace: India added a record 55.3 GW of non-fossil capacity in 2025–26 (MNRE); a CEA study projects total capacity of about 1,121 GW by 2035–36 with about 70% non-fossil.
6. The Energy Crisis
Dimensions: import dependence (oil, gas, coking coal); peak-demand stress (all-time high of 256.1 GW met on 25 April 2026, Ministry of Power); the April 2022 coal stock shortage at power plants; discom financial losses; energy poverty (clean cooking still incomplete despite Ujjwala, 2016) and the intermittency of renewables.
Spatial mismatch: coal in the east, hydro in the north-east and Himalaya, solar in the west, demand in western and northern industrial and urban centres, hence the importance of the national grid ('One Nation, One Grid, One Frequency', completed 2013).
Solutions: diversification, storage (batteries, pumped hydro), grid-scale integration, energy efficiency (UJALA LED programme, 2015; Perform Achieve and Trade), electric mobility (FAME, PM E-DRIVE 2024), domestic exploration (Open Acreage Licensing Policy) and overseas assets (ONGC Videsh).
7. Theory and Debates
Resource depletion: M. King Hubbert's peak oil model (1956) predicts a bell-shaped production curve; India's domestic oil output has been stagnant or falling since the 2010s.
Energy ladder: households move from biomass to kerosene and LPG to electricity as incomes rise; critics note 'fuel stacking' in rural India where households use LPG and firewood together.
Climate justice: India argues for 'common but differentiated responsibilities' (UNFCCC, 1992) and low per capita emissions; critics urge earlier coal phase-down; the debate over coal's role until 2047 continues.
Just transition: coal districts such as Dhanbad and Korba depend on mining jobs and royalties, so the transition must plan new livelihoods.
Renewables and land: large solar parks and transmission lines can conflict with grasslands and wildlife (Great Indian Bustard habitat in Rajasthan and Gujarat; Supreme Court orders on undergrounding lines, 2021 and later modified in 2024).
8. Maps and Diagrams to Draw
Energy resources map: mark coalfields (Jharia, Raniganj, Talcher, Korba, Singrauli, Singareni), oilfields (Mumbai High, Ankleshwar, Digboi, Barmer, KG basin), nuclear plants (Tarapur, Kudankulam, Rawatbhata, Kaiga, Kakrapar, Narora, Kalpakkam) and major hydro projects.
Renewable potential map: solar belt in Rajasthan and Gujarat, wind sites in Tamil Nadu and Gujarat, Khavda, Bhadla and Pavagada parks.
Bar chart: installed capacity by source (coal, solar, wind, hydro, nuclear, gas, bio) for the latest month from CEA or MNRE.
Flow diagram: energy crisis causes (imports, demand growth, intermittency, finances) → effects (price shocks, outages) → responses (diversification, storage, efficiency).
9. Using It in the Exam
10 marks: distribution of coal or oil with a map, or a note on green hydrogen.
15 marks: India's renewable energy progress and constraints with current data and a map.
20 marks: 'energy crisis in India': causes, regional dimensions, transition strategy, just transition, debates, with a map and a capacity chart.
Keywords: energy mix, import dependence, non-fossil capacity, intermittency, storage, green hydrogen, just transition, energy poverty.
Attributed idea: the IEA defines energy security as the uninterrupted availability of energy sources at an affordable price.
| Source | Capacity | Date | Source of data |
|---|---|---|---|
| Total installed capacity | About 552 GW | August 2026 | CEA/Ministry of Power, as reported |
| Non-fossil total | 300.50 GW (over 54%) | 31 July 2026 | MNRE |
| Solar | 164.59 GW | 31 July 2026 | MNRE |
| Wind | 58.14 GW | 31 July 2026 | MNRE |
| Hydro (large and small) | About 57.2 GW | 31 July 2026 | MNRE |
| Nuclear | 8.78 GW | 31 July 2026 | MNRE |
| Peak demand met | 256.1 GW | 25 April 2026 | Ministry of Power |
Mains points
- Typical questions: 'energy crisis in India', 'prospects of renewable energy', 'distribution of coal and petroleum', 'nuclear energy and thorium'.
- Use current numbers with date and source (CEA/MNRE monthly data; Ministry of Coal annual production) and say they change quickly.
- Show spatial thinking: resource regions vs demand centres, grid integration, Khavda and Bhadla, Gondwana coalfields.
- Discuss the transition critically: intermittency, storage, land conflicts, just transition in coal districts, climate justice.
- Draw an energy resources map; add a bar chart of capacity mix if time permits.
- Common mistake: confusing installed capacity share with generation share; coal's share of generation is much higher than its share of capacity.
Did you know?
- India's non-fossil share of installed capacity crossed 50% in June 2025, five years ahead of its 2030 NDC target, yet coal still generates roughly three-quarters of electricity in many months.
Forest, Wildlife, Biotic and Marine Resources and Their Conservation
India is one of 17 megadiverse countries, with about 7–8% of the world's recorded species on 2.4% of its land, and contains parts of four global biodiversity hotspots. Forests cover 21.76% of its area (ISFR 2023), wildlife is protected in over 1,000 protected areas, 58 tiger reserves and 103 Ramsar sites (October 2026), and its 2.02 million km² Exclusive Economic Zone supports a fish output of about 197.75 lakh tonnes (2024–25, projected). Conservation in India has moved from fortress-style protection towards community participation, landscape approaches and the blue economy.
In simple words
Forests, animals, fish and coral reefs are a living bank that gives us wood, food, medicines, clean water and fresh air.
If we take out more than nature can replace, the bank goes bankrupt.
India protects this wealth through national parks, tiger reserves, wetlands and sea laws, and increasingly with the help of local communities.
UPSC asks about the distribution of these resources, the threats to them and how conservation can balance people and nature.
1. Concepts and Definitions
Biotic resources: resources obtained from the biosphere: forests, wildlife, livestock, fisheries and micro-organisms; they are renewable only if harvested within their regeneration rate.
Biodiversity: (term popularised by E.O. Wilson, 1988) the variety of life at genetic, species and ecosystem levels; India has about 7–8% of recorded species and is one of 17 megadiverse countries (identified by Conservation International).
Biodiversity hotspot (Norman Myers, 1988; refined by Conservation International): a region with at least 1,500 endemic vascular plant species that has lost at least 70% of its original habitat; India includes parts of the Himalaya, Indo-Burma, Western Ghats–Sri Lanka and Sundaland (Nicobar Islands) hotspots.
In situ vs ex situ conservation: in situ protects species in their habitats (national parks, sanctuaries, biosphere reserves); ex situ outside them (zoos, botanical gardens, seed banks such as the National Bureau of Plant Genetic Resources gene bank).
Protected area categories (Wildlife Protection Act 1972): national parks, wildlife sanctuaries, conservation reserves and community reserves (the last two added in 2002).
Marine resources: living (fish, shellfish, seaweed, corals) and non-living (oil, gas, placer minerals, polymetallic nodules) resources of the sea; India's EEZ is about 2.02 million km².
2. Forest Resources
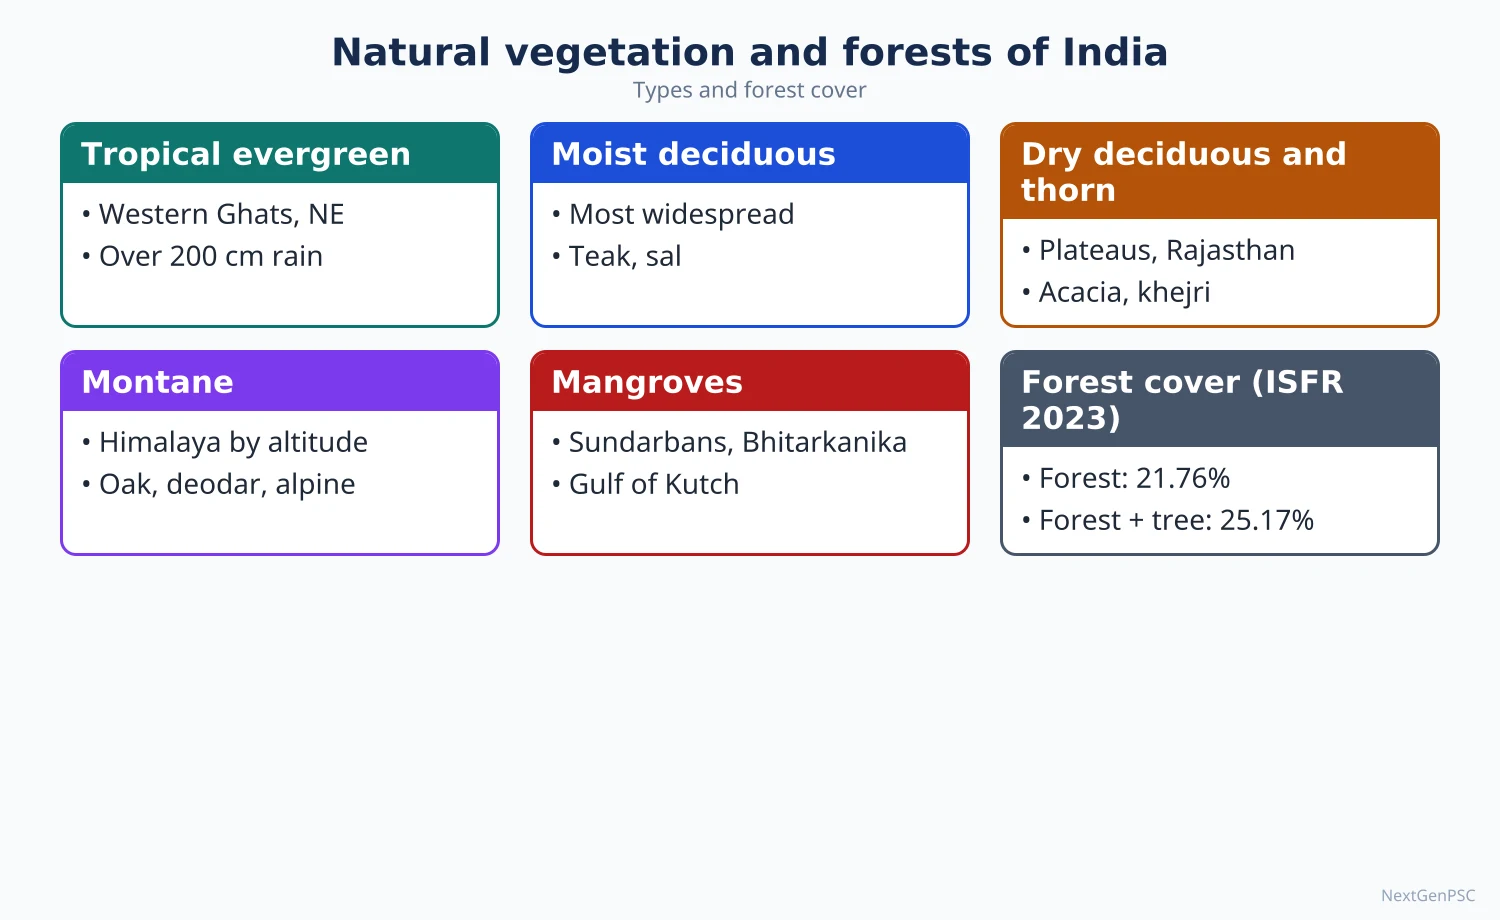
Status (ISFR 2023): forest cover 21.76% and forest plus tree cover 25.17% of geographical area; mangroves 4,992 km²; carbon stock about 7,285 million tonnes.
Uses: timber, fuelwood, fodder, bamboo, minor forest produce (tendu leaves, sal seeds, mahua, honey, lac), medicinal plants; forests support about 275 million people who depend on them to some extent (figure often cited from World Bank and MoEFCC).
Threats: diversion for mining, dams and roads; forest fires; encroachment; invasive species (Lantana, Prosopis juliflora); shifting cultivation; climate change.
Policy and law: National Forest Policy 1988 (one-third area under forest); Forest (Conservation) Act 1980, renamed and amended as the Van (Sanrakshan Evam Samvardhan) Adhiniyam 2023; Compensatory Afforestation Fund Act 2016 (CAMPA); Scheduled Tribes and Other Traditional Forest Dwellers (Recognition of Forest Rights) Act 2006; Green India Mission (2014).
Community forestry: Chipko movement (1973, Uttarakhand), Appiko movement (1983, Karnataka), Joint Forest Management (1990 resolution), sacred groves (devrais in Maharashtra, kavus in Kerala, sarnas in Jharkhand), Mendha Lekha village (Maharashtra) which secured community forest rights.
3. Wildlife Resources and Conservation
Protected area network: over 1,000 protected areas (national parks, sanctuaries, conservation and community reserves) covering roughly 5% of India's geographical area (Wildlife Institute of India ENVIS database, 2024).
Project Tiger (1973): started with 9 reserves; now 58 tiger reserves (Madhav, Madhya Pradesh, notified in March 2025, is the 58th) managed by the National Tiger Conservation Authority; the 2022 All India Tiger Estimation gave a minimum of 3,167 and an estimated 3,682 tigers, about three-quarters of the world's wild tigers; the sixth cycle began in 2026.
Other projects: Project Elephant (1992; elephant reserves; merged administratively with Project Tiger in 2023), Crocodile Conservation Project (1975), Project Snow Leopard (2009), Project Dolphin (2020), Project Cheetah (cheetahs reintroduced in Kuno National Park, Madhya Pradesh, from September 2022, and later at Gandhi Sagar), Great Indian Bustard conservation in Rajasthan.
Elephants: the first DNA-based Synchronous All India Elephant Estimation (2021–25) reported about 22,446 elephants (released 2025), with the largest populations in the Western Ghats and the North-East.
Wetlands: India's Ramsar sites rose from 26 in 2014 to 103 by October 2026 (MoEFCC/PIB reports); Tamil Nadu has the most sites; Wetlands (Conservation and Management) Rules 2017; Amrit Dharohar (2023).
Biosphere reserves: 18 biosphere reserves, of which 12 are in UNESCO's World Network (e.g. Nilgiri, Sundarbans, Gulf of Mannar, Nanda Devi, Cold Desert, Panna).
Threats: habitat fragmentation, human–wildlife conflict (elephants in Odisha, Assam and Kerala; leopards in Maharashtra), poaching and wildlife trade, linear infrastructure through corridors, invasive species, climate change.
4. Marine and Fisheries Resources
Fisheries: India is the world's second-largest fish producer (about 8% of global output); total fish production about 197.75 lakh tonnes in 2024–25 (projected, Department of Fisheries), with inland fisheries and aquaculture about 77% and marine about 23%; Andhra Pradesh leads production.
Marine zones: the west coast (Kerala, Karnataka, Maharashtra, Gujarat) has a wider continental shelf and upwelling off Kerala that makes it richer in pelagic fish (oil sardine, mackerel); the east coast has shrimp-rich deltas.
Coral reefs: Gulf of Mannar, Gulf of Kachchh, Lakshadweep and Andaman and Nicobar Islands; threatened by bleaching (major events in 1998, 2010, 2016 and 2024).
Non-living marine resources: offshore oil and gas (Mumbai High, KG basin), beach placers (monazite, ilmenite), and polymetallic nodules in the Central Indian Ocean Basin (India holds an exploration contract from the International Seabed Authority).
Policies: Pradhan Mantri Matsya Sampada Yojana (2020, ₹20,050 crore), Deep Ocean Mission (2021, including the Samudrayaan crewed submersible Matsya-6000), Coastal Regulation Zone Notification (2019), seasonal fishing bans (61 days on each coast during the monsoon) and draft National Policy on the Blue Economy.
Problems: overfishing near shore, bottom trawling (Palk Bay conflict with Sri Lankan fishers), pollution, mangrove loss, dead zones, and climate-driven shifts of fish stocks.
5. Theory and Debates
Fortress vs community conservation: the colonial and early post-colonial model excluded people from protected areas; Madhav Gadgil and Ramachandra Guha (This Fissured Land, 1992) argued for community rights; FRA 2006 and community reserves reflect this shift; critics fear weakened protection; the debate continues.
Island biogeography (MacArthur and Wilson, 1967): small, isolated habitat patches lose species, which supports wildlife corridors (e.g. Kanha–Pench, Brahmagiri–Nilgiri corridors).
Ecosystem services valuation: Costanza et al. (1997) and later The Economics of Ecosystems and Biodiversity (TEEB) argue for valuing forests and wetlands; India's Green GDP and the Kasturirangan and Gadgil reports on the Western Ghats (2011, 2013) show trade-offs.
Global targets: the Kunming–Montreal Global Biodiversity Framework (2022) sets '30 by 30' (protecting 30% of land and sea by 2030); India's updated National Biodiversity Strategy and Action Plan (2024) aligns with it.
Biological Diversity (Amendment) Act 2023: eased rules for AYUSH and research; critics say it weakens benefit-sharing with local communities; this is debated.
6. Maps and Diagrams to Draw
Biodiversity map: mark the four hotspots, major tiger reserves (Corbett, Kanha, Bandipur, Sundarbans, Kaziranga, Periyar, Ranthambore, Madhav), biosphere reserves and key Ramsar sites (Chilika, Keoladeo, Loktak, Wular, Vembanad).
Marine resources map: EEZ boundary, fishing zones on both coasts, upwelling off Kerala, coral reef areas, offshore oil and gas fields, and the Central Indian Ocean nodule area.
Protected area zonation: concentric circles for a biosphere reserve: core (no human activity), buffer (research, limited use) and transition (settlements, sustainable use).
Corridor sketch: two protected areas linked by a forest corridor, with a highway crossing and an animal underpass.
7. Using It in the Exam
10 marks: short note on a project (Project Tiger, Project Cheetah) or marine resources with data.
15 marks: distribution of biotic resources and threats, with a map of hotspots and protected areas.
20 marks: conservation strategy: legal framework, protected areas, community participation, marine conservation, global targets, debates, with a map and zonation diagram.
Keywords: megadiversity, hotspots, in situ and ex situ, protected area network, corridors, community forest rights, blue economy, 30 by 30.
Attributed idea: Gadgil and Guha argued that ecological conflicts in India are rooted in competing claims over natural resources between the state, industry and local communities (paraphrased).
Always quote numbers with year (tigers 2022, ISFR 2023, Ramsar count October 2026) because they are updated often.
| Indicator | Value | Year/date | Source |
|---|---|---|---|
| Forest and tree cover | 25.17% of geographical area | ISFR 2023 | Forest Survey of India |
| Tigers (estimate) | 3,682 (minimum 3,167) | 2022 | All India Tiger Estimation, NTCA–WII |
| Tiger reserves | 58 | 2025–26 | NTCA |
| Elephants | About 22,446 | 2021–25 estimation | MoEFCC (SAIEE) |
| Ramsar sites | 103 | October 2026 | MoEFCC/PIB reports |
| Fish production | About 197.75 lakh tonnes | 2024–25 (projected) | Department of Fisheries |
| Exclusive Economic Zone | About 2.02 million km² | Standard figure | UNCLOS-based estimate |
Mains points
- Questions often ask about threats to biodiversity, effectiveness of protected areas, human–wildlife conflict, marine resources and the blue economy.
- Use a structure: resource status → distribution (map) → threats → conservation measures (legal, institutional, community) → evaluation.
- Quote the latest data with year: ISFR 2023, tiger estimation 2022, Ramsar count (October 2026), fish production 2024–25.
- Show debates: fortress vs community conservation, FCA amendment 2023, BDA amendment 2023, development vs conservation in the Western Ghats.
- Draw a biodiversity or marine resources map and a biosphere reserve zonation diagram.
- Common mistake: counting Ramsar sites or tiger reserves from old notes; always check the latest number and date.
Did you know?
- Kerala's oil sardine fishery depends on monsoon-driven upwelling: when the south-west winds push surface water offshore, cold nutrient-rich water rises and fish shoals follow.
UPSC Previous Year Questions: Resources of India
From 2014 to 2026 UPSC asked 33 question parts worth 485 marks from this chapter in Paper II. Forest, wildlife and marine conservation (11 parts), land and water resources (10 parts) and energy and the energy crisis (10 parts) are asked almost every year, with two questions on minerals. Every question below has a model answer written to the UPSC word limit, with the map or diagram an examiner expects.
In simple words
Read the question and write your own answer first, keeping to the word limit (10 marks about 150 words, 15 marks about 200, 20 marks about 250).
Then compare it with the model answer: did you use the latest official data with year and source (CGWB, CEA, MNRE, ISFR, GSI), name schemes with their launch year, and draw a map?
Note what you missed in one line and reread that part of the notes before trying the next question.
1. Land, Surface Water and Groundwater Resources
Example 1 (UPSC 2025, 15 marks): Highlight the characteristics of land utilisation in Eastern Ghats region of India. What are the recent threats to land utilisation method in the region?
Paper and question: Paper II, Q3(b)
Approach: Describe the physical setting and the characteristic land-use pattern of the Eastern Ghats (forests, shifting cultivation, terraced valleys, plantations), then the recent threats. Draw a land-use sketch map of the Eastern Ghats.
The Eastern Ghats are a broken belt of old, eroded hills from Odisha (Koraput, Rayagada, Kandhamal) through north coastal Andhra Pradesh (the Araku and Paderu hills) to the Nallamala, Seshachalam and Tamil Nadu hills. Mostly tribal Fifth Schedule areas, their land use reflects rugged relief, red and lateritic soils and 1,000–1,500 mm of rain.
Characteristics: (i) a large share under forest (dry and moist deciduous sal, teak and bamboo), which supports minor forest produce such as tamarind, mahua, sal seeds and honey; (ii) shifting cultivation (podu) by the Kondh, Gadaba and Savara on slopes, growing millets, pulses and niger; (iii) terraced paddy and ragi in valleys, the Koraput region being a FAO Globally Important Agricultural Heritage System for traditional rice farming; (iv) tribal coffee and pepper plantations (Araku Valley coffee, GI tag 2019) and cashew and mango orchards on the lower slopes; (v) small patches of irrigated land and low urbanisation.
Recent threats: (i) bauxite mining on the plateau tops (Panchpatmali; the proposed Niyamgiri mine was rejected by gram sabhas in 2013 after a Supreme Court ruling); (ii) submergence by projects such as Polavaram; (iii) shortening podu cycles that erode soils; (iv) eucalyptus and other commercial plantations replacing natural forest; (v) red sanders smuggling in the Seshachalam hills; (vi) roads, land alienation and erratic rainfall.
Map: Sketch map of the Eastern Ghats from Odisha to Tamil Nadu marking forest tracts, podu areas, Koraput, Araku coffee, Panchpatmali and Niyamgiri bauxite and the Polavaram submergence zone.
Sustainable land use here needs forest-rights-based planning, regulated mining and support for tribal agroforestry.
Example 2 (UPSC 2024, 15 marks): Water scarcity is an important cause of disputes and conflicts in India. Suggest innovative methods for location-based solutions.
Paper and question: Paper II, Q4(c)
Approach: Show how scarcity produces conflicts at different scales with examples, then suggest innovative, location-specific solutions for different physical settings. Draw a map of water conflicts and successful local models.
India has about 18% of the world's population but only about 4% of its freshwater, and per capita availability fell to about 1,486 m³ in 2021 (CWC estimate), close to the 1,700 m³ water-stress threshold.
Conflicts at many scales: interstate river disputes (Kaveri, Krishna, Mahadayi, Sutlej–Yamuna Link canal); rural–urban transfers, as in Bengaluru's crisis of 2024; upstream–downstream and farmer–industry clashes; caste-based exclusion from village sources; and transboundary issues with Pakistan, China and Bangladesh.
Location-based solutions: (i) arid Rajasthan: johads and check dams revived the Arvari river (Tarun Bharat Sangh); (ii) Deccan hard-rock areas: watershed development and participatory budgeting of water, as in Hiware Bazar and the Pani Panchayat model, with Atal Bhujal Yojana (2019) extending community groundwater management; (iii) Himalaya: springshed rejuvenation (Sikkim's Dhara Vikas) and artificial glaciers and ice stupas in Ladakh; (iv) coastal cities: desalination (Chennai's Minjur and Nemmeli plants) and mandatory rooftop harvesting; (v) urban areas: treated wastewater refilling tanks (Bengaluru's K–C Valley project for Kolar) and sponge-city design; (vi) technology: aquifer mapping (NAQUIM), smart meters and satellite monitoring.
Map: Map of India marking major interstate disputes and local models: Arvari, Hiware Bazar, Sikkim, Ladakh, Chennai and Kolar.
Resolving conflicts requires matching solutions to local hydrogeology and giving communities a share in managing water.
Example 3 (UPSC 2024, 15 marks): Discuss the targets of focused interventions of the Jal Shakti Abhiyan : Catch the Rain, 2024 in rural and urban areas.
Paper and question: Paper II, Q6(c)
Approach: Introduce the campaign (theme, period, coverage), then discuss its focused interventions and how they apply in rural and urban areas, ending with an assessment. Draw a flow diagram of the interventions.
The Jal Shakti Abhiyan: Catch the Rain campaign of the Ministry of Jal Shakti (National Water Mission) aims to 'catch the rain, where it falls, when it falls'. Its 2024 edition, themed 'Nari Shakti se Jal Shakti' to highlight women's role in water management, ran from 9 March to 30 November 2024 across all districts, rural and urban, covering the pre-monsoon and monsoon periods.
Focused interventions: (i) water conservation and rainwater harvesting through new structures and the repair of old ones; (ii) enumeration, geo-tagging and inventory of all water bodies, with scientific water-conservation plans for each district; (iii) Jal Shakti Kendras in every district as knowledge and help centres; (iv) intensive afforestation; and (v) awareness generation.
Rural focus: farm ponds, check dams, percolation tanks and Amrit Sarovars; renovation of traditional tanks, johads and step-wells; recharge of borewells; watershed treatment through MGNREGS convergence; and women's self-help groups as Jal Sahelis.
Urban focus: rooftop rainwater harvesting in buildings, recharge pits along roads and parks, rejuvenation of urban lakes and drains, reuse of treated wastewater, and protection of catchments and floodplains.
Assessment: the campaign builds on earlier editions (2019 onwards) and has created many structures, but their quality, maintenance and hydrological monitoring are uneven; impact must be measured in groundwater levels, not counts of structures.
Diagram: Flow diagram linking the five interventions to rural and urban actions and to outcomes: recharge, storage, reduced runoff and community ownership.
Women-led, data-backed local water planning can make the campaign a lasting people's movement.
Example 4 (UPSC 2022, 15 marks): Groundwater contamination in the fast expanding urban landscape of India appears to have become a major public health issue. Discuss.
Paper and question: Paper II, Q2(c)
Approach: Explain the urban sources of groundwater contamination, give evidence and named cases, then the public health consequences and remedies. Draw a sketch of urban contamination pathways.
Rapidly growing Indian cities depend heavily on groundwater, and large parts of it are being polluted from above (sewage, waste, industry) and degraded from below (geogenic contaminants mobilised by over-pumping), making groundwater contamination a public health issue.
Sources: (i) leaking sewers, septic tanks and open drains in areas without full sewerage, adding nitrate and faecal bacteria; (ii) leachate from unlined landfills such as Ghazipur (Delhi) and Deonar (Mumbai); (iii) industrial effluents, such as chromium from Kanpur's tanneries and pollution around Vapi and Ludhiana's Buddha Nullah; (iv) over-extraction that draws in fluoride, arsenic or saline water; (v) urban farming and fertiliser runoff on city fringes.
Evidence: the CGWB's annual groundwater quality report (2024) found that about 20% of samples exceeded the nitrate limit of 45 mg/L, while fluoride, arsenic and uranium exceed limits in parts of Rajasthan, Punjab, the Ganga plain and Assam.
Health impacts: waterborne diseases (diarrhoea, typhoid, hepatitis A and E), methaemoglobinaemia (blue-baby syndrome) from nitrate, dental and skeletal fluorosis, arsenicosis and cancers, and heavy metal poisoning. The urban poor, who depend on shallow handpumps and tankers, suffer most.
Remedies: full sewerage and faecal sludge treatment (AMRUT 2.0), scientific landfills, strict effluent control, regular water-quality mapping, safe piped supply under Jal Jeevan and AMRUT, and protection of recharge zones.
Diagram: Sketch of an urban aquifer showing contamination pathways from septic tanks, sewers, landfills and factories, and a drinking-water well drawing polluted water.
Protecting urban aquifers is thus essential to public health and should be built into city planning.
Example 5 (UPSC 2021, 15 marks): Examine the critical issues of groundwater resources in India.
Paper and question: Paper II, Q6(b)
Approach: Give the latest status of India's groundwater with data, then examine the critical issues (over-exploitation, quality, governance, energy–agriculture nexus, climate) and the responses. Draw a map of groundwater stress.
Groundwater supplies most of India's irrigation and drinking water. The CGWB's Dynamic Ground Water Resources Assessment (2025) puts annual recharge at 448.5 billion cubic metres (bcm), extraction at 247.2 bcm and the national stage of extraction at 60.6%.
Over-exploitation: 730 of 6,762 assessment units (10.8%) are over-exploited and 201 critical, concentrated in Punjab (stage of extraction about 156%), Rajasthan (147%) and Haryana (137%), with hotspots in western Uttar Pradesh, Gujarat, Tamil Nadu and Karnataka.
Quality: geogenic arsenic in the Ganga–Brahmaputra plain, fluoride in Rajasthan and the Deccan, salinity in coastal and arid aquifers, nitrate from sewage and fertiliser, and uranium in Punjab.
Energy–agriculture nexus: free or flat-rate farm electricity and assured procurement of paddy encourage pumping; Punjab's paddy cultivation is the clearest case.
Governance: under the Easement Act (1882), groundwater is effectively attached to land ownership, extraction is largely unregulated, and data on millions of private wells is poor.
Climate and land use: erratic rain, concrete surfaces and lost wetlands reduce recharge.
Responses: the Atal Bhujal Yojana (2019) for community management, aquifer mapping (NAQUIM), Punjab's Preservation of Subsoil Water Act (2009), which delays paddy transplanting, and recharge campaigns. Recovery in several states has reduced over-exploited units from 17.2% in 2017.
Map: Map of India shading over-exploited and critical units (Punjab, Haryana, Rajasthan, western Uttar Pradesh, Tamil Nadu) and marking arsenic and fluoride belts.
Treating groundwater as a common-pool resource, with energy and crop reforms, is the key to its sustainability.
Example 6 (UPSC 2020, 10 marks): The pattern of growing ecological foot-prints is uneven in nature. Analyse with reference to land resources in India.
Paper and question: Paper II, Q5(d)
Approach: Define ecological footprint and relate it to land, then analyse its unevenness across regions, social groups and land uses with evidence. Draw a map of land degradation hotspots.
The ecological footprint (Wackernagel and Rees, 1990s) measures the biologically productive land and water needed to supply a population's consumption and absorb its wastes. India's per capita footprint is low by world standards but exceeds its own biocapacity (Global Footprint Network), and the pressure on land is very uneven.
Regional unevenness: intensive Green Revolution farming in Punjab and Haryana has caused soil nutrient loss and salinity, mining in Jharkhand and Odisha has stripped forests, and urban sprawl around Delhi NCR, Bengaluru and Hyderabad consumes farmland. Meanwhile, the Thar, Bundelkhand and the Deccan rain-shadow face desertification. ISRO's Desertification and Land Degradation Atlas (2021) estimates 97.85 million hectares, about 29.7% of India, as degraded (2018–19).
Social unevenness: affluent urban consumers have footprints several times higher than rural poor households, yet tribal and farming communities bear the land costs of mines, dams and highways.
Map: Map of India marking land-degradation hotspots: Rajasthan, Gujarat, Jharkhand, Odisha, Punjab salinity and urban sprawl around metros.
Reducing and redistributing the footprint requires land-use planning, restoration under India's land degradation neutrality target and sustainable consumption.
Example 7 (UPSC 2019, 10 marks): Examine the major causes of ground water depletion in India.
Paper and question: Paper II, Q1(b)
Approach: Show the scale of depletion with data, then examine the agricultural, economic, institutional, urban and natural causes. Draw a map of over-exploited areas.
India is the world's largest user of groundwater, extracting about 247 billion cubic metres a year (CGWB, 2025), and nearly 11% of assessment units are over-exploited.
Causes: (i) cropping choices: water-guzzling paddy in Punjab and Haryana and sugarcane in Maharashtra and Uttar Pradesh, reinforced by MSP procurement; (ii) cheap power: free or flat-rate electricity and subsidised pumps remove the cost of pumping; (iii) tube-well boom: millions of private borewells since the Green Revolution; (iv) weak regulation: groundwater rights tied to land ownership under the Easement Act (1882); (v) urban demand: cities such as Delhi, Bengaluru and Chennai and industries draw heavily on aquifers; (vi) reduced recharge: concrete surfaces, lost tanks and wetlands, and deforestation; (vii) natural limits: low-storage hard-rock aquifers in the Deccan and erratic rainfall.
Map: Map of India shading over-exploited and critical blocks in Punjab, Haryana, Rajasthan, western Uttar Pradesh, Gujarat and Tamil Nadu.
Correcting power and crop incentives and promoting community recharge are central to reversing depletion.
Example 8 (UPSC 2017, 20 marks): Discuss the freshwater crisis in India and prepare a blueprint for its sustainable management.
Paper and question: Paper II, Q2(a)
Approach: Establish the dimensions of the freshwater crisis with data (quantity, quality, distribution, governance), then present a structured blueprint for sustainable management (supply, demand, quality, institutions). Draw a map of water-stressed basins and a blueprint diagram.
India has about 18% of the world's people but only about 4% of its freshwater. Per capita availability has fallen from about 1,545 m³ in 2011 to about 1,486 m³ in 2021 and is projected at about 1,367 m³ by 2031 (Central Water Commission), approaching water scarcity.
Dimensions of the crisis: (i) uneven distribution in time and space, since most rain falls in four months and the Brahmaputra and Ganga carry most of the surface flow while western and southern basins (Sabarmati, Pennar, Kaveri) are deficit; (ii) groundwater depletion, with 10.8% of units over-exploited (CGWB, 2025); (iii) pollution of rivers such as the Yamuna and of aquifers with arsenic, fluoride and nitrate; (iv) inefficiency, since agriculture uses roughly 80% of water at low efficiency; (v) conflicts and governance gaps, including interstate disputes and fragmented institutions.
Blueprint (1) Supply: rainwater harvesting and recharge (Catch the Rain, Amrit Sarovar); revival of traditional tanks and wetlands; selective, well-appraised storage and transfers (Ken–Betwa link); desalination for coastal cities.
(2) Demand: micro-irrigation under PMKSY's 'Per Drop More Crop' (2015); crop diversification away from paddy and sugarcane in stressed areas; rational power and water pricing; industrial recycling and zero liquid discharge.
(3) Quality: sewage treatment and reuse of treated wastewater (Namami Gange, AMRUT 2.0); regular quality monitoring.
(4) Institutions: basin-level planning, participatory groundwater management (Atal Bhujal Yojana, 2019), aquifer mapping, a revised National Water Policy, and universal tap supply under the Jal Jeevan Mission (2019) backed by source sustainability.
Map: Map of India showing surplus (Brahmaputra, Mahanadi) and deficit (Sabarmati, Pennar, Kaveri) basins with groundwater-stressed areas shaded.
Such an integrated, demand-led and community-based approach can turn India's water crisis into water security.
Example 9 (UPSC 2016, 15 marks): Evaluate the impact of technology on resource utilization in India.
Paper and question: Paper II, Q6(c)
Approach: Show, sector by sector, how technology has expanded, made efficient or degraded the use of land, water, minerals, energy and marine resources, and give a balanced evaluation. Draw a diagram of technology's positive and negative impacts.
Resources, as Zimmermann argued, are not, they become: technology converts neutral stuff into resources and decides how intensively they are used. In India it has both expanded resource use and created new pressures.
Land and agriculture: high-yielding seeds, fertilisers and tube-wells of the Green Revolution made India self-sufficient in food grains, but also caused soil degradation and groundwater depletion in Punjab and Haryana. Today satellite remote sensing (ISRO's Bhuvan), drone surveys for land records (SVAMITVA, 2020) and soil health cards support more precise land use.
Water: drip and sprinkler irrigation, aquifer mapping and desalination improve efficiency, whereas cheap pumps accelerate over-extraction.
Minerals and energy: mechanised opencast mining raised coal output beyond 1 billion tonnes in 2024–25 at the cost of forest loss and displacement. Falling costs of solar modules and wind turbines have made renewables the cheapest new power, with non-fossil capacity crossing 300 GW in 2026 (MNRE).
Marine and new resources: deep-sea exploration under the Deep Ocean Mission (2021) and satellite-based fishing advisories open new frontiers.
Evaluation: technology raises productivity and substitutes scarce resources, but without regulation it speeds depletion and pollution (Jevons' paradox).
Diagram: Two-column diagram of technology's impacts on land, water, minerals and energy: gains (productivity, efficiency, substitution) against costs (depletion, pollution, displacement).
Appropriate, regulated technology guided by sustainability goals is therefore the key.
Example 10 (UPSC 2015, 20 marks): Account for the geographical distribution of groundwater resources of India. How serious is its depletion in recent decades?
Paper and question: Paper II, Q2(a)
Approach: Explain the hydrogeological controls, describe the distribution of groundwater by aquifer region with data, then assess how serious recent depletion is, using CGWB and satellite evidence. Draw a map of groundwater provinces and stress.
Groundwater availability depends on rainfall and recharge, rock porosity and permeability, and relief. The CGWB (2025) estimates annual recharge at about 448.5 billion cubic metres, but it is very unevenly distributed.
Distribution: (i) Indo-Gangetic–Brahmaputra alluvium: thick, highly permeable unconsolidated aquifers with high recharge from rain, rivers and canals form India's richest groundwater store, with Uttar Pradesh having the largest recharge of any state; (ii) Peninsular hard rocks (granite, gneiss, basalt) covering most of the Peninsula hold water only in weathered zones and fractures, so yields are low and wells dry up quickly; (iii) coastal alluvial aquifers of the east-coast deltas and Gujarat are productive but vulnerable to saline intrusion; (iv) the Thar and Kutch have low recharge and much saline groundwater; (v) the Himalaya depends on springs, with limited storage.
Seriousness of depletion: nationally the stage of extraction is 60.6% (CGWB, 2025), but 730 units (10.8%) are over-exploited and 201 critical. Punjab (about 156%), Rajasthan (147%) and Haryana (137%) extract more than they recharge. Using GRACE satellite data, Rodell and others (Nature, 2009) estimated that north-west India lost about 18 km³ of groundwater a year in 2002–2008.
Recent trend: the share of over-exploited units has fallen from 17.2% in 2017, reflecting recharge efforts and better monitoring, yet water tables in the north-west and in parts of Tamil Nadu and Karnataka continue to decline, and contamination with arsenic, fluoride and nitrate reduces usable supply.
Implications: deeper wells raise pumping costs, shallow wells of small farmers fail, and land subsidence and seawater intrusion follow.
Map: Map of India showing groundwater provinces (alluvial, hard rock, coastal, arid, Himalayan) with over-exploited and critical areas shaded.
Depletion is therefore serious and regionally concentrated, demanding aquifer-specific management rather than uniform national policy.
2. Mineral Resources
Example 11 (UPSC 2023, 10 marks): Why are critical minerals essential for the economic development and national security in India?
Paper and question: Paper II, Q5(e)
Approach: Define critical minerals and India's list, then explain their importance for economic development and national security, with India's vulnerability and policy response. Draw a map of known critical mineral sites.
Critical minerals are minerals essential to the economy whose supply is at risk; the Ministry of Mines identified 30 of them in 2023, including lithium, cobalt, nickel, graphite and rare earth elements.
Economic development: they are indispensable for electric-vehicle batteries, solar panels, wind turbines and grid storage, which are central to the 500 GW non-fossil target and net zero by 2070, and for electronics, semiconductors and advanced manufacturing under Make in India and PLI schemes.
National security: rare earth magnets, titanium and tungsten are used in missiles, aircraft, radar and satellites. India imports nearly all its lithium, cobalt and nickel, and processing is concentrated in China, making supply chains a strategic vulnerability.
Response: the MMDR Amendment Act (2023) opened exploration and auctions to private firms; KABIL is acquiring lithium blocks in Argentina; India joined the Minerals Security Partnership (2023); GSI found lithium resources at Reasi (Jammu and Kashmir); and the National Critical Mineral Mission (2025) funds exploration, recycling and processing.
Map: Map of India marking Reasi lithium, coastal rare-earth sands of Kerala, Odisha and Tamil Nadu, and graphite in Jharkhand and Odisha.
Critical minerals are thus central to green growth and strategic autonomy.
Example 12 (UPSC 2022, 20 marks): India is bestowed with rich mineral resources due to its geological structure. Correlate the above statement with large mineral belts of India.
Paper and question: Paper II, Q4(a)
Approach: Link each geological formation to the minerals it holds, then describe India's major mineral belts with named deposits, showing the correlation, and note the mineral-poor regions. Draw a map of mineral belts over geological formations.
India's mineral wealth closely follows its geological structure: the Precambrian Peninsular shield (Dharwar, Cuddapah, Aravalli) holds metallic minerals, Gondwana troughs hold coal, Tertiary basins hold petroleum and lignite, and laterite caps hold bauxite, while the young folded Himalaya and the alluvial plains are poor in minerals.
(1) North-eastern Peninsular belt (Chotanagpur plateau and Odisha), India's richest: Dharwar iron ore (Noamundi, Keonjhar), Singhbhum copper and uranium (Jaduguda), Gondwana coal (Jharia, Talcher) and bauxite (Panchpatmali on Eastern Ghats khondalite).
(2) Central belt (Chhattisgarh and Madhya Pradesh): Bailadila and Dalli–Rajhara iron ore, Balaghat manganese, Malanjkhand copper, Korba and Singrauli coal, and limestone.
(3) South-western belt (Karnataka and Goa): Dharwar iron ore of Ballari–Hosapete and Goa, Sandur manganese and gold (Hutti), associated with ancient greenstone belts.
(4) North-western belt (Aravalli–Delhi rocks of Rajasthan and Gujarat): copper (Khetri), lead–zinc (Zawar, Rampura Agucha), marble (Makrana), gypsum, and Tertiary petroleum in the Barmer basin and Cambay.
(5) South-eastern and coastal belt: Cuddapah barytes and limestone, Tertiary lignite at Neyveli, and beach-sand minerals (ilmenite, monazite) on the Kerala, Tamil Nadu and Odisha coasts.
(6) Offshore and north-eastern Tertiary basins: petroleum and gas at Mumbai High, the Krishna–Godavari basin and Assam (Digboi).
Map: Map of India overlaying the six mineral belts on the Precambrian shield, Gondwana troughs and Tertiary basins, marking the main deposits.
The correlation explains why mining and metal industries cluster on the Peninsula, but it also places mining in forested tribal regions, calling for sustainable mining and benefit-sharing through District Mineral Foundations.
3. Energy Resources and the Energy Crisis
Example 13 (UPSC 2026, 15 marks): Efficient use of energy resources can resolve the energy crisis in India. Comment.
Paper and question: Paper II, Q3(c)
Approach: Define India's energy crisis with data, explain how efficiency can address it with named programmes and results, then comment on its limits and the complementary measures needed. Draw a diagram of efficiency levers across sectors.
India's energy crisis has several faces: rapidly rising demand (peak power demand reached about 250 GW in May 2024), import dependence of about 88% for crude oil (PPAC, 2024–25), coal-based emissions, and energy poverty in poor households.
Why efficiency matters: energy saved is the cheapest 'fuel', since it reduces imports, emissions and the need for new plants at once. The Bureau of Energy Efficiency (under the Energy Conservation Act, 2001) leads this effort.
Programmes and results: (i) UJALA (2015) distributed over 36 crore LED bulbs, cutting lighting demand; (ii) the Perform, Achieve and Trade scheme (2012) sets energy-saving targets for steel, cement, fertiliser and power plants; (iii) star labelling of appliances and the Energy Conservation Building Code; (iv) reduction of transmission and distribution (AT&C) losses to about 16% in 2023–24 through the Revamped Distribution Sector Scheme; (v) electric mobility (FAME, PM E-DRIVE), metro rail and dedicated freight corridors that save fuel.
Limits: efficiency gains can be offset by rising consumption (the rebound effect), and per capita energy use in India is still low, so demand will keep growing. Efficiency must therefore go together with renewables (non-fossil capacity crossed 300 GW in 2026), storage, domestic exploration and diversified imports.
Diagram: Diagram showing efficiency levers in households (LEDs, appliances), industry (PAT), buildings (ECBC), transport (EVs, rail) and the grid (loss reduction), feeding into lower demand and imports.
Efficiency is thus a necessary first step that can ease, though not alone resolve, India's energy crisis.
Example 14 (UPSC 2023, 15 marks): Critically examine the role of petroleum energy resources on International Geopolitics with special reference to India.
Paper and question: Paper II, Q3(c)
Approach: Explain why petroleum shapes international geopolitics (uneven distribution, chokepoints, cartels, sanctions), then examine critically India's position and strategies with recent examples. Draw a map of India's oil import routes and chokepoints.
Petroleum is the most geopolitical of resources because reserves are concentrated in a few regions (West Asia, Russia, the Americas), trade passes through narrow chokepoints, and producers act through OPEC+. Oil has repeatedly been used as a weapon, from the 1973 embargo to recent sanctions.
India's exposure: India is the world's third-largest oil consumer and imports about 88% of its crude (PPAC, 2024–25). Most of it passes through the Strait of Hormuz and the Bab-el-Mandeb, so the Gulf wars and Houthi attacks in the Red Sea (2023–24) directly raise its freight and insurance costs.
Geopolitical choices: (i) after 2022 India sharply increased discounted Russian crude, which became its largest source, defending this as energy security despite Western criticism and, in 2025, additional US tariffs linked to these purchases; (ii) India stopped Iranian imports in 2019 under US sanctions, slowing projects such as Chabahar; (iii) strong ties with Saudi Arabia, the UAE and Iraq, including strategic partnerships and investment in refining.
Strategies: strategic petroleum reserves at Visakhapatnam, Mangaluru and Padur; overseas equity through ONGC Videsh (Sakhalin-1, Mozambique); diversification to the US, Guyana and Africa; ethanol blending (E20) and electric mobility to cut demand.
Critical view: oil diplomacy gives India leverage as a large buyer, but it remains vulnerable to price shocks, sanctions regimes and great-power rivalry.
Map: World map showing India's main crude sources (Russia, Iraq, Saudi Arabia, UAE, US) and sea routes through Hormuz, Bab-el-Mandeb and the Cape, with India's strategic reserve sites.
Reducing oil dependence through the energy transition is ultimately India's best geopolitical insurance.
Example 15 (UPSC 2023, 20 marks): Discuss the green energy initiatives of India as a signatory nation to the Paris Agreement.
Paper and question: Paper II, Q7(a)
Approach: State India's Paris commitments (NDC 2015, updated NDC 2022, Panchamrit and net zero 2070), then discuss green energy initiatives by type with progress data, and evaluate gaps. Draw a map of major renewable energy zones.
Under the Paris Agreement (2015), India's updated Nationally Determined Contribution (2022) commits it to reduce the emissions intensity of GDP by 45% from 2005 levels by 2030 and to reach about 50% of installed power capacity from non-fossil sources by 2030. At Glasgow (2021) it announced the 'Panchamrit', including 500 GW of non-fossil capacity by 2030 and net zero by 2070.
Progress: India reached the 50% non-fossil capacity share in 2025, five years early. By July 2026, non-fossil capacity was about 300 GW, over 54% of the total of about 552 GW, including about 165 GW solar, 58 GW wind, 57 GW hydro and 8.8 GW nuclear (MNRE/CEA).
Solar: the National Solar Mission (2010), ultra-mega solar parks (Bhadla in Rajasthan, Pavagada in Karnataka, Khavda in Gujarat), PM-KUSUM (2019) for farm pumps, PM Surya Ghar Muft Bijli Yojana (2024) for rooftop solar, and PLI support for module manufacturing.
Wind, hydro and others: wind–solar hybrid policy and offshore wind plans off Gujarat and Tamil Nadu; pumped storage and battery storage tenders; and bioenergy, including E20 ethanol blending.
Green hydrogen and grid: the National Green Hydrogen Mission (2023) targets 5 million tonnes a year by 2030, with hubs at ports such as Kandla, Paradip and Tuticorin, while Green Energy Corridors connect renewable-rich states to the grid.
Gaps: coal still dominates electricity generation, with non-fossil sources providing only about 29% of generation in 2025–26, and storage, transmission, land acquisition, import dependence for cells and critical minerals, and DISCOM finances remain constraints.
Map: Map of India marking Bhadla, Pavagada and Khavda solar parks, wind belts in Tamil Nadu and Gujarat, offshore wind zones, green hydrogen port hubs and Green Energy Corridors.
India's green energy initiatives are therefore ambitious and ahead of schedule on capacity, but the shift in actual generation and storage will decide whether it meets its Paris goals.
Example 16 (UPSC 2022, 15 marks): The peninsular location of India provides scope for harnessing non-conventional energy resources. Discuss with examples.
Paper and question: Paper II, Q2(b)
Approach: Explain how India's peninsular position (long coastline, tropical latitude, monsoon winds, tidal gulfs, warm seas) creates non-conventional energy potential, giving examples of each source and its constraints. Draw a map of coastal renewable energy sites.
Peninsular India, surrounded on three sides by the Arabian Sea, the Indian Ocean and the Bay of Bengal, has a long coastline, island territories and a tropical location, all of which favour non-conventional energy.
Wind: strong, steady south-west monsoon winds funnel through gaps such as the Palghat gap and blow across Kutch and Saurashtra, making Tamil Nadu (Muppandal) and Gujarat leading wind states. Offshore wind zones have been identified off Gujarat and Tamil Nadu (Gulf of Mannar).
Tidal energy: funnel-shaped gulfs with high tidal ranges, such as the Gulf of Khambhat and the Gulf of Kutch, and the Sundarbans offer tidal potential, though costs and ecological concerns have stalled projects.
Wave and ocean thermal energy: a pilot wave plant operated at Vizhinjam (Kerala), and the warm tropical seas allow ocean thermal energy conversion; NIOT runs low-temperature thermal desalination plants in Lakshadweep (Kavaratti).
Solar: the peninsula's low latitude gives high insolation, supporting solar parks such as Pavagada (Karnataka) and Kurnool (Andhra Pradesh) and solar–wind hybrids.
Green hydrogen and ports: coastal renewable power and ports such as Kandla, Paradip and Tuticorin, chosen as green hydrogen hubs, favour export-oriented clean fuels.
Constraints: high capital costs, cyclone risk, grid evacuation, and impacts on fisheries and coastal ecosystems.
Map: Map of peninsular India marking Muppandal and Kutch wind farms, offshore wind zones, Khambhat and Kutch tidal sites, Vizhinjam, Kavaratti, Pavagada and green hydrogen ports.
The peninsular location is thus a strategic asset for India's clean-energy future if harnessed with care.
Example 17 (UPSC 2021, 20 marks): Discuss the importance of solar energy in future economic development of India.
Paper and question: Paper II, Q3(a)
Approach: Show India's solar potential and current status with data, then discuss its importance for future economic development (energy security, cost, jobs, rural economy, industry, climate), followed by the challenges to be overcome. Draw a map of solar insolation and solar parks.
Lying largely within the tropics, India receives about 4–7 kWh of solar energy per m² per day on roughly 250–300 clear days a year; the National Institute of Solar Energy has estimated its solar potential at about 748 GW. Installed solar capacity rose from under 3 GW in 2014 to about 165 GW by July 2026 (MNRE).
Energy security: solar reduces dependence on imported coal, oil and gas and helps meet fast-rising electricity demand, especially daytime peaks. Cheap power: auction tariffs have fallen to among the lowest in the world, making solar the cheapest source of new electricity and lowering costs for industry and households.
Rural development: PM-KUSUM (2019) solarises farm pumps and lets farmers sell surplus power, mini-grids electrify remote villages, and solar cold storage and drying reduce farm losses.
Households and cities: the PM Surya Ghar Muft Bijli Yojana (2024) aims to put rooftop solar on one crore homes, cutting electricity bills.
Industry and jobs: PLI support is building domestic module and cell manufacturing, while installation and maintenance create employment. Cheap solar also underpins green hydrogen, electric mobility and data centres.
Climate and health: solar helps meet the target of 500 GW non-fossil capacity by 2030 and net zero by 2070, and reduces air pollution from coal.
Challenges: intermittency and the need for storage, land acquisition, grid and transmission constraints, dependence on imported cells and polysilicon, DISCOM payment delays, and wildlife concerns such as the great Indian bustard in Rajasthan.
Map: Map of India showing solar insolation zones (highest in Rajasthan, Gujarat and Ladakh) with major parks at Bhadla, Khavda, Pavagada, Kurnool and Rewa.
Solar energy can thus become a pillar of India's future growth if storage, grids and domestic manufacturing keep pace.
Example 18 (UPSC 2021, 20 marks): Discuss the reserves, distribution and production of all varieties of coal in India.
Paper and question: Paper II, Q4(a)
Approach: Classify Indian coal by geological age and grade, then give reserves (GSI), distribution by coalfield and state, and production trends (Ministry of Coal) for each variety. Draw a map of coalfields and lignite fields.
Coal is India's main commercial energy source. By age it is either Gondwana coal (Permian, about 98% of reserves) or Tertiary coal and lignite; by grade it ranges from anthracite through bituminous to lignite.
Reserves: the GSI inventory (1 April 2024) puts India's total coal resources at about 389 billion tonnes, with Jharkhand, Odisha and Chhattisgarh holding roughly 70% of them, followed by West Bengal, Madhya Pradesh, Telangana and Maharashtra. Lignite resources are about 47 billion tonnes, mostly in Tamil Nadu.
Bituminous (Gondwana) coal: found in river-valley troughs: the Damodar (Jharia, Raniganj, Bokaro, Karanpura), the Son (Singrauli), the Mahanadi (Talcher, Ib valley), the Hasdeo–Mand (Korba) and the Godavari–Wardha (Singareni, Chandrapur). Coking coal, vital for steel, is concentrated in Jharia, though much of it is high in ash.
Anthracite: only small, folded deposits occur in Jammu and Kashmir (Kalakot).
Tertiary coal: young, low-ash but high-sulphur coal in Assam (Makum), Meghalaya and Arunachal Pradesh.
Lignite: brown coal of Tertiary age at Neyveli (Tamil Nadu), Kutch and Bharuch (Gujarat), and Barmer and Bikaner (Rajasthan), used mainly in pithead power plants.
Production: output crossed 1 billion tonnes for the first time in 2024–25 (about 1,048 million tonnes, Ministry of Coal), led by Odisha, Chhattisgarh and Jharkhand, with Coal India producing about three-quarters. Opencast mining dominates, and commercial auctions since 2020 have raised private output, yet coking coal is still largely imported.
Map: Map of India marking Gondwana coalfields (Jharia, Raniganj, Singrauli, Korba, Talcher, Singareni), Tertiary coal in the north-east, anthracite at Kalakot and lignite at Neyveli, Kutch and Barmer.
Coal will remain India's energy backbone for some time, but cleaner mining, washing and a just transition for coal regions are essential.
Example 19 (UPSC 2018, 10 marks): Keeping the recent developments in view, how can the energy crisis of India be circumvented by harnessing non-conventional energy resources?
Paper and question: Paper II, Q1(d)
Approach: State the dimensions of the energy crisis briefly, then show how each non-conventional source, with recent developments, can address them, ending with the enabling conditions. Draw a map of renewable energy zones.
India's energy crisis lies in rising demand, heavy import dependence (about 88% for crude oil) and coal-based pollution. Non-conventional sources offer a domestic, clean alternative.
Recent developments: (i) solar capacity reached about 165 GW by July 2026, through parks such as Bhadla and Khavda, rooftop solar (PM Surya Ghar, 2024) and solar pumps (PM-KUSUM); (ii) wind of about 58 GW in Tamil Nadu, Gujarat and Karnataka, with offshore plans; (iii) bioenergy, including E20 ethanol blending and compressed biogas, which reduces oil imports; (iv) green hydrogen under the National Green Hydrogen Mission (2023) for refineries, fertilisers and steel; (v) small hydro, waste-to-energy and storage (pumped storage, batteries).
Enablers: transmission (Green Energy Corridors), storage, domestic manufacturing (PLI) and healthy DISCOM finances.
Map: Map of India marking major solar parks, wind belts, offshore wind zones and green hydrogen hubs.
With non-fossil capacity already over 300 GW (2026), renewables can steadily circumvent the energy crisis.
Example 20 (UPSC 2017, 15 marks): Why has solar energy in India not been developed to desired level in spite of its high potential?
Paper and question: Paper II, Q8(c)
Approach: Acknowledge the high potential, then examine the technical, economic, institutional and environmental reasons for slow development (as of 2017 and still partly today), and note the progress since. Draw a map of solar potential and parks.
India's solar potential is estimated at about 748 GW (NISE), yet in 2017 installed capacity was only around 12 GW, and the 2022 target of 100 GW (including 40 GW rooftop) was missed by a wide margin.
Economic reasons: high upfront capital cost and costly finance; the poor finances of DISCOMs, which delayed payments and sometimes renegotiated tariffs; and low tariffs that squeezed developers.
Technical reasons: intermittency and lack of affordable storage; inadequate transmission from sunny western states; and efficiency losses from heat and dust.
Manufacturing dependence: most cells and modules were imported from China, exposing projects to price swings, safeguard duties and supply disruptions.
Institutional reasons: slow land acquisition, complex approvals, net-metering rules that discouraged rooftop solar, and weak consumer awareness.
Environmental and social issues: large land requirements in arid grasslands, water for panel cleaning, and wildlife conflicts; for example, the Supreme Court in 2021 ordered undergrounding of power lines in great Indian bustard habitats.
Progress since: solar parks, falling costs, PLI for manufacturing and rooftop schemes raised capacity to about 165 GW by July 2026 (MNRE), though storage and rooftop adoption still lag.
Map: Map of India shading high-insolation zones and marking major solar parks and the bustard habitat in Rajasthan.
Fixing finance, grids and storage is key to realising the full potential.
Example 21 (UPSC 2016, 15 marks): Give an account of the development of renewable resources of India.
Paper and question: Paper II, Q3(c)
Approach: Classify India's renewable resources, then trace their development with policies and current capacity for each source, ending with challenges and outlook. Draw a map of renewable energy resource zones.
India's renewable resources include solar, wind, hydro, biomass, geothermal and ocean energy. A dedicated ministry (now MNRE) was created in 1992, and renewables have grown from a marginal share to the largest part of new capacity.
Solar: after the National Solar Mission (2010) and solar parks, capacity reached about 165 GW by July 2026, led by Rajasthan, Gujarat and Karnataka.
Wind: development began in the 1980s along the Tamil Nadu and Gujarat coasts; capacity is about 58 GW, with repowering and offshore wind as the next phase.
Hydro: large hydro of about 57 GW (Bhakra, Tehri, Koyna, Subansiri) and small hydro in Himalayan states, though much Himalayan potential remains untapped because of ecological and seismic concerns.
Bioenergy: bagasse cogeneration in sugar mills (Maharashtra, Uttar Pradesh), biomass plants, ethanol blending (E20) and compressed biogas.
Others: geothermal prospects at Puga (Ladakh) and Manikaran (Himachal Pradesh), tidal potential in the Gulf of Khambhat, and ocean thermal research in Lakshadweep.
Challenges: intermittency, storage, transmission, land, and dependence on imported equipment.
Map: Map of India marking solar zones, wind belts, major hydro projects, geothermal sites and tidal gulfs.
With total non-fossil capacity above 300 GW in 2026, renewables have become the core of India's energy future.
Example 22 (UPSC 2014, 10 marks): Location of thermal power plants and coal fields in India are not mutually conducive. Analyse.
Paper and question: Paper II, Q1(d)
Approach: Compare the location of coalfields (east-central India) with that of thermal plants (spread to load centres and coasts), analyse the resulting mismatch and its costs, and note the rationalisation measures. Draw a map of coalfields, thermal plants and coal flows.
Nearly all of India's coal lies in the Gondwana basins of Jharkhand, Odisha, Chhattisgarh, West Bengal, Madhya Pradesh and Telangana, whereas electricity demand is spread across the industrial west, the north-west and the south, so the location of thermal plants often does not match the coalfields.
Mismatch: many large plants were sited near load centres or ports, such as those in Punjab, Haryana, Maharashtra, Gujarat, Tamil Nadu and Karnataka, far from the coalfields. Coal therefore travels long distances by rail, and it is one of the largest freight items of Indian Railways, causing congestion, high transport costs and price distortions.
Coastal plants at Mundra and on the Andhra coast rely partly on imported coal, raising import bills.
Conducive cases: pithead plants at Singrauli, Korba, Talcher and Ramagundam transmit power instead of coal ('coal by wire'), which is more efficient.
Map: Map of India marking coalfields, pithead plants (Singrauli, Korba, Talcher) and distant load-centre and coastal plants (Punjab, Maharashtra, Mundra, Tamil Nadu), with arrows showing coal flows.
Coal-linkage rationalisation, pithead siting, stronger transmission and dedicated freight corridors can reduce this mismatch.
4. Forest, Wildlife, Biotic and Marine Resources and Their Conservation
Example 23 (UPSC 2025, 15 marks): Why are coral reefs in India most important with respect to its dynamic ecosystem? Explore.
Paper and question: Paper II, Q2(b)
Approach: Introduce coral reefs and India's four reef regions, explain why they are dynamic and important (productivity, biodiversity, coastal protection, livelihoods, island building), then the threats and conservation. Draw a map of India's coral reef regions.
Coral reefs are limestone structures built by colonies of coral polyps living in symbiosis with algae (zooxanthellae) in warm, clear, shallow and saline seas. India has four major reef regions: the Gulf of Mannar and Palk Bay (fringing reefs), the Gulf of Kutch (fringing reefs), Lakshadweep (atolls) and the Andaman and Nicobar Islands (fringing and barrier reefs).
Why they are a dynamic ecosystem: reefs are constantly built by coral growth and broken down by waves, bioeroders and storms, and they respond quickly to temperature and sediment changes, recovering after bleaching if stresses ease.
Importance: (i) biodiversity: they are among the most diverse ecosystems, supporting fish, turtles and dugongs; (ii) productivity and fisheries: they provide nurseries and food for coastal fishers of Tamil Nadu and Lakshadweep; (iii) coastal protection: they absorb wave energy, protecting low islands and coasts from storm surges and erosion; (iv) land building: Lakshadweep's islands themselves rest on reefs; (v) tourism: diving in the Andamans and Lakshadweep.
Threats and conservation: mass bleaching during marine heatwaves (2010, 2016 and 2024), sedimentation, coral mining (now banned), destructive fishing and pollution threaten them. Protection includes the Gulf of Mannar Marine National Park and Biosphere Reserve, the Marine National Park of the Gulf of Kutch, the Mahatma Gandhi Marine National Park, Schedule I status for corals and CRZ rules.
Map: Map of India marking the Gulf of Kutch, Gulf of Mannar, Lakshadweep atolls and Andaman and Nicobar reefs with marine protected areas.
Reefs are thus India's frontline against coastal hazards and need climate-sensitive marine conservation.
Example 24 (UPSC 2025, 15 marks): Examine the validity of Blue Economy initiatives of India. Elaborate the impacts of this economy on country's development.
Paper and question: Paper II, Q7(c)
Approach: Define the blue economy and India's maritime endowment, examine the validity of its initiatives (potential versus constraints), then elaborate the developmental impacts. Draw a map of India's EEZ, ports and blue-economy projects.
The blue economy is the sustainable use of ocean resources for growth, livelihoods and ocean health. India has a coastline of about 11,098 km (revised measurement, 2024), an Exclusive Economic Zone of about 2 million km², and nine coastal states, and most of its trade by volume moves by sea.
Initiatives: Sagarmala (2015) for port-led development; the Maritime India Vision 2030; the Deep Ocean Mission (2021), including the manned submersible Matsya-6000 under Samudrayaan; the Pradhan Mantri Matsya Sampada Yojana (2020) for fisheries; a draft Blue Economy Policy (2021); offshore wind and mineral block auctions; and seaweed farming.
Validity: the initiatives are well founded, given India's large EEZ, growing fish output (India is the world's second-largest fish producer) and strategic location on Indian Ocean sea lanes. However, overfishing, coastal pollution, mangrove loss, cyclones and sea-level rise, weak marine data and the displacement of fishing communities by port projects raise doubts about sustainability.
Impacts on development: (i) trade and logistics through modern ports such as Vadhavan and Vizhinjam; (ii) food and nutrition security and jobs for millions of fishers; (iii) energy from offshore oil, gas and wind; (iv) minerals such as polymetallic nodules in the Central Indian Ocean basin; (v) tourism in the islands; and (vi) strategic presence under SAGAR.
Map: Map of India's EEZ showing major ports, Sagarmala clusters, fishing harbours, offshore wind zones, Mumbai High and KG basin, and the Central Indian Ocean nodule area.
The blue economy is therefore a valid growth frontier provided ocean health and coastal communities are placed at its centre.
Example 25 (UPSC 2024, 10 marks): Conservation and breeding centres are important components of the Action Plan for Vulture Conservation, 2020–2025. Why?
Paper and question: Paper II, Q1(c)
Approach: Explain the vulture crash and its cause, then why conservation breeding centres are central to the Action Plan (insurance population, slow breeding, reintroduction into safe zones, research). Draw a map of breeding centres and vulture safe zones.
India's resident Gyps vultures (white-rumped, long-billed and slender-billed) declined by more than 95% from the 1990s, mainly because they fed on carcasses of cattle treated with the painkiller diclofenac, which causes kidney failure in vultures. Veterinary diclofenac was banned in 2006.
Why breeding centres matter: (i) insurance population: wild numbers are too low to recover alone, so captive flocks safeguard the species from extinction; (ii) slow breeding: vultures mature late and lay usually one egg a year, so protected breeding speeds recovery; (iii) reintroduction: captive-bred birds can be released into Vulture Safe Zones where toxic drugs are absent; (iv) research and testing: centres study vulture health and test new veterinary drugs for safety.
The Action Plan for Vulture Conservation 2020–2025 builds on the Jatayu Conservation Breeding Centre at Pinjore (Haryana), proposes new centres in states such as Uttar Pradesh, Tripura, Maharashtra, Karnataka and Tamil Nadu, and adds rescue centres.
Map: Map of India marking Pinjore and other breeding centres, proposed centres and vulture safe zones.
Breeding centres work only alongside strict drug control, as with the 2023 veterinary ban on ketoprofen and aceclofenac.
Example 26 (UPSC 2023, 10 marks): Discuss the impact of the National Green Tribunal Act, 2010 on forest conservation in India.
Paper and question: Paper II, Q1(d)
Approach: Introduce the NGT Act and its mandate, then discuss its positive impacts on forest conservation with examples, and its limitations. Draw a diagram of NGT benches.
The National Green Tribunal Act, 2010 created a specialised tribunal (principal bench in Delhi and four zonal benches) to decide environmental cases, including those under the Forest (Conservation) Act, 1980, applying the principles of sustainable development, precaution and polluter pays.
Positive impacts: (i) faster, specialised adjudication with expert members, aiming to decide cases within six months; (ii) wider access to justice, since affected communities and NGOs can approach it directly; (iii) scrutiny of forest clearances, as when it set aside the forest clearance for the Parsa East–Kente Basan coal block in Hasdeo Arand (2014), though that order was later stayed by the Supreme Court; (iv) curbs on illegal sand and stone mining and on encroachment in forests and the Aravallis.
Limitations: it has no jurisdiction under the Wildlife (Protection) Act, 1972 or the Forest Rights Act, 2006; vacancies and limited benches cause delays; compliance with its orders is weak; and many decisions are stayed on appeal.
Diagram: Map-diagram of India marking the NGT principal bench (Delhi) and zonal benches (Bhopal, Pune, Kolkata, Chennai) with the laws it enforces.
The NGT has strengthened green justice for forests, but its impact depends on capacity and enforcement.
Example 27 (UPSC 2021, 10 marks): Discuss the salient features of Project Tiger in India.
Paper and question: Paper II, Q5(a)
Approach: Give the origin and aims of Project Tiger, then its salient features (reserves, core–buffer, NTCA, estimation, corridors), with results. Draw a map of tiger reserves.
Project Tiger was launched on 1 April 1973 at Corbett with nine reserves to save the tiger, whose numbers had fallen sharply because of hunting and habitat loss.
Salient features: (i) a network of tiger reserves, which has grown to 58 across 18 states (2026); (ii) a core–buffer design, with an inviolate core and a buffer for sustainable use and people's livelihoods; (iii) the National Tiger Conservation Authority, a statutory body since the 2006 amendment of the Wildlife Protection Act, with tiger conservation plans for each reserve; (iv) the All India Tiger Estimation every four years using camera traps, which counted at least 3,167 tigers in 2022 (about 75% of the world's wild tigers); (v) management effectiveness evaluation, M-STrIPES patrolling, voluntary relocation of villages and protection of corridors; (vi) international leadership through the Global Tiger Forum and the International Big Cat Alliance (2023).
Map: Map of India marking major tiger reserves (Corbett, Kanha, Bandhavgarh, Ranthambore, Sundarbans, Nagarhole, Kaziranga) and the main corridors.
Project Tiger has become a model of landscape conservation, though conflict and corridor loss remain challenges.
Example 28 (UPSC 2019, 10 marks): Discuss the problems of wildlife conservation and management in India.
Paper and question: Paper II, Q5(b)
Approach: Classify the problems of wildlife conservation and management (ecological, socio-economic, institutional) with Indian examples, and end with remedies. Draw a map of conflict hotspots.
India protects its wildlife through over a thousand protected areas covering about 5% of its land, but a dense human population around them creates serious problems.
Ecological problems: habitat loss and fragmentation by farms, mines, dams and linear infrastructure (highways and railways, where elephants are killed by trains in Assam and West Bengal); invasive species such as Lantana and Prosopis; and climate change affecting the Sundarbans and alpine species.
Socio-economic problems: human–wildlife conflict with elephants, tigers, leopards and wild boar causing deaths and crop losses; poaching and illegal trade in tiger parts, pangolin scales and rhino horn; and tension between relocation and the rights of forest dwellers under the Forest Rights Act (2006).
Institutional problems: staff shortages, weak intelligence and funding, poor inter-state coordination for corridors, and unregulated tourism.
Map: Map of India marking human–elephant conflict zones (Assam, Odisha, Jharkhand, Karnataka), tiger corridors and poaching hotspots.
Landscape-level planning, conflict compensation, community participation and stronger enforcement are needed.
Example 29 (UPSC 2018, 20 marks): Illustrate with suitable examples the endeavours undertaken in augmenting conservation of water and vegetation in India.
Paper and question: Paper II, Q6(a)
Approach: Illustrate the endeavours for water conservation and for vegetation conservation separately, covering government programmes, community movements and legal measures with named examples, and evaluate outcomes. Draw a map of the examples.
Water and vegetation are linked resources: forests regulate runoff and recharge, and water sustains vegetation. India has combined government programmes, community action and law to conserve both.
Water: government programmes: the Jal Shakti Abhiyan: Catch the Rain (since 2019), Mission Amrit Sarovar (2022) for ponds in every district, PMKSY with watershed development and 'Per Drop More Crop', the Atal Bhujal Yojana (2019) for community groundwater management, and Namami Gange (2014) for river rejuvenation.
Water: community efforts: Ralegan Siddhi and Hiware Bazar (Maharashtra) transformed by watershed management; Tarun Bharat Sangh's johads reviving the Arvari river (Rajasthan); Sukhomajri (Haryana), an early model of participatory watershed management; and Chennai's mandatory rooftop rainwater harvesting.
Vegetation: people's movements: Chipko (1973, Chamoli, Uttarakhand), Appiko (1983, Karnataka), the Bishnoi tradition of protecting khejri trees, and sacred groves of Meghalaya and Kerala.
Vegetation: programmes and law: Joint Forest Management (1990), the Green India Mission (2014), the CAMPA Act (2016) for compensatory afforestation, the Nagar Van Yojana (2020), MISHTI (2023) for mangroves, the Aravalli Green Wall project (2023) and the 'Ek Ped Maa Ke Naam' campaign (2024), backed by the Forest (Conservation) Act (1980).
Outcomes: forest and tree cover has risen to 25.17% of India's area (ISFR 2023), and many villages have seen water tables rise, but plantations often replace natural forest, and the quality of new water structures is uneven.
Map: Map of India marking Ralegan Siddhi, Hiware Bazar, Arvari, Sukhomajri, Chennai, Chipko and Appiko sites, and the Aravalli Green Wall.
These endeavours succeed best where communities own them and where water and forest conservation are planned together at the watershed scale.
Example 30 (UPSC 2016, 20 marks): Identify the important biotic resource regions of India and highlight their problems.
Paper and question: Paper II, Q3(a)
Approach: Define biotic resources, identify India's major biotic resource regions with their characteristic resources, and highlight the problems of each, ending with an integrated approach. Draw a map of biotic resource regions.
Biotic resources are living resources (forests, wildlife, fisheries, grasslands, genetic diversity) that supply timber, food, fodder, medicines and ecosystem services. Following the biogeographic zones of Rodgers and Panwar, India's main biotic resource regions and their problems are as follows.
(1) Himalaya: temperate conifers, oak forests, alpine pastures and medicinal herbs; problems include deforestation, overgrazing, landslides, hydropower and road construction, and climate-driven upward shifts of species.
(2) North-east: part of the Indo-Burma hotspot, with rich evergreen forests, bamboo, orchids and community forests; problems include shortening jhum cycles, timber extraction, hunting and dams.
(3) Western Ghats: evergreen forests, endemic amphibians and spices; problems include plantations, mining, hydroelectric projects, tourism and landslides, as at Wayanad in 2024.
(4) Central Indian deciduous forests: sal and teak forests and the largest tiger landscapes, with tendu and mahua as livelihood resources; problems include coal and iron mining, fragmentation and Left-wing extremism.
(5) Thar desert and semi-arid grasslands: khejri, desert fauna and the critically endangered great Indian bustard; problems include overgrazing, power lines and conversion of grasslands to farms and solar parks.
(6) Coasts, mangroves and seas: the Sundarbans, fisheries and coral reefs; problems include aquaculture conversion, overfishing, pollution and sea-level rise. (7) Islands: unique endemic species of the Andaman and Nicobar Islands and Lakshadweep; problems include invasive species and large projects such as the Great Nicobar development.
Map: Map of India showing the biotic resource regions: Himalaya, north-east, Western Ghats, central India, Thar, coasts and islands.
Region-specific conservation that combines protected areas with the livelihoods of local communities is essential for sustainable use.
Example 31 (UPSC 2015, 15 marks): Outline the Government of India's strategies of conservation of the Western Ghats.
Paper and question: Paper II, Q8(c)
Approach: State why the Western Ghats need conservation, then outline the Government's strategies (expert committees and ESA notifications, protected areas and biosphere reserves, World Heritage listing, species and landscape programmes), with an assessment. Draw a map of the Western Ghats with protected areas.
The Western Ghats, running about 1,600 km from Gujarat to Kerala, form part of a global biodiversity hotspot (Western Ghats–Sri Lanka) and are the water tower of Peninsular India, yet they face mining, plantations, dams, roads, tourism and landslides.
Expert committees and ESA: the Gadgil committee (Western Ghats Ecology Expert Panel, 2011) recommended treating the whole range as ecologically sensitive, divided into three zones with graded restrictions. The Kasturirangan committee (High-Level Working Group, 2013) proposed about 37% of the area, mostly natural landscape, as an Ecologically Sensitive Area. The Ministry of Environment has issued successive draft ESA notifications based on it, the latest in 2024, but final notification is pending because of state objections.
Protected areas: national parks and sanctuaries such as Silent Valley, Periyar, Eravikulam, Bandipur, Nagarhole and Kudremukh; the Nilgiri Biosphere Reserve (1986, India's first) and the Agasthyamala Biosphere Reserve.
International status: 39 sites were inscribed as a UNESCO World Heritage Site in 2012.
Species and landscape programmes: Project Tiger and Project Elephant reserves, eco-sensitive zones around protected areas, and conservation of sacred groves and of river catchments.
Assessment: the area under protection has grown, but the delay in notifying the ESA, weak regulation of quarrying and tourism, and the 2024 Wayanad landslides show that implementation lags.
Map: Map of the Western Ghats from the Tapi to Kanyakumari marking Silent Valley, Periyar, Nilgiri and Agasthyamala biosphere reserves and the proposed ESA belt.
Balancing local livelihoods with ecological limits through participatory zoning remains the key to conserving the Ghats.
Example 32 (UPSC 2014, 10 marks): Why has agro and social forestry has failed to achieve its objectives?
Paper and question: Paper II, Q1(e)
Approach: State the objectives of social and agro-forestry, then explain why they fell short (species choice, beneficiaries, participation, markets and regulation), ending with what is changing. Draw a diagram of objectives versus outcomes.
Social forestry, recommended by the National Commission on Agriculture (1976), and agroforestry aimed to grow trees on village commons, roadsides and farms to meet rural needs for fuelwood, fodder and small timber and to reduce pressure on natural forests.
Reasons for failure: (i) wrong species: fast-growing eucalyptus monocultures were planted for the pulp and pole market rather than fodder and fuel trees for the poor; (ii) benefits captured by the better-off: large farmers gained from farm forestry, as in Gujarat and Karnataka in the 1980s, while the landless lost access to commons; (iii) top-down approach: forest departments planted with little community participation, so survival and protection were poor; (iv) market and regulatory barriers: gluts depressed eucalyptus prices, and restrictions on felling and transit discouraged farmers; (v) ecological concerns over water use and the loss of grazing land.
Diagram: Two-column diagram contrasting the objectives (fuel, fodder, commons, the poor) with the outcomes (eucalyptus, commercial timber, rich farmers).
Joint Forest Management and the National Agroforestry Policy (2014) now seek participatory, need-based tree farming.
Example 33 (UPSC 2014, 15 marks): Suggest the measures of wild-life conservation with reference to extinction of rare species.
Paper and question: Paper II, Q2(b)
Approach: Explain the causes of extinction risk with Indian rare species, then suggest measures (in situ, ex situ, legal, community, scientific) with examples of success, and conclude. Draw a map of rare species and their habitats.
Many Indian species are threatened with extinction, among them the great Indian bustard, the Gyps vultures, the sangai deer of Manipur, the Gangetic dolphin and the pygmy hog. The main drivers are habitat loss, poaching, pollution, toxic veterinary drugs, power lines and climate change.
In situ measures: protect and restore habitats through over a thousand protected areas, community and conservation reserves, and corridors; and run species programmes such as Project Tiger (1973), Project Elephant (1992), Project Snow Leopard, Project Dolphin and Project Cheetah (Kuno, 2022). The Asiatic lion of Gir has recovered to about 891 animals (Gujarat census, 2025), and the one-horned rhino has recovered in Kaziranga.
Ex situ measures: conservation breeding of vultures (Pinjore), the great Indian bustard (Jaisalmer), the pygmy hog (Assam) and gharials, along with gene banks such as LaCONES (Hyderabad) and seed banks.
Legal and enforcement measures: strengthening the Wildlife (Protection) Act (1972, amended 2022 in line with CITES), action by the Wildlife Crime Control Bureau, bans on harmful drugs, and undergrounding of power lines in bustard habitat.
Community and science: support Bishnoi-style traditions, community reserves such as Khonoma (Nagaland), compensation for conflict, and population monitoring.
Map: Map of India marking Gir, Kaziranga, Kuno, Keibul Lamjao (sangai), the Desert National Park (bustard) and Pinjore.
Combining habitat protection, captive breeding and local stewardship offers the best chance of saving rare species.
Mains points
- Resource questions are data-driven: quote the latest CGWB groundwater assessment (2025), CEA/MNRE installed capacity, the GSI coal inventory and ISFR 2023, always with year and source.
- Energy questions now centre on the transition: India's Paris commitments (updated NDC 2022, net zero by 2070), 500 GW non-fossil target, solar parks, green hydrogen and the constraints of land, storage and grid.
- Conservation questions expect named programmes with years (Project Tiger 1973, Wildlife Protection Act 1972, NGT Act 2010, Vulture Action Plan 2020–25, Atal Bhujal Yojana 2019) and a critical view of their outcomes.
- Link resources to geology and location: mineral belts to rock systems, coalfields and thermal plants to transport costs, coastal location to wind, tidal and blue-economy potential.
- Maps are expected: groundwater stress, mineral belts, coalfields and pithead plants, solar and wind zones, tiger reserves, coral reefs and the Western Ghats.
Did you know?
- India extracts more groundwater than any other country, about 247 billion cubic metres a year (CGWB, 2025), more than the United States and China combined, by most estimates.
Geography Optional: All chapters
- Exam Pattern, Syllabus and Strategy
- The Earth's Interior and Tectonics
- Geomorphic Processes and Landscape Development
- Climatology: Atmosphere and Circulation
- Climatology: Weather Systems, Climates and Climate Change
- Oceanography
- Biogeography
- Environmental Geography
- Perspectives in Human Geography
- Economic Geography
- Population Geography
- Settlement Geography
- Regional Planning
- Models, Theories and Laws in Human Geography
- India: Physical Setting I
- India: Physical Setting II
- Resources of India
- Agriculture in India
- Industry in India
- Transport, Communication and Trade
- Cultural Setting and Population of India
- Settlements in India
- Regional Development and Planning in India
- Political Aspects
- Contemporary Issues
- Places for the Map Question