
Geography Optional · UPSC Notes
Transport, Communication and Trade — UPSC Geography Optional Notes
Free, exam-focused notes for UPSC Prelims and Mains, with Prelims tips and Mains points for every topic. 4 topics.
Open in the interactive reader: bookmarks, progress tracking and read-aloud.
Transport Networks and Regional Development
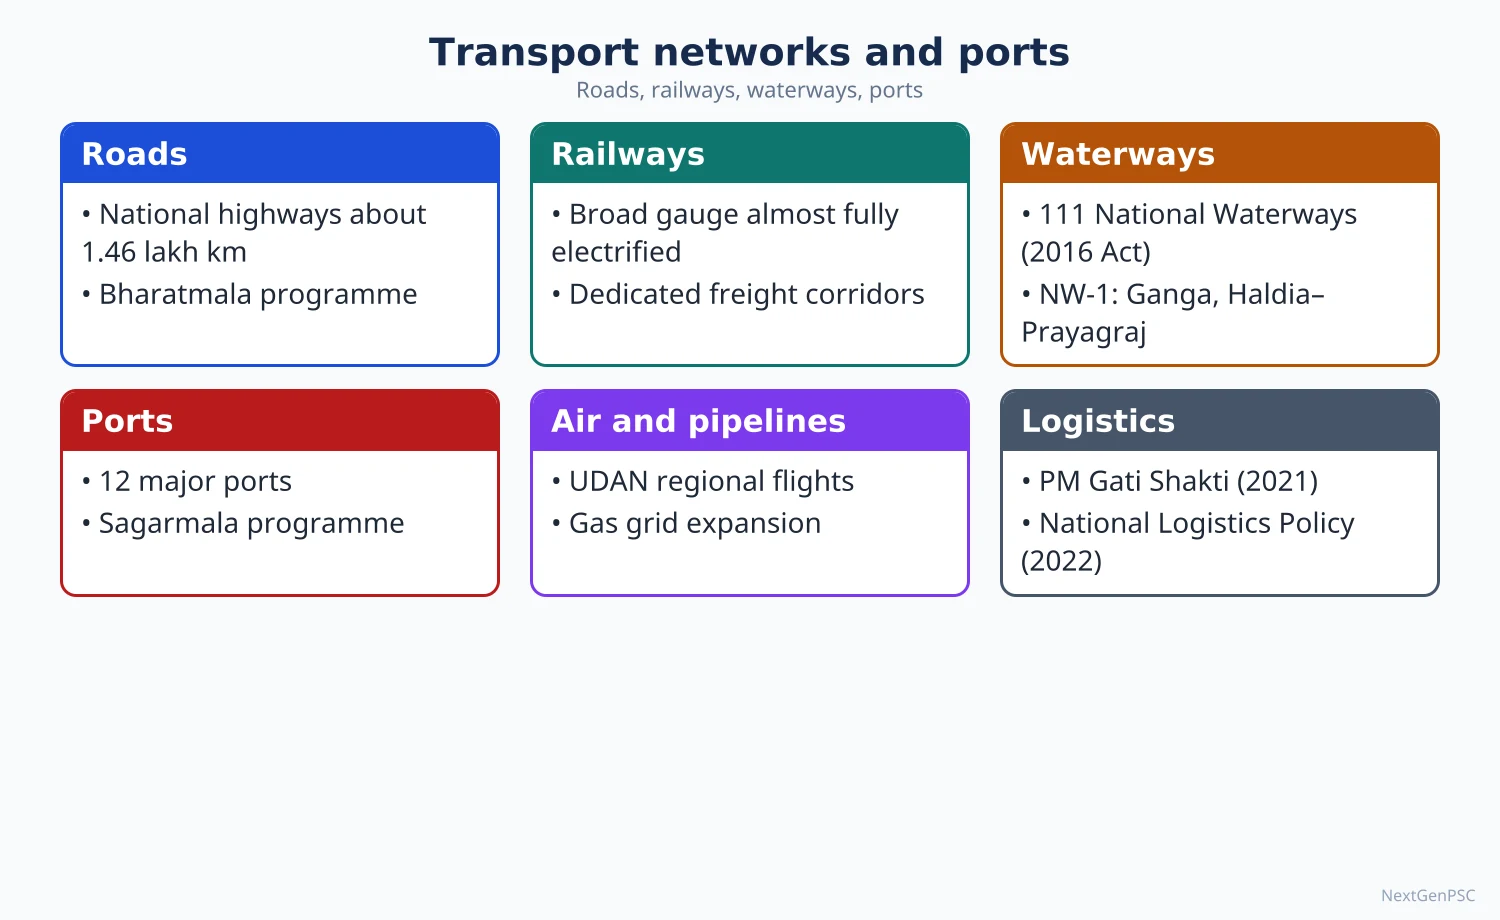
India has the world's second-largest road network (national highways about 1.47 lakh km in 2026), one of the largest railway systems (broad gauge about 99.6% electrified by mid-2026), a fast-growing inland waterway sector (218 million tonnes of cargo in 2025–26), expanding air connectivity and a national pipeline grid. Each mode has a distinct role: roads for short distances and last-mile links, rail for bulk and long-haul freight and mass passenger traffic, waterways and pipelines for bulk, low-cost movement, and airways for speed. PM Gati Shakti (2021) and the National Logistics Policy (2022) aim to integrate them, cut logistics costs and connect lagging regions.
In simple words
Transport is the blood circulation of a country: roads are the small veins reaching every village, railways are the big arteries, and pipelines and waterways carry heavy loads cheaply.
When all of them work together, goods move faster and cost less; this is multimodal transport.
Regions without good transport, like parts of the North-East, stay poor and isolated.
UPSC asks about the pattern of networks, their complementary roles and how they promote balanced regional development.
1. Concepts and Definitions
Transport network: a set of nodes (cities, ports, junctions) connected by links (roads, rail lines, waterways, air routes, pipelines); its structure is studied through density, connectivity and accessibility.
Accessibility and connectivity: accessibility is the ease of reaching a place from others; connectivity is the degree to which nodes are linked directly; both are central to regional development.
Ullman's bases of spatial interaction (Edward Ullman, 1956): complementarity (surplus in one place, demand in another), intervening opportunity and transferability (distance and cost) explain why flows occur.
Modal split: the share of traffic carried by each mode; in India road transport carries the largest share of freight and passengers, while rail's freight share has declined over decades; the National Rail Plan (2020) targets raising rail's freight share to 45% by 2030.
Logistics cost: estimated at about 8–9% of GDP for 2021–22 (NCAER study for DPIIT, 2023), higher than in many developed economies; India ranked 38th in the World Bank Logistics Performance Index 2023.
2. Road Network
Size: over 63 lakh km of roads, the world's second largest (MoRTH); national highways about 1,46,560 km in March 2026, up from about 91,287 km in 2014 (MoRTH statement); about 3,050 km of access-controlled expressways and high-speed corridors operational by end-2025.
Hierarchy: national highways (about 2% of road length but about 40% of traffic), state highways, district roads, rural roads (Pradhan Mantri Gram Sadak Yojana, 2000) and urban roads.
Programmes: National Highways Development Project (Golden Quadrilateral linking Delhi, Mumbai, Chennai and Kolkata; North–South and East–West corridors), Bharatmala Pariyojana (2017; about 22,590 km of the 34,800 km phase I completed by March 2026), expressways such as Delhi–Mumbai and Mumbai–Nagpur (Samruddhi), and border roads (Border Roads Organisation, Vibrant Villages Programme 2023).
Strategic mountain links: Atal Tunnel (Rohtang, 2020), Sela Tunnel (Arunachal Pradesh, 2024), Zojila Tunnel (under construction), Char Dham all-weather road.
Strengths and problems: door-to-door flexibility and last-mile reach; but congestion, accidents (India has among the highest road deaths in the world), pollution and high fuel use per tonne-km.
3. Railway Network
Size and electrification: one of the world's largest networks with about 70,000 route km of broad gauge; about 99.6% of broad gauge electrified by mid-2026 (Lok Sabha reply, July 2026; about 70,002 of 70,271 route km by 31 May 2026); about 741 crore passenger journeys in 2025–26 (Ministry of Railways).
Uni-gauge and new lines: Project Unigauge converted most metre and narrow gauge lines; heritage hill railways (Darjeeling, Nilgiri, Kalka–Shimla) form a UNESCO World Heritage Site; Konkan Railway (1998) crossed the Western Ghats coast; the Udhampur–Srinagar–Baramulla Rail Link including the Chenab bridge, the world's highest railway arch bridge, opened in 2025.
Dedicated Freight Corridors: Eastern DFC (Ludhiana to Sonnagar, about 1,337 km, carrying coal and steel) and Western DFC (Dadri to JNPT, about 1,506 km, carrying containers), largely commissioned by 2025.
High-speed and semi-high-speed: Mumbai–Ahmedabad High Speed Rail (508 km, under construction with Japanese assistance), Vande Bharat trains, Namo Bharat regional rapid transit (Delhi–Meerut).
Regional role: moves coal from the eastern coalfields to power plants, iron ore to ports and steel plants, foodgrains from Punjab to deficit states, and long-distance migrant labour; network density is highest in the plains and lowest in the Himalaya and North-East.
4. Waterways, Airways and Pipelines
Inland waterways: 111 National Waterways declared under the National Waterways Act 2016, of which about 32 were operational in March 2026; cargo reached about 218 million tonnes in 2025–26, up from about 146 MT in 2024–25 and exceeding the Maritime India Vision 2030 target (Ministry of Ports, Shipping and Waterways, October 2026).
Key waterways: NW-1 Ganga (Haldia–Prayagraj, about 1,620 km; Jal Marg Vikas Project with terminals at Varanasi, Sahibganj and Haldia), NW-2 Brahmaputra (Dhubri–Sadiya, 891 km), NW-3 West Coast Canal (Kottapuram–Kollam, 205 km); the Indo-Bangladesh Protocol route links the North-East to Kolkata.
Coastal shipping: under Sagarmala (2015) coastal cargo is promoted to shift bulk goods such as coal from roads and rail.
Airways: India is among the world's largest domestic aviation markets; airports increased to over 150 operational ones by 2025; the UDAN regional connectivity scheme (2016) links smaller cities such as Darbhanga, Jharsuguda and Pakyong; Navi Mumbai and Noida (Jewar) airports expand metropolitan capacity.
Pipelines: crude oil pipelines (Salaya–Mathura, Paradip–Haldia–Barauni), product pipelines and a natural gas grid of over 25,000 km (One Nation One Gas Grid, Hazira–Vijaipur–Jagdishpur, Pradhan Mantri Urja Ganga to eastern India, Indradhanush grid in the North-East); the Kandla–Gorakhpur LPG pipeline is under construction; pipelines are cheap, safe and continuous but costly to build and inflexible.
5. Complementary Roles and Integration
Division of labour: roads for short-haul and feeder traffic; rail for bulk and long-distance freight and mass passenger travel; waterways and coastal shipping for bulk, low-value cargo; pipelines for oil and gas; air for passengers, perishables and high-value goods.
Multimodal integration: multimodal logistics parks, inland container depots (e.g. Tughlakabad, Dadri), Gati Shakti cargo terminals, port–rail connectivity under Sagarmala, and the Unified Logistics Interface Platform (ULIP).
PM Gati Shakti National Master Plan (13 October 2021): a GIS-based platform integrating infrastructure planning of ministries; National Logistics Policy (17 September 2022) aims to bring logistics costs down to global benchmarks.
Example of complementarity: coal from Talcher moves by rail to Paradip port, by coastal ship to Tamil Nadu power plants, and electricity flows by transmission lines, reducing road congestion.
6. Transport and Regional Development
Positive role: transport widens markets, lowers costs, attracts industry, supports agriculture (mandis and cold chains), tourism and labour mobility, and integrates remote regions; rural roads under PMGSY have been linked in studies to higher farm incomes and school enrolment.
Lagging regions: the North-East, Himalayan districts, central tribal belts and island territories have low network density; projects like Bogibeel bridge (Assam, 2018), new rail lines to state capitals (Aizawl via Bairabi–Sairang line, opened 2025) and the Kaladan multimodal project try to end isolation.
Corridor effects: the Golden Quadrilateral and DFCs have attracted industry and warehousing along their routes, but can also deepen core–periphery contrasts if feeder links are weak.
Negative effects: habitat fragmentation by highways in tiger corridors, displacement, landslides from hill road cutting (Char Dham debate), and urban sprawl along expressways.
7. Theory and Models
Taaffe, Morrill and Gould (1963): the ideal-typical sequence of transport development in developing countries: scattered ports → penetration lines to the interior → feeder development → interconnection → high-priority 'main streets'; Indian colonial railways from Bombay, Calcutta and Madras fit the early stages.
Kansky's graph-theoretic indices (Kansky, 1963): beta index (links ÷ nodes), alpha index (actual circuits ÷ maximum circuits), gamma index (actual links ÷ maximum links), used to compare network connectivity of Indian states.
Vance's mercantile model (1970): settlement and transport grow from external trade at ports inland, explaining colonial port-city dominance.
Transport as social overhead capital: Hirschman (1958) saw infrastructure as a precondition for growth; the debate is whether transport leads development or follows demand; Indian evidence suggests both, depending on the region.
8. Maps and Diagrams to Draw
National network map: Golden Quadrilateral and NS–EW corridors, major expressways, Eastern and Western DFCs, NW-1, NW-2 and NW-3, and main gas pipelines.
North-East connectivity map: Siliguri Corridor, Bogibeel bridge, Sela tunnel, new rail lines to Aizawl and other capitals, Indo-Bangladesh Protocol route and the Kaladan project.
Taaffe model diagram: four stages from coastal ports to an interconnected network.
Kansky example: a small network of five nodes and six links with alpha, beta and gamma calculated.
9. Using It in the Exam
10 marks: complementary roles of transport modes with examples.
15 marks: role of inland waterways or DFCs in regional development with data and a map.
20 marks: transport networks and regional development: pattern, density differences, models (Taaffe, Kansky), current programmes (Bharatmala, DFC, Gati Shakti), lagging regions, with maps.
Keywords: accessibility, connectivity, modal split, multimodal logistics, DFC, Gati Shakti, logistics cost, Taaffe model, Kansky indices.
Attributed idea: Ullman (1956) explained spatial interaction by complementarity, intervening opportunity and transferability.
| Mode | Latest figure | Date and source | Main role |
|---|---|---|---|
| National highways | About 1,46,560 km | March 2026, MoRTH | Inter-city freight and passengers, last-mile links |
| Railways (broad gauge) | About 70,271 route km, about 99.6% electrified | Mid-2026, Ministry of Railways | Bulk freight, mass passenger traffic |
| Inland waterways | About 218 million tonnes cargo; 111 NWs | 2025–26, MoPSW | Bulk, low-cost cargo |
| Major ports (link to hinterland) | About 855 million tonnes | 2024–25, MoPSW | Gateway for foreign trade |
| Natural gas pipelines | Over 25,000 km | Recent PNGRB/MoPNG data | Gas for fertiliser, power, city gas |
| Airways | Over 150 operational airports | 2025 | Fast passenger and high-value cargo |
Mains points
- Questions often ask about complementary roles of transport modes, the importance of DFCs, inland waterways, or the role of transport in regional development of the North-East.
- Organise answers mode-wise with current data and year, then show integration (Gati Shakti, NLP, multimodal parks).
- Draw a network map; for North-East questions draw a connectivity map with the Siliguri Corridor.
- Use models: Taaffe–Morrill–Gould, Kansky indices, Ullman's interaction bases.
- Discuss limits: modal imbalance towards roads, logistics costs, environmental impacts of highways in hills and forests.
- Common mistake: quoting old network lengths (e.g. 1.32 lakh km NH) or ignoring pipelines and waterways.
Did you know?
- The Chenab rail bridge in Jammu and Kashmir, opened in 2025, stands about 359 m above the river bed, higher than the Eiffel Tower.
Ports, Foreign Trade, Trade Policy and Export Processing Zones
About 95% of India's trade by volume and around 70% by value moves through seaports; the 12 major ports handled about 855 million tonnes in 2024–25, while private non-major ports such as Mundra have grown even faster. In 2025–26 India's total exports of goods and services reached about USD 860 billion, but merchandise imports (about USD 775 billion) far exceeded merchandise exports (about USD 442 billion), leaving an overall trade deficit of about USD 119 billion after services. The Foreign Trade Policy 2023, new free trade agreements and port projects (Vadhavan, Vizhinjam, Galathea Bay) aim to raise exports, while EPZs, EOUs and SEZs provide export enclaves.
In simple words
Ports are India's front doors to the world: oil, gold and electronics come in, and medicines, engineering goods, rice and software services go out.
When we buy more than we sell, we have a trade deficit, like a family spending more than it earns.
India is building bigger, deeper ports and signing trade deals to sell more abroad.
UPSC asks about the growing importance of ports, the pattern of trade, trade balance and trade policy.
1. Concepts and Definitions
Port: a place on a coast or river with facilities for ships to load and unload; a harbour is the sheltered water area; ports serve a hinterland (land area served) and a foreland (overseas areas connected).
Major and non-major ports: major ports are under the Union Government (governed by the Major Port Authorities Act 2021); non-major ports are under state maritime boards and include large private ports (Mundra, Krishnapatnam, Dhamra, Hazira, Pipavav).
Balance of trade: value of exports minus imports of goods (merchandise); including services gives the overall trade balance; it is part of the current account of the balance of payments.
Composition and direction of trade: composition is what is traded (commodities and services); direction is with whom (partner countries and regions).
Trade policy: government measures on tariffs, export incentives, import controls and trade agreements; India's Foreign Trade Policy is announced under the Foreign Trade (Development and Regulation) Act 1992.
EPZ, EOU, SEZ: Export Processing Zones (from Kandla, 1965), Export Oriented Units (scheme from 1981, can be anywhere), and Special Economic Zones (policy 2000, Act 2005) are instruments to promote exports through duty-free production.
2. Ports of India
Major ports (12): west coast: Deendayal (Kandla, Gujarat), Mumbai, Jawaharlal Nehru Port Authority (Nhava Sheva, Maharashtra), Mormugao (Goa), New Mangalore (Karnataka), Cochin (Kerala); east coast: V.O. Chidambaranar (Tuticorin, Tamil Nadu), Chennai, Kamarajar (Ennore, Tamil Nadu), Visakhapatnam (Andhra Pradesh), Paradip (Odisha), Syama Prasad Mookerjee Port (Kolkata–Haldia, West Bengal).
Performance 2024–25: major ports handled about 855 million tonnes, up 4.3% (Ministry of Ports, Shipping and Waterways); petroleum products about 30%, containers about 23% and coal about 22% of cargo; Paradip and Deendayal each crossed 150 MT; JNPA handled a record 7.3 million TEUs.
Private and state ports: Mundra (Gujarat) is India's largest commercial port by cargo (about 200 MT in 2024–25); Gujarat's ports together handle the largest share of national cargo because of proximity to north-western hinterlands and Gulf routes.
New projects: Vizhinjam International Seaport (Kerala, deep-water transshipment port commissioned in May 2025, near international shipping lanes), Vadhavan (Maharashtra, approved June 2024 at about ₹76,220 crore, planned as one of the world's top ten container ports), the proposed International Container Transshipment Port at Galathea Bay (Great Nicobar).
Geography of ports: the west coast has natural harbours and submergent features (Mumbai, Mormugao, Kochi); the east coast is emergent with shallow waters, so ports such as Chennai and Visakhapatnam (a land-locked harbour protected by Dolphin's Nose) are artificial or naturally sheltered; river ports like Kolkata face siltation and need dredging (Haldia developed downstream).
3. Growing Importance of Ports
Trade gateway: about 95% of trade by volume and about 70% by value move by sea (MoPSW); rising containerisation and larger ships require deep drafts and efficient terminals.
Port-led development: Sagarmala (2015) aims at port modernisation, port connectivity, port-led industrialisation (Coastal Economic Zones) and coastal community development; Maritime India Vision 2030 (2021) and Amrit Kaal Maritime Vision 2047 (2023) set long-term targets.
Transshipment: much Indian container cargo was transshipped at Colombo, Singapore and Dubai; Vizhinjam and Galathea Bay aim to capture this business.
Hinterland linkages: the Western DFC to JNPA and Mundra, the Eastern DFC towards Kolkata, and inland waterways NW-1 to Haldia connect ports with industrial and agricultural hinterlands.
Strategic role: ports support the navy, energy imports and India's Indian Ocean presence; Chabahar (Iran, Indian operation of Shahid Beheshti terminal under a 10-year agreement signed in 2024) gives access to Afghanistan and Central Asia.
4. Foreign Trade: Composition, Direction and Balance
Volume 2025–26: total exports of goods and services about USD 860.09 billion (up 4.22%); merchandise exports about USD 441.78 billion; merchandise imports about USD 774.98 billion; services exports about USD 418.31 billion; overall trade deficit about USD 119.30 billion, up from USD 94.66 billion in 2024–25 (Department of Commerce, April 2026).
Export composition: engineering goods, petroleum products (refined from imported crude at Jamnagar and elsewhere), electronics (especially smartphones), drugs and pharmaceuticals, gems and jewellery, organic chemicals, rice, marine products, textiles and apparel; services exports (IT, business services) are a major strength.
Import composition: crude oil and petroleum, electronics and components, gold, coal, machinery, chemicals, edible oils, fertilisers and pulses.
Direction: the USA is the largest export destination; China is the largest source of imports with a large bilateral deficit; the UAE, Netherlands, Saudi Arabia, Russia (major oil supplier since 2022), Singapore and the UK are important partners; trade with Africa and Latin America is rising.
Trade balance issues: persistent merchandise deficits arise from oil, gold and electronics imports; services surplus and remittances partly offset them; US tariff increases on many Indian goods in 2025 and West Asian disruptions in 2026 affected exports.
5. Trade Policy and Agreements
Phases: import substitution and quantitative restrictions until 1991; liberalisation after 1991 (rupee devaluation, tariff cuts, removal of import licensing); WTO membership from 1995.
Foreign Trade Policy 2023 (effective 1 April 2023, without a fixed end date): aims at USD 2 trillion of goods and services exports by 2030; shifts from incentives to remission (RoDTEP), Districts as Export Hubs, e-commerce exports, rupee trade settlement and amnesty schemes.
Free trade agreements: India–UAE CEPA (2022), India–Australia ECTA (2022), India–EFTA Trade and Economic Partnership Agreement (signed 2024, in force from 1 October 2025), India–UK Comprehensive Economic and Trade Agreement (signed July 2025); India stayed out of RCEP (2019) citing concerns over Chinese imports.
Export infrastructure: Trade Infrastructure for Export Scheme, logistics reforms (Gati Shakti, NLP 2022) and export promotion councils.
6. EPZs, EOUs and SEZs
EPZs: Kandla (1965), SEEPZ Mumbai (1973), then Falta, Noida, Chennai, Cochin and Visakhapatnam (1980s); they suffered from small size, poor infrastructure and bureaucratic controls.
EOUs (1981): export-oriented units allowed anywhere with duty-free inputs; widely used by IT, gems and textiles firms.
Conversion to SEZs (2000) and SEZ Act 2005: 368 notified and 277 operational SEZs as of 31 March 2026 (SEZ India fact sheet); exports of about ₹11.70 lakh crore in April–December 2025; concentrated in southern and western states.
Assessment: EPZs and SEZs boosted IT and some manufacturing exports but showed enclave characteristics, land conflicts and uneven regional spread (details in Chapter 19).
7. Theory and Debates
Comparative advantage (David Ricardo, 1817) and Heckscher–Ohlin: India's services and labour-intensive manufacturing exports reflect skill and labour endowments, but India underperforms in mass labour-intensive manufacturing compared with Bangladesh and Vietnam.
Prebisch–Singer hypothesis (1950): terms of trade of primary exporters decline relative to manufactures; India's shift from primary to manufactured and service exports reduces this vulnerability.
Gravity model of trade: trade between two countries is proportional to their economic size and inversely related to distance; it explains strong trade with the Gulf and East Asia and weaker trade with Latin America.
Anyport model (James Bird, 1963): ports evolve from a primitive setting through marginal quay extension and elaboration to specialised deep-water terminals away from the old city; Mumbai's shift to JNPA and Kolkata's to Haldia illustrate this.
Openness debate: supporters of FTAs stress market access and investment; critics point to rising deficits with ASEAN and China and caution on agricultural and dairy liberalisation.
8. Maps and Diagrams to Draw
Ports map: mark all 12 major ports and key non-major ports (Mundra, Pipavav, Hazira, Krishnapatnam, Dhamra, Gangavaram), plus Vadhavan, Vizhinjam and Galathea Bay; show hinterlands with arrows.
Trade direction map: flow lines from India to the USA, UAE, China, EU, Russia, Singapore with line thickness proportional to trade value.
Bar chart: merchandise exports, merchandise imports and services exports for 2024–25 and 2025–26.
Anyport diagram: stages of port evolution from the old city quay to modern container terminals downstream.
9. Using It in the Exam
10 marks: growing importance of ports in India's trade, with data and a map.
15 marks: composition and direction of India's foreign trade and the reasons for the trade deficit.
20 marks: trade policy since 1991 and its geographic implications: ports, SEZs, FTAs, regional concentration of exports (Gujarat, Maharashtra, Tamil Nadu), with maps and current data.
Keywords: hinterland and foreland, major ports, transshipment, containerisation, balance of trade, FTP 2023, RoDTEP, CEPA, EPZ to SEZ.
Attributed idea: Bird's Anyport model (1963) explains why modern port activity moves downstream from historic city centres to deep-water sites.
| Item | 2024–25 | 2025–26 | Source |
|---|---|---|---|
| Total exports (goods and services) | About 825.26 | About 860.09 | Department of Commerce, April 2026 |
| Merchandise exports | About 437.70 | About 441.78 | Department of Commerce |
| Merchandise imports | About 721.20 | About 774.98 | Department of Commerce |
| Services exports | Not quoted here | About 418.31 (estimate) | Department of Commerce |
| Overall trade deficit (goods and services) | About 94.66 | About 119.30 | Department of Commerce |
| Coast | Port | State | Notable feature |
|---|---|---|---|
| West | Deendayal (Kandla) | Gujarat | Tidal port; crossed 150 MT in 2024–25 |
| West | JNPA (Nhava Sheva) | Maharashtra | Largest container port among major ports |
| West | Mormugao | Goa | Iron ore exports |
| West | Cochin | Kerala | Natural harbour; Vallarpadam terminal |
| East | Visakhapatnam | Andhra Pradesh | Deep, land-locked harbour |
| East | Paradip | Odisha | Coal and iron ore; crossed 150 MT in 2024–25 |
| East | Syama Prasad Mookerjee (Kolkata–Haldia) | West Bengal | Riverine port with siltation |
| East | V.O. Chidambaranar (Tuticorin) | Tamil Nadu | Southern gateway |
Mains points
- Questions ask about the growing importance of ports, west vs east coast ports, composition and direction of trade, trade deficit, and trade policy since 1991.
- Use the latest data with source: major ports 855 MT (2024–25), trade figures for 2025–26 (Department of Commerce), SEZ data (31 March 2026).
- Always draw a ports map with hinterlands; add Vadhavan, Vizhinjam and Galathea Bay to show awareness of new projects.
- Explain the physical basis of port location (submergent west coast, emergent east coast, river siltation at Kolkata).
- Link trade to geography: oil imports and Gujarat refineries, Russia oil shift, China electronics, US market and tariffs.
- Common mistake: confusing merchandise trade deficit with overall trade deficit; state which one you quote.
Did you know?
- Visakhapatnam's harbour is protected by a rocky headland called the Dolphin's Nose, which shelters ships from the open Bay of Bengal.
Communication, Information Technology and the Indian Space Programme
India's communication revolution has given it about 1.35 billion telephone subscribers and nearly 1.1 billion broadband connections (TRAI, July 2026), the world's largest real-time digital payment system (UPI) and a globally important IT–BPM industry concentrated in Bengaluru, Hyderabad, Pune, Chennai and NCR. These networks have compressed time and space, transformed governance, finance and services, but a digital divide persists by region, gender and income. The Indian space programme, from Aryabhata (1975) to Chandrayaan-3's lunar south-pole landing (2023), Aditya-L1 and NISAR (2025), supplies remote sensing, communication and navigation that underpin planning, agriculture and disaster management, and is preparing for human spaceflight (Gaganyaan).
In simple words
A mobile phone today lets a farmer check prices, a student attend classes and a shopkeeper receive payment in seconds.
Telecom towers, optical fibre and satellites make this possible, like invisible roads for information.
India's space programme launches satellites that watch crops, warn about cyclones and guide navigation.
UPSC asks how communication and IT have changed the economy and society, where IT is concentrated, and what the space programme contributes.
1. Concepts and Definitions
Communication: transmission of information through postal services, telecommunication (telephone, mobile, internet), mass media (print, radio, television) and digital platforms.
Information and communication technology (ICT): hardware, software, networks and services for creating, storing and transmitting information; the IT–BPM industry includes software services, business process management, engineering services and Global Capability Centres.
Time–space compression (David Harvey, 1989): technology shrinks the time needed to overcome distance, changing the geography of production and social life.
Network society and space of flows (Manuel Castells, 1996): economic activity is organised through flows of information between connected nodes rather than only through physical places.
Digital divide: unequal access to and use of digital technologies between regions, rural and urban areas, genders, income groups and age groups.
Remote sensing and GIS: acquisition of information about the Earth from satellites and aircraft, and its analysis in geographic information systems; central to modern geography and planning.
2. Telecommunication and Digital Networks
Subscribers: about 1,354 million telephone subscribers and about 1,094 million broadband subscribers (including machine-to-machine) at the end of July 2026, almost all wireless (TRAI press release, August 2026).
Milestones: telecom liberalisation (National Telecom Policy 1994 and 1999), the mobile boom of the 2000s, cheap 4G data after 2016, 5G launch on 1 October 2022 and rapid 5G rollout; the Telecommunications Act 2023 replaced the Indian Telegraph Act 1885.
Rural connectivity: BharatNet (begun as the National Optical Fibre Network in 2011) aims to connect all gram panchayats with optical fibre; the amended BharatNet programme (2023) focuses on last-mile connections; Universal Service Obligation Fund (now Digital Bharat Nidhi).
Digital public infrastructure: Aadhaar (biometric identity), UPI (2016; monthly transactions crossed 20 billion in 2025, per NPCI), DigiLocker, CoWIN, ONDC (2022) and the Account Aggregator framework; India promoted the DPI model during its G20 presidency (2023).
Data and regulation: Digital Personal Data Protection Act 2023; data centres cluster in Mumbai–Navi Mumbai, Chennai, Hyderabad and NCR because of power, submarine cable landing points and markets.
Submarine cables: landing stations at Mumbai and Chennai (plus Kochi, Tuticorin and Thiruvananthapuram), and the Chennai–Andaman and Nicobar cable (2020) and Kochi–Lakshadweep cable (2024) bringing high-speed internet to islands.
3. IT Industry and Its Geography
Size: India's IT–BPM industry earned roughly USD 280 billion in 2024–25 according to NASSCOM estimates, most of it from exports, and employs over five million people directly.
Location factors: skilled English-speaking graduates, engineering colleges, early state support (Software Technology Parks of India, 1991), airport and fibre connectivity, quality of life, agglomeration of firms and venture capital; low transport costs make the industry footloose but highly clustered.
Major hubs: Bengaluru ('Silicon Valley of India'), Hyderabad (HITEC City, Cyberabad), Pune (Hinjewadi), Chennai (OMR IT corridor), NCR (Gurugram, Noida), Mumbai–Navi Mumbai and Kolkata (Salt Lake Sector V); tier-2 growth in Coimbatore, Kochi (Infopark), Thiruvananthapuram (Technopark), Bhubaneswar, Indore, Jaipur, Ahmedabad (GIFT City) and Chandigarh–Mohali.
Global Capability Centres: over 1,500 GCCs of multinational firms, concentrated in Bengaluru and Hyderabad, have moved India up the value chain into R&D and engineering services.
Electronics and semiconductors: India Semiconductor Mission (2021), smartphone manufacturing hubs (Noida, Sriperumbudur, Hosur), and the IndiaAI Mission (2024) for compute capacity and AI applications.
4. Impacts on Economy and Society
Economy: services-led growth and exports; fintech and financial inclusion (Jan Dhan–Aadhaar–Mobile trinity); e-commerce and logistics; MSME access to markets (GeM public procurement portal, ONDC); new urban growth in IT corridors and rising real estate values.
Governance: direct benefit transfer reducing leakages, e-governance (e-courts, land records, PM Gati Shakti GIS), and digital health (eSanjeevani telemedicine, Ayushman Bharat Digital Mission).
Society: rural–urban information flows, farmers' access to prices (e-NAM, weather advisories), online education, women's mobility in digital work, and the gig and platform economy (NITI Aayog, 2022, estimated 7.7 million gig workers in 2020–21, projected 23.5 million by 2029–30).
Spatial impacts: IT reinforced the dominance of a few southern and western metros, creating new edge cities (Gurugram, Whitefield, Cyberabad) and commuter belts, while remote work after 2020 allowed some dispersal to smaller towns.
Negative impacts: cybercrime and fraud, misinformation, privacy concerns, platform worker precarity, and rising inequality between digitally connected and disconnected regions.
5. The Digital Divide
Gender gap: NFHS-5 (2019–21) found that about 33% of women and 57% of men aged 15–49 had ever used the internet.
Rural–urban and regional gaps: internet and smartphone penetration are higher in Kerala, Goa, Delhi, Maharashtra and Punjab, and lower in Bihar, Jharkhand, Odisha, Chhattisgarh and parts of the North-East; tele-density is far higher in urban than rural areas (TRAI).
Causes: cost of devices, low digital literacy, language barriers, weak power and network infrastructure in hilly, forested and border areas.
Responses: BharatNet, PM Gramin Digital Saksharta Abhiyan (PMGDISHA, 2017), 4G saturation project for remote villages (2022), Common Service Centres, and content in Indian languages (Bhashini, 2022).
6. Indian Space Programme
Foundations: Indian National Committee for Space Research (INCOSPAR, 1962) under Vikram Sarabhai; first rocket launch from Thumba (1963); ISRO founded in 1969; Department of Space (1972); Aryabhata (1975); SLV-3 placed Rohini in orbit (1980); INSAT communication satellites (from 1982–83) and Indian Remote Sensing satellites (IRS-1A, 1988).
Launch vehicles and sites: PSLV (reliable workhorse, but suffered failures in May 2025 and January 2026), GSLV and LVM3 for heavier payloads, SSLV for small satellites; launches from Satish Dhawan Space Centre, Sriharikota; a second spaceport for small launchers is being built at Kulasekarapattinam (Tamil Nadu).
Planetary and solar missions: Chandrayaan-1 (2008, evidence of water on the Moon), Mars Orbiter Mission (launched 2013, reached Mars orbit in September 2014), Chandrayaan-3 (soft landing near the lunar south pole on 23 August 2023, now National Space Day), Aditya-L1 (launched September 2023, reached the L1 point in January 2024), XPoSat (January 2024).
Recent milestones: SpaDeX in-orbit docking (January 2025), the 100th launch from Sriharikota (GSLV-F15, January 2025), the NASA–ISRO Synthetic Aperture Radar (NISAR) launched on GSLV-F16 on 30 July 2025, and Group Captain Shubhanshu Shukla's flight to the International Space Station on Axiom-4 (June–July 2025).
Human spaceflight and future: Gaganyaan's first uncrewed test flight (G1, carrying the robot Vyommitra) was still awaited as of October 2026, with the first crewed flight targeted for 2027; approved plans include Chandrayaan-4 (sample return), the Venus Orbiter Mission and the Bharatiya Antariksh Station (target 2035).
Reforms and private sector: NewSpace India Limited (2019), IN-SPACe (2020) to authorise private activity, Indian Space Policy 2023, liberalised FDI rules (2024); private launches such as Skyroot's Vikram-S (2022) and Agnikul's Agnibaan SOrTeD (2024).
7. Geographical Applications of Space Technology
Earth observation: Resourcesat, Cartosat, RISAT, Oceansat and EOS satellites support land use mapping, forest cover assessment (ISFR uses satellite data), wasteland and land degradation atlases, urban planning and watershed monitoring.
Agriculture and water: FASAL crop production forecasts, drought assessment (NADAMS), groundwater prospect maps, glacier and snow monitoring in the Himalaya.
Disasters: INSAT-3D, 3DR and 3DS weather satellites track cyclones and monsoon systems; flood mapping and landslide inventories by the National Remote Sensing Centre (NRSC), Hyderabad; the Bhuvan geoportal shares data.
Navigation and communication: NavIC (Indian regional navigation system) for transport, fishing and disaster alerts; GSAT satellites for television, telemedicine and tele-education; satellite links for remote islands and the North-East.
8. Theory and Debates
Death of distance? Frances Cairncross (The Death of Distance, 1997) predicted that communication would make location irrelevant; India's highly clustered IT geography shows that agglomeration still matters.
Diffusion of innovation: Hägerstrand (1953) and Everett Rogers (1962) explain how mobile phones and UPI spread hierarchically from metros to towns and then contagiously to villages.
Digital public goods vs surveillance: supporters praise Aadhaar and UPI as inclusive public infrastructure; critics raise privacy, exclusion errors and state surveillance concerns; the Supreme Court's Puttaswamy judgments (2017, 2018) affirmed privacy as a fundamental right while upholding Aadhaar for welfare.
Space for development vs prestige: Sarabhai argued that India must use advanced technology to solve real problems of the people; critics of costly missions are answered by the large returns from weather forecasting, remote sensing and communication.
9. Maps and Diagrams to Draw
IT hubs map: mark Bengaluru, Hyderabad, Pune, Chennai, NCR, Mumbai and Kolkata, plus tier-2 IT centres, data centre clusters and submarine cable landing points.
Space infrastructure map: Sriharikota, Thumba (Thiruvananthapuram), Kulasekarapattinam, ISRO centres at Bengaluru, Ahmedabad (Space Applications Centre), Hyderabad (NRSC), Mahendragiri (propulsion), and the master control facility at Hassan.
Digital divide chart: bars comparing internet use by women and men (NFHS-5) and urban–rural tele-density.
Applications flow chart: satellite data → NRSC/Bhuvan → applications (crops, forests, disasters, urban planning) → users (farmers, planners, NDMA).
10. Using It in the Exam
10 marks: role of remote sensing in resource management, or factors behind the location of the IT industry.
15 marks: impact of ICT on Indian economy and society with data and examples, including the digital divide.
20 marks: Indian space programme: evolution, achievements (Chandrayaan-3, Aditya-L1, NISAR), reforms, and its contribution to development and geography, with a map.
Keywords: time–space compression, digital public infrastructure, tele-density, digital divide, Global Capability Centres, remote sensing, NavIC, IN-SPACe.
Attributed idea: Vikram Sarabhai held that India should be second to none in applying advanced technologies to the real problems of man and society (paraphrased).
| Indicator | Value | Date | Source |
|---|---|---|---|
| Telephone subscribers | About 1,354 million | End-July 2026 | TRAI |
| Broadband subscribers (incl. M2M) | About 1,094 million | End-July 2026 | TRAI |
| Women aged 15–49 who ever used internet | About 33% (men about 57%) | 2019–21 | NFHS-5 |
| IT–BPM industry revenue | Roughly USD 280 billion | 2024–25 | NASSCOM estimates |
| Operational SEZs (largely IT/ITES) | 277 | 31 March 2026 | SEZ India |
| Chandrayaan-3 lunar landing | Near lunar south pole | 23 August 2023 | ISRO |
| NISAR launch | GSLV-F16 | 30 July 2025 | ISRO–NASA |
Mains points
- Questions ask about the impact of IT and communication on economy and society, the location of the IT industry, the digital divide, and the achievements and applications of the space programme.
- Use current data with dates: TRAI (July 2026), NFHS-5 internet use, UPI volumes, space milestones up to 2025–26.
- Show geography: IT clustering and its causes, data centre and cable landing locations, regional digital divide, space infrastructure map.
- Link the space programme to geography applications (remote sensing, cyclone warnings, crop forecasts, Bhuvan, NavIC).
- Bring theory: Harvey's time–space compression, Castells' space of flows, Cairncross's death of distance (and its critique), diffusion of innovation.
- Common mistake: stating that Gaganyaan has already flown or that Chandrayaan-2's lander succeeded; be accurate about mission status.
Did you know?
- India's first rocket in 1963 was carried in parts to the launch pad at Thumba on bicycles, and the launch site was beside a church that later became a space museum.
UPSC Previous Year Questions: Transport, Communication and Trade
From 2014 to 2026 UPSC asked 30 question parts worth 460 marks from this chapter in Paper II. Communication, IT and the space programme (11 parts) and ports, foreign trade and trade policy (11 parts) are asked most often, followed by transport networks and regional development (8 parts), especially pipelines, waterways and the north-east. Every question below has a model answer written to the UPSC word limit, with the map or diagram an examiner expects.
In simple words
Read the question and write your own answer first, keeping to the word limit (10 marks about 150 words, 15 marks about 200, 20 marks about 250).
Then compare it with the model answer: did you name the networks, ports, corridors and missions correctly with their years, give the latest trade or traffic data with source, and draw a map?
Note what you missed in one line and reread that part of the notes before trying the next question.
1. Transport Networks and Regional Development
Example 1 (UPSC 2026, 15 marks): Describe the role of energy pipelines in the industrial development and in reducing the regional imbalances in India.
Paper and question: Paper II, Q4(b)
Approach: Explain why pipelines are an efficient energy transport mode, describe the major oil and gas pipelines, then show their role in industrial development and in reducing regional imbalances, with limits. Draw a map of India's pipeline grid.
Energy pipelines carry crude oil, petroleum products and natural gas continuously, safely and cheaply over long distances, with low running costs and little road or rail congestion. India has about 25,000 km of natural gas pipelines, with more under construction, alongside a large crude and product network.
Major pipelines: crude from Salaya to Mathura and Panipat, Mundra to Panipat and Paradip to Haldia and Barauni; products from Kandla to Bathinda; and gas through the Hazira–Vijaipur–Jagdishpur (HBJ) pipeline (1987), the Pradhan Mantri Urja Ganga (Jagdishpur–Haldia–Bokaro–Dhamra) and the north-eastern Indradhanush grid.
Role in industrial development: (i) the HBJ pipeline made possible fertiliser plants at Vijaipur, Aonla, Babrala and Jagdishpur in the interior and gas-based power at Auraiya and Dadri; (ii) inland refineries at Mathura, Panipat and Bina depend on crude pipelines; (iii) city gas distribution supplies CNG and piped gas to industries and homes; (iv) revived fertiliser plants at Gorakhpur, Barauni and Sindri depend on Urja Ganga.
Reducing regional imbalances: pipelines carry energy from coastal and western sources to the landlocked north and east, allowing industry in Uttar Pradesh, Bihar, Jharkhand, Odisha and the north-east, which lacked gas, under the goal of 'One Nation, One Gas Grid'.
Limits: high capital cost, dependence on imported LNG and crude, and safety and land issues.
Map: Map of India showing HBJ, Urja Ganga, Indradhanush, Salaya–Mathura, Mundra–Panipat and Paradip–Haldia–Barauni pipelines, with fertiliser and refinery towns.
Pipelines can spread industry eastward if the gas grid is completed.
Example 2 (UPSC 2024, 15 marks): What are the major regional rapid transit systems developed in India? How are urban problems being addressed by them?
Paper and question: Paper II, Q8(c)
Approach: Define regional rapid transit systems, name the major ones (Delhi–Meerut Namo Bharat and planned NCR corridors, with suburban rail and metro systems as related regional networks), then show how they address urban problems, with limits. Draw a map of the NCR RRTS corridors.
A regional rapid transit system (RRTS) is a dedicated, high-speed, high-frequency rail network linking a metropolis with satellite towns 80–100 km away, faster than a metro and more frequent than conventional trains.
Major systems: (i) the Delhi–Ghaziabad–Meerut Namo Bharat corridor (82 km), built by the National Capital Region Transport Corporation, India's first RRTS, which opened in phases from 2023 and became fully operational in February 2026 with design speeds of up to 180 km/h; (ii) planned NCR corridors from Delhi to Gurugram–Shahjahanpur–Neemrana–Behror (towards Alwar) and from Delhi to Sonipat–Panipat; (iii) related regional networks include the Mumbai suburban railway and expanding metro systems.
How they address urban problems: (i) congestion and pollution: they shift commuters from cars and buses, reducing traffic and emissions in Delhi; (ii) housing pressure: people can live in cheaper satellite towns such as Meerut and Ghaziabad and commute quickly; (iii) balanced regional growth: they spread jobs and investment across the NCR, in line with polycentric planning; (iv) multimodal integration with metro, bus and railway stations, and transit-oriented development around stations.
Limits: high cost, the need for last-mile links and slow progress on other corridors.
Map: Map of the NCR showing the Delhi–Meerut corridor with its stations and the planned Alwar and Panipat corridors.
RRTS can decongest metros if integrated with land-use planning.
Example 3 (UPSC 2018, 20 marks): Explain the pipeline network across India and its impact on regional development.
Paper and question: Paper II, Q7(a)
Approach: Describe India's pipeline network (crude, product, gas, cross-border) with its regional pattern, then explain its impact on regional development (industry, agriculture via fertilisers, energy access, the east and north-east), with problems. Draw a map of the pipeline network.
Pipelines are the most efficient way to move oil and gas over land: they run continuously, have low operating costs, are unaffected by weather and reduce road and rail congestion. India's network has grown from the first crude line in Assam to a national grid.
Crude oil pipelines: the Naharkatiya–Guwahati–Barauni line in the north-east (from the 1960s), Salaya–Viramgam–Mathura–Panipat from the Gujarat coast, Mundra–Panipat, and Paradip–Haldia–Barauni from the east coast.
Product pipelines: Kandla–Bathinda, Mumbai–Pune–Solapur, Chennai–Bengaluru and Mathura–Jalandhar, supplying fuel depots inland.
Gas pipelines: about 25,000 km, including HBJ (1987) and its extensions to Delhi and Punjab, the East–West pipeline from Kakinada to Bharuch, Kochi–Mangaluru (2020), Pradhan Mantri Urja Ganga to Bihar, Jharkhand, West Bengal and Odisha, and the Indradhanush grid linking the north-eastern states.
Cross-border: Motihari–Amlekhgunj to Nepal (2019) and the India–Bangladesh Friendship Pipeline (2023).
Impact on regional development: (i) industry in the interior: refineries at Mathura, Panipat and Bina, and gas-based fertiliser and power plants along the HBJ corridor in Madhya Pradesh and Uttar Pradesh; (ii) agriculture: cheap gas-based urea from these plants supports the farms of the Ganga plain; (iii) energy access and cleaner cities: city gas distribution brings CNG and piped gas to homes, vehicles and industry, cutting pollution; (iv) eastern and north-eastern development: Urja Ganga revived fertiliser plants at Gorakhpur, Barauni and Sindri, and the Indradhanush grid aims to supply all north-eastern states; (v) regional cooperation with Nepal and Bangladesh.
Problems: high capital cost, gaps in the grid in the east and south, dependence on imports, and the risk of leaks and pilferage.
Map: Map of India showing crude, product and gas pipelines, refineries, LNG terminals and cross-border lines to Nepal and Bangladesh.
Completing the 'One Nation, One Gas Grid' will strengthen balanced regional development.
Example 4 (UPSC 2017, 15 marks): Critically examine the feasibility of development of a comprehensive network of airways in India.
Paper and question: Paper II, Q2(c)
Approach: Assess the case for a comprehensive airway network (geography, demand, regional connectivity, UDAN) against the constraints (costs, airport capacity, terrain, viability, environment), concluding critically on feasibility. Draw a map of airports and UDAN routes.
Air transport is fast, needs no continuous track and can reach remote, rugged and island regions, which makes a comprehensive airway network attractive for a large, diverse country like India.
Factors favouring feasibility: (i) geography: the Himalaya, the north-east, Ladakh and the island territories are poorly served by road and rail, so air links are often the only fast option; (ii) demand: India is now the world's third-largest domestic aviation market, with a growing middle class; (iii) policy: the Regional Connectivity Scheme UDAN (2016) subsidises flights to unserved airports, heliports and water aerodromes, and the number of operational airports has roughly doubled since 2014; (iv) economic benefits: tourism, trade in perishables and high-value goods, and the integration of remote regions; (v) strategic needs: border airstrips and advanced landing grounds.
Constraints: (i) high costs of aviation fuel, aircraft and airports make many regional routes commercially unviable, and several UDAN routes have stopped after their subsidy period ended; (ii) congestion at metro airports and land acquisition for new airports; (iii) difficult terrain and weather in the Himalaya and the north-east; (iv) airline financial failures (Kingfisher, Jet Airways, Go First) and market concentration; (v) environmental concerns, including emissions and noise.
Map: Map of India marking major airports, new greenfield airports and UDAN routes linking the north-east, the Himalaya and the islands.
A comprehensive network is feasible only in a hub-and-spoke form, with continued viability support for remote regions and integration with rail and road.
Example 5 (UPSC 2017, 20 marks): Integrated development of road and rail networks in a complementary framework is a prerequisite for regional development. Explain with reference to North-Eastern Region of India.
Paper and question: Paper II, Q7(a)
Approach: Explain why road and rail must complement each other for regional development, apply this to the north-east (isolation, terrain, current projects for each mode and their integration), and conclude. Draw a map of north-eastern road and rail links.
Roads and railways have complementary strengths: railways move bulk goods and people cheaply over long distances, while roads give door-to-door and last-mile access in rugged areas. Regional development needs both, integrated through terminals and feeder roads, in line with Taaffe, Morrill and Gould's model of network-led regional growth.
The north-east's problem: the region is linked to the rest of India only through the narrow Siliguri corridor ('chicken's neck'), has hilly terrain, heavy rain, landslides and wide rivers such as the Brahmaputra, and for decades had a poor road density and metre-gauge or no railways. This isolation raised costs and limited markets.
Railways: gauge conversion to broad gauge across Assam and Tripura; new lines aiming to connect all state capitals, such as Bairabi–Sairang to Aizawl, Jiribam–Imphal and lines towards Kohima and Shillong; and the Bogibeel rail-cum-road bridge (2018) across the Brahmaputra.
Roads: the Special Accelerated Road Development Programme for the North East, Bharatmala and the Trans-Arunachal and Frontier Highways; the Dhola–Sadiya bridge (2017); and the Sela tunnel (2024).
Complementarity: (i) railways bring bulk goods (food grains, fuel, cement) to rail heads such as Guwahati, Dimapur and Agartala, and roads distribute them to hill districts; (ii) multimodal terminals and inland waterways on the Brahmaputra (NW-2) link the two; (iii) cross-border projects such as the Kaladan multimodal route and the Agartala–Akhaura rail link (2023) open routes through Myanmar and Bangladesh under the Act East Policy.
Developmental effects: better connectivity lowers prices, opens markets for horticulture and tourism, improves access to health and education and strengthens border security.
Challenges: landslides, earthquakes, high construction costs and ecological damage in fragile hills.
Map: Map of north-east India showing the Siliguri corridor, main highways and rail lines, new lines to state capitals, the Bogibeel and Dhola–Sadiya bridges, NW-2 and the Kaladan and Agartala–Akhaura links.
An integrated road–rail–waterway framework is therefore the key to unlocking the north-east's development.
Example 6 (UPSC 2016, 20 marks): Bring out the development of river water transport in India and its role in regional development.
Paper and question: Paper II, Q4(a)
Approach: Trace the development of inland water transport in India (history, decline, revival through the National Waterways Act and Jal Marg Vikas), then explain its role in regional development with examples and constraints. Draw a map of the main national waterways.
Rivers were India's main trade routes for centuries, but inland water transport declined after the coming of the railways, the diversion of river water for irrigation and the siltation of channels. It is the cheapest and least polluting mode of transport for bulk cargo.
Revival: the Inland Waterways Authority of India was set up in 1986. Five national waterways were declared by 2008, including NW-1 (Ganga–Bhagirathi–Hooghly, Prayagraj–Haldia), NW-2 (Brahmaputra, Dhubri–Sadiya) and NW-3 (West Coast Canal in Kerala). The National Waterways Act (2016) raised the total to 111. The World Bank-assisted Jal Marg Vikas Project built multimodal terminals at Varanasi, Sahibganj and Haldia and a new navigation lock at Farakka.
Current status: cargo on national waterways has grown rapidly, to over 130 million tonnes in 2023–24 (IWAI), though it still forms a small share of total freight.
Role in regional development: (i) cheap bulk transport of coal, fertilisers, cement and food grains for the Ganga plain and Assam, lowering costs for industry and farmers; (ii) connectivity for the north-east through the Indo-Bangladesh Protocol route linking NW-1 and NW-2 through Bangladesh, bypassing the Siliguri corridor; (iii) regional industry and jobs at terminals, boatyards and logistics parks; (iv) tourism through river cruises such as the Ganga Vilas (2023) and Kerala's backwaters; (v) decongestion of roads and railways and lower emissions.
Constraints: low water depth in the dry season on the upper Ganga, siltation and shifting channels, low bridges, lack of return cargo and ecological concerns about dredging and the Ganga river dolphin.
Map: Map of India showing NW-1, NW-2 and NW-3, multimodal terminals at Varanasi, Sahibganj and Haldia, the Farakka lock and the Indo-Bangladesh Protocol route.
With assured depth, terminals and cargo, waterways can become a strong engine of balanced regional development in the eastern and north-eastern regions.
Example 7 (UPSC 2016, 15 marks): Explain with suitable examples the role of road transport in agricultural development in India.
Paper and question: Paper II, Q6(b)
Approach: Explain the links between road transport and agriculture (inputs, markets, perishables, technology, land use), with Indian examples and programmes, and note gaps. Draw a map of rural road density and major mandis.
Roads are the main link between farms, input suppliers and markets because they reach the village and the field, which railways cannot. India's rural road network expanded greatly under the Pradhan Mantri Gram Sadak Yojana (PMGSY, 2000), which connected most eligible habitations with all-weather roads.
Role in agricultural development: (i) input supply: timely delivery of seeds, fertilisers, pesticides, diesel and machinery, which helped spread the Green Revolution in Punjab and Haryana, where road density was high; (ii) market access: farmers can reach regulated mandis and choose better prices, reducing distress sales, as in vegetable supply from Haryana and western Uttar Pradesh to Delhi's Azadpur mandi; (iii) perishables and commercialisation: refrigerated trucks carry Nashik grapes and onions, Himachal and Kashmir apples and milk from dairy cooperatives (Amul's collection routes), encouraging horticulture and dairying; (iv) technology and services: extension workers, credit, veterinary services and mechanisation reach villages more easily; (v) diversification and land values: villages near roads shift to high-value crops and see rising land values; (vi) reduced wastage through quicker movement to cold storage and processing units.
Gaps: poor maintenance of rural roads, weak connectivity in hilly, tribal and north-eastern areas, and high freight costs for small farmers.
Map: Map of India showing high rural road density in Punjab, Haryana, Kerala and western Uttar Pradesh against low density in the north-east and tribal central India, with major mandis such as Azadpur, Lasalgaon and Vashi.
Better rural roads linked with markets and storage are thus a foundation of agricultural growth.
Example 8 (UPSC 2014, 15 marks): Discuss the problems and prospects of National Waterway No. 1.
Paper and question: Paper II, Q3(b)
Approach: Describe NW-1 (extent, development under Jal Marg Vikas), then discuss its problems (physical, technical, economic, ecological) and its prospects. Draw a map of NW-1 with terminals.
National Waterway 1 runs about 1,620 km along the Ganga–Bhagirathi–Hooghly system from Prayagraj to Haldia, through Uttar Pradesh, Bihar, Jharkhand and West Bengal. Declared in 1986, it is being developed under the Jal Marg Vikas Project with multimodal terminals at Varanasi (2018), Sahibganj (2019) and Haldia and a new navigation lock at Farakka.
Problems: (i) low water depth in the dry season, especially between Prayagraj and Patna, because irrigation withdrawals upstream and the monsoon regime reduce flow; (ii) siltation and shifting channels that need constant dredging; (iii) structural barriers such as low bridges and the Farakka barrage; (iv) low cargo: few industries are on the river banks, and there is little return cargo; (v) weak last-mile connectivity from terminals to roads and rail; (vi) ecological concerns: dredging and vessel traffic threaten the Ganga river dolphin in the Vikramshila sanctuary and fisheries, and pollution persists.
Prospects: (i) cheap, low-carbon transport for coal, fertilisers, cement and food grains in the densely populated, industrially lagging Ganga plain; (ii) integration with the Eastern Dedicated Freight Corridor and highways at multimodal hubs; (iii) the Indo-Bangladesh Protocol route connecting NW-1 to NW-2 and the north-east; (iv) river tourism, such as the Ganga Vilas cruise (2023); (v) new industrial and logistics clusters along the river.
Map: Map of the Ganga plain showing NW-1 from Prayagraj to Haldia, the Varanasi, Sahibganj and Haldia terminals, the Farakka lock, Vikramshila dolphin sanctuary and the Protocol route.
NW-1 can succeed if assured depth is achieved with river-friendly methods and cargo is aggregated.
2. Ports, Foreign Trade, Trade Policy and Export Processing Zones
Example 9 (UPSC 2025, 15 marks): With reference to the transport and communication network of India, critically discuss the Sagarmala project.
Paper and question: Paper II, Q6(b)
Approach: Introduce Sagarmala and its pillars, discuss its achievements in port and transport–communication networks, then critically examine shortcomings, ending with a judgement. Draw a map of Sagarmala components.
Sagarmala, launched in 2015 under the Ministry of Ports, Shipping and Waterways, aims at port-led development by using India's long coastline and navigable waterways to cut logistics costs, which are high by global standards.
Pillars: (i) port modernisation and new ports; (ii) port connectivity by rail, road, pipelines and waterways; (iii) port-led industrialisation through coastal economic zones and industrial clusters; (iv) coastal community development, including skills and fisheries; together with the promotion of coastal shipping and inland water transport.
Achievements: major ports have increased capacity and efficiency, with a record of about 855 million tonnes of cargo in 2024–25 and faster turnaround times; new deep-draft ports such as Vadhavan (approved 2024) and the Vizhinjam transshipment port are coming up; coastal shipping and Ro-Ro and Ro-Pax ferries (Ghogha–Hazira) have grown; rail and road links to ports have improved; and it is integrated with PM Gati Shakti.
Critical view: (i) many projects are delayed, and private investment has fallen short; (ii) coastal economic zones have made slow progress; (iii) port projects cause land conflicts and threaten mangroves, fisheries and coastal communities, as in debates over Vadhavan and Vizhinjam; (iv) the share of coastal shipping in freight remains small; (v) benefits concentrate on the west coast and in large private ports.
Map: Map of India's coast marking major ports, new ports (Vadhavan, Vizhinjam), coastal economic zones, Ro-Pax routes and port rail links.
Sagarmala is a sound strategy whose impact depends on faster execution and inclusive, ecologically sensitive planning.
Example 10 (UPSC 2024, 10 marks): Examine the relationship between seaports and regional development in India.
Paper and question: Paper II, Q5(e)
Approach: Explain the two-way relationship between seaports and their hinterlands (port-led growth and hinterland-led growth), with Indian examples, and note uneven outcomes. Draw a map of ports and hinterlands.
Seaports and regions grow together: a port's traffic depends on its hinterland (the area it serves), while the port in turn attracts industry, trade and cities, a cumulative process consistent with Myrdal's idea of circular causation.
Port-led development: Mumbai and JNPA built India's commercial capital and the Mumbai–Pune industrial region; Kandla and Mundra drove Kutch's industrialisation (refining, salt, timber, SEZs); Visakhapatnam grew with shipbuilding, steel and refining; and Paradip supports fertiliser, refining and steel industries in Odisha.
Hinterland-led development: the mineral and industrial hinterland of Chotanagpur sustains Kolkata–Haldia and Paradip, and the Delhi–Punjab–Rajasthan hinterland supports the Gujarat ports through the Western Dedicated Freight Corridor.
Uneven outcomes: ports such as Kolkata suffer from silting, and ports with weak hinterland links remain underused.
Map: Map of India marking major ports and the hinterlands they serve, with freight corridors linking them.
Linking ports with industrial corridors under Sagarmala strengthens regional development.
Example 11 (UPSC 2023, 15 marks): Highlight the salient features of India's trade policy. Discuss the status of India's balance of trade with China.
Paper and question: Paper II, Q4(c)
Approach: Highlight the salient features of India's trade policy (Foreign Trade Policy 2023 and FTAs), then discuss the status, composition and causes of the trade deficit with China, ending with responses. Draw a diagram or graph of India–China trade.
Trade policy features: the Foreign Trade Policy 2023 (from April 2023) aims at 2 trillion US dollars of exports of goods and services by 2030. It moves from incentives to remission and facilitation (RoDTEP), promotes districts as export hubs, e-commerce exports and trade settlement in rupees. India has also signed new trade agreements, such as the CEPA with the UAE (2022), the ECTA with Australia (2022), the TEPA with the EFTA countries (2024) and the trade agreement with the United Kingdom (2025), while using trade defence tools (anti-dumping duties, quality control orders) and PLI schemes to build domestic manufacturing.
Balance of trade with China: in 2024–25 India's imports from China were about 113 billion US dollars and its exports about 14 billion, giving a record deficit of about 99 billion US dollars (Ministry of Commerce), the largest with any partner.
Composition and causes: India imports electronics and components, machinery, solar cells and modules, APIs, chemicals and batteries, but exports mainly raw materials such as iron ore and organic chemicals. The causes are China's manufacturing scale and low costs, India's weak supply chains in electronics and capital goods, and the import needs of India's own assembly and renewable-energy industries.
Responses: PLI schemes, restrictions on Chinese investment (Press Note 3, 2020), anti-dumping duties and supply-chain diversification.
Diagram: Bar graph of India's exports to and imports from China over recent years, showing the widening deficit.
Reducing the deficit requires deeper domestic manufacturing rather than tariffs alone.
Example 12 (UPSC 2022, 10 marks): Discuss the significance of new ports on the Western Coast of India on the external trade of the country.
Paper and question: Paper II, Q5(c)
Approach: Name the new and expanding ports of the west coast and explain their significance for India's external trade (capacity, transshipment, trade routes, hinterland, costs). Draw a map of west coast ports.
The west coast handles the larger share of India's port cargo because it faces West Asia, Europe and Africa and serves the industrial north-west and west. New and expanding ports are strengthening this role.
New ports: (i) Vadhavan (Maharashtra), approved in 2024 as a deep-draft major port able to take the largest container ships; (ii) Vizhinjam (Kerala), India's first deep-water container transshipment port, close to the main east–west shipping route, which began operations in 2024; (iii) private ports such as Mundra, now India's largest commercial port by cargo, and Hazira, Dahej and Pipavav.
Significance: (i) handling larger ships lowers freight costs; (ii) transshipment at home instead of Colombo, Singapore and Dubai saves foreign exchange and time; (iii) links to the Western Dedicated Freight Corridor serve the Delhi–Punjab–Rajasthan hinterland; (iv) they support India's place in the India–Middle East–Europe Economic Corridor; (v) energy imports pass through LNG and crude terminals at Dahej, Hazira and Mundra.
Map: Map of the west coast marking Mundra, Kandla, Hazira, Dahej, JNPA, Vadhavan, Mormugao, New Mangalore, Kochi and Vizhinjam.
These ports reduce logistics costs and make Indian exports more competitive.
Example 13 (UPSC 2021, 15 marks): Critically assess the status of balance of trade in India and suggest some measures to combat the issues.
Paper and question: Paper II, Q8(c)
Approach: Present the latest data on India's merchandise, services and overall trade balance, assess critically its causes and implications, then suggest measures. Draw a graph of India's trade balance.
Balance of trade is the difference between the value of a country's exports and imports. India has run a persistent merchandise trade deficit for decades.
Status: in 2024–25 merchandise exports were about 437 billion US dollars and imports about 720 billion, giving a goods deficit of about 283 billion US dollars. Services exports of about 384 billion US dollars, mainly IT, business services and travel, yielded a large services surplus, so the overall goods-and-services deficit was much smaller, at about 94 billion US dollars (Ministry of Commerce). Remittances further cushion the current account.
Critical assessment: (i) the deficit is driven by crude oil, gold, electronics, coal, edible oils and fertilisers, which are hard to cut quickly; (ii) the deficit with China (about 99 billion US dollars) shows weak domestic manufacturing in electronics and capital goods; (iii) exports are concentrated in a few products and markets and face protectionism, such as the higher US tariffs of 2025.
Measures: (i) expand manufacturing through PLI, electronics and solar module production; (ii) reduce oil imports through renewables, electric vehicles and ethanol blending; (iii) promote gold monetisation and sovereign gold bonds to reduce gold imports; (iv) diversify exports and markets through FTAs and districts as export hubs; (v) improve logistics (PM Gati Shakti) to make exports competitive.
Diagram: Bar graph of India's exports, imports and trade balance for goods and services over recent years.
A smaller, sustainable deficit is achievable if manufacturing and energy transition reforms continue.
Example 14 (UPSC 2019, 20 marks): With special reference to India examine the changes in the nature and patterns of international trade. Mention the major influencing factors.
Paper and question: Paper II, Q8(a)
Approach: Examine the changes in the nature (composition, goods versus services, value) and pattern (direction, partners, regions) of India's international trade since Independence and especially since 1991, then explain the influencing factors. Draw a diagram of changing trade composition and direction.
India's trade has changed greatly in its volume, nature and pattern since Independence, and especially since the reforms of 1991.
Changes in nature (composition): (i) at Independence India exported primary and traditional goods (tea, jute goods, cotton textiles, spices, leather) and imported machinery and food grains; (ii) today the main exports are engineering goods, petroleum products, gems and jewellery, pharmaceuticals, chemicals and, increasingly, electronics such as smartphones; (iii) imports are dominated by crude oil, gold, electronics, machinery, coal and edible oils; (iv) services exports, led by IT and business services, have grown to almost the size of merchandise exports, a distinctive feature of India's trade.
Changes in pattern (direction): (i) the early dominance of the UK and later the Soviet Union gave way after 1991 to the United States, the European Union, China, the UAE and Saudi Arabia; (ii) the share of Asia, especially West Asia (oil, gold, remittances) and East and South-East Asia (electronics, palm oil, coal), has risen sharply; (iii) the United States is the largest export market and China the largest source of imports.
Influencing factors: (i) policy: the shift from import substitution to liberalisation in 1991, WTO membership (1995), FTAs with ASEAN, the UAE, Australia, EFTA and the UK and the Foreign Trade Policy 2023; (ii) economic structure: growth and rising incomes raised imports of oil, gold and electronics; (iii) resource endowment: limited oil and coking coal create import dependence; (iv) global demand and prices: oil price swings and global recessions; (v) geopolitics: sanctions, the Russia–Ukraine war, US–China rivalry and supply-chain shifts.
Diagram: Two pie charts comparing India's export composition and main partners around 1950–51 and in 2024–25.
India's trade has thus shifted from primary goods and a few Western partners to manufactures, services and a diversified, Asia-centred pattern.
Example 15 (UPSC 2018, 15 marks): Account for the persisting negative trade balance of India.
Paper and question: Paper II, Q3(b)
Approach: State the persistent nature of India's merchandise trade deficit with data, then account for it through structural, resource, competitiveness, policy and external factors, noting the services offset. Draw a graph of the trade deficit trend.
Apart from a couple of years in the 1970s, India has run a merchandise trade deficit almost every year since Independence; in 2024–25 it was about 283 billion US dollars (Ministry of Commerce).
Reasons: (i) energy dependence: India imports most of its crude oil and much of its LNG and coking coal, so oil price rises widen the deficit sharply; (ii) gold demand: cultural and investment demand makes gold one of the largest imports; (iii) weak manufacturing depth: electronics, machinery, solar modules, APIs and chemicals are imported, largely from China; (iv) edible oils and fertilisers: agricultural shortfalls require large imports of palm oil, potash and phosphates; (v) export structure: exports are concentrated in a few products and markets, with low value addition and weak competitiveness due to high logistics costs and small firm size; (vi) growth effect: as India grows faster than its trading partners, its imports rise faster than its exports; (vii) external shocks: global slowdowns and protectionism hurt exports.
Offsetting factors: the large surplus in services and remittances keeps the current account deficit manageable.
Diagram: Line graph of India's merchandise exports, imports and deficit over two decades, with major oil-price peaks marked.
Energy transition, deeper manufacturing and export diversification are needed to narrow the persistent gap.
Example 16 (UPSC 2018, 15 marks): Discuss the changing composition of international trade through major seaports of India.
Paper and question: Paper II, Q7(b)
Approach: Describe how the composition of cargo through major seaports has changed (bulk liquids, dry bulk, containers, vehicles, LNG) and the shift between ports and coasts, with reasons. Draw a map of ports with their dominant cargo.
Most of India's trade by volume moves through its seaports, and the composition of this cargo has changed with the economy.
Changing composition: (i) petroleum, oil and lubricants remain the largest single category, with crude imports and product exports through Jamnagar's Sikka terminals, Mundra, Kandla (Deendayal), Paradip and Mumbai; (ii) coal imports for power and steel have grown, through Paradip, Krishnapatnam, Mundra and Dhamra; (iii) iron ore exports from Goa (Mormugao) and Visakhapatnam declined sharply after the mining bans of the early 2010s; (iv) containers, carrying manufactured goods, have grown fastest, led by JNPA and Mundra, with Chennai and Kolkata; (v) automobiles are exported through Chennai, Ennore (Kamarajar) and Mundra; (vi) LNG imports have risen through terminals at Dahej, Hazira, Dabhol, Kochi, Ennore and Dhamra; (vii) fertilisers and edible oils are imported through Kandla, Paradip and Kakinada.
Spatial shifts: the share of non-major (mostly private) ports, led by Mundra, has risen to nearly half of cargo, and Gujarat has become the leading port state.
Reasons: industrial growth and rising energy imports, liberalisation and private investment in ports, containerisation, mining policy and the location of refineries on the coast.
Map: Map of India's coast marking major and private ports with their dominant cargo: POL (Sikka, Paradip), coal (Krishnapatnam, Dhamra), containers (JNPA, Mundra), vehicles (Chennai) and LNG (Dahej, Kochi).
The shift towards containers and energy reflects India's changing economy.
Example 17 (UPSC 2017, 15 marks): Describe the salient features of Sagar Mala Project and highlight its role in port-led development of coastal regions in India.
Paper and question: Paper II, Q7(b)
Approach: Describe the salient features of Sagarmala (aim, pillars, components, institutions), then highlight its role in port-led development of coastal regions with examples and limits. Draw a map of Sagarmala components.
Sagarmala, approved in 2015, is India's flagship programme for port-led development, aiming to use the coastline and waterways to lower logistics costs for domestic and export cargo and to develop coastal regions.
Salient features: (i) four pillars: port modernisation, port connectivity, port-led industrialisation and coastal community development; (ii) a National Perspective Plan (2016) identifying projects; (iii) Coastal Economic Zones and port-linked industrial clusters; (iv) promotion of coastal shipping and inland waterways as cheaper alternatives to road and rail; (v) skill development, fishing harbours and coastal tourism; (vi) the Sagarmala Development Company to support projects through public–private partnership.
Role in port-led development: (i) new and expanded ports (Vadhavan, Vizhinjam, Paradip and JNPA expansions) attract industry and jobs; (ii) port rail and road links extend hinterlands; (iii) industrial clusters near ports, such as refineries, steel and cement units, reduce transport costs; (iv) coastal shipping and Ro-Pax ferries (Ghogha–Hazira, Mumbai–Mandwa) link coastal towns; (v) fishing harbours and skills programmes benefit coastal communities.
Limits: delays, slow progress of Coastal Economic Zones, and ecological and livelihood conflicts.
Map: Map of India's coast marking major ports, new ports, Coastal Economic Zones and coastal shipping routes.
Sagarmala can transform coastal regions if it balances growth with coastal ecology.
Example 18 (UPSC 2016, 10 marks): Analyze the pattern of India's trade with the S-E Asian countries.
Paper and question: Paper II, Q5(e)
Approach: Describe the growth, composition, balance and policy framework of India's trade with South-East Asia (ASEAN), with country examples. Draw a map of India's main South-East Asian trade partners.
South-East Asia (the ASEAN countries) is one of India's largest trading regions, and trade has grown under the Look East (1991) and Act East (2014) policies and the ASEAN–India Trade in Goods Agreement (2010).
Pattern: (i) partners: Singapore (also a major investor and financial hub), Indonesia, Malaysia, Vietnam and Thailand account for most of the trade; (ii) imports: palm oil from Indonesia and Malaysia, coal from Indonesia, and electronics, machinery and chemicals from Singapore, Vietnam and Thailand; (iii) exports: petroleum products, engineering goods, rice, meat, sugar, pharmaceuticals and chemicals; (iv) balance: India runs a large and growing deficit with ASEAN, as the FTA lowered tariffs on imports more than it boosted Indian exports, prompting a review of the agreement; (v) connectivity: sea routes through the Malacca Strait, and projects such as the India–Myanmar–Thailand Trilateral Highway.
Map: Map of South and South-East Asia showing India's trade flows with Singapore, Indonesia, Malaysia, Vietnam and Thailand, with the Malacca Strait.
Reworking the FTA and integrating with regional value chains can make this trade more balanced.
Example 19 (UPSC 2014, 15 marks): What are the desired possible changes in our trade policy to promote the development of cottage industry?
Paper and question: Paper II, Q4(c)
Approach: Explain why cottage industries need trade-policy support, then suggest specific changes (export promotion, e-commerce and courier exports, branding and GI, credit and inputs, protection against unfair imports, FTAs), linking to existing measures. Draw a map of export-oriented craft clusters.
Cottage industries such as handlooms, handicrafts, carpets, coir and khadi employ millions of rural artisans and have strong export potential, but they are small, scattered and poorly linked to global markets. Trade policy can help them compete.
Desired changes: (i) simplified export procedures for small consignments, building on the Foreign Trade Policy 2023's higher limit for courier exports and its e-commerce export hubs; (ii) Districts as Export Hubs and One District One Product, with district export plans for craft clusters such as Moradabad brassware, Bhadohi carpets and Kanchipuram silk; (iii) branding and GI promotion abroad, through 'India Handmade' and trade fairs; (iv) cheaper credit and inputs, such as interest equalisation for MSME exporters and duty-free import of raw materials and tools; (v) protection against unfair imports, such as anti-dumping duties and quality control orders on cheap machine-made imitations, as with toys from 2021; (vi) market access through FTAs, seeking lower tariffs for handlooms and handicrafts in the UAE, the UK, Australia and Europe; (vii) design and quality support through export promotion councils.
Benefits: higher artisan incomes, preservation of crafts, rural employment and diversified exports.
Map: Map of India marking export-oriented craft clusters: Moradabad, Bhadohi, Jaipur, Kanchipuram, Varanasi, Srinagar and Kerala coir.
An artisan-friendly trade policy can turn cottage industries into competitive exporters.
3. Communication, Information Technology and the Indian Space Programme
Example 20 (UPSC 2026, 15 marks): Critically examine the environmental and economic consequences of India's rise as a global data centre hub.
Paper and question: Paper II, Q8(c)
Approach: Show India's rise as a data-centre hub with data and locational factors, then examine critically its economic benefits and costs and its environmental consequences (power, water, land, e-waste), ending with a balanced way forward. Draw a map of data-centre clusters.
India's operational data-centre capacity crossed about 1.5 GW in 2025 (CBRE and Knight Frank estimates), with Mumbai–Navi Mumbai holding roughly half, followed by Chennai, Hyderabad, Delhi NCR, Pune and Bengaluru. Very large new campuses are planned, such as the gigawatt-scale AI hub announced by Google with partners at Visakhapatnam (2025).
Locational factors: submarine cable landing stations at Mumbai and Chennai, a huge and growing domestic data market, data-localisation and privacy rules (Digital Personal Data Protection Act, 2023) and state incentives.
Economic consequences: (i) large investment by global cloud firms and Indian conglomerates; (ii) support for digital public infrastructure, AI (IndiaAI Mission, 2024) and digital services; (iii) data sovereignty and lower latency. However, (iv) data centres are capital-intensive but create relatively few permanent jobs; (v) benefits concentrate in a few metros and hardware is imported.
Environmental consequences: (i) electricity: data centres run continuously and consume large amounts of power, and while India's grid still relies heavily on coal, this raises emissions unless supplied by renewables; (ii) water: cooling uses much water in already water-stressed cities such as Chennai, Hyderabad and Mumbai; (iii) e-waste from frequent replacement of servers and batteries.
Way forward: renewable power purchase agreements and on-site solar, efficient and low-water cooling (liquid and free-air cooling, treated wastewater) and green data-centre standards.
Map: Map of India marking data-centre clusters (Mumbai–Navi Mumbai, Chennai, Hyderabad, Delhi NCR, Pune, Bengaluru, Visakhapatnam) and submarine cable landing points.
India can gain from the data economy if growth is matched by clean energy and careful water use.
Example 21 (UPSC 2024, 15 marks): The Indian Space Policy, 2023 supports the commercial presence in space. In what ways will it benefit the socio-economic development and security of India?
Paper and question: Paper II, Q2(b)
Approach: Outline the Indian Space Policy 2023 and the institutions it sets up, then explain how commercial presence benefits socio-economic development and security, with examples and caveats. Draw a diagram of the new space ecosystem.
The Indian Space Policy 2023 allows private, non-government entities to take part in the entire space value chain: building satellites and rockets, launch services, ground stations and space-based applications. ISRO is to focus on research, advanced technology and exploration, while IN-SPACe (2020) authorises and promotes private activity and NewSpace India Limited (NSIL) commercialises ISRO's products. FDI rules were liberalised in 2024.
Socio-economic benefits: (i) growth of the space economy, which IN-SPACe aims to raise from about 2% of the global market to around 44 billion US dollars by 2033; (ii) start-ups and jobs: Skyroot launched India's first private rocket (Vikram-S, 2022), Agnikul flew a 3D-printed engine (2024), and Pixxel and Dhruva Space build satellites; (iii) services: cheaper satellite broadband for remote areas, earth observation for agriculture, insurance, urban planning and disaster management, and navigation for logistics; (iv) exports of launch and satellite services.
Security benefits: (i) more satellites for surveillance, communication and navigation, supporting programmes such as the planned constellation of surveillance satellites; (ii) indigenous supply chains that reduce dependence on foreign providers; (iii) faster, cheaper launch capacity; (iv) private innovation in space situational awareness.
Caveats: India still lacks a dedicated space activities law, and there are concerns over liability, debris, spectrum and data security.
Diagram: Diagram of India's space ecosystem showing ISRO (R&D), IN-SPACe (regulator and promoter), NSIL (commercial arm) and private firms across launch, satellites, ground segment and applications.
The policy can make space a driver of growth and security if a clear legal framework follows.
Example 22 (UPSC 2023, 10 marks): Examine the role of Indian Earth Observation Satellite Technology in enhancing weather forecasting and disaster management.
Paper and question: Paper II, Q1(c)
Approach: Name India's key earth observation and meteorological satellites, then show their role in weather forecasting and in each phase of disaster management, with examples. Draw a diagram of the satellite-based forecasting and disaster cycle.
India operates a large fleet of earth observation satellites: the INSAT-3D, 3DR and 3DS meteorological satellites, Oceansat-3, the RISAT radar imaging satellites, the Cartosat series and the NASA–ISRO NISAR radar satellite (launched 2025).
Weather forecasting: geostationary satellites give half-hourly cloud images, temperature and moisture profiles; data on sea surface temperature and winds over the oceans feed IMD's numerical models; and continuous tracking improves monsoon and cyclone forecasts, as used under Mission Mausam (2024).
Disaster management: (i) early warning: accurate cyclone tracks allowed the mass evacuation that kept deaths low in Phailin (2013) and Fani (2019); (ii) response: radar satellites map floods through clouds, as in Assam and Kerala, and the NRSC's Decision Support Centre provides damage maps; (iii) recovery and mitigation: hazard zonation for landslides and floods, drought monitoring, and Bhuvan geoportal services for planners.
Diagram: Cycle diagram linking satellite observation to forecasting, warning, response and recovery.
Satellite technology has thus made Indian forecasting and disaster management far more effective.
Example 23 (UPSC 2022, 15 marks): Critically examine the role of IRNSS-NavIC programme on the satellite navigation system of India.
Paper and question: Paper II, Q6(b)
Approach: Explain why India built NavIC and how it works, examine its role and achievements in satellite navigation, then its weaknesses critically, ending with the way forward. Draw a diagram of the NavIC constellation and coverage.
The Indian Regional Navigation Satellite System (IRNSS), named NavIC, is India's own satellite navigation system. Its need was highlighted when India was denied GPS data during the Kargil conflict (1999). It was designed with seven satellites in geostationary and geosynchronous orbits to cover India and about 1,500 km around it.
Role and achievements: (i) strategic autonomy: an encrypted restricted service for the armed forces reduces dependence on the American GPS and other foreign systems; (ii) civilian services: a standard positioning service with an accuracy of better than about 20 m, used in vehicle tracking (mandatory for commercial vehicles under AIS-140), fishermen's alerts, disaster warnings, surveying and railway tracking; (iii) smartphone support: several chipsets now support NavIC; (iv) new generation: the NVS series, beginning with NVS-01 (2023), carries an indigenous atomic clock and an L1 signal compatible with mass-market devices; (v) recognition by the International Maritime Organization for navigation in the Indian Ocean.
Weaknesses: (i) atomic clock failures on several of the first-generation satellites reduced the number of fully working satellites; (ii) the NVS-02 satellite (launched January 2025) could not reach its intended orbit; (iii) regional coverage limits its global use; (iv) slow adoption in consumer devices and dependence on imported components.
Diagram: Diagram showing NavIC satellites in geostationary and inclined geosynchronous orbits with a coverage circle over India and 1,500 km beyond.
Replenishing the constellation with NVS satellites and promoting user adoption are essential for NavIC to fulfil its role.
Example 24 (UPSC 2021, 20 marks): Examine how information and communication technology has boosted the development of certain regions of India.
Paper and question: Paper II, Q8(a)
Approach: Explain how ICT drives regional development (clustering, agglomeration, spillovers), then examine the regions it has boosted (Bengaluru, Hyderabad, Pune, Chennai, NCR, Kolkata, Kochi and tier-2 cities) and its wider effects, noting the uneven pattern. Draw a map of ICT hubs.
Information and communication technology (ICT) industries, including software, IT-enabled services, global capability centres and electronics, depend on skilled people, connectivity and urban amenities rather than raw materials, so they cluster in a few cities and transform their regions. India's IT–BPM industry earned about 283 billion US dollars in 2024–25 (NASSCOM) and employs several million people.
Regions boosted: (i) Bengaluru: early public-sector electronics and research institutions (ISRO, IISc, HAL), Electronics City and the Software Technology Parks of India (1991) made it the 'Silicon Valley of India'; (ii) Hyderabad: HITEC City and Cyberabad, strong state policy and global firms; (iii) Pune and Mumbai: Hinjewadi IT park and financial services technology; (iv) Chennai: IT corridor on Old Mahabalipuram Road and electronics manufacturing at Sriperumbudur; (v) Delhi NCR: Gurugram and Noida for IT services and electronics such as Samsung's phone plant; (vi) Kolkata (Salt Lake Sector V), Kochi (Infopark) and Thiruvananthapuram (Technopark); (vii) emerging tier-2 centres such as Bhubaneswar, Coimbatore, Jaipur, Indore and Mohali.
Development effects: (i) high-income jobs and a large middle class; (ii) growth of real estate, retail, transport and services through multiplier effects; (iii) higher state revenues and urban infrastructure, such as metro rail; (iv) start-up ecosystems.
Uneven pattern: ICT growth has widened the gap between southern and western states and the eastern and north-eastern states, and between metros and rural areas, while metros face congestion, water stress and housing costs.
Spreading the gains: BharatNet rural broadband, IT parks in smaller cities, the BPO promotion schemes for small towns and the north-east, and remote work can carry ICT beyond the metros.
Map: Map of India marking ICT hubs (Bengaluru, Hyderabad, Pune, Chennai, NCR, Mumbai, Kolkata, Kochi, Thiruvananthapuram) and emerging tier-2 centres.
ICT has been a powerful engine of regional growth, but deliberate policies are needed to spread its benefits more evenly.
Example 25 (UPSC 2020, 20 marks): India has opened-up its space to private sector for satellite based activities. Critically examine its implications indicating the major security concerns.
Paper and question: Paper II, Q3(a)
Approach: Describe the opening of the space sector to private players (reforms of 2020, IN-SPACe, Space Policy 2023, FDI 2024), examine its implications (economic, technological, strategic), and then the major security concerns and safeguards. Draw a diagram of the opportunities and risks.
In 2020 the Government opened the space sector to private firms for satellite manufacturing, launch services and space-based applications, creating IN-SPACe to authorise and supervise them and strengthening NewSpace India Limited as ISRO's commercial arm. The Indian Space Policy (2023) and liberalised FDI rules (2024) confirmed this shift.
Positive implications: (i) economic: a larger share of the global space economy, investment and high-skill jobs, with more than a hundred space start-ups; (ii) technological: faster innovation and lower costs, as in Skyroot's Vikram-S (2022) and Agnikul's 3D-printed engine (2024), and the transfer of PSLV and SSLV production to industry; (iii) capacity: ISRO can concentrate on deep-space missions, Gaganyaan and the Bharatiya Antariksh Station; (iv) services: satellite broadband, high-resolution imagery and applications for agriculture, logistics and disaster management.
Major security concerns: (i) data security: high-resolution imagery and geospatial data could be misused or leak to hostile actors, so remote-sensing and geospatial data policies (2021–22) regulate sensitive data; (ii) foreign ownership and supply chains: FDI and imported components could create dependence or backdoors, especially from rival countries; (iii) dual-use technologies such as launch vehicles and propulsion could proliferate; (iv) cyber and signal threats such as hacking and jamming of satellites; (v) regulatory gaps: the absence of a comprehensive space activities law leaves liability and licensing unclear.
Safeguards: licensing and security clearance by IN-SPACe, restrictions on investment from countries sharing land borders (Press Note 3, 2020), a shutter-control power over imagery during emergencies, encryption, indigenous supply chains and a dedicated space law.
Strategic gains: a larger, more resilient satellite fleet strengthens surveillance and communication for the armed forces and the Defence Space Agency (2019).
Diagram: Two-column diagram of opportunities (investment, innovation, services, capacity) and security risks (data leakage, foreign control, dual-use, cyber threats, debris), with safeguards linking them.
Opening up the space sector is beneficial on balance, provided strong regulation keeps national security interests protected.
Example 26 (UPSC 2020, 20 marks): Digital Divide in India needs quick redressal to reduce regional disparity in development. Elaborate with suitable examples.
Paper and question: Paper II, Q6(a)
Approach: Define the digital divide and its dimensions, give evidence of its spatial and social pattern (TRAI, NFHS-5), explain how it widens regional disparity with examples, then the measures for quick redressal. Draw a map of internet penetration by state.
The digital divide is the gap between those who have access to digital devices, connectivity and the skills to use them and those who do not. In India it has spatial (urban–rural, state), social (gender, caste, income) and skill dimensions.
Evidence: (i) India has close to a billion internet subscribers (TRAI, 2025), but rural teledensity is less than half of urban teledensity; (ii) NFHS-5 (2019–21) found that only about 33% of women had ever used the internet compared with about 57% of men, and the gap was much wider in rural areas; (iii) internet penetration is highest in Delhi, Kerala, Goa, Punjab, Maharashtra and Tamil Nadu and lowest in Bihar, Jharkhand, Odisha, Chhattisgarh, Uttar Pradesh and parts of the north-east.
How it widens regional disparity: (i) education: during the COVID-19 school closures, children in poorer states and villages without smartphones or data fell behind; (ii) services and welfare: online delivery of benefits, banking and health services is harder where connectivity and skills are poor; (iii) economy: IT, start-ups, e-commerce and digital jobs concentrate in already-developed metros of the south and west; (iv) agriculture: farmers without access miss e-NAM prices, weather advisories and digital credit.
Measures for quick redressal: (i) complete the amended BharatNet project for broadband to every village; (ii) PM-WANI public Wi-Fi and towers under the Universal Service Obligation Fund (now Digital Bharat Nidhi) for remote and border areas; (iii) digital literacy through PMGDISHA, with a focus on women and the elderly; (iv) affordable devices and data; (v) services in Indian languages (Bhashini); (vi) assisted access through Common Service Centres.
Map: Choropleth map of India showing internet subscribers per 100 people by state, high in Delhi, Kerala and Punjab and low in Bihar, Jharkhand and Odisha.
Bridging the digital divide quickly is essential to make Digital India a tool for reducing, not widening, regional disparity.
Example 27 (UPSC 2019, 15 marks): Examine ongoing space programmes of India and their implications for national security in future.
Paper and question: Paper II, Q3(b)
Approach: Survey India's ongoing space programmes (launch vehicles, earth observation, communication, navigation, exploration, human spaceflight), then examine their implications for national security in the future. Draw a diagram linking programmes to security functions.
India's space programme, begun for development, now also underpins national security as space becomes a domain of warfare.
Ongoing programmes: (i) launch vehicles: PSLV, GSLV, LVM3 and the small SSLV, with a next-generation launch vehicle planned; (ii) earth observation: Cartosat, RISAT and EOS series, and NISAR (2025) with NASA; (iii) communication: GSAT satellites, including the military GSAT-7 (Navy) and GSAT-7A (Air Force); (iv) navigation: NavIC and the NVS series; (v) exploration: Chandrayaan-3, which landed near the lunar south pole in August 2023, Aditya-L1 solar observatory (2023) and the SpaDeX docking experiment (2025); (vi) human spaceflight: Gaganyaan and the planned Bharatiya Antariksh Station by 2035.
Implications for national security: (i) surveillance and reconnaissance of borders and oceans through high-resolution optical and radar satellites, to be expanded by a planned constellation of surveillance satellites; (ii) secure communication for the armed forces; (iii) independent navigation and precision targeting through NavIC; (iv) counter-space capability, demonstrated by the anti-satellite test Mission Shakti (2019), which signals deterrence; (v) institutions such as the Defence Space Agency (2019) and the Defence Space Research Organisation; (vi) technologies such as docking, re-entry and heavy lift that also have strategic uses.
Challenges: vulnerability of satellites to jamming, cyber attacks and anti-satellite weapons, space debris, and China's larger space programme.
Diagram: Diagram linking space programmes (EO, communication, navigation, launch, ASAT) to security functions (surveillance, command and control, navigation, deterrence).
Integrating civilian, commercial and military space efforts will be vital for India's future security.
Example 28 (UPSC 2019, 15 marks): Examine the development of information technology in India and its influence on work culture and society.
Paper and question: Paper II, Q4(b)
Approach: Trace the development of IT in India (phases, policies, hubs, data), then examine its influence on work culture and on society, both positive and negative. Draw a map of IT hubs.
Development of IT: India's IT industry grew from software exports in the 1980s through the Software Technology Parks of India (1991), liberalisation and the Y2K opportunity, to today's IT–BPM industry earning about 283 billion US dollars (NASSCOM, 2024–25), with global capability centres, digital public infrastructure (Aadhaar, UPI) and a large start-up ecosystem. Bengaluru, Hyderabad, Pune, Chennai, NCR and Mumbai are the main hubs.
Influence on work culture: (i) global, merit-based work, with English-speaking, project-based teams working across time zones; (ii) flexible and remote work, which spread after COVID-19, together with gig and platform work; (iii) women's participation in professional jobs has risen; (iv) constant upskilling as technologies change rapidly (cloud, AI); (v) but also long hours, night shifts, job insecurity, burnout and automation-related layoffs.
Influence on society: (i) social mobility: a new urban middle class, including first-generation graduates from small towns; (ii) urbanisation and migration to IT cities, changing lifestyles and consumer culture; (iii) digital inclusion: UPI payments, e-governance, telemedicine and online education reach millions; (iv) family and social change: nuclear families, delayed marriage and dual-career couples; (v) new divides: digital and regional inequality, and concerns over privacy and online harms.
Map: Map of India marking major IT hubs and emerging tier-2 IT cities.
IT has modernised Indian work and society, but its benefits must be spread more widely and its stresses managed.
Example 29 (UPSC 2017, 10 marks): Bring out the significance of Indian Regional Navigation Satellite System (IRNSS).
Paper and question: Paper II, Q5(c)
Approach: Explain what IRNSS (NavIC) is and its significance for strategic, economic and civilian purposes. Draw a coverage diagram.
The Indian Regional Navigation Satellite System (IRNSS), or NavIC, is India's independent satellite navigation system, developed by ISRO with satellites in geostationary and geosynchronous orbits covering India and about 1,500 km around it.
Significance: (i) strategic autonomy: after India was denied GPS data during the Kargil conflict (1999), NavIC gives the armed forces an assured, encrypted restricted service for navigation and precision-guided weapons; (ii) civilian uses: a standard positioning service for vehicle tracking, fleet management, mapping, surveying and timing for power grids, telecommunications and banking; (iii) disaster management and fisheries: alerts to fishermen at sea and support during cyclones; (iv) economic and technological gains: a domestic industry for receivers and chips; (v) regional diplomacy: services can be offered to neighbouring countries.
Diagram: Diagram of NavIC satellites with the coverage area over India and the surrounding region up to about 1,500 km.
NavIC thus combines national security with development, though the constellation must be kept fully operational.
Example 30 (UPSC 2015, 15 marks): Evaluate the contribution of Communication and Information Technology to the development of economy and society, and examine the relevance of the recently launched 'Digital India' programme.
Paper and question: Paper II, Q3(c)
Approach: Evaluate the contribution of communication and IT to the economy and society with evidence, then examine the relevance of the Digital India programme (2015), its pillars and outcomes, with limits. Draw a diagram of Digital India's pillars.
Contribution to the economy: the IT–BPM industry earns about 283 billion US dollars (NASSCOM, 2024–25), mostly from exports, and makes services India's largest export earner; telecommunications and cheap mobile data have enabled e-commerce, fintech and the gig economy; and digital payments through UPI crossed 20 billion transactions a month in 2025 (NPCI), formalising the economy.
Contribution to society: mobile phones and the internet have improved access to information, education, health (telemedicine through eSanjeevani) and markets; direct benefit transfers through Aadhaar-linked accounts reduce leakages; and social media has changed civic participation, though it also spreads misinformation.
Digital India (2015): launched to transform India into a digitally empowered society, with three vision areas: digital infrastructure as a utility for every citizen, governance and services on demand, and the digital empowerment of citizens. Its nine pillars include broadband highways (BharatNet), universal mobile access, public internet access, e-governance, e-Kranti (electronic delivery of services) and electronics manufacturing.
Relevance and outcomes: it built India's digital public infrastructure (Aadhaar, UPI, DigiLocker, CoWIN, ONDC), extended fibre to many gram panchayats, supported electronics manufacturing (mobile phones) and enabled welfare delivery during COVID-19.
Limits: the digital divide by region and gender, slow BharatNet completion, cyber security and data privacy concerns (addressed partly by the Digital Personal Data Protection Act, 2023) and exclusion through authentication failures.
Diagram: Diagram of Digital India's three vision areas and nine pillars around a central goal of a digitally empowered society.
Digital India remains highly relevant, but inclusion and trust must keep pace with technology.
Mains points
- Transport questions are about regional development: link each network (pipelines, waterways, RRTS, airways, roads) to the regions it opens up, using ideas such as accessibility, connectivity and the Taaffe–Morrill–Gould sequence.
- Trade questions need current Ministry of Commerce data (for example the 2024–25 merchandise deficit of about 283 billion US dollars and the record deficit with China) and the Foreign Trade Policy 2023, FTAs and the Act East Policy.
- Port questions reward naming new and major ports (Vadhavan, Vizhinjam, Mundra, JNPA, Deendayal) and the four pillars of Sagarmala, with a coastal map.
- Space and IT questions are frequent: know NavIC, the Indian Space Policy 2023, IN-SPACe, recent missions (Chandrayaan-3, Aditya-L1, NISAR, SpaDeX), Digital India, BharatNet and the digital divide with NFHS-5 and TRAI data.
- Always add a map: pipeline grid, national waterways, RRTS and airports, ports and Sagarmala clusters, IT hubs, or a diagram of the space-economy value chain.
Did you know?
- The Motihari–Amlekhgunj pipeline (2019) carrying petroleum products from India to Nepal was South Asia's first cross-border petroleum pipeline.
Geography Optional: All chapters
- Exam Pattern, Syllabus and Strategy
- The Earth's Interior and Tectonics
- Geomorphic Processes and Landscape Development
- Climatology: Atmosphere and Circulation
- Climatology: Weather Systems, Climates and Climate Change
- Oceanography
- Biogeography
- Environmental Geography
- Perspectives in Human Geography
- Economic Geography
- Population Geography
- Settlement Geography
- Regional Planning
- Models, Theories and Laws in Human Geography
- India: Physical Setting I
- India: Physical Setting II
- Resources of India
- Agriculture in India
- Industry in India
- Transport, Communication and Trade
- Cultural Setting and Population of India
- Settlements in India
- Regional Development and Planning in India
- Political Aspects
- Contemporary Issues
- Places for the Map Question