
Geography Optional · UPSC Notes
Oceanography — UPSC Geography Optional Notes
Free, exam-focused notes for UPSC Prelims and Mains, with Prelims tips and Mains points for every topic. 6 topics.
Open in the interactive reader: bookmarks, progress tracking and read-aloud.
Ocean Bottom Topography and Ocean Deposits
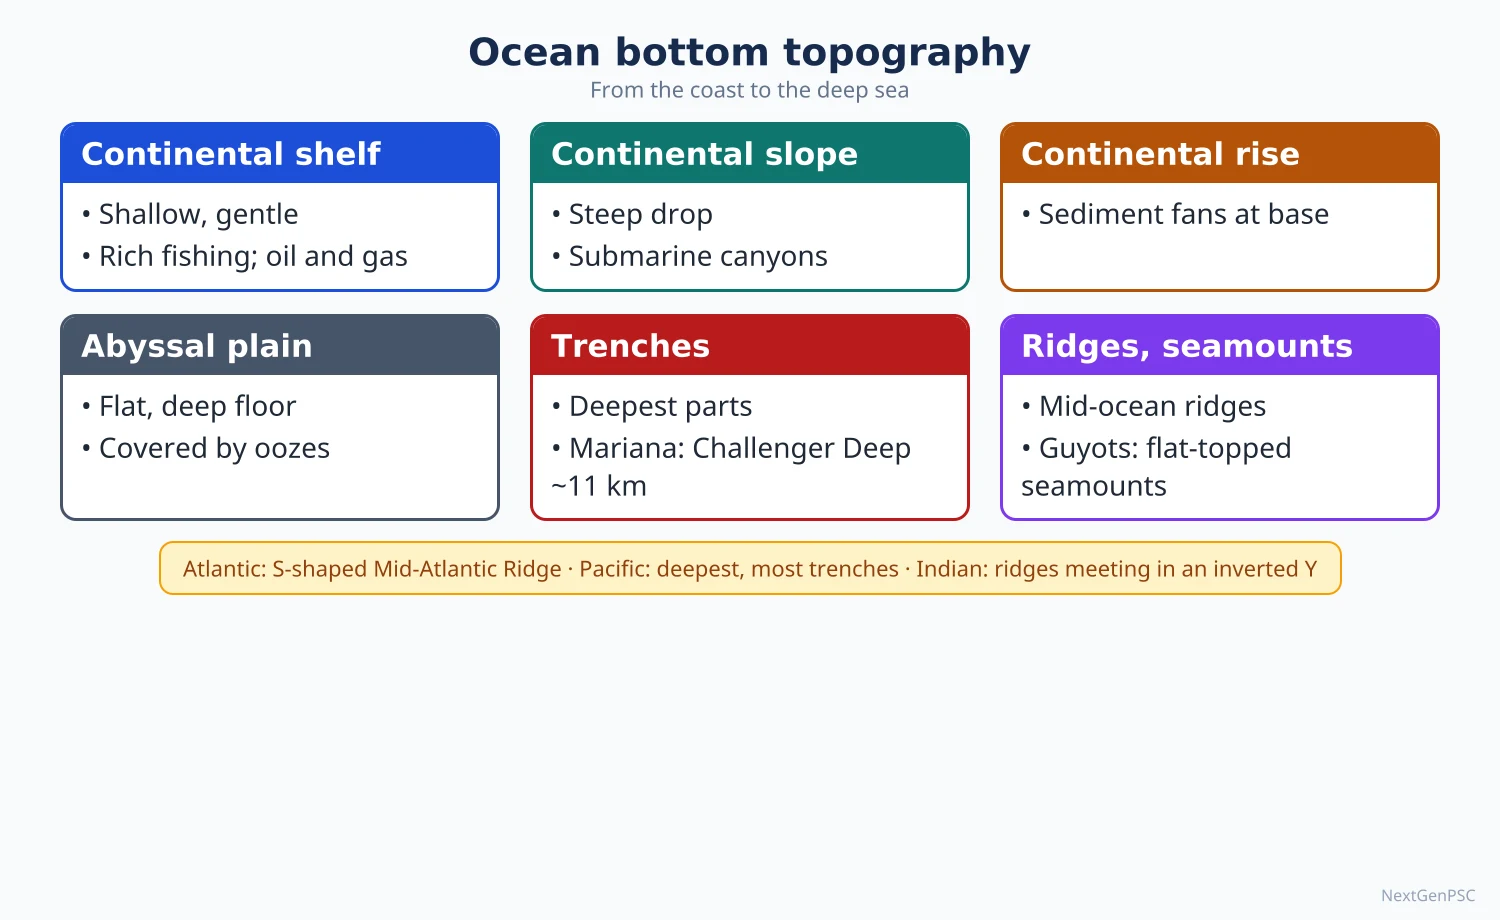
The ocean floor has four major relief divisions: the continental shelf, continental slope, continental rise and abyssal plain, with minor features such as mid-ocean ridges, trenches, seamounts, guyots and submarine canyons. The Atlantic has the S-shaped Mid-Atlantic Ridge, the Indian Ocean an inverted-Y ridge system and the Pacific the deepest trenches. Ocean deposits are classed as terrigenous (from land, near continents) and pelagic (oozes and red clay, in the deep sea).
In simple words
The ocean floor is not flat; it has plains, mountains and deep valleys like the land, only hidden under water.
Imagine draining a bathtub shaped like a stadium: a shallow ledge near the edge (the continental shelf), a steep step down, a wide flat floor, a long mountain chain in the middle and narrow deep cracks near some edges.
These shapes control fishing grounds, oil and minerals, cables, ports and tsunamis.
UPSC asks you to compare the relief of the three oceans and to classify ocean deposits, usually with a profile diagram.
1. Concepts and definitions
Bathymetry: the measurement and mapping of ocean depths; modern maps use echo-sounding (sonar), multibeam surveys and satellite altimetry, which reads sea-floor relief from tiny bumps in the sea surface.
Hypsographic curve: a graph of the percentage of the earth's surface lying above or below each height or depth; it shows two dominant levels, the continental platform near sea level and the deep ocean floor at about 4,000–5,000 m.
Continental shelf: the gently sloping, submerged edge of a continent, usually to about 150–200 m depth with a gradient of about 1° or less; its width varies from almost nil (parts of the west coast of South America) to over 1,000 km (Siberian shelf in the Arctic).
Continental slope: the steeper zone (commonly 2°–5°) from the shelf edge down to about 3,000 m; it marks the true edge of the continental crust and is cut by submarine canyons.
Continental rise: a gentle apron of sediment at the foot of the slope, built mainly by turbidity currents and submarine fans.
Abyssal plain: the flat, sediment-covered deep floor at about 3,000–6,000 m, among the flattest surfaces on earth.
Mid-ocean ridge: a continuous submarine mountain system, over 60,000 km long, at divergent plate boundaries, with a central rift valley and transform faults.
Trench (deep): a long, narrow, very deep depression at a subduction zone; the Challenger Deep in the Mariana Trench, nearly 11,000 m deep, is the deepest known point.
Seamount and guyot: a seamount is an isolated submarine volcano rising over 1,000 m from the floor; a guyot is a flat-topped seamount whose top was planed by waves before it subsided (named by Harry Hess, 1946).
Submarine canyon: a steep, V-shaped valley cut into the shelf and slope, often off large river mouths (Hudson canyon; the Swatch of No Ground off the Ganga-Brahmaputra delta).
2. Processes that shape the ocean floor
Sea-floor spreading: Harry Hess (1962) proposed that new crust forms at ridges and moves away; Vine and Matthews (1963) confirmed it with symmetrical magnetic stripes on either side of ridges.
Subduction: old, cold, dense oceanic crust sinks at trenches, forming island arcs (Japan, Aleutians, Andaman-Nicobar arc) and deep earthquakes.
Hotspots: fixed mantle plumes build seamount chains as plates move over them; the Hawaiian-Emperor chain records Pacific plate motion, and the Ninety East Ridge is widely interpreted as the track of the Kerguelen hotspot.
Sedimentation: rivers, turbidity currents and wind supply sediment; the continental rise and submarine fans grow at the foot of the slope.
Sea-level changes: shelves were exposed during glacial low sea levels (about 120 m lower at the last glacial maximum, about 20,000 years ago), so some shelf features are drowned river valleys and old shorelines.
Origin of submarine canyons (debated): erosion by turbidity currents is the most accepted cause; others argue some canyons were cut by rivers when sea level was low, or follow faults.
3. Bottom relief of the Atlantic Ocean
Mid-Atlantic Ridge: an S-shaped ridge running from Iceland to near Bouvet Island, roughly parallel to the coasts; its northern part is called the Dolphin Rise and its southern part the Challenger Rise.
Islands on the ridge: Iceland, the Azores, Ascension, St Helena and Tristan da Cunha are volcanic peaks rising above sea level.
Transverse ridges: the Wyville Thomson Ridge (between Scotland and the Faroes), the Walvis Ridge (off south-west Africa) and the Rio Grande Rise (off Brazil) divide the basins.
Equatorial break: the Romanche Trench (fracture zone) near the equator cuts across the ridge.
Trenches: few; the Puerto Rico Trench (deepest in the Atlantic, about 8,400 m) and the South Sandwich Trench.
Shelves: very wide around north-west Europe (North Sea, Dogger Bank), Newfoundland (Grand Banks) and Argentina (Patagonian shelf), which is why the Atlantic has rich fishing banks.
Marginal seas: the Mediterranean, Caribbean, Gulf of Mexico, North Sea and Baltic.
4. Bottom relief of the Indian Ocean
Mid-Indian Ocean Ridge: an inverted-Y system: the Central Indian Ridge (with the Carlsberg Ridge in the north-west), the Southwest Indian Ridge towards Africa and the Southeast Indian Ridge towards Australia, meeting at the Rodrigues Triple Junction.
Ninety East Ridge: a long, straight aseismic ridge along about 90° E, running for over 4,000 km north-south.
Chagos-Laccadive Ridge: a submarine ridge carrying Lakshadweep, the Maldives and the Chagos islands, capped by coral atolls.
Trench: the Sunda (Java) Trench south of Indonesia, the deepest part of the Indian Ocean, at about 7,000–7,500 m.
Submarine fans: the Bengal Fan, the largest submarine fan in the world, built by Ganga-Brahmaputra sediment, and the Indus Fan in the Arabian Sea.
Plateaus and islands: the Kerguelen Plateau, Madagascar (a continental fragment), Socotra, the Seychelles bank (granitic continental fragment), Mauritius and Reunion (volcanic).
Indian shelves: wider off the west coast (widest off Gujarat and Mumbai, where Mumbai High oil field lies) than off the east coast; the shelf around the Andaman-Nicobar arc is narrow.
5. Bottom relief of the Pacific Ocean
Largest and deepest ocean: covers about one-third of the earth's surface with the greatest mean depth.
Trenches: mostly on the western margin: Mariana, Tonga, Kermadec, Kuril-Kamchatka, Japan, Philippine and Aleutian; on the east, the Peru-Chile (Atacama) Trench.
East Pacific Rise: a fast-spreading ridge in the south-east, lying far from the centre of the ocean, unlike the Atlantic ridge.
Seamounts and guyots: more numerous than in any other ocean; the Hawaiian-Emperor chain bends at about 47 million years ago, recording a change in plate motion.
Margins: the west has island arcs and marginal seas (Bering, Okhotsk, Japan, East China, South China, Philippine seas); the east has narrow shelves along the young fold mountains of the Americas.
Ring of Fire: the trench-arc belt around the Pacific has most of the world's active volcanoes and large earthquakes.
6. Ocean deposits
Classification: John Murray and A.F. Renard classified deep-sea deposits from samples of the Challenger expedition (1872–76) into terrigenous and pelagic deposits.
Terrigenous (lithogenous) deposits: fragments of land rock brought by rivers, wind, glaciers and waves; coarse near the coast, finer outward; types are mud (blue, red and green muds), sand and gravel, mostly on shelves and slopes.
Volcanic deposits: ash and pumice near volcanic arcs and islands.
Pelagic deposits, oozes: fine sediments with more than 30% skeletal remains of plankton.
Calcareous oozes: globigerina ooze (foraminifera; the most widespread ooze, extensive in the Atlantic) and pteropod ooze (shallower tropical floors).
Siliceous oozes: diatom ooze (cold southern oceans around Antarctica and the North Pacific) and radiolarian ooze (deep tropical Pacific and Indian Ocean).
Red clay: extremely fine inorganic clay, wind-blown dust and volcanic ash that accumulates very slowly; the most extensive deep-sea deposit, dominant in the deep Pacific.
Carbonate compensation depth (CCD): the depth (roughly 4,000–5,000 m, varying by ocean) below which calcium carbonate dissolves faster than it accumulates; hence calcareous oozes are absent from the deepest floors where red clay and siliceous oozes dominate.
Hydrogenous deposits: minerals precipitated from sea water, such as polymetallic (manganese) nodules on abyssal plains and phosphorite on shelves.
7. Maps and diagrams to draw
Ocean floor profile: draw a horizontal sea-level line; from the left coast draw a gentle shelf to about 200 m, a steep slope to about 3,000 m, a gentle rise, a long flat abyssal plain at about 5,000 m, a seamount and a flat-topped guyot, then a central ridge with a rift valley, and on the right a narrow trench next to an island arc; label each.
Atlantic sketch: outline the ocean, draw an S-shaped line down the middle labelled Mid-Atlantic Ridge, mark Iceland, Azores, St Helena and Tristan da Cunha on it, the Walvis Ridge and Rio Grande Rise as cross-bars, and the Puerto Rico Trench as a short thick line.
Indian Ocean sketch: draw an inverted Y in the centre, label Carlsberg, Central, Southwest and Southeast Indian Ridges, a straight line at 90° E (Ninety East Ridge), a dotted line from Lakshadweep to Chagos, the Sunda Trench south of Java, and shade the Bengal Fan.
Deposits map: shade terrigenous deposits along all coasts, globigerina ooze over the Atlantic and western Indian Ocean, diatom ooze as a belt around Antarctica and red clay over the central and north Pacific.
8. Using it in the exam
10-mark answer: define the feature (for example, guyot or continental shelf), give its origin and one named example, with a small profile sketch.
15-mark answer: compare the bottom relief of two oceans under ridges, trenches, shelves and islands, with a sketch of one ocean.
20-mark answer: describe the relief of an ocean with a map, explain it through plate tectonics, and end with its economic importance (fishing banks, oil, nodules, cables).
Keywords: hypsographic curve, sea-floor spreading, subduction, hotspot track, turbidity current, carbonate compensation depth.
Attribution to remember: Harry Hess named guyots in 1946 and proposed sea-floor spreading in 1962; Murray and Renard classified ocean deposits from the Challenger samples.
| Feature | Atlantic | Indian | Pacific |
|---|---|---|---|
| Mid-ocean ridge | S-shaped Mid-Atlantic Ridge in the centre | Inverted-Y Mid-Indian Ocean Ridge with Carlsberg Ridge | East Pacific Rise, off-centre in the south-east |
| Deepest trench | Puerto Rico Trench (about 8,400 m) | Sunda (Java) Trench (about 7,000–7,500 m) | Mariana Trench, Challenger Deep (nearly 11,000 m) |
| Number of trenches | Few | Few | Many, mostly on the western margin |
| Continental shelves | Very wide in the north (North Sea, Grand Banks) | Wider off western India, narrow elsewhere | Narrow on the east, island arcs on the west |
| Special features | Walvis Ridge, Rio Grande Rise, Romanche Trench | Ninety East Ridge, Chagos-Laccadive Ridge, Bengal Fan | Hawaiian-Emperor chain, most guyots, Ring of Fire |
| Dominant deep deposit | Globigerina ooze | Globigerina ooze west, red clay east | Red clay |
| Type | Origin | Where found |
|---|---|---|
| Terrigenous muds, sands, gravels | Eroded land material brought by rivers, wind, ice | Continental shelves and slopes |
| Volcanic deposits | Ash, pumice, lava fragments | Near volcanic islands and arcs |
| Calcareous ooze (globigerina, pteropod) | Calcium carbonate shells of plankton | Above the CCD, warm and temperate floors |
| Siliceous ooze (diatom, radiolarian) | Silica skeletons of plankton | Cold southern oceans (diatom); deep tropics (radiolarian) |
| Red clay | Fine dust, volcanic ash, meteoric material | Deepest floors below the CCD, especially the Pacific |
Mains points
- Comparisons of the bottom relief of two or three oceans are a recurring angle; answer in a table plus one sketch map.
- Always explain relief through plate tectonics: ridges at divergent boundaries, trenches at subduction zones, seamount chains over hotspots.
- Give the Indian Ocean special attention: Carlsberg Ridge, Ninety East Ridge, Chagos-Laccadive Ridge, Bengal and Indus fans, Sunda Trench.
- For deposits, link type to depth and distance from land, and explain the role of the carbonate compensation depth.
- A common mistake is describing the ocean floor without a profile diagram; a labelled profile is expected even in a 10-mark answer.
- Do not call the Ninety East Ridge a spreading ridge; it is an aseismic ridge, widely seen as a hotspot track.
- Close with economic and strategic relevance: fishing banks on shelves, oil on shelves (Mumbai High), polymetallic nodules on abyssal plains.
Did you know?
- If Mount Everest (8,849 m) were placed in the Challenger Deep, its summit would still be more than 2 km under water.
- Memory trick for deposits by depth: 'Land Sand, Chalk Ooze, Glass Ooze, Red Clay' = terrigenous near land, calcareous above the CCD, siliceous and red clay in the deepest floors.
Temperature, Salinity, Heat and Salt Budgets
Ocean surface temperature falls from about 27–30°C in the tropics to near the freezing point of sea water (about −1.9°C) at the poles, and with depth through the mixed layer, thermocline and cold deep layer. Average salinity is about 35‰ (35 PSU); it is highest in the subtropics, not at the equator, and is controlled by evaporation, precipitation, river inflow and ice. The heat budget balances solar input against back radiation, evaporation and sensible heat, while the salt budget of seas such as the Mediterranean and Red Sea is kept by exchange flows through straits.
In simple words
Sea water differs from place to place in how warm and how salty it is.
Think of a pot of soup on a low flame: the top is warm, the bottom stays cool, and where water boils off the soup gets saltier, while adding water makes it bland; the oceans behave the same way with sun, evaporation and rivers.
Temperature and salinity together decide the density of water, which drives deep currents, fisheries and climate.
UPSC asks about their distribution, controls and the heat and salt budgets.
1. Concepts and definitions
Sea surface temperature (SST): temperature of the top few metres of the ocean, measured by ships, buoys (including Argo floats) and satellites.
Thermocline: the layer in which temperature falls rapidly with depth, usually between about 200 m and 1,000 m in low latitudes; it is weak or absent in polar seas.
Salinity: the total amount of dissolved salts in sea water, expressed in parts per thousand (‰) or in practical salinity units (PSU); the world average is about 35.
Halocline and pycnocline: layers of rapid change in salinity and in density with depth; they act as barriers to vertical mixing.
Isotherms and isohalines: lines joining places of equal temperature and equal salinity on a map.
Principle of constant proportions: although total salinity varies, the major ions keep nearly fixed ratios; proposed by Forchhammer and confirmed by William Dittmar (1884) from Challenger samples.
Composition: chloride (about 55%) and sodium (about 30.6%) dominate, followed by sulphate, magnesium, calcium and potassium.
2. Distribution of temperature
Horizontal pattern: SST falls from the equator to the poles; the highest values (above 28°C) form the Indo-Pacific warm pool, and the thermal equator lies slightly north of the geographical equator because the northern hemisphere has more land.
Ocean currents: warm currents push isotherms poleward on western ocean margins (Gulf Stream, Kuroshio); cold currents and upwelling pull them equatorward on eastern margins (Peru, California, Canary, Benguela).
Enclosed seas: the Red Sea and the Persian Gulf have surface temperatures above 30°C in summer because of strong heating and little exchange; the Baltic is cold.
Annual range: small (about 2–5°C in most open oceans) because water has high specific heat and mixes heat downward; larger in mid-latitude enclosed seas.
Vertical pattern: a warm mixed layer stirred by wind, then the thermocline, then a deep layer at about 2–4°C; polar waters are cold from top to bottom.
Indian seas: the Arabian Sea cools in the south-west monsoon because of upwelling off Somalia, Oman and the Kerala coast, while the Bay of Bengal stays warm (often above 28°C), which supports cyclone formation.
3. Distribution of salinity
Latitudinal pattern: salinity is about 34–35 near the equator (heavy rain balances strong evaporation), highest at about 20°–30° N and S (about 36–37, where dry subtropical high pressure gives high evaporation), and lowest in polar seas (melting ice, low evaporation).
Highest values: the Red Sea (about 40 and above in the north) and the Persian Gulf, where evaporation is very high and river inflow is negligible.
Lowest values: the Baltic Sea (a few units only in the Gulf of Bothnia) because of many rivers, low evaporation and narrow connection to the North Sea.
Indian Ocean contrast: the Arabian Sea is more saline (about 36) because of high evaporation and dry winds, while the Bay of Bengal is fresher (often 30–34, lower in the north after the monsoon) because of inflow from the Ganga, Brahmaputra, Mahanadi, Godavari and Krishna and heavy rain.
Vertical pattern: in the tropics and subtropics salinity often falls with depth through a halocline; in high latitudes surface water may be fresher than the water below.
Inland water bodies: the Dead Sea and the Great Salt Lake are far saltier than the ocean because they have no outlet; Lake Van in Turkey is also very saline.
4. Factors controlling salinity
Evaporation: raises salinity; greatest under clear skies, high temperature and dry trade winds.
Precipitation: lowers salinity; hence the equatorial belt is less saline than the subtropics.
River inflow: lowers salinity near mouths of large rivers (Amazon, Congo, Ganga-Brahmaputra).
Freezing and melting of ice: freezing leaves salt behind and raises salinity of the remaining water; melting lowers it.
Winds and currents: transport saline or fresh water (the Gulf Stream carries saline water northward), and upwelling brings subsurface water to the top.
Degree of enclosure: enclosed seas in dry regions become very saline; enclosed seas in humid regions become fresh.
5. Heat budget of the oceans
Meaning: the balance between heat gained and lost by the ocean over a year; globally and over long periods it is nearly balanced.
Gains: incoming short-wave solar radiation (the main source) and, locally, heat brought by currents and condensation.
Losses: long-wave back radiation, latent heat of evaporation (the largest single loss over most oceans) and sensible heat transfer to the air.
Equation (in words): net heat = solar radiation absorbed − back radiation − evaporation heat − sensible heat ± heat carried by currents.
Latitudinal imbalance: oceans gain surplus heat between about 40° N and 40° S and lose heat poleward of these latitudes; currents such as the Gulf Stream and Kuroshio carry the surplus poleward, sharing this transport with the atmosphere.
Global warming link: the IPCC Sixth Assessment Report (2021) found that ocean warming accounts for about 91% of the heat added to the climate system; this heat expands the water and raises sea level.
Indian relevance: a warmer Arabian Sea in recent decades has been linked by several studies to more intense cyclones there, a point still under study.
6. Salt budget and density
Global salt budget: salt enters through rivers and sea-floor hydrothermal vents and leaves through sediments and evaporite deposits; the ocean's average salinity has stayed broadly steady over long geological periods (a steady-state view).
Regional salt budget: depends on evaporation minus precipitation (E − P) and inflow from rivers and neighbouring seas.
Mediterranean example: evaporation exceeds rain and river inflow; fresher Atlantic water enters at the surface through the Strait of Gibraltar and denser, saltier Mediterranean water flows out at depth, spreading as a salty tongue in the North Atlantic.
Red Sea example: a similar two-layer exchange through the Bab-el-Mandeb strait with the Gulf of Aden.
Black Sea and Baltic: the opposite case; surplus fresh water flows out at the surface and saline water enters below.
Density: rises as temperature falls and salinity rises; cold, salty water sinks in the North Atlantic (Greenland and Labrador seas) and around Antarctica (Weddell Sea), driving the thermohaline circulation.
T-S diagram: a plot of temperature against salinity used to identify water masses, introduced by Bjorn Helland-Hansen (1916).
7. Maps and diagrams to draw
Vertical temperature profile: draw temperature on the horizontal axis and depth downward on the vertical axis; draw a tropical curve with a warm mixed layer, a sharp bend (thermocline) and a cold deep section, and a nearly vertical polar curve.
Latitudinal salinity graph: plot latitude from 60° S to 60° N on the horizontal axis and salinity on the vertical axis; show a dip at the equator, two peaks near 25° N and 25° S, and low values poleward; add an evaporation minus precipitation curve following the same shape.
World isohaline sketch: mark the 36 isohaline around the subtropical gyres, the Red Sea (40), the Baltic (under 10) and the fresher Bay of Bengal compared to the Arabian Sea.
Mediterranean exchange cross-section: draw the Strait of Gibraltar with an upper arrow eastward (Atlantic water) and a lower arrow westward (saline Mediterranean water).
8. Using it in the exam
10-mark answer: define salinity, give the latitudinal pattern with a graph and two controls, and the Arabian Sea versus Bay of Bengal contrast.
15-mark answer: explain the heat budget of the oceans with its terms, the latitudinal surplus and deficit, and the role of currents.
20-mark answer: discuss temperature and salinity distribution, their controls, the salt budget of an enclosed sea, and their significance for circulation, monsoon and fisheries.
Keywords: thermocline, halocline, E − P balance, constant proportions, thermohaline circulation, ocean heat content.
Fact to quote: according to IPCC AR6 (2021), the ocean has taken up about 91% of the extra heat in the climate system.
| Water body | Salinity (‰) | Main reason |
|---|---|---|
| World ocean average | About 35 | Balance of evaporation, rain and rivers |
| Subtropical open ocean (20°–30°) | About 36–37 | High evaporation under subtropical highs |
| Red Sea (north) | About 40 and above | Very high evaporation, no rivers, limited exchange |
| Arabian Sea | About 36 | Dry winds, high evaporation |
| Bay of Bengal | Often 30–34 | Large river inflow and heavy rain |
| Baltic Sea (Gulf of Bothnia) | Under 10, a few units in the north | Many rivers, low evaporation, narrow outlet |
| Term | Gain or loss | Remarks |
|---|---|---|
| Short-wave solar radiation | Gain | Main input; highest in the tropics |
| Long-wave back radiation | Loss | Reduced by cloud and humidity |
| Latent heat of evaporation | Loss | Largest loss; highest under dry trade winds |
| Sensible heat | Loss (usually) | Large where cold air blows over warm currents |
| Advection by currents | Gain or loss | Moves tropical surplus poleward |
Mains points
- Explain why salinity peaks in the subtropics rather than at the equator; this is the most frequently tested idea.
- Use the Arabian Sea versus Bay of Bengal contrast in both temperature and salinity, and link it to monsoon and cyclones.
- For the heat budget, list each term and show the latitudinal surplus and deficit with the role of currents.
- For the salt budget, use the Mediterranean and Red Sea exchange flows, and contrast them with the Black Sea and Baltic.
- A common mistake is ignoring vertical distribution; add a temperature-depth profile with the thermocline.
- Connect temperature and salinity to density, thermohaline circulation and climate change (ocean heat content, sea-level rise).
- Give values as approximate and avoid precise figures you cannot confirm.
Did you know?
- If all the salt in the oceans were spread over the land, it would form a layer over 150 m thick, a figure often quoted by oceanographers to show the scale of dissolved salt.
Waves, Currents and Tides
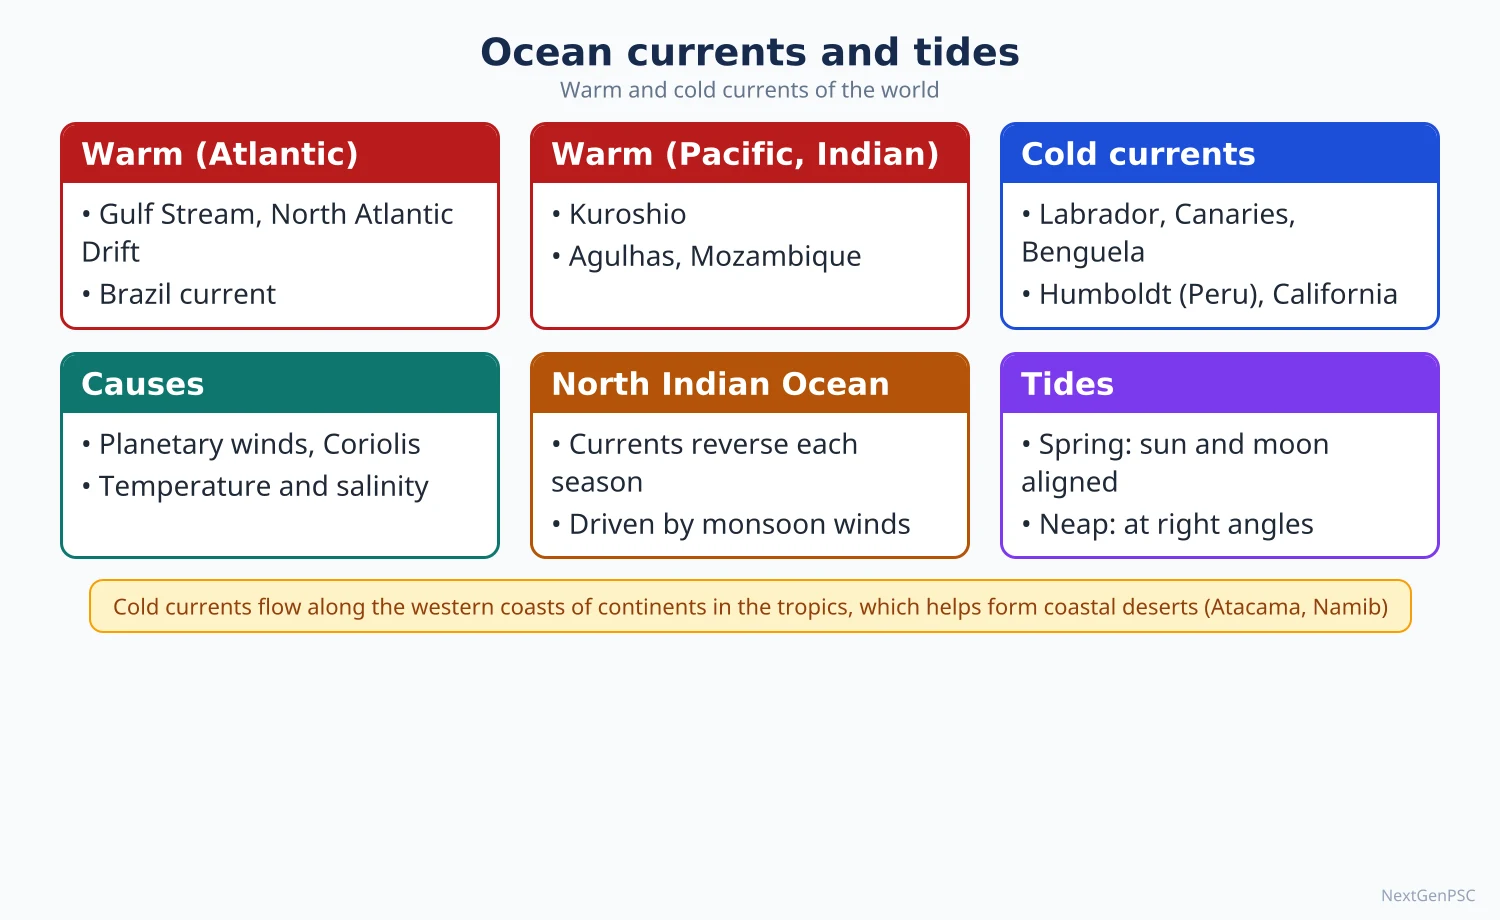
Waves are oscillations of the water surface, mostly produced by wind; their size depends on wind speed, duration and fetch. Ocean currents are large-scale movements of water driven by planetary winds, the Coriolis force and density differences, organised into gyres, with the north Indian Ocean currents reversing with the monsoon. Tides are the periodic rise and fall of sea level caused by the gravitational pull of the moon and sun, giving spring and neap tides.
In simple words
The sea moves in three main ways: waves ripple the surface, currents flow like rivers inside the ocean, and tides lift and lower the whole sea level twice a day in most places.
Blow across a cup of tea and you make waves; stir it in a circle and you make a current; tilt the cup and you see a tide-like slosh.
These movements shape coasts, carry heat, decide fishing grounds and help or hinder ships.
UPSC asks causes, patterns, the monsoon reversal of Indian Ocean currents and tidal theories.
1. Waves: concepts and mechanism
Parts of a wave: crest (top), trough (bottom), wave height (crest to trough), wavelength (crest to crest) and period (time between two crests).
Generation: friction of wind on the water surface transfers energy; wave size grows with wind speed, wind duration and fetch (the open distance over which wind blows).
Orbital motion: water particles move in near-circular orbits and return almost to the same place; the energy, not the water, travels forward.
Wave base: orbital motion dies out at a depth of about half the wavelength; below this the water is undisturbed.
Breaking: as a wave enters shallow water it slows, its wavelength shortens and height increases until it becomes unstable and breaks, roughly when depth falls to about 1.3 times the wave height; breakers are spilling, plunging or surging.
Swell: long, regular waves that have travelled far from the storm that produced them; the Kallakkadal (swell surge) floods on the Kerala coast are caused by swells from distant Southern Ocean storms, and INCOIS issues forecasts for them.
Wave refraction: waves bend as they approach an irregular coast, concentrating energy on headlands and spreading it in bays; hence headlands erode and bays fill with beaches.
Constructive and destructive waves: low, long waves with a strong swash build beaches; high, steep waves with a strong backwash remove material.
Other waves: tsunamis (generated by sea-floor earthquakes, landslides or volcanic eruptions, with very long wavelengths) and storm surges (sea-level rise pushed by cyclone winds and low pressure, as in Odisha 1999).
2. Ocean currents: causes
Planetary winds: the trade winds drive the equatorial currents westward and the westerlies drive the drift currents eastward; this is the main cause of surface currents.
Coriolis force: deflects moving water to the right in the northern hemisphere and to the left in the southern hemisphere, giving clockwise gyres in the north and anticlockwise gyres in the south.
Ekman transport: V.W. Ekman (1905) showed that, because of the Coriolis force, the net movement of the wind-driven layer is about 90° to the right of the wind in the northern hemisphere; this explains coastal upwelling.
Density differences: differences in temperature and salinity drive the slow deep thermohaline circulation.
Gravity and slope of the sea surface: water piled up by winds flows back under gravity, balanced by the Coriolis force (geostrophic flow).
Shape of coasts and sea floor: continents divert currents (the South Equatorial Current splits at Cape São Roque in Brazil).
Western intensification: currents on the western sides of ocean basins (Gulf Stream, Kuroshio) are narrow, fast and deep, explained by Henry Stommel (1948) as an effect of the change of the Coriolis force with latitude.
3. Currents of the Atlantic and Pacific
North Atlantic gyre (clockwise): North Equatorial Current → Caribbean and Florida currents → Gulf Stream → North Atlantic Drift → Canary Current (cold) → back to the equatorial current.
South Atlantic gyre (anticlockwise): South Equatorial Current → Brazil Current (warm) → South Atlantic Drift → Benguela Current (cold) off south-west Africa.
Other Atlantic currents: the cold Labrador Current, the cold Falkland Current and the Equatorial Counter Current flowing east between the two equatorial currents.
North Pacific gyre: North Equatorial Current → Kuroshio (warm) → North Pacific Drift → California Current (cold); the cold Oyashio flows south past the Kuril Islands, and the Alaska Current is warm.
South Pacific gyre: South Equatorial Current → East Australian Current (warm) → West Wind Drift → Humboldt or Peru Current (cold).
Antarctic Circumpolar Current (West Wind Drift): the largest current by volume, flowing eastward around Antarctica without a land barrier.
4. Currents of the Indian Ocean
Southern Indian Ocean (permanent, anticlockwise): South Equatorial Current → Mozambique and Agulhas currents (warm) along east Africa → West Wind Drift → West Australian Current (cold).
Northern Indian Ocean (reverses with monsoon): in winter the north-east monsoon drives the North-East Monsoon Current westward, giving an anticlockwise circulation, and an Equatorial Counter Current flows eastward south of the equator.
Summer reversal: the south-west monsoon drives the South-West Monsoon Current eastward, giving a clockwise circulation, and the North Equatorial Current disappears.
Somali Current: reverses direction; in summer it becomes one of the fastest currents in the world, flowing north along Somalia with strong upwelling (the Great Whirl eddy).
Indian coastal currents: the East India Coastal Current and the West India Coastal Current also reverse seasonally.
Why it matters: the reversal is a direct result of the land-sea pressure contrast that also drives the Indian monsoon; it shows that the north Indian Ocean is a monsoon ocean.
5. Effects of ocean currents
Climate: the North Atlantic Drift keeps north-west Europe mild and Norwegian ports ice-free in winter; cold currents reduce rainfall and help form coastal deserts (Atacama, Namib, Baja California).
Fog and fishing: where warm and cold currents meet (Gulf Stream and Labrador near Newfoundland; Kuroshio and Oyashio near Japan), fog forms and plankton thrive, creating rich fishing grounds such as the Grand Banks.
Upwelling: cold, nutrient-rich water rising off Peru, California, Canary, Benguela and Somalia supports major fisheries.
Climate variability: weakening of the Peru Current and warming of the eastern Pacific during El Niño disturb weather worldwide, including the Indian monsoon; the Indian Ocean Dipole is a related pattern of SST difference across the Indian Ocean.
Thermohaline conveyor: Wallace Broecker popularised the idea of a global ocean conveyor belt (1980s) linking sinking in the North Atlantic to upwelling elsewhere; IPCC AR6 judges that the Atlantic Meridional Overturning Circulation is very likely to weaken this century.
6. Tides: concepts and types
Tide-producing force: the difference in the moon's (and sun's) pull across the earth; the sun's tidal effect is a little under half of the moon's, because tidal force depends on distance cubed.
Two bulges: one on the side facing the moon (pull greater than on the earth's centre) and one on the opposite side (pull less), so most places have two high and two low tides.
Timing: high tides recur about every 12 hours 25 minutes, because the moon moves along its orbit while the earth rotates.
Spring tides: at new moon and full moon, when sun, moon and earth are in line (syzygy); highest high tides and lowest low tides.
Neap tides: at the first and last quarter, when sun and moon are at right angles; smallest tidal range.
Types by frequency: semi-diurnal (two nearly equal highs a day; most Indian coasts), diurnal (one high a day; parts of the Gulf of Mexico) and mixed (two unequal highs; Pacific coast of North America).
Perigean and apogean tides: larger when the moon is nearest the earth (perigee) and smaller at apogee.
Tidal range and bores: funnel-shaped bays amplify tides; the Bay of Fundy in Canada has the largest range in the world (about 16 m), and in India the Gulf of Khambhat and Gulf of Kutch have the highest ranges; tidal bores occur in the Hooghly.
7. Tidal theories
Equilibrium theory: Isaac Newton (1687) explained tides through gravitation, assuming an earth fully covered by deep water; it explains spring and neap tides but not real tidal ranges and timings.
Dynamic theory: Pierre-Simon Laplace (1775 onwards) treated tides as forced oscillations of real ocean basins, accounting for depth and the Coriolis force.
Progressive wave theory: William Whewell (1830s) saw tides as waves travelling from the Southern Ocean into other oceans.
Stationary wave theory: R.A. Harris (early 1900s) proposed that each basin oscillates like water in a tub around nodal points; modern work describes amphidromic points, where the tidal range is nearly zero and the tide rotates around them.
Uses of tides: tidal ports (Kolkata, Kandla, London), tidal power (La Rance in France, 1966; Sihwa Lake in South Korea, the largest), cleaning of harbours and fishing; India's tidal power potential lies mainly in the Gulf of Khambhat, Gulf of Kutch and the Sundarbans, though no large plant has been built.
8. Maps and diagrams to draw
World currents map: draw the five gyres with arrows (clockwise north, anticlockwise south), colour warm currents red or with solid arrows and cold currents blue or with dashed arrows, and label the Gulf Stream, Kuroshio, Canary, California, Benguela, Humboldt, West Wind Drift and Agulhas.
Indian Ocean two-season sketch: draw two small maps side by side; in January show the North-East Monsoon Current flowing west and the counter current east; in July show the South-West Monsoon Current flowing east and the Somali Current flowing north.
Spring and neap tide diagram: draw the sun on the left, the earth in the centre and the moon in line for spring tide (new and full moon) with large bulges; in a second sketch put the moon at right angles for neap tide with smaller bulges.
Wave diagram: draw a wave profile with crest, trough, height and wavelength, and small circles under it shrinking with depth to the wave base.
9. Using it in the exam
10-mark answer: define spring and neap tides with a diagram, or explain upwelling with the Ekman mechanism.
15-mark answer: explain the circulation of the Indian Ocean with two seasonal sketches and link the reversal to the monsoon.
20-mark answer: discuss the causes and effects of ocean currents with a world map, covering climate, fishing, fog, deserts and El Niño.
Keywords: fetch, wave base, refraction, Coriolis force, Ekman transport, gyre, western intensification, syzygy, amphidromic point.
Attribution to remember: Newton for the equilibrium theory of tides, Laplace for the dynamic theory, Ekman for wind-driven transport and Stommel for western intensification.
| Ocean | Warm currents | Cold currents |
|---|---|---|
| North Atlantic | Gulf Stream, North Atlantic Drift, Florida | Labrador, Canary, East Greenland |
| South Atlantic | Brazil | Benguela, Falkland |
| North Pacific | Kuroshio, North Pacific Drift, Alaska | Oyashio, California |
| South Pacific | East Australian | Humboldt (Peru) |
| Indian | Agulhas, Mozambique, monsoon currents | West Australian |
| Southern | None | Antarctic Circumpolar (West Wind Drift) |
| Basis | Spring tide | Neap tide |
|---|---|---|
| Moon phase | New moon and full moon | First and last quarter |
| Position | Sun, moon and earth in a line (syzygy) | Sun and moon at right angles |
| Tidal range | Maximum | Minimum |
| Frequency | Twice a month | Twice a month |
Mains points
- The seasonal reversal of north Indian Ocean currents is a favourite question; draw two seasonal sketches and link them to the monsoon.
- Explain currents through a combination of causes (winds, Coriolis force, density, coast shape), not winds alone.
- Use Ekman transport to explain upwelling and connect it to fisheries off Peru, Somalia and the Kerala coast.
- For tides, give the equilibrium and dynamic theories with their limitations, and Indian examples (Gulf of Khambhat, Hooghly bore).
- A common mistake is mixing up warm and cold currents; western boundary currents are warm, eastern boundary currents are cold.
- Bring in climate variability (El Niño, Indian Ocean Dipole) and the possible weakening of the Atlantic overturning circulation as current angles.
- Always include a world currents map; it is expected and quick to draw.
Did you know?
- Memory trick: 'West is warm, East is cold' for the boundary currents of subtropical gyres (Gulf Stream and Kuroshio warm on the west; Canary and California cold on the east).
Marine Resources, Coral Reefs and Sea-level Change
The oceans provide biotic (fish, plankton, seaweed), mineral (polymetallic nodules, sulphides, crusts, placers, oil and gas) and energy (tidal, wave, OTEC, offshore wind) resources. Coral reefs, built by polyps living with algae called zooxanthellae, form fringing, barrier and atoll reefs, explained by Darwin's subsidence, Daly's glacial control and Murray's theories, and are threatened by coral bleaching. Sea-level change is eustatic (change in ocean water volume) or isostatic (vertical movement of land).
In simple words
The sea is a storehouse of food, minerals and energy, and coral reefs are its richest living gardens.
A coral reef is like a city built by tiny animals that live with plant partners inside them; when the water gets too hot the partners leave, the coral turns white (bleaching) and may starve.
Sea level also rises and falls over time, which shapes coasts and threatens islands and cities.
UPSC asks about resources, reef theories, bleaching and sea-level change with Indian examples.
1. Biotic resources
Plankton, nekton and benthos: plankton drift (phytoplankton are the base of the marine food chain), nekton swim (fish, whales) and benthos live on the sea floor (crabs, molluscs, corals).
Where fish are abundant: on continental shelves (shallow, sunlit, nutrient-rich), in upwelling zones, and where warm and cold currents meet.
Major fishing grounds: north-west Pacific (Japan, China), north-east Atlantic (North Sea, Dogger Bank), north-west Atlantic (Grand Banks), south-east Pacific (Peru anchoveta) and the west-central Pacific (tuna).
World data: FAO's State of World Fisheries and Aquaculture 2024 reported total fisheries and aquaculture production of about 223 million tonnes in 2022, and for the first time aquaculture produced more aquatic animals than capture fisheries.
India: one of the largest fish producers in the world, described by the Department of Fisheries as the third largest fish-producing country and the second largest in aquaculture; the Department of Fisheries reported total fish production of about 175 lakh tonnes in 2022–23, with inland fisheries now larger than marine.
Indian marine fishing zones: the west coast (Kerala, Karnataka, Maharashtra, Gujarat) is more productive than the east coast because of a wider shelf and monsoon upwelling (oil sardine and mackerel off Kerala).
Other biotic resources: seaweed (Gulf of Mannar and Gujarat coast), pearls and shells, mangroves (Sundarbans, Bhitarkanika), and marine organisms used in medicines.
Problems: overfishing, bottom trawling, illegal, unreported and unregulated (IUU) fishing, bycatch and conflicts with Sri Lankan fishermen in the Palk Bay.
2. Mineral resources
Offshore oil and gas: continental shelves hold major fields; in India, Mumbai High (discovered 1974) and the Krishna-Godavari basin offshore; worldwide, the Persian Gulf, North Sea and Gulf of Mexico.
Placer deposits: heavy mineral sands rich in ilmenite, rutile, zircon, garnet and monazite on the Kerala coast (Chavara) and Tamil Nadu (Manavalakurichi) and the Odisha coast.
Polymetallic (manganese) nodules: potato-sized lumps of manganese, nickel, copper and cobalt on abyssal plains; largest known fields in the Clarion-Clipperton Zone of the Pacific and the Central Indian Ocean Basin.
India's deep-sea claims: India was registered as the first pioneer investor in 1987 for a site in the Central Indian Ocean Basin and holds an exploration contract with the International Seabed Authority (about 75,000 km² retained); it also holds a contract (2016) for polymetallic sulphides along the Indian Ocean ridge.
Polymetallic sulphides: deposits of copper, zinc, gold and silver formed at hydrothermal vents ('black smokers') on mid-ocean ridges.
Cobalt-rich ferromanganese crusts: coatings on seamount flanks, rich in cobalt and rare metals.
Gas hydrates: ice-like methane compounds in slope sediments; India's National Gas Hydrate Programme has found them in the Krishna-Godavari basin, but commercial extraction has not begun.
Other resources: salt (Gujarat produces most of India's salt), magnesium and bromine from sea water, phosphorite on shelves, sand and gravel, and fresh water through desalination (Chennai plants at Minjur and Nemmeli).
Deep Ocean Mission: approved by the Union government in 2021 under the Ministry of Earth Sciences; its Samudrayaan component is developing the crewed submersible Matsya-6000 to reach 6,000 m.
3. Energy resources
Tidal energy: needs a large tidal range; India's potential is in the Gulf of Khambhat, Gulf of Kutch and the Sundarbans, but no large plant exists because of cost and ecological concerns.
Wave energy: experimental in India (a pilot plant was built at Vizhinjam, Kerala, by IIT Madras in the 1990s).
Ocean thermal energy conversion (OTEC): uses a temperature difference of about 20°C between warm surface water and cold deep water; suited to tropical islands; India's National Institute of Ocean Technology runs low-temperature thermal desalination plants in Lakshadweep (Kavaratti, Agatti, Minicoy) using the same principle.
Offshore wind: India has identified potential off Gujarat and Tamil Nadu and has set a target of 30 GW of offshore wind by 2030.
4. Coral reefs
What a coral is: a colony of tiny polyps that secrete calcium carbonate skeletons; they live in symbiosis with zooxanthellae algae that photosynthesise and give the coral food and colour.
Conditions for growth: warm water (roughly 20°C minimum, best about 23–29°C), clear, sunlit, shallow water (mostly within the top 50–60 m), normal salinity (roughly 27–40‰), firm base, and freedom from mud and fresh water; hence reefs are absent near large river mouths (Amazon, Ganga).
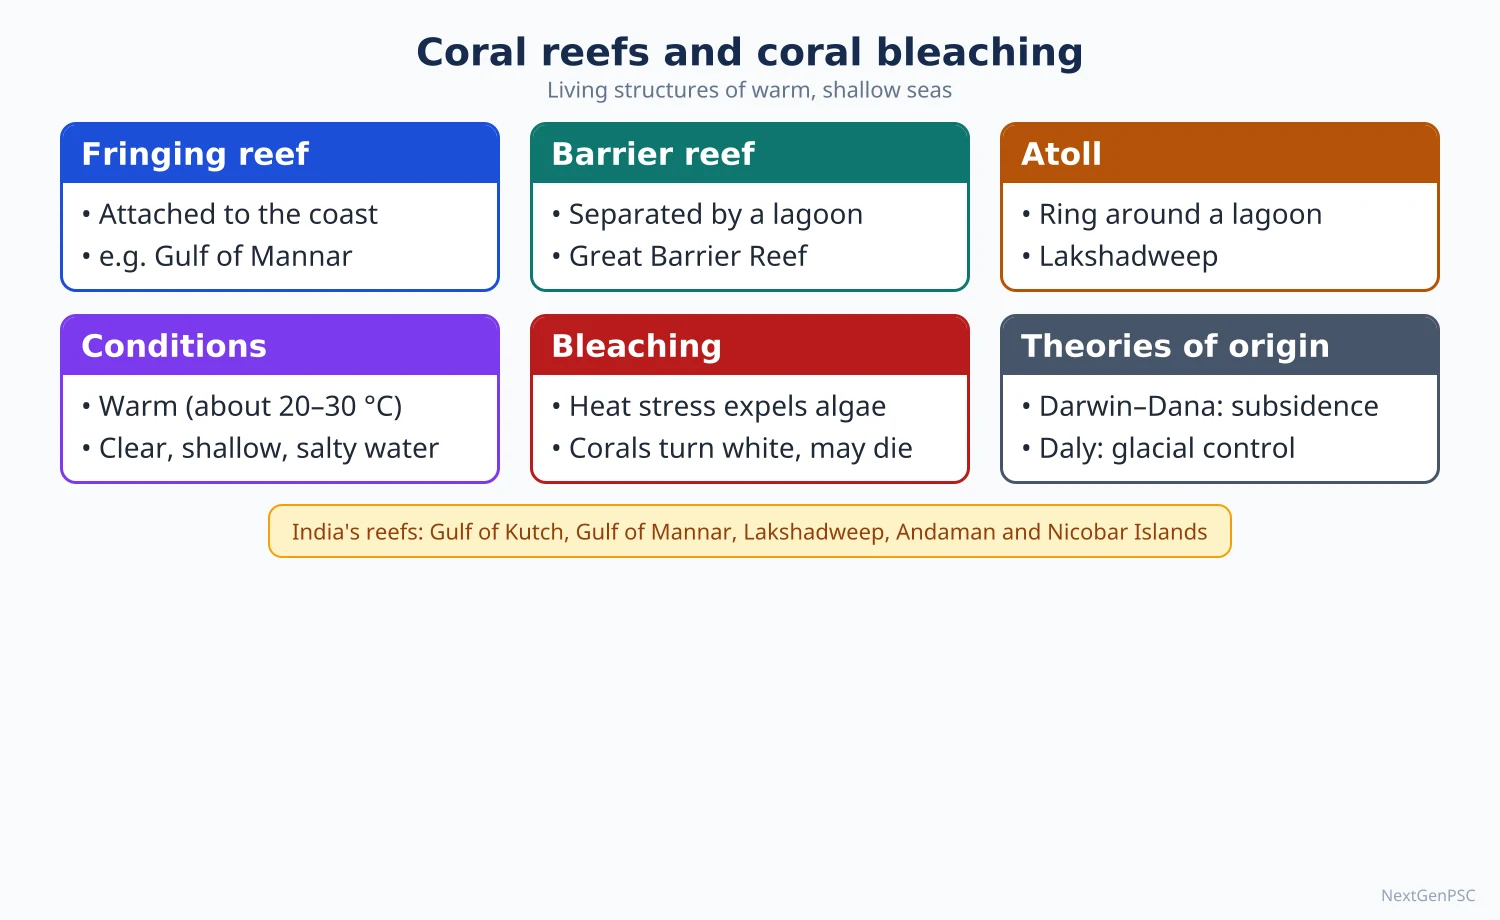
Fringing reef: grows close to the shore with a narrow lagoon or none (Gulf of Mannar, Andaman islands, Red Sea).
Barrier reef: separated from the coast by a wide, deep lagoon; the Great Barrier Reef off Queensland, Australia, about 2,300 km long, is the largest reef system in the world.
Atoll: a ring-shaped reef enclosing a lagoon with no central island; Lakshadweep and the Maldives are atolls.
India's reefs: four major areas: Gulf of Kutch, Gulf of Mannar and Palk Bay, Andaman and Nicobar Islands, and Lakshadweep; patchy reefs also occur off Malvan (Maharashtra) and Netrani (Karnataka).
Value: reefs support about a quarter of marine species despite covering a tiny fraction of the sea floor, protect coasts from waves and storm surges, and support fisheries and tourism.
5. Theories of coral reef origin
Subsidence theory: Charles Darwin (The Structure and Distribution of Coral Reefs, 1842), supported later by Dana, proposed that a fringing reef forms around a volcanic island; as the island slowly subsides the reef grows upward, becoming a barrier reef and finally an atoll when the island disappears.
Evidence for Darwin: drilling on Enewetak Atoll (1951–52) passed through over 1,200 m of reef limestone before reaching volcanic basalt, showing long subsidence; W.M. Davis also supported subsidence (The Coral Reef Problem, 1928).
Glacial control theory: R.A. Daly (1910s) argued that during glacial periods sea level fell, waves planed off islands into flat platforms, and when sea level rose after glaciation corals grew upward on these platforms; it explains the uniform depth of many lagoons.
Still-stand theory: John Murray (1880) proposed that reefs grow on stable submarine platforms built up by sediment, without subsidence, and that lagoons form by solution of the inner reef.
Present view: Darwin's subsidence model is broadly accepted for atolls on volcanic bases, while Daly's sea-level changes explain the modern reef surface and lagoon depths; most writers see the two as complementary, though the relative weight is debated.
6. Coral bleaching
Meaning: loss of zooxanthellae from coral tissue under stress, leaving the white skeleton visible; if stress lasts, the coral starves and dies.
Causes: mainly marine heat waves (temperatures about 1°C above the usual summer maximum for several weeks), plus ocean acidification, pollution, sediment, low tides and disease.
Measurement: NOAA's Coral Reef Watch uses Degree Heating Weeks, accumulated heat stress over 12 weeks, to forecast bleaching.
Global events: NOAA has recorded global bleaching events in 1998, 2010 and 2014–17, and confirmed a fourth global event beginning in 2023 (announced in April 2024), the most extensive on record.
Great Barrier Reef: mass bleaching occurred repeatedly (2016, 2017, 2020, 2022 and 2024).
India: bleaching has been recorded in the Gulf of Mannar, Andamans and Lakshadweep during strong warm years such as 1998, 2010 and 2016, and again in 2024.
Ocean acidification: the ocean absorbs about a quarter of human CO₂ emissions; surface pH has fallen by about 0.1 since pre-industrial times, weakening coral skeletons.
Responses: marine protected areas (Gulf of Mannar Marine National Park, Mahatma Gandhi Marine National Park in the Andamans), coral transplantation (the Zoological Survey of India's work in the Gulf of Kutch and Gulf of Mannar), reducing land-based pollution, and above all limiting global warming.
7. Sea-level change
Eustatic change: a worldwide change in sea level due to change in the volume of ocean water (glacio-eustatic: ice sheets growing or melting; steric: thermal expansion) or in the capacity of ocean basins (tectono-eustatic: changes in ridge volume).
Isostatic change: local rise or fall of land relative to the sea; land depressed by ice sheets rebounds after they melt (glacio-isostatic rebound in Scandinavia and around Hudson Bay, still continuing).
Relative sea level: the net result of both at a place; deltas such as the Ganga-Brahmaputra also sink as sediments compact, raising relative sea level.
Past changes: at the last glacial maximum, about 20,000 years ago, sea level was about 120 m lower; the post-glacial (Flandrian or Holocene) transgression drowned river valleys into rias and estuaries.
Evidence: raised beaches and marine terraces (emergence), drowned valleys, submerged forests and fjords (submergence); along India's coasts, submerged forests and archaeological remains off Dwarka and Poompuhar have been reported, though their interpretation is debated.
Present rise: IPCC AR6 (2021) found that global mean sea level rose by about 0.20 m between 1901 and 2018, with the rate increasing to about 3.7 mm per year in 2006–2018, and projects a further rise of roughly 0.28–0.55 m (very low emissions) to 0.63–1.01 m (very high emissions) by 2100 relative to 1995–2014.
India: the Ministry of Earth Sciences report Assessment of Climate Change over the Indian Region (2020) found that sea level in the north Indian Ocean rose by about 1.06–1.75 mm per year during 1874–2004 and about 3.3 mm per year during 1993–2017.
Impacts: coastal erosion, flooding and salinisation of groundwater and farmland (Sundarbans islands such as Ghoramara, Kerala's Kuttanad), threats to low-lying nations (Maldives, Tuvalu, Kiribati) and coastal megacities (Mumbai, Kolkata, Chennai).
8. Maps and diagrams to draw
Darwin's subsidence sequence: draw three sketches side by side: a volcanic island with a fringing reef at sea level; the same island partly sunk with the reef now a barrier separated by a lagoon; and a ring-shaped atoll with no island, with arrows showing subsidence and upward reef growth.
Daly's glacial control sketch: draw a wave-cut platform at a lowered sea level, then a raised sea level with corals growing up from the edges of the platform enclosing a lagoon of uniform depth.
India coral reef map: mark the Gulf of Kutch, Gulf of Mannar and Palk Bay, Andaman and Nicobar Islands and Lakshadweep, and shade the west coast fishing belt from Gujarat to Kerala.
Sea-level curve: draw time on the horizontal axis (20,000 years ago to now) and sea level on the vertical axis, starting at about −120 m and rising steeply until about 7,000 years ago, then levelling off, with a small modern upturn.
9. Using it in the exam
10-mark answer: explain coral bleaching with causes, Indian and world examples and responses; or define eustatic and isostatic change with examples.
15-mark answer: compare Darwin's and Daly's theories with diagrams and evidence, ending with the modern synthesis.
20-mark answer: assess marine resources (biotic, mineral, energy) with India's position, the Deep Ocean Mission, and sustainability issues (overfishing, deep-sea mining impacts).
Keywords: zooxanthellae, Degree Heating Weeks, subsidence, glacial control, polymetallic nodules, blue economy, eustasy, glacio-isostatic rebound.
Attribution to remember: Darwin's subsidence theory (1842) and Daly's glacial control theory are the two classical explanations of reefs.
| Basis | Darwin (subsidence) | Daly (glacial control) | Murray (still-stand) |
|---|---|---|---|
| Key process | Slow sinking of the island base | Fall and rise of sea level in the Ice Age | Reef growth on stable built-up platforms |
| Land movement | Island subsides | Land stable, sea level changes | No subsidence |
| Lagoon formed by | Sinking island inside reef ring | Corals growing on edges of wave-cut platforms | Solution of the inner reef |
| Strength | Confirmed by Enewetak drilling (1951–52) | Explains uniform lagoon depths | Fits stable shelf areas |
| Weakness | Does not explain flat lagoon floors well | Cannot explain reef limestone over 1,000 m thick | Ignores evidence of subsidence |
| Resource | Setting | Indian example or status |
|---|---|---|
| Oil and natural gas | Continental shelf basins | Mumbai High; Krishna-Godavari offshore |
| Heavy mineral placers | Beaches and near-shore | Chavara (Kerala), Manavalakurichi (Tamil Nadu) |
| Polymetallic nodules | Abyssal plains | ISA exploration contract in the Central Indian Ocean Basin |
| Polymetallic sulphides | Mid-ocean ridges | ISA exploration contract (2016) on the Indian Ocean ridge |
| Gas hydrates | Continental slope sediments | Found in Krishna-Godavari basin; not yet commercial |
Mains points
- Coral reef origin (Darwin vs Daly) is a classic question; draw the stage diagrams and end with the modern view that the theories are complementary.
- Coral bleaching questions expect causes, global events with years, Indian reefs affected and responses; link to marine heat waves and acidification.
- For marine resources, organise under biotic, mineral and energy, and give India's position (fisheries, Mumbai High, ISA contracts, Deep Ocean Mission, offshore wind target).
- Distinguish eustatic and isostatic change clearly with examples (Scandinavian rebound vs glacial melt), and use IPCC AR6 figures for current rise.
- A common mistake is calling Lakshadweep a fringing reef; it is a group of atolls.
- Add the sustainability angle: overfishing, deep-sea mining risks to unknown ecosystems, and the blue economy.
- Use an India map of coral reef areas and marine resources in Paper II-style answers.
Did you know?
- Darwin worked out his subsidence theory of atolls during the voyage of HMS Beagle, before he had seen a coral reef, and later tested it on the Cocos (Keeling) Islands; drilling at Enewetak more than a century later found the volcanic base he predicted.
Law of the Sea and Marine Pollution
The United Nations Convention on the Law of the Sea (UNCLOS), adopted in 1982 and in force since 1994, divides the sea into territorial sea (12 nautical miles), contiguous zone (24 nm), exclusive economic zone (200 nm), continental shelf and high seas, and treats the deep seabed beyond national jurisdiction as the common heritage of mankind under the International Seabed Authority. Marine pollution comes mostly from land-based sources, with oil spills, plastics, nutrients and heavy metals as major threats, controlled by conventions such as MARPOL.
In simple words
The law of the sea is the rulebook that decides how far into the sea a country's control reaches and what it may do there.
Think of a house with a front yard (territorial sea), a fenced garden for your own use (the economic zone) and a public park beyond, open to all.
The same oceans are being polluted by oil, plastic and sewage, mostly from land.
UPSC asks the maritime zones, India's interests, the deep seabed and the causes and control of marine pollution.
1. Evolution of the law of the sea
Freedom of the seas: Hugo Grotius argued in Mare Liberum (1609) that the seas are free to all; John Selden replied with Mare Clausum (published 1635) defending national control.
Cannon-shot rule: coastal control was long limited to about 3 nautical miles, roughly the range of shore cannon.
Truman Proclamation (1945): the United States claimed the resources of its continental shelf, starting a wave of national claims.
UNCLOS I (1958, Geneva): produced four conventions (territorial sea, high seas, continental shelf, fishing) but did not fix the width of the territorial sea; UNCLOS II (1960) also failed on this.
UNCLOS III (1973–1982): produced the present Convention, signed at Montego Bay, Jamaica, on 10 December 1982; it entered into force on 16 November 1994 after 60 ratifications. India ratified it in 1995.
1994 Implementation Agreement: modified the deep-seabed mining regime of Part XI to meet the objections of industrialised countries; the United States has still not ratified UNCLOS.
2. Maritime zones under UNCLOS
Baseline: zones are measured from the low-water line along the coast or from straight baselines joining headlands and fringing islands.
Internal waters: waters on the landward side of the baseline (bays, ports, river mouths); full sovereignty, like land.
Territorial sea (up to 12 nm): full sovereignty over water, seabed and airspace, but foreign ships enjoy the right of innocent passage.
Contiguous zone (up to 24 nm): the coastal state can enforce customs, fiscal, immigration and sanitary laws.
Exclusive economic zone (up to 200 nm): sovereign rights over living and non-living resources, energy production, marine research and environmental protection; other states keep freedom of navigation, overflight and laying of cables.
Continental shelf: the natural prolongation of land to the outer edge of the continental margin, at least 200 nm, and up to 350 nm or 100 nm beyond the 2,500 m isobath; claims beyond 200 nm are examined by the Commission on the Limits of the Continental Shelf (CLCS).
High seas: waters beyond the EEZ, open to all for navigation, fishing, research and overflight, reserved for peaceful purposes.
The Area: the seabed and subsoil beyond national jurisdiction, declared the common heritage of mankind (Part XI) and managed by the International Seabed Authority (ISA), headquartered in Kingston, Jamaica.
Special regimes: transit passage through international straits (Malacca, Hormuz, Bab-el-Mandeb); archipelagic waters for archipelagic states (Indonesia, Philippines); Article 121 says rocks that cannot sustain human habitation or economic life have no EEZ or continental shelf.
Institutions: the International Tribunal for the Law of the Sea (ITLOS) in Hamburg, the ISA and the CLCS; disputes may also go to the International Court of Justice or arbitration.
3. Recent developments
BBNJ Agreement (High Seas Treaty): an agreement under UNCLOS on marine biodiversity of areas beyond national jurisdiction, adopted in June 2023; it provides for high-seas marine protected areas, environmental impact assessments, sharing of benefits from marine genetic resources, and capacity building; it reached the required 60 ratifications in September 2025 and entered into force in January 2026. India signed it in September 2024.
Deep-sea mining debate: the ISA has issued exploration contracts but has not yet adopted a final exploitation (mining) code; several countries and scientists call for a moratorium because deep-sea ecosystems are poorly known, while others press for mining of battery metals; the question remains contested.
South China Sea arbitration (2016): a tribunal in the Philippines v. China case found that China's 'nine-dash line' claims had no legal basis under UNCLOS; China rejected the award.
Chagos Archipelago: the International Court of Justice advisory opinion (2019) held that the United Kingdom's continued administration was unlawful and that decolonisation of Mauritius was incomplete; India has supported Mauritius's position.
4. India and the law of the sea
Domestic law: the Territorial Waters, Continental Shelf, Exclusive Economic Zone and Other Maritime Zones Act, 1976, set out India's zones even before UNCLOS came into force.
EEZ: about 2.02 million km², one of the larger EEZs in the world, enlarged by the Andaman and Nicobar and Lakshadweep islands.
Coastline: traditionally 7,516.6 km; a recalculation using a new methodology published in 2025 gives about 11,098 km, the difference being due to method and scale rather than physical change.
Maritime boundaries: agreements with Sri Lanka (1974 and 1976, including Katchatheevu, which remains a political issue), the Maldives, Indonesia and Thailand; the India-Bangladesh boundary in the Bay of Bengal was settled by an arbitral tribunal under UNCLOS in 2014, which gave Bangladesh the larger part (about 19,467 km² of the 25,602 km² disputed area); the Sir Creek boundary with Pakistan is unresolved.
Extended continental shelf: India has filed submissions with the CLCS for an extended shelf in the Bay of Bengal and Arabian Sea, which are under examination.
Military activities in the EEZ: India's declaration on ratification holds that other states may not carry out military exercises in its EEZ without consent; the United States contested this with a freedom-of-navigation operation near Lakshadweep in April 2021.
Seabed interests: India's ISA contracts for polymetallic nodules (Central Indian Ocean Basin) and polymetallic sulphides (Indian Ocean ridge), and the Deep Ocean Mission (2021).
Fishermen's issues: arrests of Indian fishermen in the Palk Bay and across the maritime boundary with Pakistan raise humanitarian and livelihood questions.
5. Marine pollution: meaning and sources
Definition: UNCLOS (Article 1) defines pollution of the marine environment as the introduction by humans, directly or indirectly, of substances or energy into the sea that results in harmful effects on living resources, human health or uses of the sea.
Land-based sources: often estimated at about 80% of marine pollution: sewage, industrial effluents, farm runoff of fertilisers and pesticides, and plastics carried by rivers.
Oil pollution: tanker accidents and well blowouts (Exxon Valdez, Alaska, 1989; Deepwater Horizon, Gulf of Mexico, 2010; MV Wakashio, Mauritius, 2020), operational discharges and bilge water; in India, the collision of two ships off Ennore near Chennai (2017) and the sinking of the container ship MSC Elsa 3 off the Kerala coast (2025).
Plastics and microplastics: accumulate in ocean gyres such as the Great Pacific Garbage Patch, entangle animals, enter food chains, and wash up on Indian beaches; abandoned fishing gear (ghost nets) keeps killing marine life.
Nutrients and dead zones: fertiliser runoff causes algal blooms and oxygen-poor dead zones (northern Gulf of Mexico, Baltic Sea); the Arabian Sea also has a large natural oxygen minimum zone.
Heavy metals and chemicals: mercury poisoning at Minamata, Japan, in the 1950s is the classic case; persistent organic pollutants build up in food chains (biomagnification).
Other sources: ballast water carrying invasive species, radioactive waste, thermal discharge from power plants, ship noise, ocean dumping and mining tailings; Japan began releasing treated water from the Fukushima nuclear plant in August 2023, which remains controversial with neighbours.
6. Effects of marine pollution
Ecological: death of fish, birds and mammals, coral reef decline, loss of mangroves and seagrass, and harmful algal blooms.
Human health: contaminated seafood (mercury, microplastics), and diseases from sewage-polluted beaches.
Economic: losses to fisheries, tourism and coastal livelihoods; clean-up costs of oil spills.
Climate links: pollution adds stress to ecosystems already hit by warming and acidification.
7. Control measures
International conventions: MARPOL (1973, modified by the 1978 Protocol) on pollution from ships; the London Convention (1972) and its 1996 Protocol on dumping; the OPRC Convention (1990) on oil-spill preparedness; the Ballast Water Management Convention (adopted 2004, in force 2017); the Basel Convention on hazardous waste.
Plastics treaty talks: the UN Environment Assembly resolution 5/14 (2022) started negotiations on a legally binding global treaty on plastic pollution; sessions held in Busan (2024) and Geneva (2025) ended without final agreement.
Global goals: Sustainable Development Goal 14 (Life below Water) and the UN Decade of Ocean Science for Sustainable Development (2021–2030).
India's measures: the Coastal Regulation Zone Notification (2019), the Environment (Protection) Act, 1986, the National Oil Spill Disaster Contingency Plan coordinated by the Indian Coast Guard, the ban on identified single-use plastic items from 1 July 2022, and the Swachh Sagar, Surakshit Sagar coastal clean-up campaign (2022).
Coastal management: integrated coastal zone management plans, sewage treatment in coastal cities, Blue Flag certification of beaches, and protection of mangroves (the MISHTI scheme, 2023, for mangrove plantation).
8. Maps and diagrams to draw
Maritime zones diagram: draw a coastline on the left with a baseline; to the right draw vertical lines marking internal waters, the territorial sea (12 nm), contiguous zone (24 nm) and EEZ (200 nm), then high seas; below the water line draw the continental shelf extending to the edge of the margin and the Area beyond, labelling sovereignty and rights in each zone.
India's maritime map: outline India with its EEZ shaded, including the bulges around the Andaman and Nicobar Islands and Lakshadweep; mark the boundary with Bangladesh in the Bay of Bengal, Katchatheevu and the Palk Strait, Sir Creek, and the Central Indian Ocean Basin nodule area to the south.
Pollution flow chart: sources (sewage, farm runoff, industry, ships, plastics) → pathways (rivers, outfalls, shipping lanes) → impacts (dead zones, bleaching, contaminated seafood) → responses (MARPOL, CRZ, waste treatment).
9. Using it in the exam
10-mark answer: explain the EEZ or the common heritage principle, with a zones diagram and India's figure.
15-mark answer: discuss India's maritime interests under UNCLOS (EEZ, boundaries, deep-sea mining, freedom of navigation) with a map.
20-mark answer: examine the sources, effects and control of marine pollution with world and Indian cases and the gaps in global governance (plastics treaty, deep-sea mining).
Keywords: innocent passage, sovereign rights, common heritage of mankind, CLCS, ISA, BBNJ, MARPOL, land-based pollution, dead zone.
Point to quote: UNCLOS is often called the 'constitution for the oceans', a description associated with Tommy Koh, president of UNCLOS III.
| Zone | Extent from baseline | Rights of coastal state | Rights of other states |
|---|---|---|---|
| Internal waters | Landward of baseline | Full sovereignty | None without permission |
| Territorial sea | Up to 12 nm | Sovereignty over water, seabed, airspace | Innocent passage |
| Contiguous zone | Up to 24 nm | Enforce customs, fiscal, immigration, sanitary laws | Navigation and overflight |
| Exclusive economic zone | Up to 200 nm | Sovereign rights over resources, research, environment | Navigation, overflight, cables and pipelines |
| Continental shelf | 200 nm, extendable up to 350 nm (or 100 nm beyond 2,500 m isobath) | Seabed and subsoil resources | Cables and pipelines; water above follows its own regime |
| High seas and the Area | Beyond national jurisdiction | None exclusive | Freedoms of the high seas; seabed is common heritage under the ISA |
| Instrument | Year | Focus |
|---|---|---|
| London Convention; London Protocol | 1972; 1996 | Dumping of wastes at sea |
| MARPOL | 1973, with 1978 Protocol | Pollution from ships (oil, chemicals, sewage, garbage, air emissions) |
| UNCLOS Part XII | 1982 | General duty to protect and preserve the marine environment |
| OPRC Convention | 1990 | Oil pollution preparedness and response |
| Ballast Water Management Convention | Adopted 2004, in force 2017 | Invasive species in ships' ballast water |
| BBNJ Agreement | Adopted 2023, in force 2026 | Biodiversity beyond national jurisdiction, high-seas protected areas |
Mains points
- Draw the maritime zones diagram in every UNCLOS answer and state the rights in each zone precisely (sovereignty vs sovereign rights).
- Link the law of the sea to India: EEZ size, island territories, boundary settlements (Bangladesh 2014), Katchatheevu, Sir Creek, CLCS submissions and ISA contracts.
- Use recent developments (BBNJ Agreement, deep-sea mining debate, South China Sea award) to show currency, with correct years.
- For marine pollution, classify sources, give named cases with years, and end with a mix of global and Indian controls.
- A common mistake is saying the EEZ gives sovereignty; it gives sovereign rights over resources, while others keep navigation and overflight freedoms.
- Bring in geopolitics where relevant: freedom of navigation, India's position on military exercises in the EEZ, and the Indian Ocean as a strategic space.
- Close with sustainability: SDG 14, the blue economy and the need for ecosystem-based ocean governance.
Did you know?
- Memory trick for the zones: '12–24–200–350' = territorial sea, contiguous zone, EEZ and the maximum extended continental shelf, all in nautical miles (1 nautical mile = 1.852 km).
UPSC Previous Year Questions: Oceanography
From 2014 to 2026 UPSC asked 30 question parts (400 marks) from Oceanography, all in Paper I. The most-asked areas are marine resources, coral reefs and sea-level change (12 parts, 165 marks) and waves, currents and tides (9 parts, 120 marks), followed by ocean bottom relief and deposits (5 parts, 65 marks). Every question below has a model answer written to the UPSC word limit.
In simple words
Read the question and the Approach line, then write your own answer in the time limit: about 7 minutes for 10 marks and 11 minutes for 15 marks.
Draw the map or diagram yourself before you look at the model answer; in oceanography a labelled sketch of currents or ocean floor earns marks quickly.
Compare your answer with the model: check the definition, the named examples, the geographer or report cited and the conclusion, and note what you missed.
1. Ocean Bottom Topography and Ocean Deposits
Example 1 (UPSC 2026, 10 marks): How are seamounts and Guyots the same and different? Comment.
Paper and question: Paper I, Q1(c)
Approach: The question asks for both similarities and differences, so define both features, list what they share, contrast their form and history, and end with a short comment; draw a profile of a seamount and a guyot.
A seamount is an isolated submarine mountain, usually a volcano, rising 1,000 m or more above the deep-sea floor without reaching the surface. A guyot is a flat-topped seamount, named by Harry Hess in 1946 after Arnold Guyot.
Same: both are volcanic, built at mid-ocean ridges or over hotspots; both stand on the abyssal floor below sea level; both occur in chains, most numerously in the Pacific, as in the Hawaiian–Emperor chain.
Different: a seamount has a conical summit, while a guyot has a planed, flat top, often with rounded gravel and fossil shallow-water corals. A guyot once reached sea level, where waves eroded its top; it then sank as the cooling plate moved away from the ridge, so its top now lies about 1,000–2,000 m deep. A seamount never reached the surface.
Diagram: Profile showing a conical seamount below sea level and a flat-topped guyot farther from a ridge, with an arrow marking plate movement and subsidence.
Comment: a guyot is thus an older, drowned stage of a seamount. Its flat top, far below wave base, is strong evidence for sea-floor spreading and thermal subsidence of oceanic lithosphere.
Example 2 (UPSC 2024, 15 marks): With suitable sketches elaborate the bottom topography of the Indian Ocean.
Paper and question: Paper I, Q2(c)
Approach: Describe the relief of the Indian Ocean feature by feature (shelf, ridges, basins, trenches, fans, islands) and explain each through plate tectonics; draw a sketch of the ocean floor with ridges, basins and the Sunda Trench.
The Indian Ocean, the third largest ocean, is closed by land in the north and open to the Southern Ocean. Its floor is young, shaped by the break-up of Gondwana and the northward drift of the Indian plate.
Continental shelf: generally narrow, but wide off Gujarat and Maharashtra, at the head of the Bay of Bengal and on the Sunda Shelf.
Mid-Indian Ocean Ridge: an inverted-Y system: the Central Indian Ridge, continuing north-west as the Carlsberg Ridge, splits at the Rodrigues Triple Junction into the Southwest and Southeast Indian ridges. Aseismic ridges include the Ninety East Ridge, widely read as the Kerguelen hotspot track, and the Chagos–Lakshadweep Ridge.
Basins: Arabian, Somali, Mascarene and Madagascar basins in the west; Central Indian and Wharton basins in the east. The Central Indian Basin holds polymetallic nodules explored by India.
Trenches: few, as subduction is limited; the Sunda (Java) Trench, about 7,000–7,500 m deep, is the deepest part.
Fans and islands: the Bengal Fan, the largest in the world, and the Indus Fan are built of Himalayan sediment. Islands are continental (Madagascar, Sri Lanka), volcanic (Mauritius, Réunion) and coral (Lakshadweep, Maldives).
Diagram: Sketch of the Indian Ocean showing the inverted-Y ridge, Carlsberg, Ninety East and Chagos–Lakshadweep ridges, labelled basins, the Sunda Trench and the Bengal and Indus fans.
The relief records spreading, hotspot tracks and the India–Asia collision, and it sustains nodules, fisheries and oil.
Example 3 (UPSC 2021, 15 marks): Give a detailed account of bottom topography of the Pacific Ocean.
Paper and question: Paper I, Q2(b)
Approach: Give an organised account of the Pacific floor: shelves and marginal seas, trenches and island arcs, the East Pacific Rise, basins, seamounts and guyots, with a tectonic explanation; draw a map of the Pacific showing trenches, the rise and seamount chains.
The Pacific is the largest and deepest ocean, covering about a third of the earth's surface. Its floor is bordered almost everywhere by subduction zones, the Ring of Fire, which controls its relief.
Shelves and marginal seas: the shelf is narrow along the Americas but broad in the west, where marginal seas (Bering, Okhotsk, Japan, East China, South China, Coral) lie behind island arcs.
Trenches and island arcs: it has the most and deepest trenches: the Mariana Trench with the Challenger Deep (nearly 11,000 m), and the Tonga, Kermadec, Kuril–Kamchatka, Japan, Aleutian and Peru–Chile trenches, with arcs such as Japan and the Philippines on their landward side.
East Pacific Rise: the main spreading ridge lies off-centre towards the east; it is broad, low and fast-spreading, with branches such as the Galápagos Rift and the Juan de Fuca Ridge.
Basins: fracture zones (Mendocino, Clarion, Clipperton) divide the floor into large basins. Abyssal plains are smaller than in the Atlantic because trenches trap sediment; red clay and manganese nodules, as in the Clarion–Clipperton Zone, cover much of it.
Seamounts and guyots: the Pacific has the largest number, with hotspot chains like the Hawaiian–Emperor chain and coral atolls on sunken volcanoes (Marshall Islands, Tuamotu).
Map: Outline of the Pacific marking the ring of trenches, the East Pacific Rise, the Hawaiian–Emperor chain, marginal seas and the Clarion–Clipperton Zone.
The Pacific is thus a shrinking ocean, consumed at its edges faster than it grows at its ridge, which explains its trenches, volcanoes and earthquakes.
Example 4 (UPSC 2017, 15 marks): Describe the configuration of the Pacific Ocean floor.
Paper and question: Paper I, Q2(c)
Approach: Describe the configuration (arrangement and shape) of the Pacific floor zone by zone, contrasting the western and eastern sides; draw an east–west profile from Japan to Peru.
The Pacific Ocean is roughly triangular, wide in the south and narrowing to the Bering Strait. Its configuration is asymmetric: an active western margin of arcs and seas and a narrow eastern margin facing young mountains.
Western margin: a festoon of island arcs, from the Aleutians, Kurils and Japan to the Philippines and New Zealand, encloses marginal seas. Seaward of the arcs lie deep trenches: Mariana (Challenger Deep, nearly 11,000 m), Japan, Kuril, Tonga and Kermadec.
Eastern margin: the shelf is very narrow off the Andes and the Rockies; the Peru–Chile and Middle America trenches lie close to the coast, and there are no large marginal seas.
Central zone: the East Pacific Rise, a broad, gentle and fast-spreading ridge, runs off-centre near the east, from the Gulf of California to the south-east Pacific, offset by long fracture zones.
Deep basins: west of the rise lies the vast central floor at 4,000–6,000 m, with abyssal hills more common than flat plains, because sediment is trapped in trenches.
Islands and seamounts: volcanic chains such as Hawaii and the Society Islands, numerous guyots in the western Pacific, and coral atolls of Micronesia and Polynesia rise from this floor.
Diagram: East–west profile from Japan to Peru showing marginal sea, island arc, trench, deep basin with seamounts, the East Pacific Rise and the Peru–Chile Trench beside the Andes.
This configuration reflects a plate system in which old, cold crust sinks in the west and new crust forms in the east.
Example 5 (UPSC 2015, 10 marks): Describe the characteristics of different types of pelagic deposits.
Paper and question: Paper I, Q1(c)
Approach: Define pelagic deposits (after Murray and Renard), then describe each type (calcareous oozes, siliceous oozes, red clay) by composition, depth and distribution; draw a profile showing the carbonate compensation depth.
Pelagic deposits are fine sediments of the deep-sea floor far from land, made of plankton remains and inorganic dust. John Murray and A.F. Renard classified them from the Challenger expedition samples (1872–76). They accumulate very slowly.
Calcareous oozes (over 30 per cent skeletal matter): globigerina ooze, of foraminifera shells, is the most widespread, covering much of the Atlantic; pteropod ooze occurs in shallower tropical waters because aragonite dissolves sooner. Both disappear below the carbonate compensation depth (about 4,000–5,000 m).
Siliceous oozes: diatom ooze forms a belt around Antarctica and in the North Pacific, where cold, nutrient-rich water favours diatoms; radiolarian ooze occurs in the deep tropical Pacific, below the CCD, as silica resists dissolution.
Red clay: the deepest and most extensive deposit, in the central and north Pacific; made of wind-blown dust, volcanic ash and meteoric particles, with sharks' teeth and manganese nodules.
Diagram: Profile from shelf to abyss showing terrigenous mud on the shelf, calcareous ooze on ridges above the CCD, and siliceous ooze and red clay below it.
Pelagic deposits thus record surface productivity, depth and past climates, and host valuable nodules.
2. Temperature, Salinity, Heat and Salt Budgets
Example 6 (UPSC 2021, 10 marks): Discuss the hazards associated with rise of sea-surface temperature.
Paper and question: Paper I, Q1(c)
Approach: Explain briefly why sea-surface temperature is rising, then discuss its hazards one by one with Indian and world examples; draw a flow diagram linking SST rise to hazards.
The oceans have absorbed over 90 per cent of the excess heat trapped by greenhouse gases (IPCC AR6, 2021), so sea-surface temperature (SST) is rising, the Indian Ocean faster than the global average.
Stronger cyclones: warmer water supplies more latent heat, favouring rapid intensification; the Arabian Sea has seen more severe cyclones, such as Ockhi (2017) and Tauktae (2021).
Marine heatwaves and bleaching: long hot spells, like the north-east Pacific 'Blob' (2013–16), cause mass coral bleaching, as on the Great Barrier Reef and in the Gulf of Mannar.
Sea-level rise: thermal expansion raises sea level, worsening flooding and erosion in the Sundarbans and Maldives.
Fisheries: fish shift poleward or deeper; the oil sardine has spread northward along India's west coast. Warmer water holds less oxygen, enlarging dead zones and algal blooms.
Weather extremes: SST anomalies drive El Niño and the Indian Ocean Dipole, bringing droughts and floods.
Diagram: Flow chart: greenhouse gases → ocean heat uptake → SST rise → cyclones, bleaching, sea-level rise, fish migration, deoxygenation, monsoon extremes.
Emission cuts, early warning, marine protected areas and resilient coastal planning can reduce these risks.
3. Waves, Currents and Tides
Example 7 (UPSC 2026, 15 marks): Discuss the potential consequences of the collapse of the Atlantic Meridional Overturning Circulation (AMOC) for the world.
Paper and question: Paper I, Q2(b)
Approach: Explain what the AMOC is and why it may collapse, then discuss its global consequences region by region (Europe, tropics and monsoons, sea level, carbon and ecosystems), noting scientific uncertainty; draw a sketch of the AMOC conveyor in the Atlantic.
The Atlantic Meridional Overturning Circulation (AMOC) is the Atlantic limb of the thermohaline circulation: warm, salty surface water (Gulf Stream, North Atlantic Drift) flows north, cools and sinks in the Labrador and Nordic seas as North Atlantic Deep Water, and returns south at depth. Melting Greenland ice and greater rainfall freshen the surface, reducing sinking. IPCC AR6 (2021) judges a decline very likely this century but has medium confidence that an abrupt collapse will not occur before 2100; some recent studies suggest an earlier tipping point, a debated view.
Europe and the North Atlantic: loss of northward heat would sharply cool north-west Europe, with harsher winters, more storms and stress on farming, even as the rest of the world warms.
Tropics and monsoons: the ITCZ would shift south, weakening the West African and Indian monsoons, drying the Sahel and disturbing rainfall over the Amazon; this threatens food security in South Asia.
Sea level: the slackening of the Gulf Stream would raise sea level along the US east coast by redistributing water.
Carbon and ecosystems: less deep-water formation would reduce ocean uptake of carbon dioxide and oxygen, and cut nutrient supply, hurting North Atlantic fisheries and plankton.
Diagram: Atlantic sketch showing the warm surface flow northward, sinking zones near Greenland and the Labrador Sea, and the cold deep return flow southward.
An AMOC collapse would thus be a global tipping point with cascading effects, which makes rapid emission cuts and better ocean monitoring, such as the RAPID array at 26° N, essential.
Example 8 (UPSC 2025, 10 marks): What are the fundamental differences among ocean wave, ocean current and tide?
Paper and question: Paper I, Q1(e)
Approach: Define each phenomenon and then distinguish them on cause, nature of water movement, scale, periodicity and effects, ideally in a compact comparative form; add a simple diagram of the three motions.
Waves, currents and tides are the three main movements of ocean water, but they differ in cause and behaviour.
Cause: waves are generated mainly by wind on the surface (tsunamis by earthquakes); currents by planetary winds, density differences and the Coriolis force; tides by the gravitational pull of the moon and sun.
Nature of movement: a wave transfers energy forward while water particles move in near-circular orbits and return to place; a current is a mass flow of water in a definite direction; a tide is the periodic rise and fall of sea level.
Scale and periodicity: waves have periods of seconds and affect the surface layer; currents are continuous or seasonal and span thousands of kilometres; tides recur about twice a day (semi-diurnal) or once a day (diurnal).
Effects: waves shape coasts; currents redistribute heat and influence climate and fisheries; tides aid navigation and offer tidal energy, as in the Gulf of Khambhat.
Diagram: Three small sketches: orbital motion of particles under a wave, a horizontal arrow for a current, and high and low tide levels on a shore.
Of the three, only currents carry water over long distances.
Example 9 (UPSC 2023, 15 marks): How are ocean currents generated? Discuss their effects on coastal climates with special reference to the Pacific Ocean.
Paper and question: Paper I, Q2(c)
Approach: First explain the generating forces of currents (primary and secondary), then discuss how warm and cold currents shape coastal climates, with Pacific examples on both margins; draw a map of Pacific currents.
Ocean currents are large, steady movements of surface or deep water in a definite direction.
Generation: the primary driver of surface currents is the stress of planetary winds: trade winds push equatorial currents westward and westerlies drive drifts eastward. The Coriolis force deflects them, producing gyres, while differences in temperature and salinity create density currents and the thermohaline circulation. Coastlines and the sea floor divert flows, and western intensification (Stommel, 1948) makes western boundary currents narrow and fast.
Warm currents on western margins: the Kuroshio keeps southern Japan warm and humid, and the East Australian Current brings moist air and rain to the coast of New South Wales.
Cold currents on eastern margins: the Humboldt (Peru) Current cools the air, creating stable conditions, coastal fog (garúa) and the Atacama desert; the California Current gives San Francisco cool summers and fog.
Meeting zones: where the warm Kuroshio meets the cold Oyashio off Hokkaido, dense fog forms. The warm Alaska Current moderates winters along the coast of southern Alaska.
Variability: during El Niño the Peru Current weakens and warm water reaches South America, bringing heavy rain to Peru and drought to Indonesia and Australia.
Map: Pacific Ocean showing the North and South Pacific gyres with warm (Kuroshio, East Australian, Alaska) and cold (California, Humboldt, Oyashio) currents and the deserts beside cold currents.
Pacific currents thus decide whether a coast is humid or arid, mild or cool.
Example 10 (UPSC 2022, 15 marks): What is the relationship between ocean currents and global surface wind systems? Explain with examples how does the gyre in the Northern Hemisphere differ from the one in the Southern Hemisphere.
Paper and question: Paper I, Q2(c)
Approach: Explain how the global wind belts drive surface currents (with Ekman transport and Coriolis), then compare the Northern and Southern Hemisphere gyres on direction, boundaries, strength and subpolar circulation with named examples; draw a world map of winds and gyres.
Surface currents are largely wind-driven: the pattern of ocean circulation mirrors the pattern of planetary winds, modified by the Coriolis force and the shape of the basins.
Relationship: the trade winds drive the North and South Equatorial Currents westward; the westerlies drive the North Atlantic, North Pacific and West Wind drifts eastward. Because of Ekman transport, water moves at an angle to the wind and piles up in the subtropics, so currents circle the subtropical highs as gyres. In the north Indian Ocean the monsoon reverses the currents seasonally, the clearest proof of wind control.
Direction: Northern Hemisphere gyres turn clockwise (Gulf Stream, Kuroshio, Canary, California), while Southern Hemisphere gyres turn anticlockwise (Brazil, Benguela, East Australian, Humboldt).
Boundaries: northern gyres are closed by continents on the poleward side, so their drifts turn back; southern gyres share an open poleward limb, the Antarctic Circumpolar Current, which links all three oceans.
Strength: northern western boundary currents (Gulf Stream, Kuroshio) are stronger and warmer than the Brazil and East Australian currents.
Subpolar circulation: the north has distinct anticlockwise subpolar gyres (Alaska, Labrador–Irminger), while the south has mainly the Weddell and Ross gyres near Antarctica.
Map: World map of the pressure belts and winds with the five subtropical gyres, clockwise in the north and anticlockwise in the south, and the West Wind Drift.
Thus winds set the pattern, but land and rotation make the two hemispheres' gyres different.
Example 11 (UPSC 2020, 15 marks): Explain the currents of the North Atlantic Ocean and their significant role in the climate of Western Europe.
Paper and question: Paper I, Q2(c)
Approach: Describe the North Atlantic gyre and the subpolar currents in sequence, then explain how the Gulf Stream–North Atlantic Drift system moderates the climate of Western Europe, with examples and a note on AMOC weakening; draw a map of North Atlantic currents.
The North Atlantic circulation is a clockwise subtropical gyre driven by the trade winds and westerlies, linked to an anticlockwise subpolar gyre in the north.
Currents: the warm North Equatorial Current flows west, feeding the Antilles and Florida currents. The Gulf Stream leaves Florida, flows along the US coast and turns east off Cape Hatteras; beyond the Grand Banks it continues as the North Atlantic Drift towards Europe. One branch goes north as the Norwegian Current and Irminger Current; the other turns south as the cold Canary Current. The cold Labrador and East Greenland currents flow south from the Arctic.
Role in Western Europe's climate: the North Atlantic Drift carries tropical heat far north, so the westerlies blowing onshore give Britain, Ireland, France and Norway mild winters and cool summers: a marine west coast (Cfb) climate.
Evidence: winter temperatures in western Norway are far higher than in places at the same latitude in Canada or Siberia, and ports such as Narvik and Murmansk remain ice-free in winter.
Rainfall and storms: moist air over warm water gives year-round rain to western Europe, and frontal cyclones move along the drift.
Map: North Atlantic showing the Gulf Stream, North Atlantic Drift, Norwegian, Canary, Labrador and East Greenland currents and the Grand Banks fog zone.
A weakening of the AMOC, projected by IPCC AR6, could reduce this warming effect, making these currents vital to Europe's future climate.
Example 12 (UPSC 2019, 10 marks): How are sandspits and tombolos formed?
Paper and question: Paper I, Q1(c)
Approach: Explain longshore drift as the common process, then describe step by step how a spit and a tombolo form, with Indian and world examples; draw plan sketches of a spit and a tombolo.
Sandspits and tombolos are depositional coastal landforms built of sand and shingle moved by longshore drift, the zig-zag transport of sediment along the shore when waves approach obliquely.
Sandspit: where the coastline changes direction abruptly, as at a headland or river mouth, the drift continues into deeper, calmer water and deposits sediment. A narrow ridge of sand grows out from the land, attached at one end and free at the other; wave refraction often curves its tip into a hook. Examples: Kakinada spit at the Godavari delta, the sandbar enclosing Chilika lake, and Spurn Head in England.
Tombolo: when an island lies close to the shore, waves refract around it and lose energy in its lee, so sediment accumulates until a bar joins the island to the mainland. Examples: Chesil Beach linking the Isle of Portland to Dorset, and the double tombolo of Monte Argentario in Italy.
Diagram: Plan sketches showing oblique waves, longshore drift arrows, a recurved spit at a bend in the coast and a tombolo joining an island to the mainland.
Both are dynamic and can be breached by storms or starved by dams and sand mining upstream.
Example 13 (UPSC 2019, 15 marks): How are ocean waves formed? Distinguish between a wave of oscillation and a wave of translation.
Paper and question: Paper I, Q4(c)
Approach: Explain how wind generates waves (theories, fetch, duration, speed) and wave anatomy, then distinguish waves of oscillation from waves of translation on particle motion, location and effects; draw both wave types approaching a shore.
Ocean waves are undulations of the water surface that transfer energy, not water, across the sea. Most are generated by wind; tsunamis come from earthquakes and landslides.
Formation: wind blowing over calm water creates ripples through friction and pressure differences; Jeffreys' sheltering hypothesis (1925) and later theories of Phillips and Miles (1957) explain how waves grow. Wave height and length increase with wind speed, its duration and the fetch, the open distance over which it blows. In the generating area waves are steep and irregular (sea); outside it they travel as regular swell.
Wave of oscillation: in deep water, where depth exceeds half the wavelength, water particles move in circular orbits that shrink with depth and return to their position; only the form moves forward. Such waves cross open oceans as swell.
Wave of translation: as a wave enters water shallower than half its wavelength, the orbits drag on the bottom and flatten, the wave slows, steepens and breaks; water then moves forward bodily as surf and swash up the beach, with backwash returning. These waves erode, transport and deposit sediment, shaping beaches.
Diagram: Profile from deep sea to beach showing circular orbits under oscillatory waves, flattened orbits in shallow water, the breaker zone and swash and backwash.
Every wind wave thus begins as an oscillation and ends as translation on the coast, where its energy does geomorphic work.
Example 14 (UPSC 2016, 15 marks): "The relationship between the winds and the currents is best seen in the Indian Ocean." Justify.
Paper and question: Paper I, Q3(b)
Approach: Justify the statement by contrasting the permanent southern gyre with the monsoon-driven reversal of currents in the north Indian Ocean in winter and summer, naming the currents; draw two seasonal sketch maps.
Surface currents are driven chiefly by winds, but in most oceans the wind belts are steady, so the link is hidden. The north Indian Ocean, closed by Asia and lying in the monsoon realm, is unique: its currents reverse seasonally with the monsoon winds.
Southern Indian Ocean: as in other oceans, a permanent anticlockwise gyre exists: the South Equatorial Current flows west under the south-east trades, the warm Mozambique and Agulhas currents flow south along Africa, the West Wind Drift flows east, and the cold West Australian Current returns north.
Winter (north-east monsoon): winds blow from land to sea, driving the North-East Monsoon Current westward; the circulation in the Arabian Sea and Bay of Bengal becomes anticlockwise, and an Equatorial Counter Current flows east south of the equator.
Summer (south-west monsoon): the winds reverse and the South-West Monsoon Current flows eastward; the circulation turns clockwise. The Somali Current flows strongly north, with intense upwelling, and the coastal currents of India also reverse.
Diagram: Two sketch maps of the north Indian Ocean: January with the westward North-East Monsoon Current, and July with the eastward South-West Monsoon Current and northward Somali Current.
Since the currents change direction within months of the winds, the Indian Ocean offers the clearest proof that wind drives surface circulation, justifying the statement.
Example 15 (UPSC 2014, 10 marks): Illustrate the origin and nature of Sargasso Sea and Lagoon.
Paper and question: Paper I, Q1(e)
Approach: Illustrate both features separately: origin and nature of the Sargasso Sea within the North Atlantic gyre, then origin, types and nature of lagoons with Indian examples; draw a sketch map of the Sargasso Sea and a plan of a coastal lagoon.
Sargasso Sea: origin. It lies in the North Atlantic around Bermuda, inside the clockwise subtropical gyre bounded by the Gulf Stream, North Atlantic Drift, Canary Current and North Equatorial Current. It is the only sea defined by currents rather than coasts; water converges here beneath the subtropical high.
Nature: calm, warm, highly saline and very clear, with low nutrients; it is covered by floating mats of Sargassum seaweed. It is the spawning ground of European and American eels, but it also traps floating plastic.
Lagoon: origin. A lagoon is a shallow body of water separated from the sea by a sandbar, spit, barrier island or coral reef, linked through narrow inlets. Coastal lagoons form when longshore drift builds bars across bays or river mouths; atoll lagoons lie inside coral rings.
Nature: brackish, shallow and highly productive; examples are Chilika and Pulicat on India's east coast, Vembanad in Kerala and the Venice lagoon.
Map: Sketch of the North Atlantic gyre enclosing the Sargasso Sea, and a plan of Chilika lake behind its sandbar.
Both are calm, enclosed waters of high ecological value.
4. Marine Resources, Coral Reefs and Sea-level Change
Example 16 (UPSC 2025, 15 marks): What is deep-sea mining? What are the potential benefits and risks associated with it?
Paper and question: Paper I, Q2(b)
Approach: Define deep-sea mining and its target resources and governance, then weigh benefits against environmental, legal and social risks, with India's programme as an example; draw a map of major nodule fields.
Deep-sea mining is the extraction of minerals from the ocean floor below about 200 m, mainly from three resources: polymetallic nodules on abyssal plains (manganese, nickel, copper, cobalt), polymetallic sulphides at hydrothermal vents, and cobalt-rich crusts on seamounts. In the Area beyond national jurisdiction it is regulated by the International Seabed Authority (ISA) under UNCLOS, which has issued exploration contracts but has not yet adopted a final exploitation code.
Benefits: nodules contain metals essential for batteries, electric vehicles and renewable energy; the Clarion–Clipperton Zone in the Pacific holds very large reserves. Seabed sources can reduce dependence on a few land producers. For India, the Central Indian Ocean Basin contract and the Deep Ocean Mission (2021), with the Samudrayaan submersible Matsya 6000, support resource security and the blue economy.
Environmental risks: collectors destroy slow-growing habitats that may take centuries to recover; sediment plumes smother life over wide areas; noise and light disturb deep-sea species, many still undescribed.
Governance and social risks: rules on liability, benefit-sharing under the common heritage principle and monitoring remain unsettled; several countries have called for a moratorium or precautionary pause, and fishing communities in the Pacific fear damage to tuna stocks.
Map: World map marking the Clarion–Clipperton Zone, the Central Indian Ocean Basin, hydrothermal vent fields on mid-ocean ridges and crust-bearing seamounts of the western Pacific.
Deep-sea mining therefore needs strong baseline science, a precautionary ISA code and equitable sharing before commercial extraction begins.
Example 17 (UPSC 2024, 10 marks): With suitable examples explain the factors causing sea level changes.
Paper and question: Paper I, Q1(c)
Approach: Classify the factors into eustatic (global) and isostatic or local, explain each with a named example, and note the present trend; draw a simple diagram of eustatic versus isostatic change.
Sea-level change is the rise or fall of the sea relative to land, caused either by a change in the volume of ocean water or basins (eustatic) or by vertical movement of the land (isostatic and tectonic).
Glacio-eustasy: in glacial periods water is locked in ice sheets; at the Last Glacial Maximum sea level was about 120 m lower, and later melting drowned river valleys into rias and estuaries.
Thermal expansion and ice melt today: warming water expands and glaciers melt; IPCC AR6 (2021) estimates global sea level rose about 0.20 m in 1901–2018, at about 3.7 mm per year in 2006–2018.
Glacio-isostasy: land depressed by ice rebounds after melting, so Scandinavia and Hudson Bay are rising, producing raised beaches.
Tectonic and local factors: uplift raised parts of the north Andaman coast in the 2004 earthquake, while subsidence from groundwater pumping and sediment compaction lowers deltas, as in Jakarta and the Sundarbans.
Diagram: Two panels: eustatic change with sea level moving against fixed land, and isostatic change with land rising after ice removal.
Present rise is mainly eustatic, but local subsidence magnifies it on deltas.
Example 18 (UPSC 2023, 10 marks): What is ocean ranching? How are aqua-cowboys related to such activities?
Paper and question: Paper I, Q1(b)
Approach: Define ocean ranching and how it works with examples, then explain the term aqua-cowboys as people who herd and manage fish in open water (acoustic conditioning, offshore pens), ending with benefits and concerns; draw a flow diagram of the ranching cycle.
Ocean ranching is a form of mariculture in which young fish or shellfish are reared in hatcheries, released into the open sea to feed and grow on natural food, and harvested when they return or are recaptured. Unlike cage farming, the animals are not fed or confined for most of their life.
Examples: the best known is salmon ranching in Japan and Alaska, where hatchery smolts migrate to sea and return as adults to their home rivers; Japan and China also release scallops and sea bream.
Aqua-cowboys: the term describes fishers or managers who 'herd' fish in open water like ranchers herd cattle. They use acoustic conditioning, training fish to gather at a sound signal linked with feeding, as tried in Japanese marine ranching, as well as offshore pens and artificial reefs, to keep stocks near a site and recapture them.
Diagram: Flow diagram: hatchery → release of juveniles → growth at sea on natural food → return or acoustic recall → harvest.
Ranching can rebuild depleted stocks and supply protein, but it raises concerns about competition with wild fish, genetic dilution and ownership of released stock.
Example 19 (UPSC 2023, 20 marks): Give an account of marine resources and their economic significance. How has marine pollution affected such resources?
Paper and question: Paper I, Q4(a)
Approach: Classify marine resources (biotic, mineral, energy, other) with their economic significance and Indian and world examples, then analyse how different kinds of marine pollution damage each resource, ending with a way forward; draw a map of India's marine resources.
Oceans cover about 71 per cent of the earth and hold biotic, mineral and energy resources that underpin the blue economy. India, with a coastline of over 7,500 km and an EEZ of about 2.02 million km², depends heavily on them.
Biotic resources: fish and shellfish supply protein and livelihoods; India is among the world's largest fish producers, with rich grounds off Kerala and Gujarat. Seaweeds, mangroves and coral reefs give food, medicines and coastal protection.
Mineral resources: offshore oil and gas (Mumbai High, Krishna–Godavari basin, North Sea, Gulf of Mexico); placer sands of ilmenite and monazite on the Kerala and Odisha coasts; salt; and polymetallic nodules in the Central Indian Ocean Basin.
Energy and other uses: tidal, wave, offshore wind and ocean thermal energy are emerging; shipping carries most of India's trade by volume through ports such as Mumbai, Mundra and Visakhapatnam; tourism, desalination and marine biotechnology add value and jobs.
Effects of pollution: oil spills, such as Deepwater Horizon (2010) and the 2017 Ennore spill near Chennai, kill fish, birds and mangroves. Nutrient runoff causes eutrophication and dead zones, as in the Gulf of Mexico, collapsing fisheries. Plastics and microplastics enter the food chain and damage tourism; heavy metals accumulate in seafood. Warming and acidification bleach corals, reducing fish nurseries.
Map: Outline map of India showing Mumbai High, the KG basin, placer sand coasts of Kerala and Odisha, major fishing zones, coral areas (Gulf of Mannar, Lakshadweep, Andamans) and the Central Indian Ocean Basin.
Integrated coastal zone management, enforcement of MARPOL and of India's ban on single-use plastics, sewage treatment and a network of marine protected areas are needed to keep these resources productive for future generations.
Example 20 (UPSC 2022, 10 marks): When corals are affected by stress it causes them to turn completely white. Explain the reasons of such an occurrence.
Paper and question: Paper I, Q1(d)
Approach: Explain coral bleaching as the loss of symbiotic zooxanthellae under stress, then list the stress factors (temperature first) with examples; draw a diagram of a healthy and a bleached polyp.
The whitening of stressed corals is called coral bleaching. Reef-building corals live in symbiosis with microscopic algae, zooxanthellae, in their tissues, which provide most of their food through photosynthesis and give them colour. Under stress, the algae produce harmful compounds and are expelled, so the transparent tissue reveals the white limestone skeleton.
High temperature: the main cause; water about 1 °C above the usual summer maximum for several weeks triggers mass bleaching, as during El Niño years (1998, 2016) on the Great Barrier Reef and in the Gulf of Mannar and Lakshadweep.
Other stresses: intense sunlight and UV in calm, clear water; low salinity from heavy rain or floods; sediment and nutrient pollution; ocean acidification; disease; and very low tides exposing reefs.
Diagram: Two coral polyps: one coloured with zooxanthellae in its tissue, one white after their expulsion, with arrows showing heat stress.
If stress ends soon, corals can regain algae and recover; prolonged bleaching leads to starvation and death.
Example 21 (UPSC 2020, 10 marks): Marine resources are economically very significant. Discuss citing suitable examples.
Paper and question: Paper I, Q1(c)
Approach: Discuss the economic significance of marine resources by category with named examples, especially Indian, and end with the need for sustainable use; draw a sketch map of key marine resource sites of India.
Marine resources are the living, mineral and energy wealth of the seas, the base of the blue economy.
Food and livelihoods: fisheries feed billions and employ millions; India's marine fisheries along Kerala, Gujarat and Tamil Nadu support coastal communities and seafood exports, especially shrimp.
Energy and minerals: offshore fields such as Mumbai High and the Krishna–Godavari basin supply oil and gas; beach placers of ilmenite and monazite at Chavara (Kerala) and Chhatrapur (Odisha) feed titanium and nuclear industries; nodules in the Central Indian Ocean Basin are a future source of nickel and cobalt.
Trade and services: sea routes carry most world trade; ports like Mumbai and Visakhapatnam drive regional growth. Coastal tourism in Goa and the Maldives, salt from Gujarat and seaweed from the Gulf of Mannar add income.
Renewable energy: offshore wind off Gujarat and Tamil Nadu and tidal sites in the Gulf of Khambhat hold potential.
Map: India showing Mumbai High, KG basin, Chavara and Chhatrapur placers, major ports, fishing zones and the Central Indian Ocean Basin.
Sustainable management is essential to keep these benefits.
Example 22 (UPSC 2020, 15 marks): Discuss the concept of coral bleaching, its recovery and macroalgal regime shifts due to this process.
Paper and question: Paper I, Q2(b)
Approach: Cover all three parts in turn: the concept of bleaching, the conditions for recovery, and the macroalgal regime shift with its drivers and examples; draw a ball-and-cup or flow diagram showing the two alternative reef states.
Concept: coral bleaching is the loss of symbiotic algae (zooxanthellae) or their pigments from coral tissue under stress, leaving the white skeleton visible. The main trigger is sea temperature about 1 °C above the summer maximum for weeks, as in the global events of 1998, 2010, 2014–17 and from 2023 (NOAA).
Recovery: if stress is short, corals regain algae within weeks or months; if many die, the reef recovers through regrowth of survivors and settlement of new larvae, usually over a decade or more. Recovery is faster on deeper, structurally complex reefs with abundant herbivorous fish, clean water and larval supply from connected reefs.
Macroalgal regime shift: after mass mortality, dead skeletons are colonised by turf and fleshy algae. If grazing is weak and nutrients high, algae overgrow and shade new coral recruits, and the reef flips to a stable algae-dominated state. This persists even when conditions improve, a property called hysteresis.
Examples: in Jamaica, overfishing and the 1983 die-off of the grazing sea urchin Diadema, followed by hurricane damage, turned reefs into algal beds (Terry Hughes, 1994). In the Seychelles after 1998, Graham and colleagues (2015) found that some reefs recovered while others shifted to macroalgae.
Diagram: Flow diagram: healthy coral reef → bleaching and mortality → either recovery (herbivores, clean water) back to coral, or macroalgal takeover (overfishing, nutrients) as a stable alternative state.
Protecting herbivores such as parrotfish, controlling runoff and cutting emissions are thus key to keeping reefs resilient.
Example 23 (UPSC 2018, 10 marks): Describe the causes and consequences of sea level changes.
Paper and question: Paper I, Q1(c)
Approach: Give the causes (eustatic and isostatic/local) briefly with examples, then the consequences for coasts, people and ecosystems with Indian examples; draw a diagram of a coast before and after sea-level rise.
Sea-level change is the relative rise or fall of the sea against the land. IPCC AR6 (2021) estimates global sea level rose about 0.20 m between 1901 and 2018, and the rate is accelerating.
Causes: eustatic changes alter the volume of water, through growth or melting of ice sheets and glaciers and thermal expansion of warming water; isostatic and tectonic changes move the land, as in post-glacial rebound in Scandinavia; local subsidence from groundwater extraction and sediment compaction affects deltas such as the Ganga–Brahmaputra.
Consequences: coastal flooding and erosion, as on Sundarbans islands like Ghoramara; salinisation of groundwater and farmland in Kerala's Kuttanad and Bangladesh; loss of mangroves and wetlands where they cannot migrate inland; stronger storm surges during cyclones; displacement and threats to the existence of low-lying states such as the Maldives, Tuvalu and Kiribati; and damage to megacities like Mumbai and Kolkata.
Diagram: Coastal profile showing the present shoreline and a raised sea level flooding the lowland, with saltwater intrusion into groundwater.
Past falls left raised beaches; the present rise demands adaptation, mangrove restoration and planned retreat.
Example 24 (UPSC 2018, 20 marks): Describe the potential marine energy resources with reference to their benefits, harvestibility and environmental impacts.
Paper and question: Paper I, Q4(a)
Approach: Take each marine energy source (tidal, wave, ocean thermal, current, salinity gradient, offshore wind) and assess its benefits, harvestability (where and how it can be tapped, with examples) and environmental impacts, ending with India's prospects; draw a world or India map of marine energy sites.
The oceans hold vast renewable energy in tides, waves, heat, currents, salinity differences and offshore winds. All are free of fuel and carbon emissions in operation, but they differ in harvestability and impact.
Tidal energy: predictable and reliable; harvestable where the tidal range is large, through barrages (La Rance, France, 240 MW, 1966; Sihwa Lake, South Korea, 254 MW, 2011) or tidal-stream turbines (MeyGen, Scotland). In India, the Gulf of Khambhat, Gulf of Kachchh and Sundarbans have potential. Barrages alter estuarine flow, sedimentation and fish migration.
Wave energy: abundant on exposed coasts in the westerlies, such as western Europe; devices include oscillating water columns, as at Mutriku (Spain) and the experimental Vizhinjam plant in Kerala. Harvest is limited by storm damage and high cost; impacts are mostly local, on seabed and coastal processes.
Ocean thermal energy conversion (OTEC): uses the temperature difference of about 20 °C between warm surface and cold deep water in the tropics; it can also yield fresh water, as in NIOT's low-temperature desalination plants in Lakshadweep. Efficiency is low and costs high; discharge of cold water may disturb local ecology.
Ocean currents and salinity gradient: steady currents like the Gulf Stream and the mixing of river and sea water (tested in Norway) offer potential but remain experimental.
Offshore wind: the most mature, with large farms in the North Sea; India targets 30 GW by 2030 off Gujarat and Tamil Nadu. Impacts include bird collisions, noise during construction and conflicts with fishing.
Map: World map marking La Rance, Sihwa, MeyGen, Mutriku and North Sea wind farms, with an inset of India showing the Gulf of Khambhat, Gulf of Kachchh, Vizhinjam, Lakshadweep and offshore wind zones.
Marine energy can diversify the low-carbon energy mix, but needs cost reduction and careful environmental assessment.
Example 25 (UPSC 2017, 10 marks): Distinguish between low energy coasts and coral coasts.
Paper and question: Paper I, Q1(b)
Approach: Define each coast type and distinguish them on setting, energy, processes, landforms and examples (Indian and world); draw contrasting coastal profiles.
Low energy coasts are sheltered coasts where small waves and gentle currents bring little energy, so deposition exceeds erosion. Coral coasts are tropical coasts built or fringed by coral reefs, formed by living organisms.
Setting: low energy coasts occur in sheltered bays, estuaries, lagoons and inland seas at any latitude, often with large tidal ranges; coral coasts are confined to warm (about 20–29 °C), clear, shallow, saline tropical seas, mostly between 30° N and 30° S, on the eastern margins of oceans.
Processes: low energy coasts are shaped by deposition of fine silt and clay by rivers and tides; coral coasts by biological growth of reef organisms and the breaking of waves on reef fronts.
Landforms: low energy coasts have mudflats, salt marshes, mangrove swamps and deltas, as in the Sundarbans and the Gulf of Kachchh; coral coasts have fringing and barrier reefs, atolls and lagoons, as in the Gulf of Mannar, Lakshadweep and the Great Barrier Reef.
Diagram: Two profiles: a gently sloping muddy shore with mangroves, and a reef coast with lagoon and reef crest absorbing waves.
Reefs themselves create low energy lagoons behind them.
Example 26 (UPSC 2016, 20 marks): Bring out the various ecological problems associated with the exploitation and use of oceans and their resources.
Paper and question: Paper I, Q4(a)
Approach: Bring out the ecological problems resource by resource (fisheries, minerals and oil, coastal habitats, pollution, shipping, climate-related) with named examples and data, ending with solutions; draw a world map of hotspots of ocean degradation.
Growing human demand has turned the oceans into sources of food, fuel, minerals and transport, and also into sinks for waste, creating serious ecological problems.
Overfishing: FAO's SOFIA 2024 reports that about 38 per cent of assessed fish stocks were overfished in 2021. The collapse of the Grand Banks cod fishery in the early 1990s shows the danger. Bottom trawling destroys seabed habitats, and bycatch kills turtles, dolphins and sharks; in India, trawling has damaged grounds in the Palk Bay.
Oil and mineral extraction: offshore drilling and tanker accidents cause spills (Deepwater Horizon, 2010; MV Wakashio off Mauritius, 2020); sand and coral mining erode coasts; proposed deep-sea mining threatens fragile abyssal habitats.
Coastal habitat loss: mangroves are cleared for aquaculture ponds, ports and tourism, and coral reefs are damaged by sedimentation and blast fishing, reducing nurseries and storm protection.
Pollution: untreated sewage and fertiliser runoff create dead zones, such as in the Gulf of Mexico and the Baltic Sea; plastics accumulate in gyres like the Great Pacific Garbage Patch and enter food chains as microplastics.
Shipping and noise: ballast water spreads invasive species across oceans, ship strikes and engine noise disturb whales and dolphins, and routine discharge of oily bilge water adds chronic pollution along busy routes such as the Arabian Sea lanes.
Climate stress: burning fossil fuels warms and acidifies the oceans, causing coral bleaching and deoxygenation.
Map: World map marking overfished zones, oil spill sites, dead zones, garbage patches and bleached reefs.
Ecosystem-based fisheries management, marine protected areas (SDG 14), MARPOL, the High Seas Treaty (2023) and plastic control can restore ocean health.
Example 27 (UPSC 2014, 15 marks): Give an account of recent observations on coral bleaching with reference to Clive Wilkinson's Report.
Paper and question: Paper I, Q4(c)
Approach: Introduce Clive Wilkinson and the GCRMN 'Status of Coral Reefs of the World' reports, summarise their observations on bleaching (1998 event, regional damage, recovery, threats), then add more recent observations up to the latest global events, ending with responses; draw a world map of bleaching hotspots.
Clive Wilkinson, coordinator of the Global Coral Reef Monitoring Network (GCRMN), edited the series Status of Coral Reefs of the World (1998–2008), the main global assessments of reef health.
The 1998 event: the reports describe the 1997–98 El Niño and Indian Ocean warming as the first truly global bleaching event, which seriously damaged or killed corals on about 16 per cent of the world's reefs. The worst-hit regions were the Indian Ocean (Maldives, Seychelles, Lakshadweep, Sri Lanka) and parts of South-East Asia and the western Pacific.
Status and threats: the 2008 report estimated that about 19 per cent of the world's reefs had effectively been lost, with further large shares seriously threatened in the coming decades. It identified climate change, through bleaching and ocean acidification, as the greatest long-term threat, added to overfishing, pollution and coastal development.
Recovery: remote or well-managed reefs damaged in 1998 often recovered, while reefs under local stress recovered poorly, showing that local protection builds resilience.
Later observations: NOAA recorded further global events in 2010 and 2014–17, and a fourth beginning in 2023; the Great Barrier Reef bleached repeatedly (2016, 2017, 2020, 2022, 2024), and Indian reefs in the Gulf of Mannar and Lakshadweep were affected again.
Map: World map marking major bleaching hotspots: Great Barrier Reef, Maldives, Seychelles, Lakshadweep, Gulf of Mannar, Caribbean and South-East Asia.
Bleaching is thus becoming more frequent, shortening recovery intervals, so emission cuts and local reef management are both essential.
5. Law of the Sea and Marine Pollution
Example 28 (UPSC 2021, 15 marks): Maritime security is being neglected. Indicate the major challenges and suggest solutions in the context of Law of the Sea.
Paper and question: Paper I, Q3(b)
Approach: Explain why maritime security matters and why it is neglected, list the major challenges with examples, then suggest solutions rooted in UNCLOS and regional cooperation, including India's initiatives; draw a map of the Indian Ocean marking chokepoints and piracy zones.
About 80 per cent of world trade by volume moves by sea (UNCTAD), yet maritime security gets less attention than land security because the oceans are vast, jurisdiction is divided into zones under UNCLOS (1982), and the high seas lie beyond any single state's control.
Challenges: piracy and armed robbery (Gulf of Aden and Somali coast, Gulf of Guinea, Strait of Malacca); maritime terrorism, as in the 2008 Mumbai attacks by sea; smuggling of drugs, arms and people; illegal, unreported and unregulated fishing; and territorial disputes and militarisation, as in the South China Sea, where China rejected the 2016 arbitral award in favour of the Philippines.
Gaps in the law: UNCLOS defines piracy only on the high seas, offers weak enforcement, and does not address cyber threats to ports and ships or security of undersea cables. Environmental threats such as oil spills also cross boundaries.
Solutions: strengthen regional cooperation, information-sharing and joint patrols, as through the Djibouti Code of Conduct (2009), ReCAAP in Asia and India's Information Fusion Centre–Indian Ocean Region (2018); respect arbitral rulings and freedom of navigation; build coastal states' capacity, in line with India's SAGAR vision (2015); and update legal frameworks, as India's Maritime Anti-Piracy Act, 2022.
Map: Indian Ocean showing the Strait of Hormuz, Bab-el-Mandeb, Malacca Strait, Gulf of Aden piracy zone, major sea lanes and the IFC-IOR at Gurugram.
Maritime security is a shared global good that needs collective, rules-based action under the Law of the Sea.
Example 29 (UPSC 2016, 10 marks): Discuss Maritime Zones.
Paper and question: Paper I, Q1(c)
Approach: Explain the maritime zones defined by UNCLOS (1982) from the baseline outward, with the rights of the coastal state in each and India's position; draw a cross-section of the zones from the baseline to the high seas.
Maritime zones are belts of sea measured from the baseline (usually the low-water line), in which coastal states hold defined rights under UNCLOS (1982); India applies them through its Maritime Zones Act, 1976.
Internal waters: landward of the baseline (ports, bays); full sovereignty.
Territorial sea: up to 12 nautical miles; full sovereignty over water, seabed and airspace, subject to innocent passage of foreign ships.
Contiguous zone: up to 24 nautical miles; the state may enforce customs, fiscal, immigration and sanitary laws.
Exclusive Economic Zone: up to 200 nautical miles; sovereign rights over living and non-living resources, while others keep freedom of navigation. India's EEZ is about 2.02 million km².
Continental shelf: rights over the seabed to 200 nautical miles, or to the edge of the continental margin up to 350 nautical miles.
High seas and the Area: beyond national jurisdiction; open to all, with seabed minerals managed by the International Seabed Authority as common heritage of mankind.
Diagram: Cross-section from the coast showing baseline, internal waters, 12, 24 and 200 nautical mile limits, continental shelf and high seas.
These zones balance coastal control with global freedom of the seas.
Example 30 (UPSC 2014, 15 marks): Give a critical account of reasons and consequences of marine pollution.
Paper and question: Paper I, Q3(c)
Approach: Give a critical account: classify the sources of marine pollution (land-based, ship-based, offshore, atmospheric), then the ecological, economic and health consequences with examples, and critically assess the effectiveness of current controls; draw a diagram of pollution pathways into the sea.
Marine pollution is the introduction by humans of substances or energy into the sea that harm living resources, human health and amenities. Most of it, roughly 80 per cent by common estimates, comes from land.
Reasons: untreated sewage and industrial effluents from coastal cities such as Mumbai; fertiliser and pesticide runoff carried by rivers; plastics from poor waste management; oil from tanker accidents, offshore drilling and routine ship discharges; heavy metals from mining; and atmospheric deposition of nitrogen and mercury.
Ecological consequences: nutrient overload causes eutrophication and hypoxic dead zones (Gulf of Mexico, Baltic Sea); oil spills such as Exxon Valdez (1989) and Deepwater Horizon (2010) kill birds, mammals and mangroves; plastics entangle turtles and break into microplastics.
Human and economic consequences: mercury poisoning at Minamata in Japan showed how toxins move up food chains; fisheries, tourism and aquaculture lose income after spills and algal blooms.
Critical view: MARPOL (1973/78), the London Convention and UNCLOS Part XII have reduced ship-based oil pollution, but land-based sources, the main problem, are weakly regulated and depend on national will. Monitoring is poor in many developing countries, and the global plastics treaty is still under negotiation.
Diagram: Flow diagram of pollution pathways: rivers, sewage outfalls, ships, oil rigs and the atmosphere carrying pollutants into coastal waters and the open ocean.
Control at source, wastewater treatment and integrated coastal management are therefore more effective than clean-up after damage.
Mains points
- Coral bleaching has been asked four times (2014, 2017, 2020, 2022): know zooxanthellae, the 1 °C threshold, global bleaching events and recovery versus macroalgal regime shift.
- Ocean currents recur almost every second year: always link currents to planetary winds and the Coriolis force, and draw a labelled gyre map with warm and cold currents.
- Ocean floor questions (Pacific twice, Indian Ocean once) reward a sketch map plus a plate-tectonic explanation of ridges, trenches and seamount chains.
- Marine resources and their exploitation (2016, 2018, 2020, 2023, 2025) need Indian examples such as Mumbai High, Chavara placers, the Central Indian Ocean Basin and the Deep Ocean Mission.
- Newer themes such as AMOC collapse, deep-sea mining and maritime security show that examiners reward current awareness: cite IPCC AR6, the ISA and UNCLOS correctly.
- Directive words matter: 'distinguish' needs point-by-point contrast, 'critically' needs limitations, and 'with suitable sketches' means the diagram is part of the marks.
Did you know?
- The Sargasso Sea is the only sea in the world with no coastline: it is bounded entirely by ocean currents of the North Atlantic gyre.
Geography Optional: All chapters
- Exam Pattern, Syllabus and Strategy
- The Earth's Interior and Tectonics
- Geomorphic Processes and Landscape Development
- Climatology: Atmosphere and Circulation
- Climatology: Weather Systems, Climates and Climate Change
- Oceanography
- Biogeography
- Environmental Geography
- Perspectives in Human Geography
- Economic Geography
- Population Geography
- Settlement Geography
- Regional Planning
- Models, Theories and Laws in Human Geography
- India: Physical Setting I
- India: Physical Setting II
- Resources of India
- Agriculture in India
- Industry in India
- Transport, Communication and Trade
- Cultural Setting and Population of India
- Settlements in India
- Regional Development and Planning in India
- Political Aspects
- Contemporary Issues
- Places for the Map Question