
Geography Optional · UPSC Notes
Climatology: Atmosphere and Circulation — UPSC Geography Optional Notes
Free, exam-focused notes for UPSC Prelims and Mains, with Prelims tips and Mains points for every topic. 5 topics.
Open in the interactive reader: bookmarks, progress tracking and read-aloud.
Heat Budget, Temperature and Pressure Belts
The earth receives energy from the sun as insolation and returns the same amount to space, so its long-term temperature stays nearly constant; this balance is the heat budget. Low latitudes gain more than they lose and high latitudes lose more than they gain, and this latitudinal imbalance drives winds and ocean currents. Uneven heating and the earth's rotation produce seven pressure belts that shift north and south with the sun.
In simple words
The earth is like a bank account of heat: sunlight is the deposit and heat radiated back to space is the withdrawal, and over years the two balance; this is the heat budget.
The tropics get more sunlight than they lose, while the poles lose more than they get, so air and water carry the extra heat poleward.
This uneven heating creates belts of high and low pressure, which decide where winds blow and where deserts and rainforests lie.
UPSC asks for the heat budget diagram and the pattern of pressure belts.
1. Insolation and the factors controlling it
Insolation: incoming solar radiation received at the earth's surface, mostly as short-wave radiation (visible light and near infrared).
Solar constant: the energy received per unit area at the top of the atmosphere, perpendicular to the sun's rays, at mean earth-sun distance; about 1,361 watts per square metre by satellite measurement (older texts give about 1.94 calories per cm² per minute).
Angle of incidence: vertical rays spread over a smaller area and pass through less atmosphere, so the tropics receive more energy than high latitudes.
Length of day: long summer days at high latitudes partly offset the low sun angle.
Distance from the sun: the earth is nearest the sun at perihelion (about 3 January) and farthest at aphelion (about 4 July), but this changes insolation by only a few per cent and does not cause seasons.
Transparency of the atmosphere: clouds, dust and water vapour reflect, scatter and absorb part of the incoming radiation; this is why the cloudy equator is not the hottest region on land.
Albedo: the fraction of radiation reflected by a surface; fresh snow reflects most of it, dark forest and ocean water reflect little, and the planetary albedo of the earth is about 30 per cent.
2. The heat budget of the earth
Principle: the earth neither accumulates nor loses heat over the long term; incoming short-wave energy equals outgoing long-wave (terrestrial) radiation.
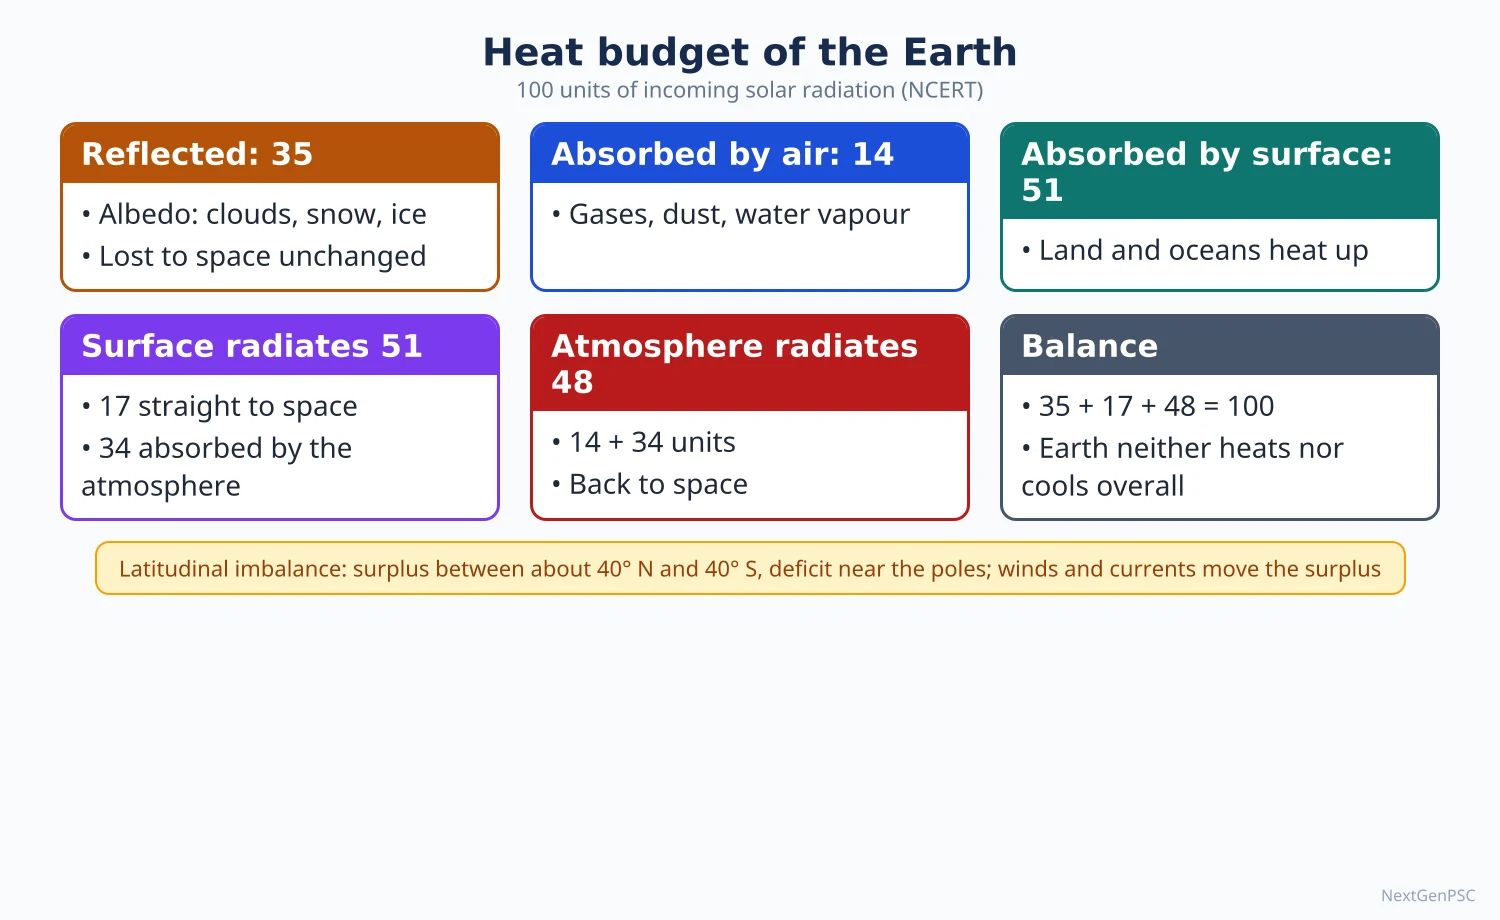
Incoming 100 units (NCERT, Fundamentals of Physical Geography): about 35 units are reflected back to space before reaching the ground (27 from clouds, 6 by scattering, 2 from snow and ice); this is the albedo.
Absorbed: 14 units are absorbed by the atmosphere and 51 units reach and heat the earth's surface.
Surface loss: the surface returns its 51 units; 17 go directly to space as terrestrial radiation through the 'atmospheric window', and 34 are absorbed by the atmosphere (6 by direct absorption, 9 by convection and turbulence, 19 as latent heat of condensation).
Atmospheric loss: the atmosphere, holding 48 units (14 + 34), radiates them back to space.
Balance: outgoing total is 17 + 48 = 65 units, which equals the 65 units absorbed; with the 35 reflected, the budget closes at 100.
Greenhouse effect: water vapour, carbon dioxide, methane and other gases absorb outgoing long-wave radiation and re-radiate part of it downward; without this the mean surface temperature would be about −18°C instead of about 15°C.
3. Latitudinal heat balance and heat transfer
Surplus and deficit: between about 40° N and 40° S there is a net radiation surplus; poleward of these latitudes there is a deficit.
Transfer mechanisms: the surplus is carried poleward by atmospheric circulation (winds, cyclones, latent heat in water vapour) and by ocean currents such as the Gulf Stream and the Kuroshio.
Consequence: without this transfer the tropics would grow steadily hotter and the poles colder; the general circulation of the atmosphere is the earth's heat engine.
4. Distribution of temperature
Controls: latitude, altitude (temperature falls by about 6.5°C per km, the normal lapse rate), distance from the sea (continentality), ocean currents, prevailing winds, relief and aspect, and land cover.
Isotherms: lines joining places of equal temperature; they run roughly east-west but bend sharply where land meets sea.
January pattern: isotherms bend equatorward over cold northern continents (Siberia, Canada) and poleward over warm oceans (North Atlantic Drift); the lowest temperatures occur in north-east Siberia (Verkhoyansk and Oymyakon).
July pattern: isotherms bend poleward over hot northern continents; the highest temperatures occur over the subtropical deserts such as the Sahara and the Thar.
Thermal equator: the line of highest mean temperature lies north of the geographical equator because the northern hemisphere has more land; in July it reaches north India.
Annual range: small at the equator and over oceans, large in continental interiors; the southern hemisphere, mostly ocean, has smaller ranges.
Indian examples: Phalodi in Rajasthan recorded 51.0°C on 19 May 2016, India's highest recorded temperature (IMD); coastal Mumbai and Thiruvananthapuram have small annual ranges, while Delhi and Ganganagar have large ones.
5. Inversion of temperature
Meaning: a layer in which temperature increases with height instead of decreasing.
Ground (radiation) inversion: forms on long, clear, calm winter nights when the ground loses heat quickly and cools the air above it; common over the Indo-Gangetic plain in winter.
Valley inversion: cold, dense air drains down slopes at night and collects in valley floors; frost pockets form, which is why orchards and tea gardens in hills are often on slopes, not valley bottoms.
Frontal and subsidence inversions: warm air overriding cold air at a front, or sinking air warming adiabatically in subtropical highs.
Effects: fog, smog and trapping of pollutants; the winter smog of Delhi and the Indo-Gangetic plain is worsened by inversion and calm winds.
6. Pressure belts of the world
Pressure basics: mean sea-level pressure is about 1,013.25 hectopascals (millibars); pressure falls with height, and isobars join places of equal pressure.
Equatorial low (doldrums, 0° to about 5–10°): thermally induced; intense heating causes rising air and calm conditions; it coincides with the Inter-Tropical Convergence Zone (ITCZ).
Subtropical highs (about 30° N and S, horse latitudes): dynamically induced by descending air of the Hadley cell; associated with the great hot deserts on the western sides of continents.
Subpolar lows (about 60° N and S): dynamically induced where westerlies and polar easterlies converge; zone of frontal cyclones, well marked over the North Atlantic (Icelandic Low) and North Pacific (Aleutian Low).
Polar highs: thermally induced by intense cold and sinking air over the poles.
Seasonal shift: the whole system moves about 5–10° north in the northern summer and south in the northern winter, following the overhead sun; this shift explains Mediterranean climate and the Indian monsoon.
Breaking into cells: in the northern hemisphere land-sea contrast breaks the belts into cells, such as the winter Siberian High and the summer low over north-west India and Pakistan.
7. Diagrams to draw
Heat budget diagram: draw the sun at top left, a horizontal line for the atmosphere and a line for the ground; show 100 units entering, arrows of 35 reflected, 14 absorbed in the atmosphere and 51 reaching the ground; from the ground draw arrows of 17 to space and 34 into the atmosphere, and from the atmosphere 48 to space.
Pressure belts: draw a circle for the globe, mark the equator, 30° and 60° in both hemispheres and the poles; write L at the equator and at 60°, H at 30° and at the poles; add arrows for trade winds, westerlies and polar easterlies between them.
Latitudinal balance graph: plot incoming and outgoing radiation against latitude; the curves cross at about 40°, with surplus shaded between them in the tropics and deficit beyond.
8. Using it in the exam
10-mark answer: define the heat budget, give the 100-unit balance in one line and draw the diagram.
15-mark answer: add the latitudinal imbalance and how winds and ocean currents transfer heat.
20-mark answer: heat budget, latitudinal imbalance, pressure belts and their seasonal shift, with link to climate change (an enhanced greenhouse effect upsets the balance).
Keywords: insolation, albedo, terrestrial radiation, greenhouse effect, latent heat, thermal equator, ITCZ, thermally and dynamically induced belts.
Attribution: the heat-budget figures commonly quoted in India follow NCERT; other sources (such as Trenberth and colleagues) give slightly different values, so name the source when quoting numbers.
| Belt | Approximate latitude | Origin | Associated weather or feature |
|---|---|---|---|
| Equatorial low (doldrums) | 0° to about 5–10° N and S | Thermal | Rising air, calms, daily convectional rain, ITCZ |
| Subtropical high (horse latitudes) | About 30° N and S | Dynamic (sinking Hadley air) | Clear skies, hot deserts on western sides of continents |
| Subpolar low | About 60° N and S | Dynamic (convergence of westerlies and polar easterlies) | Frontal cyclones, stormy weather |
| Polar high | Near the poles | Thermal | Cold, dry, sinking air |
| Component | Units |
|---|---|
| Reflected to space (clouds 27, scattering 6, snow and ice 2) | 35 |
| Absorbed by atmosphere directly | 14 |
| Absorbed by earth's surface | 51 |
| Surface radiation lost directly to space | 17 |
| Surface energy absorbed by atmosphere (radiation 6, convection 9, latent heat 19) | 34 |
| Radiated to space by atmosphere (14 + 34) | 48 |
Mains points
- The heat budget question is usually answered with the 100-unit diagram; draw it neatly and make the arithmetic close (65 in, 65 out).
- Always add the latitudinal imbalance and the role of winds and ocean currents in heat transfer; this lifts a descriptive answer to an analytical one.
- Distinguish thermally induced belts (equatorial low, polar high) from dynamically induced belts (subtropical high, subpolar low).
- Explain the seasonal shift of pressure belts and link it to the Indian monsoon and Mediterranean climate.
- A common mistake is saying the earth is nearest the sun in summer; perihelion is in early January.
- Link to current issues: enhanced greenhouse effect, Arctic amplification through falling albedo, urban heat islands.
Did you know?
- Memory trick for the heat budget: '35–14–51' in, '17–34–48' out; absorbed (14 + 51) and lost (17 + 48) both equal 65.
Atmospheric Circulation, Planetary and Local Winds
Wind is air moving from high to low pressure, steered by the pressure gradient force, the Coriolis force and friction. The general circulation is usually shown by the three-cell model of Hadley, Ferrel and polar cells, which produces the trade winds, westerlies and polar easterlies. East-west cells such as the Walker circulation and many local winds (loo, foehn, chinook, mistral) add regional detail.
In simple words
Wind is air rushing from where pressure is high to where it is low, like air escaping from a pumped-up balloon.
Because the earth spins, moving air is bent, to the right in the northern hemisphere; this bending is the Coriolis force.
Together these create belts of steady winds around the globe and special local winds in valleys, deserts and mountains.
UPSC asks for the three-cell circulation diagram, the Walker circulation, and examples of local winds.
1. Forces that control wind
Pressure gradient force: the force from high to low pressure; the closer the isobars, the steeper the gradient and the stronger the wind.
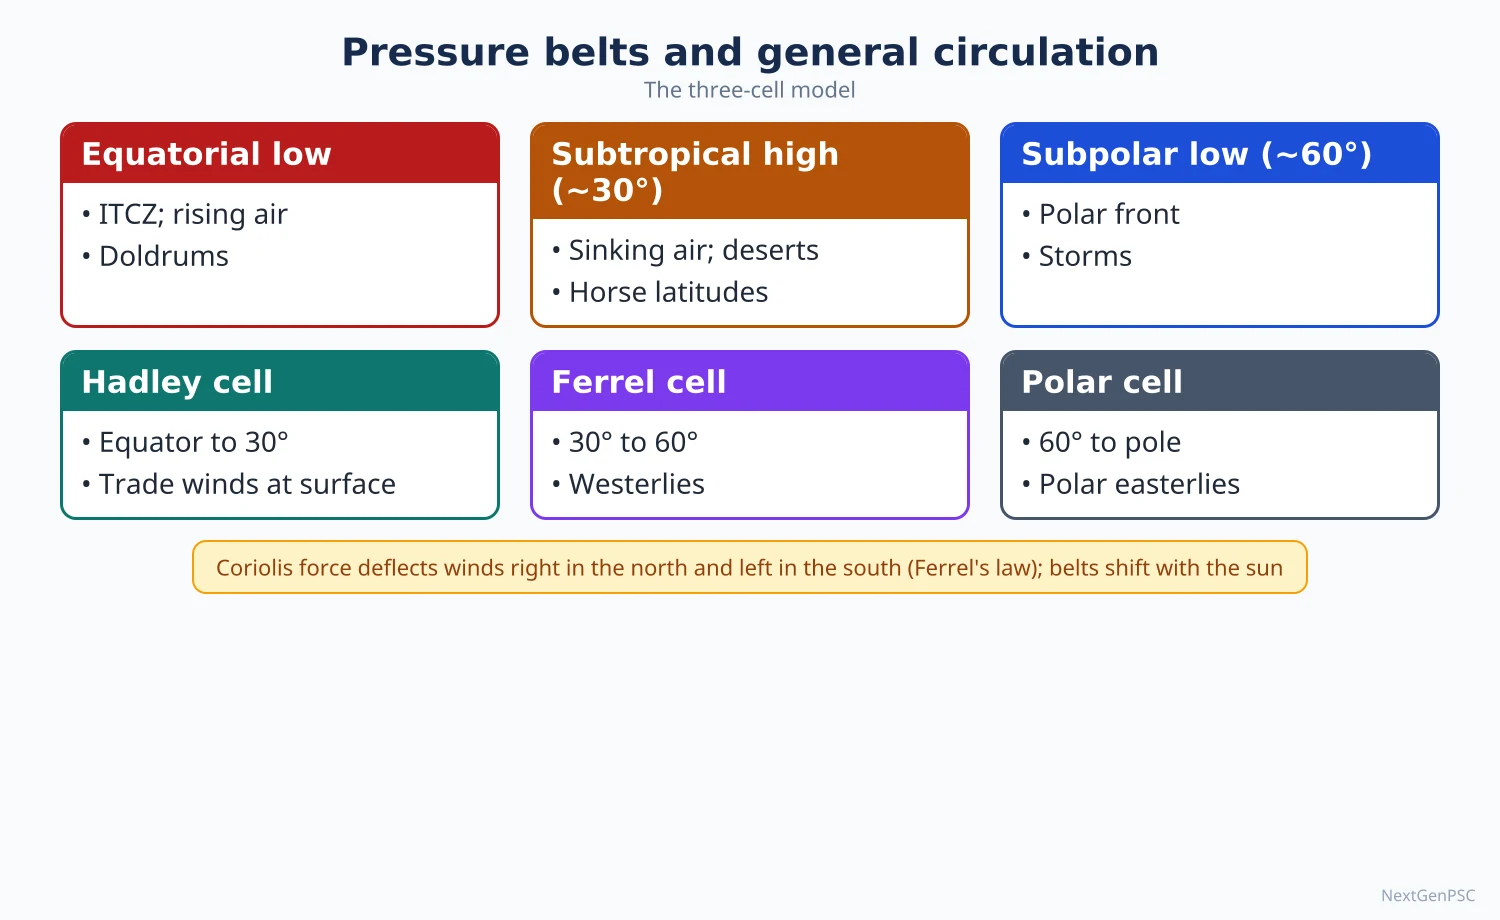
Coriolis force: an apparent deflecting force caused by the earth's rotation, described by Gaspard-Gustave de Coriolis (1835); it deflects moving air to the right in the northern hemisphere and to the left in the southern hemisphere, is zero at the equator and greatest at the poles.
Ferrel's law: William Ferrel applied this deflection to winds and ocean currents in the 1850s; winds turn right in the north and left in the south.
Buys Ballot's law (1857): in the northern hemisphere, if you stand with your back to the wind, low pressure is on your left.
Friction: the ground slows wind in the lowest 1–2 km (the friction layer), so surface winds cross isobars at an angle toward low pressure.
Geostrophic wind: above the friction layer, pressure gradient and Coriolis force balance and the wind blows parallel to the isobars.
Centripetal effects: around cyclones and anticyclones the wind follows curved isobars (gradient wind); air spirals into lows anticlockwise and out of highs clockwise in the northern hemisphere.
2. The general circulation: the three-cell model
George Hadley (1735): proposed a single thermal cell in each hemisphere with air rising at the equator and sinking at the poles, and used the earth's rotation to explain the easterly trades; the low-latitude cell is now called the Hadley cell.
Hadley cell (0°–30°): air rises in the ITCZ, flows poleward aloft, sinks near 30° creating the subtropical highs and returns to the equator as the trade winds.
Ferrel cell (30°–60°): proposed by William Ferrel (1856); an indirect, thermally reverse cell driven by the two neighbouring cells; surface air moves poleward as the westerlies.
Polar cell (60°–90°): cold air sinks at the poles and moves equatorward as the polar easterlies, rising at the subpolar low.
Rossby's refinement (Carl-Gustaf Rossby, 1940s): the mid-latitude flow is better described by large upper-air waves (Rossby waves) and jet streams than by a closed Ferrel cell; the three-cell model is a simplification and the Ferrel cell is a statistical average of eddies.
3. Planetary (permanent) winds
Trade winds (about 5° to 30°): north-east trades in the northern hemisphere and south-east trades in the southern; steady, onshore on eastern sides of continents, giving rain to eastern coasts of tropical lands and leaving western sides dry.
Westerlies (about 35° to 60°): south-westerly in the north and north-westerly in the south; strongest and most regular over the southern oceans, where sailors called them the Roaring Forties, Furious Fifties and Shrieking Sixties.
Polar easterlies (beyond 60°): cold, dry winds from the polar highs; their meeting with the westerlies forms the polar front.
Doldrums and horse latitudes: calm zones at the equatorial low and the subtropical highs, feared by sailing ships.
4. Seasonal and periodic winds
Monsoons: seasonal reversal of winds caused by differential heating and the shift of the ITCZ; best developed in South and South-East Asia (see the topic Monsoons and Jet Streams).
Land and sea breezes: by day the land heats faster, a local low forms and a cool sea breeze blows inland; at night the land cools faster and a land breeze blows seaward; felt along the Konkan and Coromandel coasts.
Mountain and valley winds: by day slopes heat and air rises up the valley (anabatic or valley breeze); at night cold air drains down the slopes (katabatic or mountain breeze), causing valley frost.
5. Walker circulation and ENSO
Walker circulation: an east-west cell along the equatorial Pacific with air rising over the warm western Pacific and Indonesia and sinking over the cool eastern Pacific off Peru; named by Jacob Bjerknes (1969) after Sir Gilbert Walker, who described the Southern Oscillation in the 1920s.
Southern Oscillation: a see-saw of surface pressure between Tahiti and Darwin; the Southern Oscillation Index is measured from their difference.
El Niño: trade winds weaken, warm water spreads east, the Walker cell weakens or shifts east; Peru gets heavy rain while Indonesia and Australia face drought, and the Indian monsoon is often, though not always, weakened.
La Niña: stronger trades, cooler eastern Pacific and a stronger Walker cell; often favourable for the Indian monsoon.
Indian example: the drought years 2002, 2009 and 2015 coincided with El Niño, but 1997, a strong El Niño year, had normal rainfall; the Indian Ocean Dipole partly explains such exceptions.
6. Local winds
Loo (India): hot, dry westerly winds over north-west India and the Ganga plain in May and June afternoons; cause heat stroke.
Kalbaisakhi or Norwesters: violent evening thunderstorms with squalls in West Bengal, Odisha, Assam and Bangladesh in April–May; useful for tea, jute and rice; in Assam called Bardoli Chheerha.
Mango showers: pre-monsoon showers in Kerala and coastal Karnataka in April–May that help ripen mangoes; blossom showers (cherry blossom) in Kodagu help coffee flowering.
Foehn (Alps) and Chinook (Rockies): warm, dry winds on the leeward side of mountains as descending air warms adiabatically at the dry rate after losing moisture on the windward side; the Chinook is called 'snow eater' because it melts snow quickly, helping winter grazing.
Mistral (Rhone valley, France) and Bora (Adriatic coast): cold, dry katabatic winds blowing from snow-covered highlands to the Mediterranean.
Sirocco: hot, dusty wind from the Sahara toward Italy and Sicily, picking up moisture over the sea; brings 'blood rain' when it carries red dust.
Harmattan: dry, dusty north-easterly wind from the Sahara to the Guinea coast of West Africa in winter; called 'the doctor' because it brings relief from humid heat.
Khamsin (Egypt), Simoom (Arabia), Santa Ana (California), Brickfielder (Australia), Zonda (Argentina): other hot dry winds; the Santa Ana is linked with wildfires in southern California.
Blizzard and Purga: cold winds with snow in North America and Siberia respectively.
7. Diagrams to draw
Three-cell model: draw a circle for the earth; mark 0°, 30°, 60° and 90° in each hemisphere; in a vertical section on the right draw three loops per hemisphere (Hadley, Ferrel, polar) with arrows rising at 0° and 60° and sinking at 30° and 90°; on the surface draw curved arrows for north-east trades, south-westerlies and north-east polar easterlies in the north, mirrored in the south.
Walker circulation: draw the equatorial Pacific as a long box; Indonesia on the left with rising arrows and 'warm pool', Peru on the right with sinking arrows and 'cold water'; connect with an upper westward and surface eastward flow; draw a second panel for El Niño with the rising limb shifted to the central Pacific.
Foehn effect: draw a mountain profile with air rising on the windward side (cooling at about 10°C per km until saturation, then at about 5–6°C per km with rain), descending on the leeward side warming at about 10°C per km; show the leeward temperature higher than the starting temperature.
8. Using it in the exam
10-mark answer: define a local wind, give its cause (adiabatic, katabatic or thermal) and two examples with location and effect.
15-mark answer: Walker circulation with ENSO and its effect on the Indian monsoon, with a two-panel diagram.
20-mark answer: general circulation: forces, three-cell model, planetary winds, seasonal shift, limitations and Rossby's view, with a labelled diagram.
Keywords: pressure gradient, Coriolis, geostrophic wind, Hadley cell, Ferrel cell, Rossby waves, Walker circulation, adiabatic warming, katabatic wind.
Attribution: Hadley (1735) for the low-latitude cell, Ferrel (1856) for the mid-latitude cell, Walker for the Southern Oscillation, and Bjerknes (1969) for linking it with El Niño.
| Wind | Region | Nature | Cause or effect |
|---|---|---|---|
| Loo | North-west India, Ganga plain | Hot, dry | Summer heating; heat stroke |
| Kalbaisakhi (Norwester) | West Bengal, Odisha, Assam | Thunderstorm with squall | Pre-monsoon convection; helps tea, jute, rice |
| Foehn | Alps (north slopes) | Warm, dry | Adiabatic warming of descending air; melts snow |
| Chinook | East of the Rockies | Warm, dry | Adiabatic warming; 'snow eater', aids grazing |
| Mistral | Rhone valley, France | Cold, dry | Katabatic drainage from the Alps and Massif Central |
| Bora | Adriatic coast | Cold, dry, gusty | Katabatic flow from the Dinaric highlands |
| Sirocco | Sahara to Italy, Sicily | Hot, dusty, humid after crossing sea | Ahead of Mediterranean depressions |
| Harmattan | Sahara to Guinea coast | Dry, dusty | 'The doctor', relief from humidity |
Mains points
- For general circulation, draw the three-cell diagram and then state its limits: the Ferrel cell is indirect and mid-latitude flow is dominated by Rossby waves and jet streams.
- Explain the Coriolis force correctly: zero at the equator, which is why tropical cyclones rarely form within about 5° of it.
- For local winds, classify by cause (adiabatic: foehn, chinook; katabatic: mistral, bora; thermal: loo, land-sea breeze) rather than listing.
- Link the Walker circulation and ENSO to the Indian monsoon, and note that the relationship is not one-to-one (1997 example, role of the IOD).
- A common mistake is calling the westerlies 'westerly' in direction everywhere; they are south-westerly in the north and north-westerly in the south.
- Indian examples (loo, kalbaisakhi, mango showers) should appear even in Paper I answers on local winds.
Did you know?
- Sailors named the subtropical highs the 'horse latitudes', a name often explained by the story that becalmed ships threw horses overboard to save water; the origin is debated.
Atmospheric Stability, Air Masses and Frontogenesis
Whether a parcel of air keeps rising depends on how the environmental lapse rate compares with the dry and saturated adiabatic lapse rates; this decides stability (clear skies) or instability (clouds, thunderstorms). Large bodies of air with uniform temperature and moisture are air masses, classified by Bergeron by source region. Where contrasting air masses meet, fronts form; the process of their formation is frontogenesis, central to the Norwegian polar front theory.
In simple words
Imagine a hot-air balloon: it keeps rising only while it is warmer than the air around it; air behaves the same way, and this is stability or instability.
Unstable air rises, cools and makes clouds and storms; stable air stays put and gives clear or foggy weather.
Huge blocks of air take on the heat and moisture of the land or sea beneath them, and where two such air masses meet, a front brings changing weather.
UPSC asks about lapse rates, air mass types and how fronts form.
1. Lapse rates and adiabatic change
Environmental lapse rate (ELR): the actual rate at which temperature falls with height in the still atmosphere at a given place and time; on average about 6.5°C per km in the troposphere (the normal lapse rate), but it varies daily.
Adiabatic process: a temperature change in a rising or sinking parcel with no exchange of heat with surrounding air; rising air expands and cools, sinking air is compressed and warms.
Dry adiabatic lapse rate (DALR): the cooling rate of unsaturated rising air, about 9.8°C per km (often rounded to 10°C per km).
Saturated (wet) adiabatic lapse rate (SALR): once the parcel reaches dew point, condensation releases latent heat, so it cools more slowly, about 4–7°C per km depending on temperature (lower in warm, moist tropical air).
Lifting condensation level: the height at which a rising parcel becomes saturated; it marks the flat base of cumulus clouds.
2. Stability and instability
Absolute stability: ELR is less than the SALR; a lifted parcel is always colder than its surroundings and sinks back; skies are clear or layered stratus forms; common in subtropical highs and under inversions.
Absolute instability: ELR exceeds the DALR; a lifted parcel is always warmer than its surroundings and keeps rising; occurs over strongly heated ground on summer afternoons, producing dust devils and cumulus.
Conditional instability: ELR lies between the DALR and the SALR; the air is stable while unsaturated but becomes unstable once saturated; this is the usual state of the tropical atmosphere and explains towering cumulonimbus once lifting reaches condensation.
Neutral equilibrium: ELR equals the relevant adiabatic rate; the parcel stays wherever it is moved.
Lifting mechanisms: convection (surface heating), orography (forced ascent over mountains such as the Western Ghats), frontal lifting and convergence (as in the ITCZ).
Effects of instability: cumulonimbus clouds, thunderstorms, hail, squalls and tornadoes; the Norwesters of eastern India are a result of strong conditional instability when moist south-westerly air lies under dry upper air.
Effects of stability: fog, haze, smog and poor dispersal of pollutants, as in the winter inversions over the Indo-Gangetic plain.
3. Air masses
Definition: a large body of air, hundreds to thousands of kilometres across, with nearly uniform temperature and humidity at each level, acquired from a source region.
Source region: an extensive, uniform surface with light winds and sinking air, where air stays long enough to acquire its properties; typical sources are subtropical highs, polar highs, large oceans and continental interiors such as Siberia and the Sahara.
Classification by Tor Bergeron (1928): by latitude of origin (Arctic A, Polar P, Tropical T, Equatorial E) and nature of surface (continental c, maritime m).
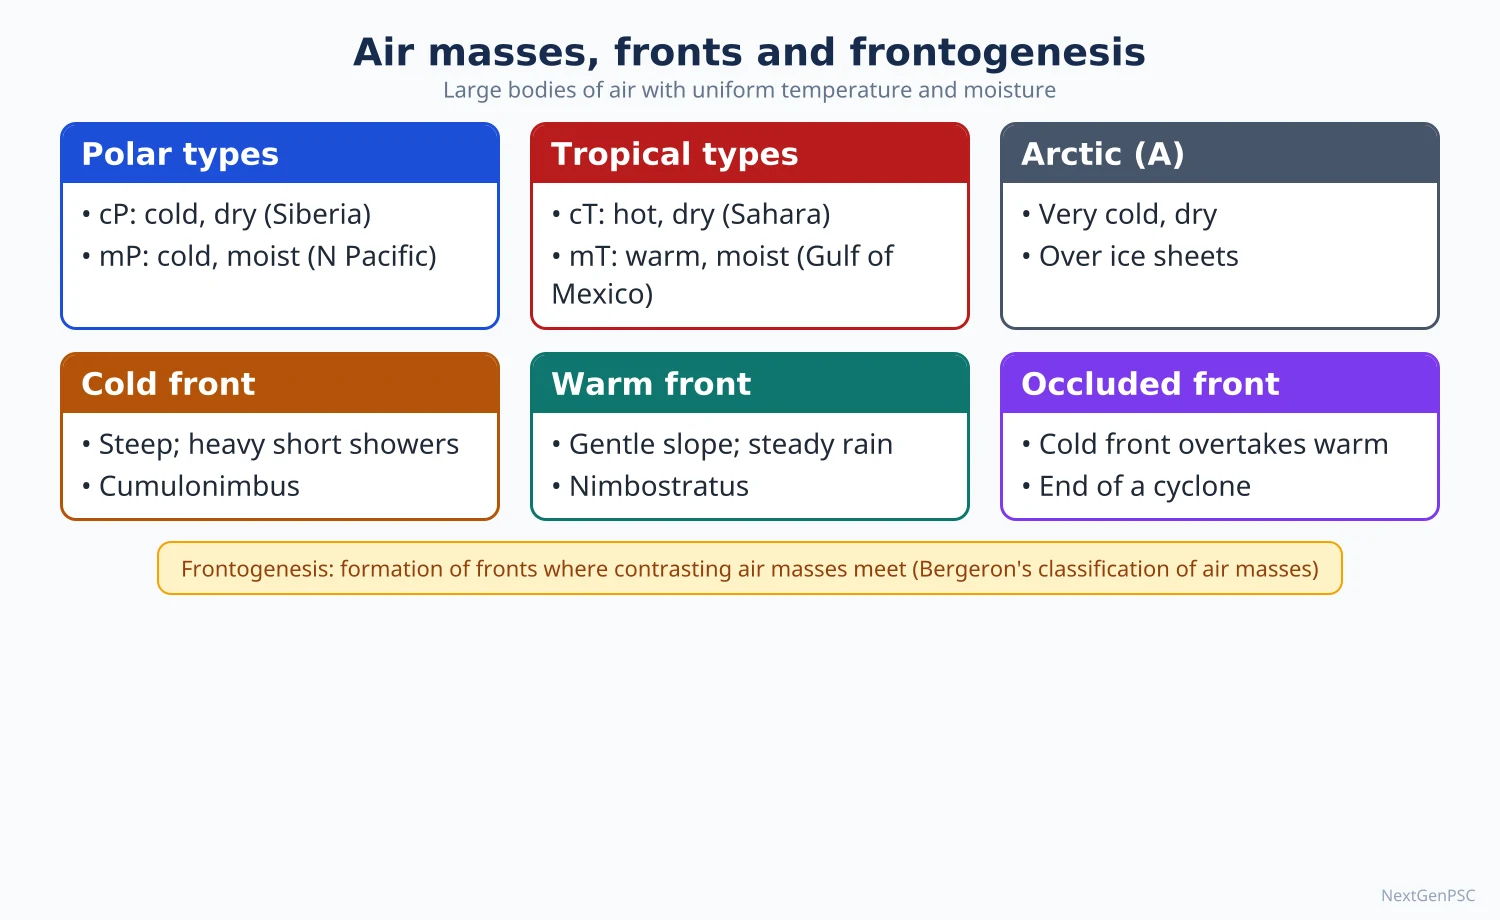
Main types: cA (Arctic, very cold and dry), cP (continental polar, cold and dry, from Siberia and northern Canada), mP (maritime polar, cool and moist, North Atlantic and Pacific), cT (continental tropical, hot and dry, Sahara, Thar, south-west USA), mT (maritime tropical, warm and moist, Gulf of Mexico, tropical oceans), mE (equatorial, hot and very moist).
Thermodynamic suffix: k (colder than the surface it moves over, becoming unstable) and w (warmer than the surface, becoming stable).
Modification: air masses change as they move; cP air crossing the Great Lakes picks up moisture and gives lake-effect snow; mT air moving poleward over cold sea gives advection fog.
Indian examples: in winter cold, dry continental air from Central Asia is largely kept out by the Himalaya, which keeps north India warmer than places at similar latitudes in China; in summer cT air over Rajasthan and Pakistan forms the heat low; in the monsoon mT and mE air from the Indian Ocean brings rain.
4. Fronts
Front: a sloping boundary zone between two air masses of different density (temperature and humidity).
Cold front: cold air advances and undercuts warm air; steep slope (about 1 in 50 to 1 in 100); brings cumulonimbus, heavy short showers, thunder, a sharp temperature drop and a wind shift.
Warm front: warm air advances and rises gently over cold air; gentle slope (about 1 in 100 to 1 in 200); cloud sequence cirrus → cirrostratus → altostratus → nimbostratus, with long, steady rain or drizzle ahead of the front.
Stationary front: neither air mass advances; prolonged cloudy, wet weather.
Occluded front: the faster cold front catches up with the warm front, lifting the warm air off the ground; marks the mature-to-dying stage of a temperate cyclone.
5. Frontogenesis and frontolysis
Frontogenesis: the formation or sharpening of a front through convergence of contrasting air masses, horizontal deformation of the wind field and differential heating; frontolysis is the weakening or dissipation of a front.
Conditions: two air masses with strong temperature contrast, convergent winds bringing them together, and a deformation field that tightens the temperature gradient.
Norwegian (Bergen) school: Vilhelm Bjerknes, his son Jacob Bjerknes, Halvor Solberg and Tor Bergeron developed the polar front theory around 1918–1922, explaining mid-latitude cyclones as waves on the polar front.
Major frontal zones: the polar front over the North Atlantic and North Pacific (between mP or cP and mT air), the Arctic front (between cA and mP air), and the Mediterranean front in winter (between cold European air and warm air from North Africa).
Seasonal behaviour: frontal zones are sharper and shift equatorward in winter, when temperature contrasts are greatest, and weaken and move poleward in summer.
Tropics: true fronts are rare because air masses are similar; the ITCZ is a zone of convergence rather than a front, although older texts called it the Inter-Tropical Front.
Indian relevance: western disturbances that bring winter rain to north-west India and snow to the Himalaya originate as frontal systems over the Mediterranean region and travel east with the westerlies.
6. Diagrams to draw
Stability graph: draw temperature on the x-axis and height on the y-axis; draw the DALR as a steep line, the SALR as a less steep line, and three ELR lines: one steeper than DALR labelled absolute instability, one between them labelled conditional instability, one less steep than SALR labelled absolute stability.
Cold and warm front cross-sections: for the cold front draw a steep wedge of cold air pushing under warm air with a tall cumulonimbus at the boundary; for the warm front draw a gentle slope with warm air gliding up and a sequence of cirrus, altostratus and nimbostratus from far ahead to near the surface front.
Air mass map: on a world outline, mark source regions with labels cP (Siberia, northern Canada), mP (North Atlantic, North Pacific), cT (Sahara, Arabia, Thar), mT (Gulf of Mexico, subtropical oceans), and arrows showing their movement.
7. Using it in the exam
10-mark answer: define atmospheric stability, give the three conditions with the stability graph.
15-mark answer: air masses: definition, source region conditions, Bergeron's classification, modification, one Indian example.
20-mark answer: frontogenesis: conditions, types of fronts with cross-sections, major frontal zones of the world, role in temperate cyclones and western disturbances.
Keywords: environmental lapse rate, adiabatic, latent heat, conditional instability, source region, Bergeron, polar front, deformation, occlusion.
Attribution: Tor Bergeron for the air mass classification (1928) and the Bergen school (the Bjerknes father and son, Solberg, Bergeron) for the polar front theory.
| Condition | Lapse rate relation | Weather |
|---|---|---|
| Absolute stability | ELR less than SALR | Clear skies, stratus, fog, smog |
| Conditional instability | ELR between SALR and DALR | Cumulonimbus once air is lifted to saturation |
| Absolute instability | ELR greater than DALR | Strong convection, dust devils, cumulus |
| Neutral | ELR equal to adiabatic rate | Parcel stays at its level |
| Feature | Cold front | Warm front |
|---|---|---|
| Advancing air | Cold air undercuts warm air | Warm air rises over cold air |
| Slope | Steep (about 1:50 to 1:100) | Gentle (about 1:100 to 1:200) |
| Clouds | Cumulonimbus | Cirrus, cirrostratus, altostratus, nimbostratus |
| Precipitation | Heavy, short, along a narrow belt | Steady, prolonged, over a wide belt ahead |
| After passage | Sharp fall in temperature, clearing skies | Rise in temperature, humid air |
Mains points
- Always support stability answers with the lapse-rate graph; examiners expect the three conditions shown visually.
- Explain why the tropics are conditionally unstable and link it to thunderstorms, Norwesters and cumulonimbus in the ITCZ.
- For air masses, state the conditions of a source region before listing Bergeron's types.
- For frontogenesis, mention convergence and deformation, the major frontal zones and the Bergen school; avoid describing only types of fronts.
- A common mistake is saying the SALR is fixed; it varies with temperature and moisture.
- Bring in Indian relevance: western disturbances, winter inversions and smog, Norwesters.
Did you know?
- The Bergen school borrowed the word 'front' from the battle fronts of the First World War, picturing air masses as armies clashing along a line.
Monsoons and Jet Streams
A monsoon is a seasonal reversal of wind with a wet summer and a dry winter. Its cause was first explained by the thermal theory of Halley (1686), later by the shift of the ITCZ (Flohn), and today by an interplay of the Tibetan plateau, the jet streams, ENSO and the Indian Ocean Dipole. Jet streams are narrow bands of very fast upper-tropospheric winds; the subtropical westerly jet and the tropical easterly jet control the onset, strength and withdrawal of the Indian monsoon.
In simple words
A monsoon is a wind that changes direction with the season: in summer it blows from sea to land bringing rain, in winter from land to sea and stays dry.
It works a bit like a giant sea breeze lasting months, but high-altitude winds called jet streams act like switches that start and stop it.
The monsoon gives India about three-quarters of its yearly rain and decides farm output.
UPSC asks how the monsoon works and how jet streams, El Niño and the Indian Ocean Dipole affect it.
1. What a monsoon is
Definition: the word comes from the Arabic 'mausim', meaning season; a monsoon is a seasonal reversal of the prevailing wind, usually by at least 120°, with a rainy summer and a dry winter.
Monsoon lands: South Asia, South-East Asia, northern Australia, West Africa and, in weaker form, south-west USA and parts of East Africa; the South Asian monsoon is the strongest and most studied.
Indian rainfall share: the south-west monsoon (June–September) brings about 75 per cent of India's annual rainfall; the long period average (LPA) for the season is about 87 cm (IMD, based on 1971–2020).
2. Theories of the monsoon
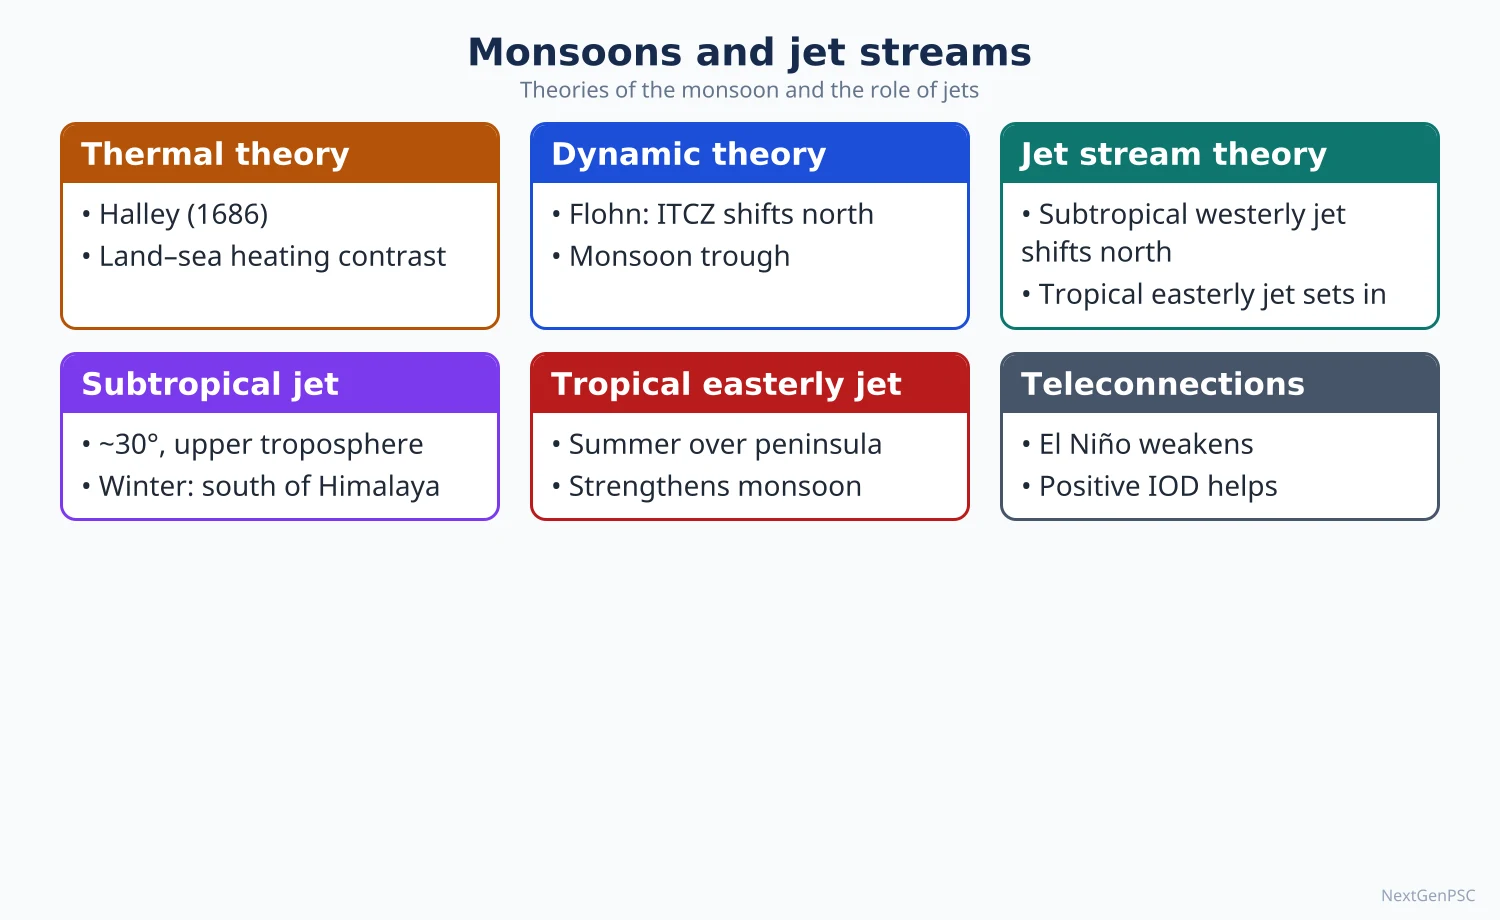
Classical thermal theory (Edmond Halley, 1686): differential heating of land and sea; in summer the land heats faster and forms a low, drawing moist air from the sea; in winter the land is colder and winds reverse; essentially a large-scale land-sea breeze.
Limitations of the thermal theory: it does not explain the sudden burst of the monsoon, breaks in rainfall, year-to-year variation, or why the low over north-west India is not the main rain area.
Dynamic theory (Hermann Flohn, 1951): the monsoon is caused by the seasonal northward shift of the planetary wind and pressure belts; the ITCZ moves over north India in summer, and the south-east trades cross the equator, are deflected to the right and become the south-west monsoon.
Role of the Tibetan plateau: Flohn and later P. Koteswaram stressed that the plateau, heated in summer, acts as an elevated heat source; rising air over it creates an upper-level high, from which air flows outward, forming the tropical easterly jet over peninsular India.
Jet stream theory: the subtropical westerly jet lies south of the Himalaya in winter and blocks the monsoon; its northward shift beyond the Tibetan plateau in early summer and the setting up of the tropical easterly jet are associated with the burst of the monsoon; work by Yin (1949) and Koteswaram (1958) is cited for this.
Modern view: no single theory explains the monsoon; it is a coupled ocean-atmosphere-land system involving the ITCZ, heat sources, jets, ENSO, the Indian Ocean Dipole and intra-seasonal oscillations; the relative weight of each factor is debated.
3. Ocean-atmosphere links
El Niño Southern Oscillation (ENSO): warm El Niño events tend to weaken the Indian monsoon by shifting the rising limb of the Walker circulation east; La Niña tends to strengthen it; the link is strong but not perfect.
Indian Ocean Dipole (IOD): an east-west difference in sea surface temperature across the Indian Ocean, described by Saji and colleagues (1999); a positive IOD (warmer western Indian Ocean) tends to support Indian rainfall, as in 2019, and can offset an El Niño.
Madden-Julian Oscillation (MJO): an eastward-moving pulse of clouds and rain along the tropics with a period of about 30–60 days, identified by Madden and Julian (early 1970s); it influences active and break spells and monsoon onset.
Somali jet (Findlater jet): a strong low-level cross-equatorial flow off East Africa, described by J. Findlater (1969), that carries moisture toward the west coast of India.
Mascarene High: a high-pressure cell in the southern Indian Ocean whose strength affects the push of the cross-equatorial flow.
4. The Indian monsoon: onset, advance, breaks and withdrawal
Onset: the normal date of onset over Kerala is 1 June, declared by IMD on rainfall, wind and outgoing long-wave radiation criteria.
Two branches: the Arabian Sea branch strikes the Western Ghats giving heavy orographic rain on the windward side (Konkan, Malabar) and a rain shadow on the Deccan; the Bay of Bengal branch is deflected by the Arakan hills and the Himalaya, giving very heavy rain in the north-east (Mawsynram and Cherrapunji in Meghalaya) and moving west up the Ganga plain.
Advance: under the normals revised by IMD in 2020, the monsoon covers the whole country by about 8 July (earlier 15 July).
Monsoon trough: a low-pressure trough from north-west India to the head of the Bay of Bengal; its position decides where rain falls.
Breaks: when the trough shifts to the Himalayan foothills, rain stops over most of India but floods occur in the foothills and the north-east; active spells return when it moves south.
Monsoon depressions: lows forming over the head of the Bay of Bengal and moving west-north-west along the trough bring much of the rain to central and north India.
Withdrawal: begins from north-west India around 17 September (revised normal, IMD 2020) and is complete by mid-October; the retreating monsoon and the north-east monsoon give October–December rain to Tamil Nadu and coastal Andhra Pradesh.
Winter (north-east) monsoon: dry offshore winds over most of India; it gives rain to the Coromandel coast after picking up moisture over the Bay of Bengal.
5. Jet streams
Definition: narrow, fast-moving bands of wind in the upper troposphere near the tropopause, thousands of kilometres long, a few hundred kilometres wide, with speeds usually above about 100 km/h and often far higher in winter.
Cause: strong horizontal temperature gradients (thermal wind) and conservation of angular momentum as air moves poleward in the Hadley cell.
Polar front jet: about 40°–60° latitude, at about 9–12 km height, along the polar front; meanders strongly and steers temperate cyclones.
Subtropical westerly jet: about 25°–35° latitude, at about 12–14 km, at the poleward edge of the Hadley cell; steadier than the polar front jet.
Tropical easterly jet: a summer jet over southern Asia and Africa, at about 13–16 km, roughly along 10°–15° N over peninsular India; linked to the upper-level high over Tibet.
Discovery: Japanese meteorologist Wasaburo Ooishi measured very strong upper winds over Japan in the 1920s; aircraft in the Second World War encountered them, and Rossby's group studied them in the 1940s.
Rossby waves: long waves in the westerly jet; their amplification causes blocking highs, cold waves, heat waves and persistent weather.
6. Jet streams and Indian weather
Winter: the subtropical westerly jet divides around the Tibetan plateau; its southern branch flows along the southern slopes of the Himalaya and steers western disturbances into north-west India, giving winter rain useful for the rabi crop.
Summer: the westerly jet weakens and shifts north of the plateau, usually by early June; the tropical easterly jet sets up over the peninsula; this change is closely associated with the burst of the monsoon.
Autumn: the return of the westerly jet south of the Himalaya is associated with the withdrawal of the monsoon.
Aviation and pollution: eastbound flights use the westerly jet to save fuel; jets also carry dust and pollutants across continents.
7. Diagrams to draw
Monsoon onset map: draw India, mark 1 June over Kerala, then isochrones curving north-west: about 5 June over the north-east, about 10–11 June over Kolkata and Mumbai, about 27 June over Delhi, and 8 July over west Rajasthan (IMD normals revised in 2020); add arrows for the Arabian Sea and Bay of Bengal branches.
Jet stream positions: draw a north-south section from the equator to 40° N with the Himalaya and Tibetan plateau; in winter put a westerly jet symbol south of the Himalaya; in summer move it north of the plateau and add an easterly jet at about 15° N at 14 km.
Two-panel monsoon circulation: summer panel with south-west winds from the Indian Ocean crossing the equator and turning right; winter panel with north-east winds from land to sea.
8. Using it in the exam
10-mark answer: define jet streams, give the three main types with height and latitude, and one effect on Indian weather.
15-mark answer: role of the Tibetan plateau and the jet streams in the onset of the Indian monsoon, with the section diagram.
20-mark answer: theories of the monsoon from thermal to modern, ENSO, IOD and MJO, with the onset map and a note that the mechanism is debated.
Keywords: differential heating, ITCZ shift, Tibetan heat source, subtropical westerly jet, tropical easterly jet, Somali jet, ENSO, IOD, MJO, monsoon trough, break.
Attribution: Halley (1686) for the thermal theory, Flohn (1951) for the dynamic theory, Koteswaram (1958) for the tropical easterly jet and Tibetan heating, Saji and others (1999) for the IOD.
| Jet stream | Approximate latitude | Approximate height | Season and role |
|---|---|---|---|
| Polar front jet | 40°–60° | 9–12 km | All year, strongest in winter; steers temperate cyclones |
| Subtropical westerly jet | 25°–35° | 12–14 km | South of the Himalaya in winter, steers western disturbances; shifts north in summer |
| Tropical easterly jet | About 10°–15° N over India | 13–16 km | Summer only; linked with Tibetan heating and the active monsoon |
| Somali (Findlater) jet | Off East Africa, crossing the equator | Low level, about 1–1.5 km | Summer; carries moisture to India's west coast |
| Theory | Proponent | Core idea | Limitation |
|---|---|---|---|
| Thermal | Edmond Halley (1686) | Differential heating of land and sea | Cannot explain burst, breaks, variability |
| Dynamic (ITCZ shift) | Hermann Flohn (1951) | Seasonal shift of planetary belts; trades cross the equator and turn south-west | Does not explain year-to-year variation fully |
| Tibetan plateau and jet streams | Flohn; P. Koteswaram (1958) | Elevated heating, westerly jet shift and tropical easterly jet trigger onset | Relative role of each factor debated |
| Ocean-atmosphere coupling | Walker; Bjerknes; Saji and others (1999) | ENSO and IOD modulate monsoon strength | Relationships are probabilistic, not fixed |
Mains points
- Present monsoon theories chronologically (thermal → dynamic → Tibetan and jet stream → ENSO and IOD) and end with the modern integrated view; say the mechanism is still debated.
- Always draw at least one figure: the onset isochrone map or the jet stream section across the Himalaya and Tibet.
- Use IMD facts with year: onset over Kerala 1 June; whole country by about 8 July and withdrawal from 17 September (revised normals, 2020); LPA about 87 cm (1971–2020).
- Explain breaks and monsoon depressions; they show understanding beyond textbook definitions.
- A common mistake is calling the tropical easterly jet permanent; it exists only in summer.
- Link to agriculture, floods and droughts, and to climate change projections of more extreme rainfall.
Did you know?
- Memory trick for jet heights: 'Polar Plays Low, Subtropical Sits Middle, Tropical Towers High' — about 9–12 km, 12–14 km and 13–16 km.
UPSC Previous Year Questions: Climatology: Atmosphere and Circulation
From 2014 to 2026 UPSC asked 26 question parts worth 395 marks from this chapter, all in Paper I. The most-asked topics are air masses, fronts and thunderstorms (10 parts, 145 marks) and atmospheric circulation and winds (8 parts, 125 marks), followed by the Indian monsoon and the heat budget. Every question below has a model answer written to the UPSC word limit.
In simple words
Read the question and the Approach line, then write your own answer in the time limit: about 7 minutes for 10 marks, 11 for 15 marks and 15 for 20 marks.
Compare your answer with the model: check the definition and its geographer, the processes, named examples, the diagram and the conclusion.
Note what you missed, revise that topic in the notes of this chapter, and redraw the diagram until you can sketch it in under two minutes.
1. Heat Budget, Temperature and Pressure Belts
Example 1 (UPSC 2025, 15 marks): Examine the distribution and balance of energy in the Earth's atmosphere system.
Paper and question: Paper I, Q4(b)
Approach: The question asks for both the vertical balance (the heat budget in units) and the horizontal distribution (latitudinal surplus and deficit with poleward transfer). Organise as definition, 100-unit budget, latitudinal imbalance, transfer mechanisms and the present imbalance due to greenhouse gases, with a heat budget diagram.
The earth-atmosphere system receives short-wave insolation and returns an equal amount of long-wave terrestrial radiation to space, so over the long term it neither warms nor cools. This equilibrium is called the heat budget.
Vertical balance: of 100 units of incoming radiation (NCERT figures), 35 units are reflected to space by clouds, scattering and snow, which is the planetary albedo. Of the remaining 65 units, 14 are absorbed by the atmosphere and 51 heat the surface. The surface returns its 51 units: 17 escape directly to space through the atmospheric window and 34 are absorbed by the atmosphere through long-wave radiation, convection and latent heat of condensation. The atmosphere then radiates its 48 units to space, so 17 + 48 = 65 units leave, balancing the 65 absorbed.
Diagram: Heat budget diagram with the sun, an atmosphere band and the ground; arrows for 35 reflected, 14 absorbed by air, 51 reaching the ground, 17 through the window and 48 radiated by the atmosphere.
Latitudinal distribution: between about 40° N and 40° S incoming radiation exceeds outgoing radiation, giving a surplus; poleward of these latitudes there is a deficit.
Transfer mechanisms: the general circulation (Hadley cell, westerlies and temperate cyclones), latent heat carried by water vapour, and warm ocean currents such as the Gulf Stream and the Kuroshio move surplus energy poleward.
Rising greenhouse gases now trap more outgoing radiation, so the budget carries a small positive imbalance that warms oceans and melts ice. This energy balance drives weather and climate.
Example 2 (UPSC 2023, 15 marks): How does inversion of temperature occur? Explain its significance on local weather with suitable examples.
Paper and question: Paper I, Q4(c)
Approach: Explain how the normal lapse rate is reversed, the conditions and types of inversion (radiation, valley, frontal, subsidence), and then its effects on local weather with Indian and world examples. Draw a temperature-height graph showing the inversion layer.
Normally temperature in the troposphere falls with height at about 6.5°C per km, the normal lapse rate. Inversion of temperature is the reverse condition, in which a layer of warmer air lies above cooler air.
How it occurs: (i) Radiation or ground inversion forms on long, clear, calm winter nights, when the ground loses heat rapidly by terrestrial radiation and cools the air in contact with it. (ii) Valley inversion occurs when cold, dense air drains down hill slopes at night and collects on the valley floor while warmer air stays above. (iii) Frontal inversion forms where warm air overrides a cold air mass at a front. (iv) Subsidence inversion develops when air sinking in subtropical highs warms adiabatically above cooler surface air.
Diagram: Graph with temperature on the x-axis and height on the y-axis; a line sloping normally, then bending to the right near the ground to show the inversion layer, labelled with fog below.
Significance for local weather: inversion makes the lower air stable, so vertical mixing stops. Fog forms in the Indo-Gangetic plain in December–January, disrupting flights and trains; smoke and dust are trapped, worsening the winter smog of Delhi. Frost in valley bottoms damages crops, which is why tea gardens and orchards in the Himalaya and the Nilgiris are planted on slopes.
Subsidence inversions suppress clouds and maintain the dry climate of western coastal deserts such as the Atacama, and they trapped the photochemical smog of Los Angeles.
Thus inversion is a powerful control on visibility, air quality and agriculture.
Example 3 (UPSC 2022, 15 marks): Describe how short term variations in temperature are related to the processes of receiving energy from the sun to the Earth's surface and dissipating it to the atmosphere.
Paper and question: Paper I, Q4(b)
Approach: Short-term variation means the daily (diurnal) and day-to-day changes of temperature; explain them through the balance between incoming insolation and outgoing terrestrial radiation, with the time lag of maximum and minimum, and the factors that modify it. Draw the diurnal curve of insolation, outgoing radiation and temperature.
Air is heated mainly from below. The sun heats the ground by short-wave insolation, and the ground passes heat to the air by long-wave radiation, conduction, convection and latent heat. Short-term temperature variation, chiefly the diurnal cycle, follows the changing balance between energy received and energy lost.
Rise during the day: after sunrise, insolation exceeds outgoing radiation and the surface warms. Insolation peaks at noon, but the surface keeps gaining more than it loses for some hours, so maximum air temperature comes at about 2–3 p.m. This is the lag of temperature.
Fall at night: after sunset there is no insolation, the ground keeps radiating and cools, and the air in contact cools by conduction. Temperature is lowest just before sunrise.
Diagram: Graph of a 24-hour day showing the insolation curve peaking at noon, a flatter outgoing radiation curve, and the air temperature curve peaking at about 2–3 p.m. and lowest near sunrise, with surplus and deficit shaded.
Factors modifying the range: clear, dry air allows strong heating and rapid night cooling, so the Thar and the Sahara have large daily ranges. Clouds and humidity absorb outgoing radiation, so coastal Mumbai or Kochi in the monsoon has a small range. Water heats and cools slowly because of its high specific heat, so oceans and coasts vary little.
Day-to-day variation: advection of air masses, cloud cover and rain also change temperature, as when a western disturbance brings cold days to north India.
Short-term temperature change thus mirrors the surface energy balance.
Example 4 (UPSC 2016, 10 marks): Differentiate between insolation and temperature and explain anomalous temperature.
Paper and question: Paper I, Q1(b)
Approach: Distinguish the two terms point by point (cause and effect, nature, measurement, distribution), then define anomalous temperature with positive and negative examples. Sketch a world map of January isanomals.
Insolation is the incoming short-wave solar radiation received at the earth's surface, while temperature is the degree of hotness of a body or of the air.
Differences: (i) insolation is the cause, temperature the effect; (ii) insolation is measured in watts per square metre, temperature in °C; (iii) insolation depends on sun angle, day length and atmospheric transparency, while temperature also depends on altitude, distance from the sea, ocean currents and winds; (iv) maximum temperature lags behind maximum insolation, both daily (about 2 p.m.) and seasonally (July rather than June over northern continents).
Anomalous temperature: the difference between the mean temperature of a place and the mean temperature of its latitude. Lines joining places of equal anomaly are called isanomals.
Map: World outline showing January isanomals, with a positive anomaly over the Norwegian coast and North Atlantic and a negative anomaly centred over north-east Siberia.
A positive anomaly occurs where a place is warmer than its latitude average, as along the Norwegian coast in January, warmed by the North Atlantic Drift. A negative anomaly occurs where it is colder, as in north-east Siberia around Verkhoyansk in winter.
Anomalies thus reveal the non-latitudinal controls of temperature.
2. Atmospheric Circulation, Planetary and Local Winds
Example 5 (UPSC 2025, 10 marks): Explain the relationship between air masses and local winds.
Paper and question: Paper I, Q1(d)
Approach: Define both terms, then show the relationship in three ways: local winds as the movement of a source-region air mass, as air masses modified by relief, and as winds triggered at air mass boundaries, with one example each. Draw a sketch map of the Mediterranean local winds.
An air mass is a large body of air with nearly uniform temperature and humidity acquired over a source region (Bergeron, 1928). Local winds are small-scale winds confined to a particular region and season. Most local winds are air masses, or parts of them, moving under local pressure and relief conditions.
Local winds as moving air masses: the loo of north-west India is hot, dry continental tropical (cT) air from the Thar; the sirocco is Saharan cT air drawn north by Mediterranean depressions.
Air masses modified by relief: foehn in the Alps and chinook in the Rockies are moist maritime air that loses moisture on the windward side and warms adiabatically while descending. Mistral and bora are cold continental polar (cP) air draining from snowy highlands.
Map: Sketch of the Mediterranean marking the mistral down the Rhone valley, the bora on the Adriatic coast and the sirocco from the Sahara to Sicily and Italy.
Winds at air mass boundaries: Norwesters (Kalbaisakhi) of West Bengal and Assam arise where moist air from the Bay of Bengal lies under dry continental air.
Thus local winds are the regional expression of air mass properties and their modification.
Example 6 (UPSC 2025, 20 marks): Examine the formation of atmospheric tricellular circulation system. Describe with example its importance in making the Earth a living planet.
Paper and question: Paper I, Q3(a)
Approach: First explain how the three cells form (thermal Hadley and polar cells, indirect Ferrel cell, role of the Coriolis force), then examine their importance for life: heat and moisture transfer, rainfall and desert belts, ocean currents and upwelling, with examples. Draw the three-cell diagram.
Unequal heating creates a radiation surplus in the tropics and a deficit near the poles. The atmosphere removes this imbalance through the tricellular circulation, three cells in each hemisphere, built on Hadley's (1735) and Ferrel's (1856) ideas.
Formation: on a rotating earth a single equator-to-pole cell cannot survive, because the Coriolis force deflects poleward-moving air into westerlies. (i) The Hadley cell (0°–30°) is thermally direct: air rises in the ITCZ, flows poleward aloft, sinks near 30° to form the subtropical highs and returns as trade winds. (ii) The polar cell (60°–90°) is also thermal: cold air sinks over the poles and moves out as polar easterlies, rising at the subpolar low. (iii) The Ferrel cell (30°–60°) is indirect, driven by the two cells beside it; surface air moves poleward as westerlies.
Diagram: Globe with 0°, 30°, 60° and 90° marked; on one side three loops per hemisphere labelled Hadley, Ferrel and polar, with pressure belts (L, H, L, H) and surface winds (trades, westerlies, polar easterlies).
Importance for a living planet: the cells carry surplus heat and latent heat poleward, keeping the tropics habitable and high latitudes warmer.
They create rainfall belts. Rising air gives the equatorial rainforests of the Amazon and Congo; sinking air at 30° creates the Sahara, Thar and Atacama; westerlies bring rain to north-west Europe and, through western disturbances, winter rain to north-west India for the rabi crop.
Surface winds drive ocean currents such as the Gulf Stream and cause upwelling off Peru, sustaining rich fisheries. The seasonal shift of the cells gives the Mediterranean climate and the monsoon, which feeds India's farms.
The model is simplified, since Rossby waves and jet streams describe mid-latitude flow better, but it remains the best framework for explaining world climates and the distribution of life.
Example 7 (UPSC 2023, 10 marks): What is "Geostrophic Wind"? Explain the relationship between barometric slope and air circulation.
Paper and question: Paper I, Q1(a)
Approach: Define geostrophic wind as the balance of pressure gradient and Coriolis forces, then explain how the barometric slope controls wind speed and direction, and how friction modifies it near the surface. Draw isobars with the force balance.
A geostrophic wind is a wind that blows parallel to straight isobars in the free atmosphere, where the pressure gradient force is exactly balanced by the Coriolis force and friction is negligible. In the northern hemisphere low pressure lies to its left.
Barometric slope: the rate of change of pressure over horizontal distance, shown by the spacing of isobars.
Relationship with air circulation: (i) air moves from high to low pressure, so the slope sets the basic direction of flow; (ii) the steeper the slope, the closer the isobars and the stronger the wind, as in tropical cyclones; (iii) gentle slopes, as in the doldrums and subtropical highs, give calm or light winds.
Diagram: Straight parallel isobars with the pressure gradient arrow towards low pressure, the Coriolis arrow opposite, and the geostrophic wind parallel to the isobars; below, a surface wind arrow crossing isobars at an angle.
Near the surface, friction slows the wind, weakening the Coriolis force, so air crosses isobars towards low pressure. This produces inflow into cyclones and outflow from anticyclones, in line with Buys Ballot's law.
Thus the barometric slope drives circulation, while rotation and friction shape its direction.
Example 8 (UPSC 2023, 20 marks): What are the causes of origin of local winds? Discuss their significance on prevailing weather and climate in various regions, with suitable examples.
Paper and question: Paper I, Q3(a)
Approach: Classify local winds by cause (thermal, adiabatic or foehn, katabatic, cyclonic drawing of desert air, convective) with examples, then discuss their significance for weather and climate, positive and negative. Draw the foehn effect profile.
Local winds are small-scale winds that blow over a limited area for a short period or season, produced by local differences of temperature, pressure and relief rather than by the planetary pressure belts.
Causes of origin: (i) differential heating of land and water or of slopes and valleys gives land and sea breezes and mountain-valley winds; (ii) adiabatic warming of air descending the leeward side of mountains gives foehn (Alps) and chinook (Rockies); (iii) katabatic drainage of cold, dense air from snow-covered plateaus gives mistral (Rhone valley) and bora (Adriatic); (iv) passing depressions draw desert air outward, as with the sirocco, khamsin and loo; (v) strong convective instability produces squall winds such as the Norwesters.
Diagram: Mountain profile with moist air rising on the windward side (cloud and rain), and dry air descending and warming on the leeward side, labelled foehn or chinook.
Significance on weather and climate: sea breezes moderate the heat of coastal cities like Chennai and Mumbai. The chinook melts snow and lengthens grazing seasons on the Canadian prairies. Kalbaisakhi showers help tea, jute and rice in Assam and West Bengal, and mango showers aid mango ripening in Kerala and coastal Karnataka.
Negative effects are equally important. The loo causes heat stroke across the Ganga plain; foehn and Santa Ana winds raise fire risk in the Alps and California; the mistral damages crops in southern France, where farmers plant windbreaks; the sirocco brings dust and humid heat to Sicily; the Harmattan dries crops in West Africa but relieves humidity.
Katabatic winds also create valley frost, affecting orchards in Himachal Pradesh and Kashmir.
Local winds thus give regional climates their distinct character, and understanding them helps in heat-wave alerts, crop planning and fire management.
Example 9 (UPSC 2019, 20 marks): Discuss in detail the tri-cellular model of atmospheric circulation.
Paper and question: Paper I, Q3(a)
Approach: Discuss the model in detail: its basis (heat imbalance and rotation), each cell with its pressure belts and surface winds, the seasonal shift, and its limitations and later refinements. Draw the three-cell model with pressure belts and winds.
The tri-cellular model describes the general circulation of the atmosphere as three meridional cells in each hemisphere. George Hadley (1735) proposed one thermal cell per hemisphere; William Ferrel (1856) added the mid-latitude cell, giving the three-cell scheme found in standard texts.
Basis: the tropics have a radiation surplus and the poles a deficit, so heat must move poleward. On a rotating earth the Coriolis force deflects poleward-moving air, breaking a single cell into three.
Hadley cell (0°–30°): a thermally direct cell. Air heated at the equator rises in the ITCZ, forming the equatorial low; it flows poleward aloft, cools, converges and sinks near 30°, creating the subtropical highs. Surface air returns as the north-east and south-east trade winds.
Ferrel cell (30°–60°): a thermally indirect cell driven by its neighbours, with surface air moving poleward from the subtropical highs as the westerlies and rising at the subpolar low near 60°.
Polar cell (60°–90°): cold, dense air sinks over the poles to form the polar highs and flows equatorward as polar easterlies; their meeting with the westerlies forms the polar front.
Diagram: Globe divided at 0°, 30°, 60° and 90°; vertical loops for Hadley, Ferrel and polar cells in each hemisphere, with L at 0° and 60°, H at 30° and 90°, surface arrows for trades, westerlies and polar easterlies, and jet symbols near 30° and 60°.
Seasonal shift: the cells move about 5–10° with the overhead sun, explaining Mediterranean winter rain and the Indian monsoon.
Limitations: the Ferrel cell does not exist as a closed loop in reality; Rossby (1940s) and Palmén showed that mid-latitude heat transfer occurs mainly through upper-air Rossby waves, jet streams and travelling cyclones. Land-sea contrast also breaks the belts into cells such as the Siberian High.
Despite simplification, the model explains the broad zones of pressure, winds and rainfall on the earth.
Example 10 (UPSC 2017, 20 marks): Discuss the forces which govern the air movement on the Earth's surface.
Paper and question: Paper I, Q2(a)
Approach: Discuss each force that governs horizontal air movement (pressure gradient, Coriolis, friction, centripetal acceleration, with gravity for vertical motion) and how their combinations produce geostrophic, gradient and surface winds, with examples. Draw the force-balance diagrams.
Wind is air moving horizontally from high to low pressure. Its speed and direction are governed by a set of forces whose balance changes with height and latitude.
Pressure gradient force: the primary driving force, acting from high to low pressure at right angles to the isobars. The closer the isobars, the stronger the wind, as in the core of a tropical cyclone.
Coriolis force: an apparent force due to the earth's rotation, described by Coriolis (1835) and applied to winds by Ferrel. It deflects moving air to the right in the northern hemisphere and to the left in the southern, changes direction but not speed, and is proportional to wind speed and the sine of latitude. It is zero at the equator, which is why tropical cyclones rarely form within about 5° of it.
Friction: the surface slows wind in the lowest 1–2 km. Slower wind means a weaker Coriolis force, so surface winds cross isobars at an angle towards low pressure, more over land than over sea.
Centripetal acceleration: where isobars are curved, a net inward force keeps air moving around lows and highs, producing anticlockwise inflow into cyclones and clockwise outflow from anticyclones in the northern hemisphere.
Gravity holds the atmosphere to the earth and, balanced against the vertical pressure gradient, keeps it in hydrostatic equilibrium, governing vertical motion.
Diagram: Three panels: geostrophic wind parallel to straight isobars with balanced pressure gradient and Coriolis arrows; gradient wind around a low; surface wind crossing isobars with friction arrow.
Resulting winds: the geostrophic wind (pressure gradient = Coriolis) aloft, the gradient wind along curved isobars, and the surface wind modified by friction. Their combination explains the trades, westerlies and cyclonic flows, summarised in Buys Ballot's law (1857).
These forces together turn the simple high-to-low flow into the complex global circulation.
Example 11 (UPSC 2015, 15 marks): Explain the meridional circulation of the atmosphere and its importance in world climate.
Paper and question: Paper I, Q4(c)
Approach: Explain meridional (north-south) circulation as the vertical cells in the meridian plane, contrast it with zonal flow, and then show its importance for heat transfer, pressure and wind belts, rainfall zones and climatic regions. Draw the meridional cross-section of the cells.
Meridional circulation is the north-south movement of air along the meridians, in vertical cells between the equator and the poles. It differs from zonal circulation, the east-west flow of the westerlies and trades, or the Walker cell over the Pacific.
Structure: in each hemisphere the Hadley cell (0°–30°) carries air up at the ITCZ, poleward aloft and down at the subtropical highs; the indirect Ferrel cell (30°–60°) moves surface air poleward as westerlies; the polar cell (60°–90°) returns cold air equatorward.
Diagram: North-south cross-section from pole to pole showing the three loops in each hemisphere, the tropopause higher at the equator, ITCZ, subtropical highs, polar fronts and jet stream positions.
Importance in world climate: (i) it transfers surplus heat and moisture from the tropics towards the poles, preventing the tropics from overheating; (ii) it creates the pressure belts and planetary winds; (iii) it fixes rainfall zones, with equatorial rainforests under rising air and the Sahara, Kalahari and Thar under sinking air near 30°; (iv) frontal cyclones at the polar front give rain to western Europe.
(v) Its seasonal shift produces transitional climates, such as Mediterranean winter rain and the Indian summer monsoon as the ITCZ moves north.
Since mid-latitude transfer occurs largely through Rossby waves and eddies, the meridional model is a simplification, but it remains the basis of climatic classification.
Example 12 (UPSC 2014, 10 marks): Discuss the salient features of 'sirocco' and 'mistral'.
Paper and question: Paper I, Q1(b)
Approach: Describe each wind's origin, direction, season, nature and effects, then compare them briefly (hot and humid versus cold and dry). Draw a sketch map of the Mediterranean showing both winds.
Sirocco and mistral are two contrasting local winds of the Mediterranean region, both linked with depressions moving east along the Mediterranean in winter and spring.
Sirocco: a hot, dry, dusty southerly or south-easterly wind blowing from the Sahara towards North Africa, Sicily and southern Italy, mainly in spring. It is drawn north on the front side of eastward-moving depressions. Crossing the sea, it picks up moisture and becomes hot and humid, oppressive to people and harmful to vines and olives. Red Saharan dust falling with rain gives 'blood rain'. Similar winds are the khamsin in Egypt and the leveche in Spain.
Map: Sketch of the Mediterranean with the mistral arrow down the Rhone valley to the Gulf of Lion and the sirocco arrow from the Sahara to Sicily and southern Italy.
Mistral: a cold, dry, strong northerly wind funnelled down the Rhone valley to the Gulf of Lion in winter and spring, when high pressure lies over central France and a depression over the Gulf of Genoa. It brings clear skies but frost and crop damage, so farmers in Provence plant cypress windbreaks.
Thus the sirocco is a hot, desert-born wind, while the mistral is a cold, katabatic one.
3. Atmospheric Stability, Air Masses and Frontogenesis
Example 13 (UPSC 2026, 20 marks): Describe the general characteristics and structure of a thunderstorm and suggest suitable classification of thunderstorm.
Paper and question: Paper I, Q3(a)
Approach: Describe the general characteristics, then the structure (cloud, updraughts and downdraughts, charge layers) through the three-stage life cycle, and finally suggest a classification by origin and by organisation, with Indian and world examples. Draw a labelled cross-section of a mature thunderstorm cell.
A thunderstorm is a local storm produced by a cumulonimbus cloud and always accompanied by lightning and thunder. It forms when warm, moist air in a conditionally unstable atmosphere is lifted strongly enough to rise freely.
General characteristics: towering cumulonimbus reaching 10–15 km, often with an anvil spreading at the tropopause; heavy but short-lived rain; gusty squalls; hail; a sudden fall in temperature as the cold downdraught spreads out; and a life of usually less than an hour for a single cell.
Structure and life cycle (Byers and Braham, Thunderstorm Project, USA, late 1940s): (i) cumulus stage, with strong updraughts only and growing cloud; (ii) mature stage, when precipitation begins and drags air down, so updraughts and downdraughts coexist, with lightning, hail and gust fronts at their peak; (iii) dissipating stage, when downdraughts dominate, cut off the supply of warm air and the cloud decays. Electrically, the upper cloud is positively charged and the middle part negative, with a small positive area near the base.
Diagram: Cross-section of a mature cumulonimbus with anvil at the tropopause, updraught on one side, downdraught and rain shaft on the other, gust front at the surface, and + and − charge zones marked.
Classification by origin: (a) air-mass or convective thunderstorms from intense surface heating, as in the equatorial afternoon storms of the Congo basin and Kerala's pre-monsoon showers; (b) orographic storms where moist air is forced up slopes, as over the Western Ghats and the Himalayan foothills; (c) frontal storms along advancing cold fronts and squall lines in the mid-latitudes.
Classification by organisation: single-cell, multicell cluster, multicell line or squall line, and supercell storms with a rotating updraught that spawn tornadoes in the US Great Plains. The Norwesters (Kalbaisakhi) of West Bengal and Assam are organised squall-line storms.
A combined classification by origin and organisation therefore best explains thunderstorm behaviour.
Example 14 (UPSC 2026, 15 marks): Examine the importance of axis of dilation of airmasses in frontogenesis and the origin of Temperate cyclones.
Paper and question: Paper I, Q4(b)
Approach: Explain the deformation field and its axis of dilatation, how it gathers isotherms into a front (Petterssen's frontogenesis condition), and then how the polar front formed along it gives rise to temperate cyclones through the wave stages of the Bergen school. Draw the deformation field with isotherms.
Frontogenesis is the formation or sharpening of a front, the boundary between contrasting air masses. A key kinematic cause is the deformation field, analysed by Sverre Petterssen (1936).
Axis of dilatation: where two air streams converge from opposite sides, as in a col between two highs and two lows, the flow has an axis of contraction, along which air comes in, and an axis of dilatation, along which it spreads out.
Role in frontogenesis: isotherms lying at an angle of less than 45° to the axis of dilatation are rotated towards it and crowded together, so the temperature gradient tightens and a front forms along the axis. If the angle exceeds 45°, isotherms are spread apart and frontolysis occurs.
Diagram: Hyperbolic deformation field with inflow arrows along the axis of contraction and outflow along the axis of dilatation; isotherms at first oblique, then packed along the dilatation axis to form a front.
Origin of temperate cyclones: along the polar front, cold polar air and warm tropical air meet. According to the polar front theory of the Bergen school (V. and J. Bjerknes, Solberg, around 1918–1922), a small wave forms on this front, warm air pushes poleward and cold air equatorward, creating warm and cold fronts around a low. The cyclone deepens, the cold front overtakes the warm front to form an occlusion, and the system dies.
Western disturbances reaching India originate in this way over the Mediterranean. The axis of dilatation is therefore the first step in the chain that gives mid-latitude weather.
Example 15 (UPSC 2024, 20 marks): Explain air masses and associated weather dynamics. How do air masses influence the weather conditions of the Northern Hemisphere?
Paper and question: Paper I, Q3(a)
Approach: Define air masses with source-region conditions and Bergeron's classification, explain the weather dynamics they produce (modification, stability, fronts), then show their influence region by region in the Northern Hemisphere: North America, Europe, Asia and India. Draw a world map of air mass source regions.
An air mass is a large body of air, hundreds to thousands of kilometres across, with nearly uniform temperature and humidity at each level. It acquires these properties over an extensive, uniform source region with light winds and subsiding air, such as Siberia, northern Canada, the Sahara or the subtropical oceans.
Classification (Bergeron, 1928): by latitude, Arctic (A), Polar (P), Tropical (T) and Equatorial (E); by surface, continental (c) and maritime (m). Main types are cA, cP, mP, cT and mT.
Weather dynamics: as an air mass moves it is modified. Air colder than the surface below (k) is heated from beneath, becomes unstable and gives cumulus and showers; air warmer than the surface (w) is cooled, becomes stable and gives stratus, fog and drizzle. Where two air masses meet, fronts form and generate temperate cyclones.
Map: World outline marking source regions: cP over Siberia and northern Canada, mP over the North Atlantic and North Pacific, cT over the Sahara, Arabia and Thar, mT over the Gulf of Mexico and subtropical oceans, with arrows of movement.
North America: no east-west mountain barrier lets cP air sweep south to bring cold waves, while mT air from the Gulf of Mexico brings humid heat. Their clash over the Great Plains produces violent thunderstorms and tornadoes.
Europe: mP air from the Atlantic brings mild, cloudy, wet weather to Britain and western Europe; occasional cP outbreaks from Siberia bring severe cold spells.
Asia and India: winter cP air from the Siberian High drives the dry north-east winter monsoon over China and Japan, giving heavy snow to western Japan after crossing the Sea of Japan. The Himalaya largely blocks it from India. In summer, cT air over Rajasthan gives the loo, and moist maritime air brings the south-west monsoon; western disturbances bring winter rain to north-west India.
Air masses therefore set the background weather of each region, and their boundaries set its changes.
Example 16 (UPSC 2022, 15 marks): With suitable examples describe the impacts of movement of airmasses on weather and winds in different parts of the continents.
Paper and question: Paper I, Q3(b)
Approach: Show how air masses change weather as they move (thermal and moisture modification, k and w types, fronts), then describe continent by continent the winds and weather they bring, with named events. Draw a world map of air mass movements.
Air masses carry the temperature and moisture of their source regions into other areas. As they move they are modified, and the contrast between them and the surfaces or air masses they meet controls weather and winds.
North America: outbreaks of Arctic and cP air move south along the Great Plains, bringing cold waves and blizzards, as during the February 2021 Texas freeze. Warm, humid mT air from the Gulf of Mexico moves north in spring, and its clash with cP air produces squall lines and tornadoes in 'Tornado Alley'. Westerly mP air from the Pacific gives rain and snow to the coast of British Columbia and Washington.
Europe: mP air carried by the westerlies brings mild, wet, changeable weather to Britain and Norway. When the Siberian High extends west, cP air brings severe cold, as in the 'Beast from the East' episode of 2018.
Map: World outline with arrows showing cP air moving south in North America and west into Europe, mT air moving north from the Gulf of Mexico, cT air from the Sahara to West Africa, and cP air from Siberia to East Asia.
Africa and Asia: dry cT air moving south from the Sahara is the Harmattan of West Africa; cP air from Siberia drives the cold, dry north-east winter monsoon over China. In India, cT air from the Thar gives the loo, while the moist south-west monsoon air brings rain; mixing of moist Bay air with dry air produces Norwesters.
Thus the movement of air masses explains seasonal winds, cold and heat waves, and storm belts across continents.
Example 17 (UPSC 2021, 10 marks): What are the important factors responsible for airmass modifications?
Paper and question: Paper I, Q1(b)
Approach: Define air mass modification and list the factors (thermal, moisture, dynamic, and time and track), each with an example. Draw a sketch of cP air crossing the Great Lakes to show lake-effect snow.
Air mass modification is the change in the temperature, moisture and stability of an air mass after it leaves its source region and moves over a different surface.
Thermal factors: an air mass colder than the surface it crosses (k type) is heated from below and becomes unstable, with cumulus and showers; one warmer than the surface (w type) is cooled from below, becomes stable and gives fog or stratus. Warm mT air over the cold Grand Banks of Newfoundland gives advection fog.
Moisture factors: evaporation over water adds moisture, as when cP air crosses the Great Lakes or the Sea of Japan and drops heavy snow; precipitation over mountains removes it.
Diagram: Cold, dry cP air crossing a warm lake, picking up heat and moisture, rising and dropping snow on the downwind shore.
Dynamic factors: forced ascent over mountains, convergence and frontal lifting cause cooling and instability; subsidence and divergence warm and dry the air, as in foehn winds.
Time and track: the longer the journey and the greater the surface contrast, the more complete the modification.
Modification therefore explains why the same air mass gives different weather in different places.
Example 18 (UPSC 2021, 15 marks): Indicating the causes of lightning, describe the threats associated with it.
Paper and question: Paper I, Q4(c)
Approach: First indicate the causes of lightning (charge separation in cumulonimbus and discharge), then describe the threats to life, property, infrastructure and ecosystems with Indian data and examples, ending with mitigation. Draw the charge structure of a thundercloud with discharge types.
Lightning is a giant electrical discharge within a cumulonimbus cloud, between clouds, or between a cloud and the ground. It heats the air channel to tens of thousands of degrees, and the explosive expansion of air produces thunder.
Causes: strong updraughts in a thundercloud carry water droplets above the freezing level. In the mixed-phase zone, roughly between −10°C and −20°C, collisions between graupel (soft hail) and ice crystals transfer charge: lighter, positively charged ice crystals are carried to the top, while heavier, negatively charged graupel stays in the middle. This charge separation builds a huge potential difference, and when it overcomes the insulating air a discharge occurs. The exact charging mechanism is still debated.
Diagram: Cumulonimbus with + charge at the anvil top, − charge in the middle, a small + area at the base, induced + charge on the ground, and arrows for intra-cloud, cloud-to-cloud and cloud-to-ground strokes.
Threats: (i) loss of life: NCRB's Accidental Deaths and Suicides in India reports lightning as the largest killer among natural causes, roughly 2,500–3,000 deaths a year recently, mostly farmers and labourers in open fields in Odisha, Jharkhand, Bihar, West Bengal and Madhya Pradesh; (ii) livestock deaths; (iii) damage to power lines, transformers, telecom and electronics; (iv) hazards to aviation; (v) forest fires, a major cause of wildfires in the boreal forests of Canada and Siberia.
Mitigation: early warning through IITM Pune's Damini app, lightning arresters on buildings, and safe behaviour such as avoiding open fields and tall trees.
Since some studies suggest warming may increase lightning, local warning systems are becoming essential.
Example 19 (UPSC 2020, 15 marks): Explain the characteristic features of Frontogenesis and Frontolysis.
Paper and question: Paper I, Q3(c)
Approach: Define both processes, then explain the characteristic features of frontogenesis (conditions, mechanisms, properties of fronts, regions and seasons) and of frontolysis (causes and signs), with examples. Draw a cross-section of a front and a sketch of the world's frontal zones.
A front is a sloping boundary zone between two air masses of different temperature and density. Frontogenesis is the formation or intensification of a front, and frontolysis is its weakening and dissipation; the concepts come from the Bergen school (Bjerknes, Bergeron and others).
Features of frontogenesis: (i) it requires two air masses with a strong temperature contrast, such as cP or mP and mT air; (ii) winds must bring them together by convergence, or a deformation field must crowd the isotherms along its axis of dilatation (Petterssen); (iii) the front that forms has a sharp temperature gradient, a pressure trough, a wind shift, and a slope of about 1:50 to 1:100 for cold fronts and 1:100 to 1:200 for warm fronts; (iv) it is most active in winter, when contrasts are greatest, along the polar front of the North Atlantic and North Pacific, the Arctic front and the Mediterranean front.
Diagram: Cross-section of cold and warm fronts showing wedges of cold air, warm air rising, cumulonimbus at the cold front and nimbostratus ahead of the warm front.
Features of frontolysis: (i) divergence or a deformation field that spreads isotherms apart; (ii) the two air masses mix or acquire similar properties as they cross a uniform surface; (iii) occlusion, when the cold front overtakes the warm front and lifts the warm sector off the ground; (iv) it is common in summer and in the tropics, where air masses are similar.
Thus frontogenesis builds the stormy belts of the mid-latitudes, while frontolysis ends temperate cyclones.
Example 20 (UPSC 2017, 10 marks): Discuss the impacts of ocean currents on air mass behaviour.
Paper and question: Paper I, Q1(c)
Approach: Explain that ocean currents modify the temperature, moisture and stability of air masses above them; contrast warm and cold currents with named examples and add the meeting zones. Draw a world sketch map of the main warm and cold currents with the air mass effect.
Air masses take on the properties of the surfaces they cross. Ocean currents, by changing sea surface temperature, modify the temperature, moisture and stability of the air above them.
Warm currents: they heat and moisten the lower air, making it unstable and rain-bearing. The Gulf Stream warms cold cP air flowing off North America, causing rapid cyclone development along the east coast; the North Atlantic Drift keeps mP air over north-west Europe mild in winter; the Kuroshio gives humid conditions to Japan.
Cold currents: they cool the lower air from below, producing an inversion and stable air that does not rise. Fog forms but rain is scarce, contributing to coastal deserts: the Atacama with the Humboldt (Peru) current, the Namib with the Benguela current, and the summer fogs of San Francisco with the California current.
Map: World outline marking the Gulf Stream, Kuroshio, Humboldt, Benguela, California and Labrador currents, with the Atacama and Namib deserts and the Grand Banks fog zone.
Where warm and cold currents meet, as the Gulf Stream and Labrador current off Newfoundland, dense advection fog forms.
Ocean currents thus reshape air mass behaviour.
Example 21 (UPSC 2015, 10 marks): Discuss as to how frontogenesis contributes to weather instability.
Paper and question: Paper I, Q1(b)
Approach: Define frontogenesis and show how the fronts it creates lift air and release instability, with cold and warm front weather and frontal cyclones as examples. Draw a cold front cross-section.
Frontogenesis is the formation or sharpening of a front where contrasting air masses converge, as along the polar front between cold polar and warm tropical air.
How it causes instability: the denser cold air acts as a wedge and forces the lighter warm air to rise. Rising air cools adiabatically, reaches saturation and releases latent heat, which makes conditionally unstable air buoyant.
Cold front: its steep slope causes rapid uplift, towering cumulonimbus, thunderstorms, squalls, hail, and a sharp fall in temperature with a wind shift.
Diagram: Steep wedge of cold air undercutting warm air, with a cumulonimbus at the boundary and heavy rain just behind the front.
Warm front: gentle uplift gives a sequence of cirrus, altostratus and nimbostratus, with prolonged rain or drizzle.
Frontal cyclones: waves on the front grow into temperate cyclones that bring changeable weather to western Europe and North America; western disturbances bring winter rain and snow to north-west India.
Frontogenesis is thus the main source of weather instability in the mid-latitudes.
Example 22 (UPSC 2014, 15 marks): Describe the origin and development of thunderstorms with examples.
Paper and question: Paper I, Q2(b)
Approach: Explain the conditions for origin (moisture, instability, lifting trigger), the stages of development (cumulus, mature, dissipating) and types with Indian and world examples. Draw the three stages of a thunderstorm cell.
A thunderstorm is a local storm from a cumulonimbus cloud with lightning, thunder, heavy rain, gusty winds and often hail.
Origin: three conditions are needed: (i) abundant moisture in the lower air; (ii) conditional instability, with the environmental lapse rate between the dry and saturated adiabatic rates, so that saturated air keeps rising; (iii) a lifting trigger, such as intense surface heating, forced ascent over mountains, a cold front, or convergence.
Development (Byers and Braham's three-stage model): (i) cumulus stage, with updraughts only, as rising air condenses and latent heat drives the cloud upward; (ii) mature stage, when rain and hail drag air down, so updraughts and downdraughts coexist, giving lightning, squalls and the heaviest rain, while the top spreads as an anvil at the tropopause; (iii) dissipating stage, when downdraughts dominate, cut off warm, moist inflow and the cloud dies within about an hour.
Diagram: Three cloud sketches side by side: a growing cumulus with upward arrows, a mature cumulonimbus with anvil, up and down arrows and rain, and a decaying cloud with only downward arrows.
Examples: afternoon convective storms of the Amazon and Congo basins; Norwesters (Kalbaisakhi) of West Bengal, Odisha and Assam in April–May; pre-monsoon storms in Kerala; frontal squall lines and supercells with tornadoes in the US Great Plains.
Thunderstorms thus redistribute heat and moisture vertically, though their hazards demand reliable nowcasting.
4. Monsoons and Jet Streams
Example 23 (UPSC 2026, 10 marks): Define 'pseudo monsoon' and explain its spatial distribution.
Paper and question: Paper I, Q1(b)
Approach: Define a true monsoon with Ramage's criteria, then define pseudo monsoon as a monsoon-like seasonal wind shift that fails these criteria, and explain its spatial distribution with commonly cited regions, noting that the boundary is debated. Draw a world sketch map contrasting true and pseudo monsoon areas.
A true monsoon is a large-scale seasonal reversal of winds. C.S. Ramage (Monsoon Meteorology, 1971) defined monsoon regions as those where the prevailing wind shifts by at least 120° between January and July and the prevailing winds are persistent and fairly strong.
A pseudo monsoon is a monsoon-like seasonal change of wind and rainfall that does not meet these criteria. The wind shift is smaller or less regular, the circulation is shallow and regional, and it is driven by local thermal lows rather than by the migration of the ITCZ across a large continent.
Spatial distribution: commonly cited examples are: (i) the south-eastern USA around the Gulf of Mexico; (ii) the south-western USA and north-western Mexico, whose summer rains are called the North American monsoon, although some meteorologists class them as a weak true monsoon; (iii) the Iberian Peninsula, where a summer thermal low draws winds inward.
Map: World outline shading the true monsoon lands (South and South-East Asia, West Africa, northern Australia) and marking the pseudo monsoon areas listed above.
The classification is debated, but the concept underlines the unique scale of the South Asian monsoon.
Example 24 (UPSC 2020, 20 marks): Explain how various factors influence the origin and development of the Indian monsoon system.
Paper and question: Paper I, Q3(a)
Approach: Group the factors into thermal, dynamic and upper-air, ocean-atmosphere, and relief factors, explaining how each influences the onset, strength and distribution of the Indian monsoon, and conclude that the monsoon is a coupled system. Draw a map of India with the monsoon branches, Somali jet and Tibetan high.
The Indian monsoon is a seasonal reversal of winds that brings about three-fourths of India's annual rainfall in June–September. No single factor explains it; it results from interacting thermal, dynamic, oceanic and relief factors.
Thermal factors: differential heating of land and sea (Halley, 1686) creates a summer low over north-west India and Pakistan, which draws moist air from the Indian Ocean.
Dynamic factors: the northward shift of the ITCZ to about 20°–25° N in July, emphasised by Flohn (1951), pulls the south-east trades across the equator, where the Coriolis force turns them into the south-west monsoon. The low-level Somali or Findlater jet (1969) carries this moisture along the East African coast, while the Mascarene High in the southern Indian Ocean pushes the flow north.
Upper-air factors: the Tibetan plateau, heated in summer, acts as an elevated heat source with an upper-level high above it (Koteswaram, 1958). The subtropical westerly jet shifts north of the plateau and the tropical easterly jet sets up over the peninsula, associated with the sudden burst of the monsoon.
Map: Outline of India and the Indian Ocean showing the Mascarene High, cross-equatorial Somali jet, Arabian Sea and Bay of Bengal branches, the monsoon trough and the Tibetan high with the easterly jet.
Ocean-atmosphere links: El Niño tends to weaken the monsoon and La Niña to strengthen it; a positive Indian Ocean Dipole (Saji and others, 1999) supports good rainfall. The Madden-Julian Oscillation controls active and break spells. Eurasian and Himalayan snow cover, first linked to monsoon rainfall by Blanford in the 1880s, may delay heating.
Relief: the Western Ghats cause heavy orographic rain on the windward side and a rain shadow on the Deccan; the Garo-Khasi hills give Mawsynram and Cherrapunji their extreme rainfall.
The monsoon is therefore a coupled ocean-atmosphere-land system, and its variability reflects shifting balances among these factors.
Example 25 (UPSC 2018, 20 marks): Explain the origin, progress and retreat of the Indian monsoon and discuss its impact on the Indian economy.
Paper and question: Paper I, Q3(a)
Approach: Explain the origin briefly (thermal, dynamic and jet stream views), then the progress (onset, branches, advance, breaks) and retreat with IMD normal dates, and finally discuss the impact on agriculture, water, energy, prices and the wider economy. Draw a map of India with onset and withdrawal isochrones.
Origin: the classical thermal theory (Halley, 1686) explains the monsoon by differential heating of land and sea. Flohn (1951) linked it to the seasonal northward shift of the ITCZ and planetary winds, while later work stressed the heating of the Tibetan plateau and the shift of jet streams (Koteswaram, 1958). Today it is seen as a coupled ocean-atmosphere system influenced by ENSO and the Indian Ocean Dipole.
Progress: the monsoon sets in over Kerala around 1 June (IMD normal). The Arabian Sea branch strikes the Western Ghats, giving heavy rain to the Konkan and Malabar coasts; the Bay of Bengal branch reaches the north-east and is deflected west along the Himalaya. Under IMD's revised normals (2020), the monsoon covers the whole country by about 8 July. Rain depends on the monsoon trough and depressions from the Bay; when the trough shifts to the Himalayan foothills, a break occurs.
Retreat: withdrawal begins from north-west India around 17 September and is complete by mid-October. The retreating monsoon gives the hot, humid 'October heat' and, with the north-east monsoon, rain to coastal Tamil Nadu and Andhra Pradesh.
Map: Outline of India with onset isochrones from 1 June (Kerala) to 8 July (west Rajasthan), arrows for the two branches, and withdrawal lines from 17 September in the north-west to mid-October in the south.
Impact on the economy: about half of India's net sown area is rainfed, so kharif crops such as rice, pulses, cotton and soybean depend on the monsoon. It recharges groundwater and reservoirs used for rabi irrigation, hydropower and drinking water. A good monsoon raises rural incomes and demand for consumer goods and tractors; a poor one, as in the drought years 2002, 2009 and 2015, raises food inflation and distress.
Though the economy's dependence has fallen with irrigation and services growth, the monsoon remains central to food security and rural welfare.
Example 26 (UPSC 2014, 20 marks): Discuss the nature and origin of Indian monsoon and recent techniques of its prediction.
Paper and question: Paper I, Q3(a)
Approach: Describe the nature of the Indian monsoon (seasonality, reversal, variability), explain its origin through the main theories with their critique, and then the techniques of prediction from statistical to dynamical models and observation systems. Draw a two-panel diagram of summer and winter monsoon winds.
Nature: the Indian monsoon is a seasonal reversal of winds, south-westerly in summer and north-easterly in winter. The south-west monsoon (June–September) gives about three-fourths of annual rainfall. It is marked by a sudden burst, active and break spells, uneven spatial distribution from Mawsynram to the Thar, and large year-to-year variability.
Origin: (i) the thermal theory of Halley (1686) explains it by differential heating of land and sea, but not the burst or breaks; (ii) Flohn's dynamic theory (1951) treats it as the seasonal northward shift of the ITCZ, with the south-east trades crossing the equator and turning south-west; (iii) the role of the Tibetan plateau as a heat source and of the jet streams, the westerly jet moving north and the tropical easterly jet forming (Koteswaram, 1958); (iv) the modern view adds ENSO, the Indian Ocean Dipole and the Madden-Julian Oscillation, treating the monsoon as a coupled system.
Diagram: Two panels of South Asia: in summer, arrows from the southern Indian Ocean crossing the equator and turning south-west towards India with a low over north-west India; in winter, arrows from a high over Central Asia blowing north-east to south-west towards the sea.
Prediction techniques: IMD's forecasts began with Blanford in the 1880s, and Gilbert Walker's correlations led to the discovery of the Southern Oscillation. In 1988 IMD adopted Gowariker's 16-parameter power regression model, replaced in 2007 by the Statistical Ensemble Forecasting System.
Under the Monsoon Mission of the Ministry of Earth Sciences (2012), dynamical coupled ocean-atmosphere models were developed; since 2021 IMD issues its two-stage long-range forecast with a multi-model ensemble approach, along with monthly and extended-range forecasts of active and break spells.
Observations come from INSAT-3D and 3DR satellites, Doppler weather radars, ocean buoys and Argo floats, while machine learning is being tested.
Forecast skill has improved, but regional and extreme rainfall remain hard to predict, so research continues.
Mains points
- Process questions dominate: how inversion, frontogenesis, thunderstorms and lightning form; examiners reward step-by-step mechanisms with the right physics (lapse rates, adiabatic change, latent heat, Coriolis force).
- Attribution earns marks: Hadley (1735) and Ferrel (1856) for the cells, Bergeron (1928) for air masses, the Bergen school for the polar front, Petterssen for deformation, Flohn (1951) and Koteswaram (1958) for the monsoon.
- Every answer should carry a diagram: the heat budget, the three-cell model, the stability graph, front cross-sections, the thunderstorm cell, or a monsoon onset map.
- Link theory to India: winter fog and smog for inversion, Norwesters and lightning deaths for thunderstorms, western disturbances for fronts, and the monsoon for agriculture and the economy.
- Show awareness of debate and limits: the Ferrel cell as a simplification (Rossby), the monsoon as a coupled system with ENSO, IOD and MJO, and the debated charging mechanism of lightning.
Did you know?
- The air mass classification and the idea of fronts both carry a Scandinavian stamp: Tor Bergeron, who classified air masses in 1928, was a member of the Bergen school that gave the world the words 'front' and 'polar front', borrowed from the battle fronts of the First World War.
Geography Optional: All chapters
- Exam Pattern, Syllabus and Strategy
- The Earth's Interior and Tectonics
- Geomorphic Processes and Landscape Development
- Climatology: Atmosphere and Circulation
- Climatology: Weather Systems, Climates and Climate Change
- Oceanography
- Biogeography
- Environmental Geography
- Perspectives in Human Geography
- Economic Geography
- Population Geography
- Settlement Geography
- Regional Planning
- Models, Theories and Laws in Human Geography
- India: Physical Setting I
- India: Physical Setting II
- Resources of India
- Agriculture in India
- Industry in India
- Transport, Communication and Trade
- Cultural Setting and Population of India
- Settlements in India
- Regional Development and Planning in India
- Political Aspects
- Contemporary Issues
- Places for the Map Question