
Geography Optional · UPSC Notes
Settlements in India — UPSC Geography Optional Notes
Free, exam-focused notes for UPSC Prelims and Mains, with Prelims tips and Mains points for every topic. 5 topics.
Open in the interactive reader: bookmarks, progress tracking and read-aloud.
Rural Settlements of India
India is still a land of villages: Census 2011 counted 5,97,608 inhabited villages holding 68.8% of the population. Rural settlements are studied by their type (compact, semi-compact, hamleted, dispersed), their pattern (the shape of the village plan, such as linear or circular) and their morphology (internal layout of houses, lanes, caste quarters and fields). Relief, water, defence, caste and history explain why the Ganga plain has large compact villages while the hills, deserts and Kerala have hamlets and dispersed homesteads.
In simple words
A rural settlement is a village or hamlet where most people live by farming, herding, fishing or forest work.
Think of houses like people at a gathering: some crowd together in one big group, some form small circles, and some stand alone far apart.
Where water, flat land and safety are plentiful, houses huddle into big villages; on slopes, in deserts and in forests they spread out.
UPSC asks you to explain these types and patterns with Indian regional examples and a neat sketch.
1. Concepts and definitions
Settlement: any organised cluster of human habitation, from a single farmstead to a city, together with the land and routes that serve it; settlement geography studies its site, situation, form, function and growth.
Rural settlement: one whose people depend mainly on primary activities (agriculture, animal rearing, fishing, forestry); in India the Census treats every area that is not a statutory or census town as rural.
Revenue village: the basic administrative and land-record unit with defined boundaries; the Census village is normally the revenue village, so one Census village may contain several separate hamlets.
Hamlet: a small, physically separate cluster of houses belonging to a larger village; local names include panna, para, palli, nagla, dhani, majra, tola and wadi.
Site: the actual ground a village occupies (a natural levee, a terrace, a dune, a hill spur); situation: its position relative to surrounding resources, routes and other settlements.
Type refers to the degree of clustering or dispersion of houses; pattern refers to the geometric shape of the settlement plan; morphology refers to the internal arrangement of houses, streets, open spaces and land use.
Index of dispersion: Albert Demangeon measured dispersion as K = (E × N) ÷ T, where E is the population outside the main nucleus, N the number of separate hamlets and T the total population; a higher K means a more dispersed settlement.
Data: Census 2011 recorded 5,97,608 inhabited villages and a rural population of 83.37 crore, or 68.8% of India's 121.09 crore people (Census of India, 2011).
2. Types of rural settlements in India
Compact or clustered (nucleated): houses packed closely around a core with narrow lanes, and fields lying outside the built-up area; typical of the fertile Ganga–Yamuna doab, Punjab and Haryana plains, the Malwa plateau, and the black soil Deccan of Maharashtra and Karnataka.
Why compact: continuous fertile land, assured water from wells and canals, the need for joint defence in the past (raids in the Punjab and the Doab), and strong social cohesion within caste and kin groups.
Desert compact villages: in western Rajasthan houses cluster around the only reliable source of water such as a tank, a well or a johad, so scarcity rather than plenty produces clustering.
Semi-compact or semi-clustered: a nucleated core with some houses spreading outwards; arises when an originally compact village grows or when lower castes and labourers are made to settle on the edge; common in Gujarat plains, parts of Rajasthan and the Deccan.
Hamleted (fragmented): the village is split into several physically separate hamlets sharing one name; social segregation by caste and the need to stay near scattered fields are common reasons; widespread in the middle and lower Ganga plain (eastern Uttar Pradesh, Bihar), the Chhattisgarh basin and the lower valleys of the Himalaya.
Dispersed (isolated): single homesteads or groups of two or three houses scattered over fields, forests or slopes; found in the hills of Meghalaya, Uttarakhand and Himachal Pradesh, the tribal tracts of Jharkhand, Odisha and Madhya Pradesh, the Thar desert dhanis, and the coastal plains of Kerala.
Kerala exception: Kerala has a near continuous linear spread of homesteads along roads, canals and the coast, each house set in its own coconut and spice garden, which makes the village and town boundary hard to draw (the rural–urban continuum).
3. Factors that shape rural settlements
Relief and slope: plains favour large compact villages; rugged hills allow only small patches of cultivable land, so houses scatter; villages in the Himalaya choose sunny south-facing slopes and river terraces.
Water supply: in dry areas villages cluster at wells, tanks and springs; in wet deltas and floodplains they choose higher ground such as natural levees and old river ridges to escape floods (Bihar, Assam, coastal Odisha).
Soil and land use: fertile alluvium supports high density and big villages; poor rocky soils support only small, scattered settlements.
Defence and security: hilltop and fortified villages in Rajasthan, Bundelkhand and central India, and compact villages of the old Punjab, reflect past insecurity.
Social structure: caste segregation produces separate hamlets for Dalit and artisan groups; tribal clan organisation and shifting cultivation favour small dispersed hamlets.
History and policy: canal colonies of west Punjab (now in Pakistan) and the post-independence resettlement colonies, refugee villages, and planned project villages have regular grid layouts.
Transport: new roads and railways attract houses to form linear villages; the highway-side ribbon of shops and dhabas is a recent example.
4. Patterns of rural settlements
Linear or ribbon: houses along a road, river, canal, levee or coast; examples are the Konkan and Kerala coasts, villages along the Ganga levees and on Himalayan valley roads.
Rectangular or grid: lanes cross at right angles; common in the Punjab, Haryana and the upper Ganga plain where land is level and holdings are rectangular, and in the canal colony villages.
Circular or semi-circular: houses ring a tank, a lake or a central open space; seen around tanks in Tamil Nadu and Karnataka and around lakes in the Ganga plain.
Star or radial: lanes radiate from a central point where several roads meet; seen in large villages of the Ganga plain.
T-shaped, Y-shaped and cross-shaped: develop where two or three roads meet; houses extend along each road.
Double village: two settlements on opposite banks of a river linked by a ferry or bridge.
Hollow rectangle or square with central open space: houses face inward around a courtyard or a temple; noted in Rajasthan and Gujarat.
Terraced or step pattern: houses arranged along contour terraces in the Himalaya and the hills of the Northeast.
Fan-shaped: on alluvial fans and deltas, such as the bhabar edge and the deltas of the east coast.
5. Morphology of the Indian village
Core: the dominant landowning castes, the temple or mosque, the well and the village square (chaupal) usually occupy the oldest and highest part of the site.
Periphery: service and artisan castes live in the middle ring, while Dalit hamlets often lie on the edge or across the fields; geographers have documented this caste-based residential segregation since the 1950s.
Abadi and fields: the residential area (abadi or gaothan) is separate from cultivated land, common grazing land, village ponds and cremation ground.
House types: mud and thatch in the Ganga plain, stone and slate in the Himalaya, bamboo houses on stilts in Assam and the Northeast, flat-roofed stone and mud houses in Rajasthan, and sloping tiled roofs on the Kerala and Konkan coasts reflecting rainfall.
Change: pucca houses, roads under the Pradhan Mantri Gram Sadak Yojana (2000), houses under PMAY-Gramin (2016) and tap water under the Jal Jeevan Mission (2019) are spreading the built-up area along roads.
SVAMITVA scheme (24 April 2020): drone survey of village abadi land to give owners legal property cards, which helps credit and reduces disputes (Ministry of Panchayati Raj).
Shyama Prasad Mukherji Rurban Mission (2016): develops clusters of villages with urban amenities while keeping rural character, aiming at 300 clusters.
6. Theory and debates
European roots: Jean Brunhes and Albert Demangeon in France classified rural settlements into nucleated and dispersed types and linked them to physical and social conditions.
Indian studies: O.H.K. Spate in India and Pakistan (1954) and Enayat Ahmad in a study of rural settlement types in Uttar Pradesh (1952) explained the east–west change in settlement type across the Ganga plain; R.L. Singh and the Varanasi school extended this work.
Physical versus social explanation (debated): some scholars stress water and relief, while others argue that caste, land tenure and history matter more, since villages under the same physical conditions differ sharply.
Central place view: Christaller's hexagonal model has been tested on Indian market centres (haats and periodic markets); the hierarchy exists but is distorted by rivers, roads and administrative boundaries.
Change debate: recent studies note the spread of census towns and the blurring of village–town boundaries, suggesting that the rural–urban divide is becoming a continuum.
7. Maps and diagrams to draw
Map of India: shade compact settlements over the Punjab–Haryana–western Uttar Pradesh plains and the Deccan, hamleted over eastern Uttar Pradesh, Bihar and the Chhattisgarh basin, dispersed over the Himalaya, the Northeast, the tribal plateau and western Rajasthan, and a linear band along the Kerala and Konkan coasts; add a key.
Pattern sketches: draw six small boxes showing linear (houses along a line), rectangular (grid lanes), circular (ring around a tank), star (lanes radiating from a centre), T-shaped and double village (two clusters across a river); label each with one Indian region.
Village morphology sketch: draw concentric rings: temple, well and dominant caste houses at the centre, artisan castes in the middle, Dalit hamlet at the edge, fields and grazing land outside.
8. Using it in the exam
10 marks (150 words): define type and pattern, list four types with one region each, add the pattern sketch box.
15 marks (200 words): add factors (physical and socio-cultural) and the India map of settlement types.
20 marks (250 words): types, patterns, morphology, factors, recent change (SVAMITVA, Rurban Mission, rural–urban continuum), with a map and a sketch.
Keywords: nucleated, hamleted, dispersed, site and situation, caste segregation, index of dispersion, rural–urban continuum.
Quotable line: Demangeon's view, paraphrased, is that the form of rural settlement reflects the agrarian system and social organisation as much as the physical setting.
| Type | Main regions | Main causes |
|---|---|---|
| Compact (clustered) | Punjab, Haryana, western Uttar Pradesh, Malwa, Deccan black soil areas, water points of western Rajasthan | Fertile level land, assured water, past need for defence, social cohesion; water scarcity in the desert |
| Semi-compact | Gujarat plains, parts of Rajasthan and the Deccan | Growth of a compact core; lower castes settled at the edge |
| Hamleted | Eastern Uttar Pradesh, Bihar, Chhattisgarh basin, lower Himalayan valleys, West Bengal | Caste segregation, flood-free patches, scattered holdings |
| Dispersed | Himalaya, Northeast hills, Jharkhand–Odisha tribal plateau, Thar dhanis, Kerala coast | Rugged relief, small cultivable patches, tribal clan structure, homestead farming |
| Pattern | Controlling feature | Example region |
|---|---|---|
| Linear | Road, river levee, canal, coast | Kerala and Konkan coasts, Ganga levees, Himalayan valley roads |
| Rectangular (grid) | Level land, rectangular fields | Punjab, Haryana, upper Ganga plain |
| Circular | Tank, lake or central open space | Tank villages of Tamil Nadu and Karnataka |
| Star (radial) | Meeting point of several roads | Large villages of the Ganga plain |
| Terraced | Contour terraces on slopes | Himalaya, Northeast hills |
| Double village | River with a crossing point | Villages facing each other across rivers of the Ganga plain |
Mains points
- Typical questions: types and patterns of rural settlements with examples; factors of dispersion in hilly and tribal areas; why hamleted settlements dominate the middle Ganga plain.
- Always separate type (degree of clustering) from pattern (shape); mixing them is the commonest mistake.
- Give a region for every type and a sketch for every pattern; a settlement-type map of India earns marks quickly.
- Bring in socio-cultural causes such as caste segregation and tribal clan organisation, not only relief and water.
- Add recent change: census towns, rural–urban continuum in Kerala, SVAMITVA property cards (2020) and the Rurban Mission (2016).
- Quote Census 2011 data (5,97,608 inhabited villages; 68.8% rural) with the year.
Did you know?
- Memory trick for the four types, from crowded to lonely: C-S-H-D, Compact, Semi-compact, Hamleted, Dispersed, or 'Crowd, Spread, Hamlet, Desert dhani'.
- In the Thar, a single family's homestead in the dunes is called a dhani, one of the clearest examples of a dispersed settlement in India.
Urban Development, Morphology and Functional Classification of Indian Cities
India's urban population was 37.7 crore (31.1%) in Census 2011, up from 17.3% in 1951, living in about 7,900 towns of which 4,041 were statutory towns and the rest census towns. Indian urbanisation has passed through Harappan, early historic, medieval, colonial and post-independence phases, and each phase left its mark on city morphology: an old walled core, colonial civil lines and cantonments, planned sectors and modern peripheries. Cities are classified by function (administrative, industrial, transport, commercial, mining, garrison, educational, religious, tourist) following Harris, Nelson and Asok Mitra.
In simple words
A town or city is a place where most people work in factories, offices, shops and services rather than on farms.
An Indian city is like an old house extended many times: a crowded old core, a neat British-era wing, planned colonies and new glass towers at the edge.
Knowing how cities grew and what each city mainly does helps plan transport, housing and jobs.
UPSC asks you to explain city morphology and functional classification with named Indian cities and a sketch.
1. Concepts and definitions
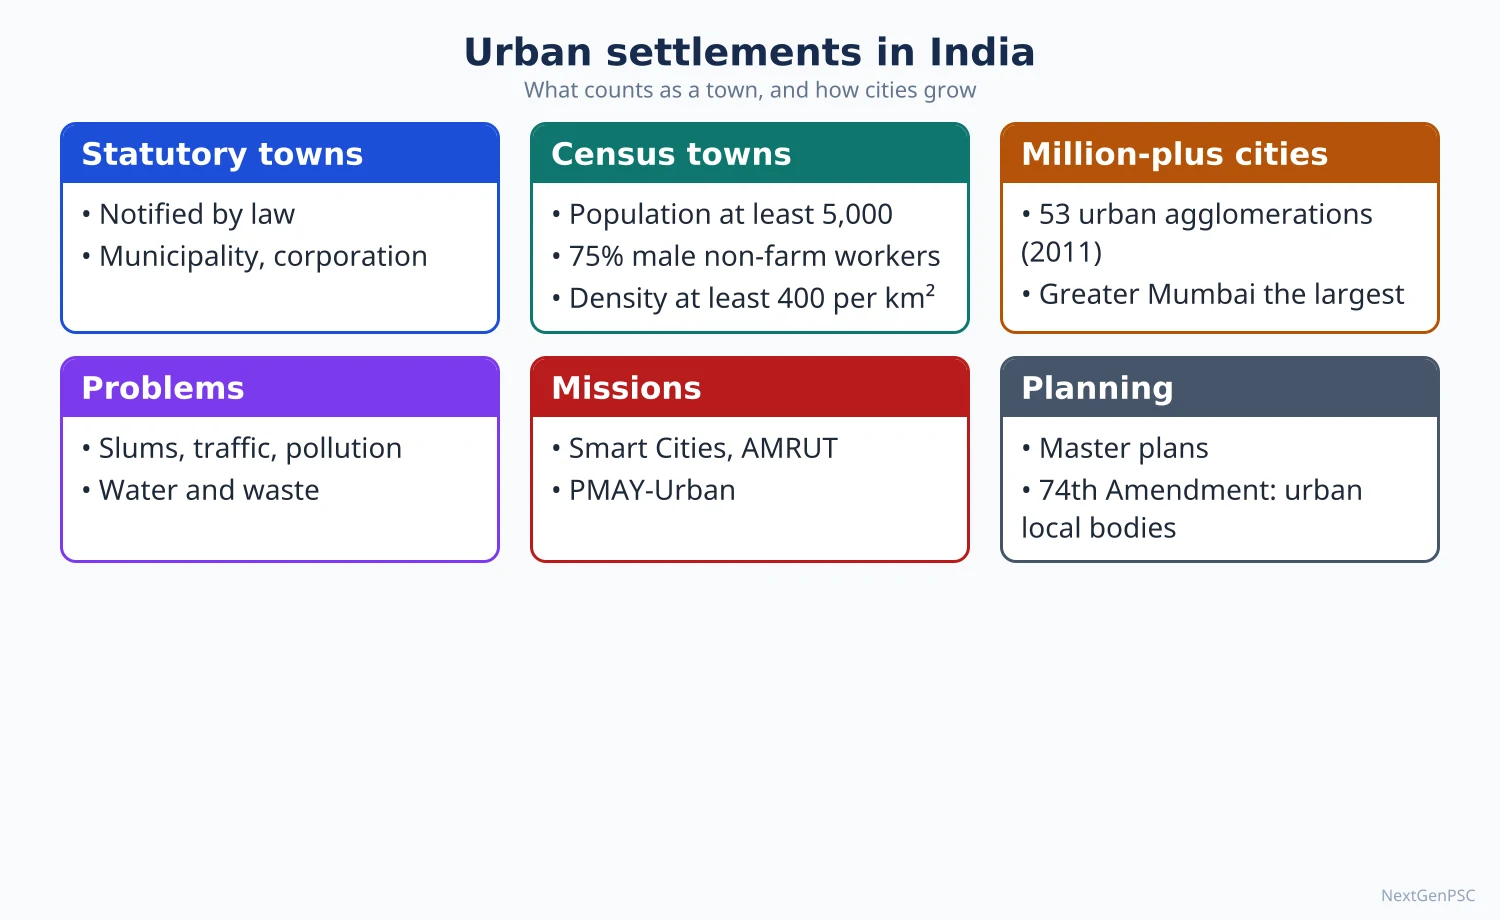
Statutory town: any place with a municipal corporation, municipality, cantonment board or notified town area committee, as declared by state law.
Census town: a place without urban local government that meets three tests: population of at least 5,000, at least 75% of the male main workers in non-agricultural work, and density of at least 400 persons per km² (Census of India, 2011).
Urban agglomeration (UA): a continuous urban spread made of a town and its adjoining outgrowths, or two or more physically contiguous towns; Census 2011 identified 475 UAs with 981 outgrowths.
Outgrowth (OG): a village or hamlet next to a town with urban features such as a railway colony, university campus or port area, counted with the town.
City: an urban unit with 1,00,000 or more people (Class I); Census size classes run from Class I down to Class VI (below 5,000).
Million-plus city: a UA or city with 10 lakh or more people; Census 2011 counted 53, up from 35 in 2001.
Urbanisation: the rise in the share of population living in urban areas; urban growth is the rise in the absolute urban population; the two are different.
Data: urban population 37.7 crore or 31.1% in 2011 (Census of India); 1901 about 10.8%, 1951 17.3%, 1981 23.3%, 2001 27.8%.
Milestone: in 2001–2011 the absolute increase in urban population (about 9.1 crore) exceeded the rural increase for the first time since independence.
Census towns rose from 1,362 in 2001 to about 3,890 in 2011, so reclassification of large villages became a major source of urban growth.
2. Phases of urban development in India
Harappan (about 2600–1900 BCE): planned cities with grid streets, citadel and lower town, drains and granaries: Harappa, Mohenjo-daro, Kalibangan (Rajasthan), Lothal (Gujarat), Dholavira (Gujarat), Rakhigarhi (Haryana).
Early historic second urbanisation (from about 6th century BCE): capitals and trade towns of the Ganga plain such as Rajagriha, Pataliputra, Kaushambi, Varanasi and Ujjain, linked to iron, surplus agriculture and trade.
Medieval: capitals, forts and pilgrimage towns such as Delhi, Agra, Fatehpur Sikri, Lahore, Vijayanagara (Hampi), Golconda and Madurai, built around palaces, mosques, temples and bazaars.
Colonial: port presidency towns (Madras from 1639, Bombay, Calcutta from 1690), hill stations (Shimla, Darjeeling, Ooty, Mussoorie), cantonments (Meerut, Mhow, Secunderabad) and railway towns (Jamalpur, Kharagpur); many old inland towns declined.
Post-independence planned towns: administrative capitals (Chandigarh, Bhubaneswar, Gandhinagar, Dispur, Naya Raipur), steel towns (Bhilai, Rourkela, Durgapur, Bokaro), refugee towns (Faridabad, Ulhasnagar) and satellite towns (Navi Mumbai).
Post-1991 phase: service-led growth in IT and finance hubs (Bengaluru, Hyderabad, Pune, Gurugram, Noida), private townships and special economic zones, and fast growth of small census towns.
Regional pattern (Census 2011): most urbanised states were Goa (62.2%), Mizoram (52.1%), Tamil Nadu (48.4%), Kerala (47.7%) and Maharashtra (45.2%); least urbanised were Himachal Pradesh (10.0%), Bihar (11.3%), Assam (14.1%) and Odisha (16.7%); NCT of Delhi was 97.5% urban.
3. Morphology of Indian cities
Urban morphology: the study of the physical form, layout, land use and building pattern of a city and how it changes over time.
Western models: Burgess concentric zones (1925), Hoyt sector model (1939) and the Harris–Ullman multiple nuclei model (1945) were built for American cities and fit Indian cities only in part.
Traditional core: a dense, mixed-use old city of narrow winding lanes, bazaars, caste and community mohallas and religious buildings, such as Shahjahanabad (Old Delhi), Chowk in Lucknow, the Charminar area of Hyderabad and the pols of Ahmedabad.
Colonial layer: civil lines for officials, cantonments with wide roads and bungalows, railway colonies and European quarters; in Madras and Calcutta this produced the divide between a White Town and a Black Town.
Dual city: Anthony D. King (Colonial Urban Development, 1976) described the colonial city as two contrasting cities side by side, the indigenous city and the colonial city, a concept widely applied to Delhi, Lucknow and Kanpur.
Post-independence layer: planned sectors and neighbourhood units, government housing, industrial estates, refugee colonies (Lajpat Nagar and Rajinder Nagar in Delhi) and development authority colonies.
Contemporary periphery: gated communities, IT parks, malls, flyovers and metro corridors, mixed with unauthorised colonies, urban villages (lal dora areas in Delhi) and slums.
Distinct Indian features: high density right up to the core, weak separation of land uses, a bazaar rather than a single high-rise CBD, social segregation by caste and religion, and an informal sector everywhere.
Classic studies: R.L. Singh's study of Banaras (1955) and Ujagir Singh's study of Allahabad identified functional zones of Indian cities; John E. Brush wrote on the morphology of Indian cities (1962) and noted their high central densities.
4. Morphology examples to quote
Jaipur (founded 1727 by Sawai Jai Singh II): a walled grid of rectangular blocks (chowkris) with wide bazaar streets, planned with the help of Vidyadhar Bhattacharya.
New Delhi: Lutyens and Baker's imperial capital (inaugurated 1931) with radial and hexagonal road geometry, low density bungalows and a ceremonial axis.
Chandigarh: planned by Le Corbusier in the 1950s as self-contained rectangular sectors (about 800 m × 1,200 m) with a hierarchy of roads (the 7Vs) and the Capitol Complex at the head.
Mumbai: a linear city on a narrow peninsula with the old fort and CBD in the south and growth pushed northward along suburban rail lines.
Kolkata: a linear city along the Hooghly with a twin city (Howrah) across the river and growth north and south.
Bengaluru: radial growth from the old pete and cantonment along highways to IT corridors such as Whitefield and Electronic City.
5. Functional classification of cities
Function: the main economic activity that gives a town its reason to exist and its basic employment.
Harris (1943): Chauncy Harris classified American cities by fixed thresholds of employment share in manufacturing, retail, wholesale and other activities.
Nelson (1955): Howard Nelson used the mean plus one, two or three standard deviations of each activity's employment share to identify specialised cities, a more objective statistical method.
Asok Mitra (1960s): using Census 1961 worker data, Asok Mitra grouped Indian towns into manufacturing, trade and transport, and service towns, with mixed categories; his scheme is the basis of most Indian classifications.
Qazi Ahmad (1965): in his study of Indian cities he used multiple socio-economic variables to classify Indian cities.
Standard functional classes with Indian examples:
Administrative: New Delhi, Chandigarh, Bhopal, Gandhinagar, Dispur, Thiruvananthapuram.
Industrial: Jamshedpur, Bhilai, Kanpur, Coimbatore, Hosur, Modinagar.
Transport and port: Kandla, Kochi, Visakhapatnam, Paradip (ports); Itarsi, Mughalsarai, Katni (rail junctions).
Commercial and trade: Kolkata, Surat, Satna, Saharanpur.
Mining: Dhanbad, Jharia, Digboi, Ankleshwar, Singrauli.
Garrison or cantonment: Ambala, Mhow, Babina, Udhampur.
Educational: Roorkee, Aligarh, Pilani, Manipal, Varanasi.
Religious and cultural: Varanasi, Puri, Ajmer, Madurai, Haridwar, Amritsar, Tirupati.
Tourist: Shimla, Nainital, Mussoorie, Udhagamandalam, Panaji, Mount Abu.
Multi-functional: large metros such as Mumbai, Delhi and Chennai combine many functions, so classification by a single function suits only small and medium towns.
6. Theory and debates
Primate city: Mark Jefferson (1939) described a city much larger than the next; India has no national primate city, but several states show primacy (Kolkata in West Bengal, Hyderabad in Telangana, Bengaluru in Karnataka).
Rank-size rule: G.K. Zipf (1949) held that the nth city has 1/n of the population of the largest; India's city size distribution roughly follows it at national level.
Over-urbanisation versus under-urbanisation (debated): some scholars, including Kingsley Davis and Bert Hoselitz, argued that Asian cities grew faster than their industrial base; others argue India is under-urbanised and that official definitions understate urbanisation.
Hidden urbanisation (debated): studies using satellite night lights and the World Bank's agglomeration index suggest India's real urban share is much higher than 31%, because many large villages are urban in character but administered as rural.
7. Maps and diagrams to draw
Morphology sketch of an Indian city: draw a walled old core with a bazaar and mosque or temple at the centre; to one side a gridded civil lines and a cantonment; a railway line with a railway colony; planned sectors beyond; and an outer ring of industrial estates, gated colonies, slums and urban villages; label each zone.
Comparison sketch: place Burgess's rings next to the Indian city sketch and mark how the Indian city has a dense core and mixed use.
Map of India: mark the 53 million-plus UAs as dots graded by size, with the three megacities (Greater Mumbai, Delhi, Kolkata) as the largest, and shade states by urban share.
8. Using it in the exam
10 marks: define census town and statutory town, give 2011 data and four functional classes with examples.
15 marks: phases of urbanisation with examples, or the morphology of one named city with a sketch.
20 marks: morphology model of the Indian city with a sketch, comparison with western models, functional classification (Harris, Nelson, Asok Mitra) and current trends.
Keywords: census town, urban agglomeration, dual city, civil lines, functional specialisation, primate city, rank-size rule, hidden urbanisation.
Quotable line: Anthony King's idea, paraphrased: the colonial Indian city was a dual city, an indigenous town and a colonial town side by side.
| Unit or class | Criterion | Note or 2011 figure |
|---|---|---|
| Statutory town | Has a municipal corporation, municipality, cantonment board or notified town area | 4,041 towns |
| Census town | 5,000+ people, 75%+ male main workers non-agricultural, 400+ persons per km² | About 3,890 towns (1,362 in 2001) |
| Urban agglomeration | Town plus outgrowths, or contiguous towns | 475 UAs with 981 outgrowths |
| Class I | 1,00,000 and above | Million-plus subset: 53 UAs or cities |
| Class II to Class VI | 50,000–99,999; 20,000–49,999; 10,000–19,999; 5,000–9,999; below 5,000 | Small and medium towns |
| Urban share | Urban population ÷ total population | 31.1% (37.7 crore) |
| Feature | Burgess, Hoyt, Harris–Ullman cities | Typical Indian city |
|---|---|---|
| Centre | High-rise CBD with few residents | Dense old bazaar core where people still live |
| Land use | Clearly separated zones | Mixed use at every scale |
| Social order | Segregation by income and race | Segregation by caste, religion and income |
| Historical layers | Mostly industrial-era growth | Pre-colonial, colonial and post-colonial layers side by side |
| Periphery | Wealthy commuter suburbs | Mix of gated townships, industry, slums and urban villages |
Mains points
- Typical questions: morphology of Indian cities with a sketch; functional classification of Indian towns; trends and regional pattern of urbanisation since 1951; role of census towns.
- Always draw the Indian city morphology sketch and contrast it with Burgess; examiners reward this.
- Use Census 2011 data with the year: 31.1% urban, 53 million-plus UAs, 4,041 statutory and about 3,890 census towns.
- Distinguish urbanisation (share) from urban growth (absolute numbers), and statutory from census towns.
- For functional classification name the method (Harris 1943, Nelson 1955, Asok Mitra) before listing classes, and give two Indian towns per class.
- Add the hidden urbanisation debate and note that Census 2027 (reference date 1 March 2027) will update these figures.
Did you know?
- Census town test memory trick 5-75-400: 5,000 people, 75% non-farm male workers, 400 persons per km².
- Jaipur's walled city was declared a UNESCO World Heritage Site in 2019, recognised for its planned grid layout.
Conurbations, Metropolitan Regions, Urban Sprawl and Slums
A conurbation (Patrick Geddes, 1915) forms when growing towns merge into one built-up mass, as along Delhi–Gurugram–Noida–Ghaziabad or Mumbai–Thane–Kalyan. Census 2011 counted 53 million-plus urban agglomerations, led by Greater Mumbai (1.84 crore), Delhi (1.63 crore) and Kolkata (1.41 crore). Unplanned outward growth, or urban sprawl, eats farmland, lakes and wetlands, while 6.55 crore people (17.4% of urban India) lived in slums in 2011, facing poor housing, water, sanitation and insecure tenure.
In simple words
When a big city keeps growing, it swallows nearby towns and villages until they all join into one huge urban area called a conurbation.
It is like drops of spilled water spreading and joining into one large puddle.
This spreading, called urban sprawl, eats farmland and lakes, and many poor migrants end up in crowded slums without proper water or toilets.
UPSC asks about causes, problems and remedies, with Indian examples such as Delhi NCR and Dharavi.
1. Concepts and definitions
Conurbation: a term coined by Patrick Geddes in Cities in Evolution (1915) for an extensive urban area formed when several towns grow and merge while keeping separate identities and local governments.
Megalopolis: Jean Gottmann (1961) used it for the chain of metropolitan areas from Boston to Washington; the term is used loosely for very large multi-city regions.
Metropolitan city: in Indian usage a city of 10 lakh or more; the term megacity is commonly used for UAs above 1 crore.
Metropolitan area (constitutional): Article 243P(c), added by the 74th Amendment (1992), defines it as an area with a population of 10 lakh or more, in one or more districts, with two or more municipalities or panchayats, notified by the Governor.
Metropolitan region: the functional region of a metropolis, including its commuter belt, satellite towns and rural fringe, usually planned by a development authority.
Urban sprawl: low-density, scattered, often unplanned spread of built-up area beyond the city edge, faster than population growth.
Peri-urban zone: the transition belt around a city where rural and urban land uses mix, land prices rise and governance is weak.
Slum (Census 2011): three kinds: notified slums declared under state law, recognised slums recognised by state or local authorities, and identified slums, any compact area of at least 300 people or about 60–70 households in poorly built, congested tenements lacking proper sanitation and drinking water.
UN-Habitat slum household: one lacking one or more of improved water, improved sanitation, durable housing, sufficient living area and security of tenure.
2. Conurbations and metropolitan regions of India
Largest UAs (Census 2011): Greater Mumbai 1.84 crore, Delhi 1.63 crore, Kolkata 1.41 crore, Chennai 87 lakh, Bengaluru 85 lakh, Hyderabad 77 lakh, Ahmedabad 64 lakh, Pune 50 lakh.
Delhi conurbation: the NCT has merged with Gurugram and Faridabad (Haryana) and Noida and Ghaziabad (Uttar Pradesh); the National Capital Region is planned by the NCR Planning Board set up under an Act of 1985, covering parts of Delhi, Haryana, Uttar Pradesh and Rajasthan.
Mumbai Metropolitan Region: Mumbai, Thane, Kalyan–Dombivli, Navi Mumbai, Bhiwandi, Vasai–Virar and others, planned by the MMRDA (set up in 1975); growth runs north along rail lines and east across Thane creek.
Kolkata conurbation: a linear belt along both banks of the Hooghly from Kalyani to Budge Budge, including Howrah, built on old jute mill towns.
Chennai, Bengaluru and Hyderabad: metropolitan regions planned by the CMDA, BMRDA (1985) and HMDA (2008), with growth along IT corridors and ring roads.
Emerging urban corridors: Delhi–Mumbai Industrial Corridor, Ahmedabad–Vadodara–Surat belt, Bengaluru–Mysuru and the Coimbatore–Tiruppur region link cities into corridors of industry and settlement.
Kerala rural–urban continuum: continuous settlement from Thiruvananthapuram to Kochi and Kozhikode resembles the desakota regions described by T.G. McGee (1991) for Asia, mixing farming and urban work in one landscape.
3. Urban sprawl: causes and effects
Causes: rising population and migration, high land prices in the core, cheap land and weaker regulation at the fringe, private vehicles and new highways and ring roads, IT parks and SEZs on the periphery, and speculation by real estate developers.
Governance gap: sprawl falls in census towns and villages that are still governed by panchayats, so building controls and services lag behind.
Loss of farmland and water bodies: Bengaluru's tank system has lost many lakes to buildings; Chennai's Pallikaranai marsh has shrunk with construction and dumping; Hyderabad and Gurugram have lost natural drainage channels.
Floods: encroachment on drains and wetlands worsened the Mumbai floods of 26 July 2005, the Chennai floods of 2015 and the Bengaluru floods of 2022.
Other effects: longer commutes and car dependence, air pollution, costlier services per head, urban heat islands, and social segregation in gated enclaves.
Measurement: geographers measure sprawl by comparing built-up growth with population growth using satellite images (Landsat, Sentinel) and indices such as Shannon's entropy.
Remedies: compact city and transit-oriented development (National TOD Policy, 2017), green belts and urban growth boundaries, land pooling (for example Amaravati and Naya Raipur), regional plans, and bringing peri-urban areas under planning authorities.
4. Slums: data and spatial pattern
Data: Census 2011 recorded 6.55 crore slum dwellers in 2,613 towns, 17.4% of the urban population (Census of India, Primary Census Abstract for Slums, 2011).
Leading state: Maharashtra had the largest slum population (about 1.18 crore) in 2011.
Greater Mumbai: about 41% of the population of the Municipal Corporation of Greater Mumbai lived in slums in 2011; Dharavi, about 2.2 km² in central Mumbai, is one of Asia's largest slums and a hub of leather, pottery, garment and recycling work.
Location: slums occupy marginal land such as riverbanks (Yamuna in Delhi, Mithi in Mumbai), railway sides, drains, hill slopes, coastal mudflats and land near factories and markets where jobs are close.
Types by origin: old inner-city tenements (Mumbai chawls, Kolkata bustees), squatter settlements on public land (Delhi jhuggi-jhopri clusters), and peri-urban unauthorised colonies.
5. Problems associated with slums
Housing: overcrowding, kutcha and semi-pucca structures, high fire risk.
Basic services: shared or no toilets, irregular water, open drains and uncollected waste, leading to diarrhoea, tuberculosis, dengue and malaria.
Insecure tenure: fear of eviction stops households investing in better homes; demolition drives displace families far from jobs.
Livelihood: mostly informal, low-wage, insecure work, though slums also host productive small industries (Dharavi).
Social issues: low schooling, child labour, stigma, exposure to crime, and vulnerability of women.
Environmental risk: location on floodplains, steep slopes and near polluting units makes slum dwellers the first victims of floods and landslides.
6. Theory and debates
Culture of poverty: Oscar Lewis (1959, 1966) argued that the poor develop values that keep them poor; critics say it blames the victims and ignores structural causes.
Slums of hope and slums of despair: Charles Stokes (1962) distinguished slums where migrants move up from those that trap people.
Self-help housing: John F.C. Turner (Freedom to Build, 1972) argued that squatters improve their own housing if given security, supporting in-situ upgrading over clearance.
Property titles: Hernando de Soto (The Mystery of Capital, 2000) argued that legal titles turn informal homes into capital; critics say titles alone do not reduce poverty and can enable market eviction (debated).
Planet of slums: Mike Davis (2006) linked slum growth to structural adjustment and informal economies.
7. Policy response in India
Early laws and schemes: Slum Areas (Improvement and Clearance) Act 1956; Environmental Improvement of Urban Slums (1972); National Slum Development Programme (1996); VAMBAY (2001).
JNNURM (2005): Basic Services to the Urban Poor (BSUP) and Integrated Housing and Slum Development Programme; Rajiv Awas Yojana (2013) aimed at a slum-free India.
PMAY-Urban (2015): verticals for in-situ slum redevelopment, credit-linked subsidy, affordable housing in partnership and beneficiary-led construction; about 1.18 crore houses sanctioned under the first phase.
PMAY-Urban 2.0 (approved 9 August 2024): assistance for 1 crore urban poor and middle-class families over five years, with central assistance of about ₹2.30 lakh crore (Union Cabinet, 2024).
Affordable Rental Housing Complexes (2020): rental housing for urban migrants and the poor, launched after the COVID-19 lockdown.
State models: Mumbai's Slum Rehabilitation Authority (1995) uses extra floor space as an incentive for builders; Odisha's Land Rights to Slum Dwellers Act (2017) and the Jaga Mission give land rights to slum households; the Dharavi redevelopment project is being carried out by an Adani Group-led company selected in 2022.
8. Maps and diagrams to draw
Conurbation sketch: draw Delhi NCT as a central block with arrows to Gurugram (south-west), Faridabad (south), Noida and Ghaziabad (east), shade the merged built-up area, and draw the NCR boundary around it.
Sprawl diagram: three concentric outlines of a city for 1991, 2011 and today, with the outer ring extending in fingers along highways, and lakes shown disappearing.
Slum location sketch: a river with slums on its floodplain, a railway with slums along the tracks and an industrial estate with slums beside it.
Map of India: mark the eight largest UAs with their 2011 populations and the main conurbations.
9. Using it in the exam
10 marks: define conurbation or slum (Census 2011 types), give data and two examples.
15 marks: causes and effects of urban sprawl with Bengaluru or Delhi NCR as a case and a sketch.
20 marks: slum problem: definition, data, spatial pattern, problems, theories (Turner, Stokes), policies (PMAY-U 2.0, Odisha model) and a way forward.
Keywords: conurbation, metropolitan region, peri-urban, sprawl, in-situ redevelopment, security of tenure, inclusive city.
Quotable line: Geddes's idea, paraphrased: the conurbation is a new form of population grouping in which towns grow together into a single urban region.
| Urban agglomeration | State | Population 2011 (approx.) | Planning body or note |
|---|---|---|---|
| Greater Mumbai | Maharashtra | 1.84 crore | MMRDA (1975); linear growth north |
| Delhi | NCT of Delhi | 1.63 crore | DDA (1957); NCR Planning Board (1985) |
| Kolkata | West Bengal | 1.41 crore | Linear belt along the Hooghly |
| Chennai | Tamil Nadu | 87 lakh | CMDA; IT corridor on Old Mahabalipuram Road |
| Bengaluru | Karnataka | 85 lakh | BMRDA (1985); lake loss from sprawl |
| Hyderabad | Telangana | 77 lakh | HMDA (2008) |
| Approach | Idea | Indian example |
|---|---|---|
| Clearance and relocation | Demolish and move residents to outer sites | Resettlement colonies on Delhi's fringe |
| In-situ upgrading | Improve services and housing where people live | PMAY-U in-situ slum redevelopment vertical |
| Land rights and tenure | Give legal security so families invest | Odisha Land Rights to Slum Dwellers Act 2017, Jaga Mission |
| Market-based redevelopment | Extra floor space to builders in return for free rehousing | Mumbai Slum Rehabilitation Authority, Dharavi project |
| Rental housing | Affordable rent for migrants | Affordable Rental Housing Complexes 2020 |
Mains points
- Typical questions: problems of slums and remedies; urban sprawl and its environmental effects; conurbations and metropolitan regions of India; peri-urban problems.
- Define slums using the Census 2011 three-way classification and give 2011 data (6.55 crore, 17.4%, 2,613 towns).
- Use case studies: Delhi NCR for conurbation, Bengaluru lakes or Chennai's Pallikaranai marsh for sprawl, Dharavi for slums.
- Do not treat slums only as a problem; mention their economic role and theories of self-help and hope (Turner, Stokes).
- End with balanced remedies: in-situ upgrading, tenure security, rental housing, TOD and regional planning, quoting PMAY-U 2.0 (2024).
- A conurbation sketch or sprawl diagram adds value even in a 15-mark answer.
Did you know?
- Patrick Geddes, who coined 'conurbation', also worked in India between 1914 and the early 1920s and wrote planning reports for many Indian towns, including Indore.
- Dharavi's small units recycle huge quantities of plastic and metal waste, which is why planners call it an informal industrial district, not just a slum.
Town Planning and Problems of Urbanisation
Town planning is the deliberate arrangement of land use, buildings, roads and services to make cities efficient, healthy and fair; in India it rests on state town and country planning laws, master plans and the 74th Constitutional Amendment (1992). Yet NITI Aayog (2021) found that about 65% of India's 7,933 urban settlements had no master plan. Rapid, unplanned urbanisation has produced housing shortages, water stress, congestion, pollution, urban floods, heat islands and weak municipal finances, which missions such as Smart Cities, AMRUT 2.0, SBM-Urban 2.0 and PMAY-U 2.0 try to address.
In simple words
Town planning means deciding in advance where homes, factories, roads, parks and drains should go in a city.
It is like arranging furniture before moving into a house, rather than dumping everything and tripping over it later.
Indian cities grew faster than plans, so they face traffic jams, floods, dirty air, water shortages and slums.
UPSC asks you to list these problems with Indian examples and suggest practical remedies backed by government missions.
1. Concepts and definitions
Town planning: the art and science of ordering land use and the location of buildings, communication routes and services to secure convenience, economy, health and beauty in a town.
Master plan or development plan: a long-term (usually 20-year) statutory plan for a city's land use, density, transport and infrastructure, prepared by a development authority or local body.
Zoning: dividing a city into zones with permitted uses (residential, commercial, industrial, green) and controls such as floor area ratio (FAR) and ground coverage.
Town planning scheme: a land readjustment tool in which plots are pooled, roads and amenities carved out, and reconstituted plots returned to owners; first used under the Bombay Town Planning Act (1915) and widely used in Gujarat.
Land pooling: owners surrender land and receive developed plots back, as in Amaravati (Andhra Pradesh) and Delhi's land pooling policy.
Planning hierarchy (URDPFI Guidelines, MoHUA, 2014): perspective plan, regional plan, development plan, local area plan and special purpose plans.
2. Planning thinkers and Indian experience
Patrick Geddes: 'survey before plan' and conservative surgery (careful improvement instead of wholesale demolition); worked in Indian cities from 1914.
Ebenezer Howard: the garden city (To-morrow: A Peaceful Path to Real Reform, 1898) of limited size surrounded by a green belt; it influenced planned townships such as Bhubaneswar and Gandhinagar.
Clarence Perry (1929): the neighbourhood unit centred on a primary school, used in the sectors of Chandigarh and the colonies of Delhi.
Le Corbusier: modernist planning with zoning, hierarchy of roads and the Capitol Complex at Chandigarh (1950s); the Capitol Complex is part of a UNESCO World Heritage Site (2016).
Lewis Mumford: in The City in History (1961) he warned against unchecked metropolitan growth.
Indian tradition: Harappan grid towns, guidance on town layout in the Arthashastra, and the planned walled city of Jaipur (1727).
Post-independence: Chandigarh, Bhubaneswar (planned by Otto Koenigsberger) and Gandhinagar as new capitals; steel towns; the Delhi Development Authority (1957) and the first Master Plan for Delhi (1962), followed by MPD-2001 and MPD-2021, with MPD-2041 in preparation.
3. Institutional framework
74th Constitutional Amendment Act (1992): created municipalities as institutions of self-government, added the Twelfth Schedule of 18 functions with urban planning including town planning as the first item, and provided for State Finance Commissions.
Article 243ZD: a District Planning Committee consolidates plans of panchayats and municipalities.
Article 243ZE: a Metropolitan Planning Committee prepares a draft development plan for each metropolitan area; few states have made these committees effective.
Parastatals: development authorities (DDA, MMRDA, BDA) and water boards often control planning instead of elected councils, a gap noted by many expert bodies.
Guidelines: Model Building Bye-Laws (2016), National Urban Transport Policy (2006), National Transit Oriented Development Policy (2017) and Model Town and Country Planning laws prepared by the central ministry.
Capacity gap: NITI Aayog's report Reforms in Urban Planning Capacity in India (2021) found about 65% of 7,933 urban settlements without a master plan and a severe shortage of qualified town planners.
4. Urban missions (Government of India)
JNNURM (2005–2014): first large reform-linked mission for 65 mission cities, with urban infrastructure and BSUP components.
Swachh Bharat Mission-Urban (2014) and SBM-U 2.0 (2021): open defecation free cities, then garbage-free cities with source segregation and remediation of legacy dumpsites.
Smart Cities Mission (June 2015): 100 cities chosen by competition for area-based development and pan-city ICT solutions through special purpose vehicles; the mission formally ended on 31 March 2025; MoHUA reported about 7,790 of 8,064 projects completed by 31 March 2026.
AMRUT (2015) and AMRUT 2.0 (1 October 2021): water supply, sewerage, drainage, green spaces; AMRUT 2.0 aims at universal tap water in all statutory towns till 2025–26 with central outlay of ₹76,760 crore.
HRIDAY (2015): heritage city development in cities such as Varanasi, Amritsar, Ajmer, Puri and Warangal.
PMAY-Urban (2015) and PMAY-U 2.0 (2024): housing for all; PMAY-U 2.0 targets 1 crore families over five years.
PM-eBus Sewa (2023): 10,000 electric buses for cities that lack organised bus services.
Metro rail: metro systems now run in over a dozen Indian cities, from Kolkata (1984) and Delhi (2002) to Bengaluru, Chennai, Mumbai, Hyderabad, Kochi, Lucknow, Ahmedabad and Pune.
5. Problems of urbanisation in India
Housing shortage and slums: the Technical Group on Urban Housing Shortage (Kundu Committee, 2012) estimated a shortage of 1.88 crore units for 2012, mostly for economically weaker sections; 6.55 crore people lived in slums in 2011.
Water stress: rapid groundwater depletion in Bengaluru, Delhi and Chennai; Chennai's 'Day Zero' water crisis of 2019; high leakage (non-revenue water) in city supply.
Sanitation and waste: incomplete sewer networks, untreated sewage reaching rivers such as the Yamuna, Musi and Mithi, and legacy dumpsites such as Ghazipur and Bhalswa in Delhi and Deonar in Mumbai.
Transport and congestion: rapid growth of private vehicles, weak bus systems, long commutes, and road deaths.
Air pollution: Delhi NCR and Indo-Gangetic cities suffer severe winter smog; the National Clean Air Programme (January 2019) covers 131 non-attainment cities and targets a cut in PM10 of up to 40% by 2025–26 against 2017–18 levels.
Urban floods: Mumbai on 26 July 2005 (944 mm of rain in 24 hours at Santacruz), Chennai in 2015, Hyderabad in 2020, Bengaluru in 2022, caused by encroached drains, lakes and floodplains.
Urban heat island: concrete, asphalt and loss of trees make city cores several degrees warmer than the surroundings, raising heatwave deaths and power demand.
Informality and poverty: most urban workers are in the informal sector without social security; urban poverty is concentrated in slums and resettlement colonies.
Weak municipal finance and governance: municipal revenue is only about 1% of GDP (RBI, Report on Municipal Finances, 2022); limited own taxes, dependence on state grants, and fragmented agencies.
Peri-urban and census town gap: thousands of census towns are governed as villages, so they lack planning and urban services.
Social problems: crime, social segregation, gated enclaves, and exclusion of migrants, as seen during the 2020 lockdown exodus.
6. Remedies and way forward
Plan for all towns: prepare GIS-based master plans for every statutory and census town, as recommended by NITI Aayog (2021), and fill vacancies of town planners.
Empower cities: implement the 74th Amendment fully, give metropolitan planning committees real power, and raise property tax and user charges; municipal bonds have been issued by cities such as Pune, Indore and Ahmedabad.
Compact, transit-oriented growth: higher FAR near metro and bus corridors, walking and cycling, public bus fleets (PM-eBus Sewa).
Blue-green infrastructure: protect lakes, wetlands and floodplains, sponge-city design, rainwater harvesting, urban forests (Nagar Van Yojana, 2020).
Inclusive housing: in-situ slum upgrading, rental housing and land rights instead of eviction.
Balanced urban system: develop small and medium towns, rurban clusters and industrial corridors to reduce pressure on megacities.
Climate and disaster planning: heat action plans (Ahmedabad's Heat Action Plan of 2013 was the first in South Asia), flood early warning, and building codes for earthquakes.
7. Theory and debates
Planned versus organic growth (debated): modernist master planning (Chandigarh) is praised for order but criticised for rigidity and for ignoring the poor and the informal sector; critics favour incremental, participatory planning.
Smart city critique (debated): scholars argue the Smart Cities Mission focused on small area-based projects and technology rather than city-wide basics, and bypassed elected councils through special purpose vehicles; supporters point to integrated command and control centres and completed projects.
Urbanisation as engine of growth: the Economic Survey and the World Bank stress agglomeration economies; others warn of 'urbanisation without industrialisation' in India.
8. Maps and diagrams to draw
Problem–remedy flow chart: rapid urban growth → land, housing, water, transport, pollution, flood problems → plan, finance, governance, infrastructure remedies, each with one scheme.
Master plan zoning sketch: a circle divided into residential, commercial core, industrial zone downwind, green belt at the edge and transport corridors radiating out.
Map of India: mark Smart Cities in each state (for example Bhubaneswar, Pune, Indore, Surat, Visakhapatnam) and the metro cities; add NCAP non-attainment clusters in the Indo-Gangetic plain.
9. Using it in the exam
10 marks: list five problems of urbanisation with one Indian example and one remedy each.
15 marks: evaluate town planning in India: framework, master plans, gaps (NITI Aayog 2021), remedies.
20 marks: problems of urbanisation and remedies with data, case studies (Mumbai floods, Delhi air, Chennai water), schemes and a flow chart.
Keywords: master plan, zoning, 74th Amendment, Metropolitan Planning Committee, transit-oriented development, municipal finance, blue-green infrastructure, inclusive city.
Quotable line: Geddes's principle of 'survey before plan', which means understanding a place and its people before redesigning it.
| Mission | Launched | Focus | Status or target |
|---|---|---|---|
| JNNURM | 2005 | Infrastructure and basic services to the urban poor, linked to reforms | Ended 2014; 65 mission cities |
| Smart Cities Mission | June 2015 | Area-based development and ICT in 100 cities | Formally ended 31 March 2025; about 7,790 of 8,064 projects done by March 2026 (MoHUA) |
| AMRUT and AMRUT 2.0 | 2015; 1 October 2021 | Water supply, sewerage, drainage, green spaces | Universal tap water in statutory towns till 2025–26; central outlay ₹76,760 crore |
| SBM-Urban and SBM-U 2.0 | 2014; 2021 | Open defecation free, then garbage-free cities | Legacy dumpsite remediation, source segregation |
| PMAY-Urban and PMAY-U 2.0 | 2015; approved 9 August 2024 | Housing for all | About 1.18 crore houses sanctioned in phase 1; 1 crore more families in phase 2 |
| National Clean Air Programme | January 2019 | Air quality in non-attainment cities | 131 cities; PM10 cut of up to 40% by 2025–26 |
| Problem | Indian example | Remedy |
|---|---|---|
| Housing shortage and slums | 1.88 crore unit shortage (2012); Dharavi | PMAY-U 2.0, rental housing, in-situ upgrading |
| Water stress | Chennai crisis 2019; Bengaluru groundwater | AMRUT 2.0, rainwater harvesting, reuse of treated water |
| Urban floods | Mumbai 2005, Chennai 2015, Bengaluru 2022 | Protect wetlands and drains, sponge-city design |
| Air pollution | Delhi NCR winter smog | NCAP, public transport, clean fuels |
| Weak planning capacity | About 65% of towns without master plans (NITI Aayog 2021) | GIS master plans, more town planners, empowered MPCs |
| Weak municipal finance | Municipal revenue only about 1% of GDP (RBI 2022) | Property tax reform, user charges, municipal bonds |
Mains points
- Typical questions: problems of urbanisation in India and remedies; evaluation of town planning or master plans; urban floods and heat islands; performance of the Smart Cities Mission.
- Structure answers as problem → cause → Indian example → remedy, and end with a balanced way forward.
- Quote the institutional base: 74th Amendment (1992), Twelfth Schedule, Articles 243ZD and 243ZE, and NITI Aayog's 2021 finding on master plans.
- Use current scheme status with dates: Smart Cities Mission ended 31 March 2025, AMRUT 2.0 (2021), PMAY-U 2.0 (2024), NCAP (2019).
- Avoid writing only a list of schemes; examiners want spatial examples (named cities) and geographic reasoning (sprawl, floodplains, heat islands).
- A flow chart or zoning sketch lifts the presentation.
Did you know?
- Memory trick for the two planning articles of the 74th Amendment: ZD = District, ZE = mEtropolitan; 243ZD sets up District Planning Committees and 243ZE Metropolitan Planning Committees.
- Ahmedabad's Heat Action Plan (2013), made after the deadly 2010 heatwave, became a model copied by many Indian cities and states.
UPSC Previous Year Questions: Settlements in India
From 2014 to 2026 UPSC asked 32 question parts worth 475 marks on Settlements in India (13 parts of 15 marks, 10 of 10 marks and 9 of 20 marks). The most-asked topic is conurbations, urban sprawl and slums (12 parts), followed by town planning and urban problems (9), urban morphology and functional classification (7) and rural settlements (4). Every question below has a model answer written to the UPSC word limit, with a map or diagram.
In simple words
Read the question and the Approach line, then close the page and write your own answer in the time limit: about 7 minutes for 10 marks, 10 for 15 marks and 12 for 20 marks.
Now compare your answer with the model: did you define the key term, name a geographer or model, give Indian examples with data and year, and draw the map or diagram?
Note what you missed in the margin of your notes and revise those points; the model answers show the length and structure examiners reward, not a script to memorise.
1. Rural Settlements of India
Example 1 (UPSC 2025, 15 marks): "The rural settlements in India are highly diversified due to both physical and cultural factors." Justify the statement with examples.
Paper and question: Paper II, Q4(c)
Approach: Justify the statement by showing how physical factors (relief, water, soil, climate, hazards) and cultural factors (caste, tribe, history, security, planning) produce different settlement types, with a regional example for each. Draw a map of settlement types.
India's 5,97,608 inhabited villages (Census 2011) show every type of rural settlement, from compact (clustered) to semi-compact, hamleted and dispersed, because physical and cultural forces work together, as O.H.K. Spate and Enayat Ahmad showed for the Ganga plain.
Physical factors: fertile, level alluvium and scarce water favour compact villages around a tank or well, as in the Punjab–Haryana plain and the Rajasthan desert where villages crowd round johads and tankas. Abundant water and rugged relief allow scattering: dispersed homesteads in the Himalayan slopes, the Nilgiris and Meghalaya, and linear villages along levees and coasts in Kerala and the Brahmaputra valley. Flood-prone lower Ganga plain and the Sundarbans have hamlets on raised mounds.
Cultural factors: caste divides many villages into a main settlement and separate hamlets (tolas, paras, palli), giving the hamleted pattern of eastern Uttar Pradesh, Bihar, West Bengal and coastal Tamil Nadu. Tribal communities of the Northeast and central India prefer hill-top or forest-edge clusters for defence and shifting cultivation. Historical insecurity produced fortified compact villages in Rajasthan and Bundelkhand, while canal colonies of Punjab (1890s onwards) were laid out on a grid.
Modern factors: roads (PMGSY, 2000), PMAY-Gramin houses and Rurban clusters are making villages linear along highways.
Map: Outline map of India shading compact (Punjab, Haryana, western UP, Rajasthan, Deccan), semi-compact (Malwa, Gujarat), hamleted (middle and lower Ganga plain, coastal Tamil Nadu) and dispersed (Himalaya, Northeast, Kerala, Konkan) settlement regions.
Thus India's settlement mosaic is the joint product of nature and society; neither factor alone explains it, which supports the statement.
Example 2 (UPSC 2020, 15 marks): Give a reasoned geographical account of changing rural folk houses in India.
Paper and question: Paper II, Q3(c)
Approach: Explain how traditional rural (folk) houses reflect climate, materials and culture region by region, then give the reasons and direction of change and evaluate it. Draw a map of house types.
Folk houses are dwellings built by local people with local materials and inherited skills; their form records climate, available material, economy and social custom, which is why they are a key element of the cultural landscape.
Traditional regional types: flat-roofed mud and stone houses with thick walls in hot-dry Rajasthan and Ladakh; round bhungas of Kutch that resist earthquakes; sloping thatch or tile roofs in rainy Kerala, Konkan and Bengal; bamboo stilt houses (chang ghar) of the Mising in Assam against floods; timber-and-stone kath-kuni houses of Himachal Pradesh; courtyard houses of the Ganga plain giving privacy and shade.
Causes of change: scarcity of thatch, timber and skilled artisans; rising incomes and remittances (Kerala, Punjab); cement, brick and steel reaching villages along PMGSY roads; government housing under Indira Awaas Yojana (1985) and PMAY-Gramin (2016) with standard designs; nuclear families; and the prestige attached to pucca houses.
Trend: PMAY-G alone had completed about 2.92 crore rural houses by December 2025 (Ministry of Rural Development), so pucca construction now dominates new rural housing.
Assessment: pucca houses are safer from fire and rain and improve sanitation, but standard concrete boxes are hot in summer, ignore earthquake-resistant folk wisdom and erase regional identity.
Map: Outline map of India marking flat roofs (Rajasthan, Ladakh), bhunga (Kutch), sloping roofs (Kerala, Konkan, Bengal), stilt houses (Assam, Northeast) and kath-kuni (Himachal).
The way forward is climate-responsive, locally adapted designs within PMAY-G, blending folk wisdom with modern materials.
Example 3 (UPSC 2018, 20 marks): Describe the changing regional morphology of rural settlements in India.
Paper and question: Paper II, Q8(a)
Approach: Describe the traditional regional morphology (types and patterns) of Indian villages, then the forces and direction of change in each region, with examples. Draw sketches of village patterns and a map of regions.
Settlement morphology means the internal layout and external shape of a settlement: its type (compact, semi-compact, hamleted, dispersed) and pattern (linear, rectangular, circular, star-shaped, nucleated around a tank or temple). In India it varies regionally and is now changing fast.
Traditional regional morphology: compact, rectangular or star-shaped villages in the Punjab–Haryana–western UP plain and the Deccan; ring-and-cluster villages round a water point in Rajasthan; hamleted villages with caste-based tolas in the middle and lower Ganga plain; linear settlements along levees, roads and coasts in Kerala, the Konkan and the Brahmaputra valley; dispersed homesteads in the Himalaya, the Northeast and tribal central India. The core of the village had the dominant castes and the temple; service castes and Dalit hamlets lay at the edge.
Forces of change: PMGSY roads (2000) and highways; green revolution farm houses in Punjab; irrigation canals (Indira Gandhi Canal) creating new colonies; PMAY-G houses (2016) and Jal Jeevan Mission (2019) connections; land consolidation; remittances; and urban influence near cities.
New morphology: villages are stretching along roads into ribbon (linear) development; dispersed farm houses appear in Punjab; caste segregation is weakening though not gone; commercial cores with shops and pucca houses form at road junctions; villages near cities become urban villages (Delhi's Lal Dora villages, Gurugram) or census towns, whose number rose from 1,362 (2001) to 3,894 (2011).
Diagram: Sketches of linear, rectangular, circular and star-shaped village plans, and a before-and-after sketch of a compact village extending along a new road.
Regional contrasts persist: change is fastest in Kerala, Punjab and peri-urban belts and slowest in tribal and hill regions; SVAMITVA (2020) property cards are now formalising abadi plots.
In sum, Indian rural morphology is moving from inward-looking, caste-structured clusters towards road-oriented, mixed, semi-urban forms, calling for village-level spatial plans.
Example 4 (UPSC 2016, 20 marks): Present a comparative analysis of geographical factors responsible for distribution of human settlements in Rajasthan desert and North-Eastern regions of India.
Paper and question: Paper II, Q6(a)
Approach: Compare, factor by factor (relief, climate and water, soils and economy, culture and security, accessibility), why settlements in the Rajasthan desert and the North-East are distributed as they are, ending with a comparative judgement. Draw two inset maps.
The Thar desert of western Rajasthan and the North-Eastern hill region are both sparsely settled peripheries of India, but for opposite reasons: shortage of water in the first, excess of rain, slope and forest in the second. Census 2011 densities illustrate this: Jaisalmer 17 persons per km², Arunachal Pradesh 17, Mizoram 52, against the national 382.
Relief: the Thar is a sandy plain with dunes and rocky outcrops, so settlement is limited by water, not slope; the North-East is mountainous, so people occupy ridge tops and spurs (Kohima, Aizawl) or valley floors such as the Imphal and Brahmaputra valleys.
Water and climate: in the Thar, with under 250 mm of rain, villages (dhanis) cluster round wells, tankas, khadins and oases. Rainfall above 2,000 mm in the North-East allows small dispersed or hamleted villages near springs, but floods in the Brahmaputra valley force people onto raised land.
Economy: pastoralism and rain-fed bajra in the Thar sustain scattered dhanis; the Indira Gandhi Canal has created new dense canal colonies around Ganganagar and Hanumangarh. In the North-East, jhum (shifting cultivation) produces small, periodically shifting hill villages, while wet rice and tea gardens give dense, linear villages in the Assam valley.
Culture and security: Rajput forts and trade routes created towns such as Jaisalmer, Bikaner and Jodhpur; in the North-East, tribal clan organisation and past inter-village warfare produced defensive hill-top clusters, as among the Nagas.
Accessibility: both regions have low road density; the North-East is linked to the mainland only through the Siliguri corridor, the Thar by long desert roads.
Map: Two inset maps: western Rajasthan showing the Indira Gandhi Canal command, dune areas and major towns; the North-East showing the Brahmaputra and Imphal valleys (dense) against the hill states (sparse).
In conclusion, aridity concentrates Thar settlements at water points, while rugged, forested terrain disperses North-Eastern settlements; irrigation and roads are now reshaping both.
2. Urban Development, Morphology and Functional Classification of Indian Cities
Example 5 (UPSC 2024, 20 marks): How can morphology of Indian towns be described historically? Discuss the major features of the first planned city in India after independence.
Paper and question: Paper II, Q8(a)
Approach: First trace the morphology of Indian towns through historical phases (ancient, medieval, colonial, post-independence), then describe the planning features of Chandigarh as the first planned city after independence. Draw a sketch of the Chandigarh sector plan.
Urban morphology is the physical form of a town: its street plan, land use and building pattern. Indian towns carry layers from successive historical phases, as R.L. Singh showed in his study of Banaras (1955).
Historical phases: (i) Ancient: Harappan grid towns with citadel and lower town (Mohenjo-daro, Dholavira), and temple towns with concentric streets round the shrine (Madurai, Srirangam). (ii) Medieval: walled cities with a fort, palace, mosque or temple, chowk and bazaar, narrow winding lanes and caste-based mohallas (Shahjahanabad, Lucknow, Hyderabad); planned exceptions like Jaipur (1727). (iii) Colonial: a dual city (A.D. King, 1976) of crowded native town beside spacious civil lines and cantonment, plus ports, hill stations and railway colonies, and imperial New Delhi (1931). (iv) Post-independence: planned capitals, steel towns and satellite towns, followed after 1991 by IT corridors, gated townships and metro-led growth.
Chandigarh, the first planned city after independence: conceived in 1950 as the new capital of Punjab after Lahore went to Pakistan; first planned by Albert Mayer and Matthew Nowicki, then by Le Corbusier with Pierre Jeanneret, Maxwell Fry and Jane Drew. Its features are: a grid of self-contained sectors of about 800 m × 1,200 m, each a neighbourhood with school, market and green strip; a hierarchy of seven roads (the 7Vs) separating fast traffic from local movement; the Capitol Complex at the head (UNESCO World Heritage, 2016) with a 'head–heart–limbs' organic analogy; a central commercial Sector 17; Sukhna Lake and the Leisure Valley; a periphery controlled under the 1952 Act.
Diagram: Grid of rectangular sectors with V2–V3 roads around each sector, the Capitol Complex at the north-east head below the Shivalik hills, Sector 17 in the centre, Sukhna Lake and the Leisure Valley green belt.
Chandigarh is praised for order and greenery but criticised for low density, car dependence and the sprawl of Mohali, Panchkula and Zirakpur into a tricity, showing the limits of rigid master planning.
Example 6 (UPSC 2023, 20 marks): A large number of Indian cities have a complex morphological characteristics due to their historical evolution. Elucidate.
Paper and question: Paper II, Q6(a)
Approach: Elucidate how successive historical layers (pre-colonial core, colonial additions, post-independence and post-1991 growth) coexist to give Indian cities a complex morphology, with named city examples and a comparison with western models. Draw a generalised model of the Indian city.
Most large Indian cities are not products of one plan but palimpsests: each historical period added a distinct morphological layer without erasing the earlier one, giving a multi-nuclei, mixed land-use form that the Burgess (1925) and Hoyt (1939) models cannot fully explain.
Pre-colonial core: a dense old city around a fort, palace or temple and chowk, with narrow lanes, mixed residence and commerce, and caste or occupational mohallas (Chandni Chowk in Shahjahanabad, the pols of Ahmedabad, the Charminar area of Hyderabad, the temple-centred plan of Madurai).
Colonial layer: separate civil lines, cantonment and railway colony with wide roads and bungalows, producing what A.D. King (1976) called the dual city: Delhi (old city versus New Delhi and the cantonment), Lucknow, Kanpur, Bengaluru (pete versus cantonment). Port cities such as Mumbai, Kolkata and Chennai grew around a fort and harbour with a European business district.
Post-independence layer: refugee colonies (Lajpat Nagar in Delhi), public sector townships, Development Authority colonies, industrial estates, and unplanned slums and urban villages trapped inside the city.
Post-1991 layer: IT parks and CBD-like nodes at the edge (Gurugram Cyber City, Hyderabad's HITEC City, Bengaluru's Whitefield), gated communities, malls, metro corridors and redeveloped mill lands (Lower Parel, Mumbai).
Results: many centres instead of one CBD, sharp contrasts of density and wealth side by side, high central densities (J.E. Brush, 1962), and mixed land use within the same street.
Diagram: Generalised model: old walled city with bazaar core, colonial civil lines and cantonment on one side, railway line and industrial zone, post-independence colonies, slums along drains and rail lines, and peripheral IT and gated townships along ring roads.
Thus historical evolution makes Indian urban morphology complex; planning must work with these layers, through heritage conservation (HRIDAY, 2015) and redevelopment, rather than impose a single western model.
Example 7 (UPSC 2021, 10 marks): Discuss Ashok Mitra's classification method of Indian cities.
Paper and question: Paper II, Q5(e)
Approach: Explain the data base, procedure and classes of Asok Mitra's functional classification of Indian towns, then give a brief evaluation. A simple flow diagram of the classes helps.
Asok Mitra, Registrar General and Census Commissioner for the 1961 Census, produced the first all-India functional classification of towns using census worker data, adapting Western methods to Indian conditions.
Method: he used the 1961 Census distribution of workers among nine industrial categories. These were regrouped into three broad sectors: manufacturing (household and non-household industry), trade and transport, and services. The share of workers in each sector was computed for every town; the dominant sector gave the town its main class, and a strong second sector gave a mixed designation.
Classes: manufacturing towns (for example Jamshedpur, Bhilai, Kanpur), trade-and-transport towns (Mughalsarai, Siliguri, Kandla), service towns (administrative, educational and cantonment towns such as Shimla, Dehradun, Mhow), and mixed types such as manufacturing-cum-service or trade-cum-manufacturing.
Diagram: Flow chart: nine census worker categories → three sectors → percentage share per town → dominant sector → main class and mixed sub-classes.
Evaluation: it is simple, replicable with census data and became the basis of later Indian schemes (Qazi Ahmad, 1965). But it uses a single variable (worker share), ignores the volume of services and the informal sector, and fixed cut-offs are partly arbitrary compared with Nelson's (1955) statistical method.
Example 8 (UPSC 2020, 10 marks): Identify challenges faced by generative and parasitic towns in India and their possible remedies.
Paper and question: Paper II, Q5(e)
Approach: Define generative and parasitic towns after Hoselitz, identify the challenges each faces in India with examples, and suggest remedies. A simple diagram of flows between town and region helps.
Bert F. Hoselitz (1955) distinguished generative towns, which stimulate growth in their hinterland through investment, innovation and markets, from parasitic towns, which drain surplus, labour and capital from the region while giving little back.
Generative towns and their challenges: Ludhiana, Coimbatore, Surat, Pune and Bengaluru spread industry and services to their regions. Their problems are congestion, land and housing costs, water stress (Bengaluru in 2024), slums and pollution, which can choke the very growth they generate.
Parasitic towns and their challenges: many administrative and trading towns in Bihar, eastern Uttar Pradesh and Odisha, and some colonial enclave towns, mainly absorb rural migrants and rents without industrial base; they suffer unemployment, informal work, weak municipal revenue and widening rural–urban gaps.
Diagram: Two circles of town and hinterland: arrows of capital, innovation and services flowing outward for the generative town; arrows of surplus, labour and rent flowing inward for the parasitic town.
Remedies: strengthen backward linkages and agro-processing (PM Formalisation of Micro Food Processing Enterprises, 2020), cluster development, better roads to the hinterland, municipal finance reform under the 74th Amendment, and growth-centre strategies so that parasitic towns become regional service and production centres.
Example 9 (UPSC 2018, 20 marks): Examine the driving forces of changing urban morphology of million-plus cities of India with suitable examples.
Paper and question: Paper II, Q4(a)
Approach: Identify the main driving forces (economic restructuring, transport, land and housing markets, policy, technology, demography) that are changing the morphology of million-plus cities, each with a named example, and end with an assessment. Draw a sketch of the changing city structure.
India had 53 million-plus urban agglomerations in Census 2011, up from 35 in 2001, holding about 42.6% of the urban population. Their morphology is shifting from a compact, single-centred old city to a sprawling, polycentric metropolitan region.
Economic restructuring: after 1991, services and IT replaced mills and port trade. Mumbai's textile mill lands at Lower Parel and Worli became offices and towers; Bengaluru grew new nodes at Electronic City and Whitefield; Hyderabad's HITEC City and Gurugram's Cyber City became new CBDs.
Transport: metro rail (Delhi since 2002, then Bengaluru, Chennai, Hyderabad, Mumbai), ring roads (Hyderabad Outer Ring Road), expressways and flyovers pull development outward in radial fingers; the National Transit Oriented Development Policy (2017) promotes dense nodes around stations.
Land and housing markets: high central land prices and higher floor area ratios produce vertical growth in the core, while cheaper land drives gated townships and private cities at the edge (Lavasa near Pune, New Town Rajarhat in Kolkata).
Policy and governance: SEZs (Act 2005), Smart Cities Mission (2015) area-based development, master plans and land pooling (Delhi's land pooling policy, 2018), and relocation of polluting industries from Delhi after court orders.
Social and demographic forces: migrant inflow sustains slums along rail lines and drains (Dharavi); rising middle class demands malls and gated enclaves, increasing segregation.
Diagram: Sketch of a million-plus city: old core, colonial zone, inner residential ring, metro and highway corridors radiating outward, new CBD and IT nodes at the edge, peripheral townships, slums in interstitial spaces and absorbed villages.
These forces create efficient new nodes but also sprawl, inequality and environmental loss; compact, transit-oriented and inclusive planning is needed to steer them.
Example 10 (UPSC 2017, 20 marks): Mention various methods of functional classification of towns in India and explain the method applied by Asok Mitra.
Paper and question: Paper II, Q4(a)
Approach: List the main methods of functional classification used for Indian towns (qualitative, statistical, multivariate) with their authors, then explain Asok Mitra's method in detail with its classes and an evaluation. A table-like flow diagram helps.
Functional classification groups towns by the dominant economic activity of their workforce, revealing their role in the regional economy and guiding planning.
Methods: (i) Descriptive or qualitative: towns named by their obvious function (administrative, religious, port, hill station), as in early studies by geographers such as Aurousseau (1921). (ii) Fixed-threshold method: Chauncy Harris (1943) set employment cut-offs for manufacturing, retail, wholesale and other classes. (iii) Statistical method: Howard Nelson (1955) used the mean plus one, two or three standard deviations of each activity to grade specialisation. (iv) Indian adaptations: Asok Mitra (1961 Census) and Qazi Ahmad (1965), who used several socio-economic variables; later scholars used multivariate methods such as factor analysis on census data.
Asok Mitra's method: he took the 1961 Census distribution of workers in nine industrial categories and regrouped them into three sectors: manufacturing, trade and transport, and services. For each town the percentage of workers in each sector was calculated; the leading sector gave the main class, and where a second sector was also strong the town was given a mixed class.
Classes: manufacturing towns (Jamshedpur, Bhilai, Kanpur), trade-and-transport towns (Mughalsarai, Kandla, Siliguri), service towns (Shimla, Dehradun, Mhow), and mixed categories such as manufacturing-cum-trade or service-cum-manufacturing.
Diagram: Flow chart from nine census worker categories to three sectors, sector shares per town, and main and mixed classes, with one example town in each box.
Evaluation: the method is simple, uses uniform census data and suits Indian towns where household industry and services dominate, so it shaped all later Indian classifications. Its limits are reliance on a single variable, the neglect of informal and seasonal workers, arbitrary cut-offs, and a static view that cannot capture the rapid post-1991 shift to services.
Example 11 (UPSC 2015, 10 marks): "Mono-functional towns are economically vulnerable." Discuss.
Paper and question: Paper II, Q5(c)
Approach: Explain why towns that depend on one function are vulnerable (resource depletion, market shocks, policy change), with Indian examples of decline, and suggest diversification. A simple diagram of the cycle of decline helps.
Mono-functional towns are those in which one activity, such as a mine, a single industry, a port or a pilgrimage, employs most workers; in Nelson's (1955) terms they are highly specialised. Their fortunes rise and fall with that one function.
Why vulnerable: (i) Resource exhaustion: Kolar Gold Fields in Karnataka declined sharply after its gold mines closed in 2001; mica towns of Koderma in Jharkhand shrank when mica demand fell. (ii) Market and technology shocks: the closure of composite textile mills hit Kanpur and central Mumbai in the 1980s and 1990s. (iii) Dependence on one employer: steel and public sector townships (Bokaro, Rourkela) depend on one plant's health. (iv) Policy and environment: Supreme Court suspensions of iron ore mining in Bellary (2011) and Goa (2012) hurt local towns.
Diagram: Cycle of decline: closure of main activity → job loss → out-migration → falling municipal revenue → decay of services → further decline.
Counterpoint: specialisation also brings scale economies and identity (Surat diamonds, Tiruppur knitwear), so the risk lies in lack of diversification, not specialisation itself.
Remedy: diversify through cluster development, skill training, tourism and services, as Jamshedpur did by growing a wider industrial and service base.
3. Conurbations, Metropolitan Regions, Urban Sprawl and Slums
Example 12 (UPSC 2026, 10 marks): Explain the government initiatives for the redevelopment of slum areas in the mega cities of India.
Paper and question: Paper II, Q5(b)
Approach: Explain, in chronological order, the central and state initiatives for slum redevelopment in mega cities (in-situ redevelopment, housing, rental, land rights), with examples, and end with a short assessment. A map of mega cities with their schemes helps.
Census 2011 counted 6.55 crore slum dwellers, 17.4% of the urban population, concentrated in mega cities such as Greater Mumbai, where about 41% lived in slums. Policy has moved from clearance to in-situ redevelopment and rights.
Central initiatives: Basic Services to the Urban Poor under JNNURM (2005); Rajiv Awas Yojana (2013) for a slum-free India; PMAY-Urban (2015), whose in-situ slum redevelopment vertical uses land as a resource with private partners; Affordable Rental Housing Complexes (2020) for migrants; and PMAY-U 2.0 (approved August 2024) for 1 crore families.
State and city initiatives: Mumbai's Slum Rehabilitation Authority (1995) gives builders extra floor space to rehouse slum families free; the Dharavi redevelopment project is led by an Adani Group company selected in 2022; Delhi's in-situ 'Jahan Jhuggi Wahan Makaan' flats at Kalkaji (2022); Odisha's Land Rights to Slum Dwellers Act (2017) and Jaga Mission give titles.
Map: Outline map of India marking Mumbai (SRA, Dharavi), Delhi (Kalkaji in-situ project), Kolkata, Chennai, Bengaluru, Hyderabad and Odisha's cities (Jaga Mission).
Assessment: vertical rehousing has added housing stock but often breaks livelihoods, ignores tenants and creates 'vertical slums'; secure tenure and upgrading with participation work better.
Example 13 (UPSC 2025, 10 marks): How can rural-urban fringe be delineated? Explain with suitable examples from India.
Paper and question: Paper II, Q5(a)
Approach: Define the rural-urban fringe, explain the criteria and techniques used to delineate it (demographic, occupational, land use, land value, commuting, remote sensing), and illustrate with Indian cities. Draw a diagram of the fringe zones.
The rural-urban fringe, a term popularised by G.S. Wehrwein (1942), is the transition zone between the continuously built-up city and the purely rural countryside, where land use, occupations and lifestyles are mixed and changing.
Criteria for delineation: (i) Demographic: population density and growth rate falling between urban and rural values. (ii) Occupational: share of non-agricultural workers rising above about half, as with Census outgrowths and census towns. (iii) Land use: conversion of farmland to built-up, industrial and plotted land, measured from satellite images (Landsat, ISRO's Bhuvan). (iv) Land value and transactions. (v) Functional: daily commuting, milk and vegetable supply, and service links with the city.
Techniques: overlay of these indicators village by village, density gradient curves, and Shannon's entropy to measure dispersion of built-up area.
Indian examples: Delhi's fringe villages of Narela, Bawana and Najafgarh and adjoining Gurugram and Noida; New Town Rajarhat around Kolkata; Whitefield and Devanahalli around Bengaluru; Hinjawadi near Pune.
Diagram: Concentric sketch: city core, built-up urban area, inner fringe (mostly urban), outer fringe (mostly rural), urban shadow and rural hinterland, with fingers along highways.
Accurate delineation lets the fringe be brought under planning before unplanned sprawl takes over.
Example 14 (UPSC 2024, 15 marks): Discuss the process of formation of conurbations in India and describe their problems.
Paper and question: Paper II, Q2(c)
Approach: Explain the stages and drivers by which separate towns merge into conurbations in India, with named examples, then describe their problems and end with remedies. Draw a map of major conurbations.
A conurbation, in Patrick Geddes's term (Cities in Evolution, 1915), is an extensive urban area formed when neighbouring towns grow and merge physically while keeping separate local governments.
Process of formation: (i) a large core city grows and its land becomes costly; (ii) industry and housing shift to satellite towns and along transport routes; (iii) ribbon development along highways and suburban railways fills the gaps; (iv) intervening villages become outgrowths and census towns; (v) towns merge into one built-up mass. Drivers are migration, industrial dispersal, metro and expressway links, and real estate investment.
Indian examples: Delhi with Gurugram, Faridabad, Noida and Ghaziabad (NCR); Mumbai with Thane, Kalyan–Dombivli, Navi Mumbai and Vasai–Virar; the Hooghly riverside conurbation around Kolkata; Chennai, Hyderabad–Secunderabad and the Chandigarh–Mohali–Panchkula tricity.
Problems: fragmented governance across states and municipalities; traffic congestion and long commutes; water scarcity and falling groundwater; floods from encroached drains (Mumbai 2005, Chennai 2015); air pollution in NCR; slums and unauthorised colonies; loss of farmland and green belts.
Map: Outline map of India marking the NCR, Mumbai Metropolitan Region, Kolkata Metropolitan Area, Chennai, Hyderabad and Chandigarh tricity conurbations.
Remedies include metropolitan planning committees under Article 243ZE, integrated regional plans (NCR Planning Board, MMRDA), unified transport authorities and green belts.
Example 15 (UPSC 2022, 15 marks): Examine the role of high population concentration in Indian slums in making them more vulnerable during pandemic conditions like the COVID-19.
Paper and question: Paper II, Q6(c)
Approach: Examine how high density in slums, together with poor housing, services and livelihoods, increased vulnerability to COVID-19, using Indian evidence (Dharavi, migrant exodus), and add the counter-example and lessons. A sketch of a dense slum cluster helps.
Census 2011 recorded 6.55 crore people in Indian slums. Their extreme population density, combined with poor services and informal work, made them hotspots of risk during the COVID-19 pandemic of 2020–21.
How density raised vulnerability: (i) Dharavi in Mumbai packs several lakh people into about 2.2 km², so physical distancing was impossible. (ii) One-room homes shared by large families made home isolation unworkable. (iii) Shared toilets and water points: about a third of slum households had no latrine within their premises (Census 2011), so hundreds queued at common facilities. (iv) Poor ventilation and lanes under a metre wide favoured airborne spread.
Compounding factors: daily-wage and informal livelihoods vanished in the March 2020 lockdown, triggering the mass exodus of migrant workers; malnutrition and conditions like tuberculosis raised health risks; and many residents lacked documents for relief.
Counter-evidence: Mumbai's sero-survey of July 2020 found far higher antibody prevalence in slum areas than in non-slum areas, confirming faster spread, yet Dharavi brought cases down through the 'chase the virus' approach of tracing, testing and community toilets sanitisation.
Diagram: Sketch of a slum cluster: tightly packed one-room units, a narrow lane, a shared toilet block and water tap serving many households, with arrows showing contact points.
Lessons: in-situ upgrading with household toilets, Affordable Rental Housing Complexes (2020), universal ration portability (One Nation One Ration Card) and local health systems reduce future vulnerability.
Density itself is not the problem; density without infrastructure is.
Example 16 (UPSC 2022, 15 marks): What are the drivers of urban sprawl around the major cities of the country? How have new investments in transport projects supported sprawl development?
Paper and question: Paper II, Q7(c)
Approach: Identify the drivers of urban sprawl around major cities, then show how specific new transport projects (expressways, ring roads, metro, regional rail, airports, freight corridors) have supported sprawl, ending with an assessment. Draw a sprawl diagram along transport corridors.
Urban sprawl is low-density, scattered and often leapfrog expansion of a city into surrounding farmland, faster than population growth, typically along roads.
Drivers: (i) high land prices and restrictive FAR in the core; (ii) migration and rising household numbers; (iii) relocation of industries and warehouses to the periphery; (iv) IT parks and SEZs at the edge; (v) speculative real estate and plotted colonies; (vi) weak control over peri-urban panchayat land and conversion of agricultural land; (vii) rising car and two-wheeler ownership.
Role of transport investment: new links cut travel time and raise land values along their route. The Yamuna Expressway (2012) opened Greater Noida and the Jewar airport area; Hyderabad's Outer Ring Road carried growth to Gachibowli and Shamshabad; the Kempegowda airport (2008) pulled Bengaluru north to Devanahalli; metro extensions to Noida, Gurugram and Bahadurgarh, and the Delhi–Meerut RRTS (Namo Bharat) corridor, are urbanising western UP; Mumbai's Atal Setu (2024) and the Navi Mumbai airport are pushing growth across the harbour; Delhi–Mumbai Industrial Corridor nodes such as Dholera are planned new cities.
Diagram: Star-shaped sketch of a city with built-up fingers along expressways, ring road and metro lines, townships clustered at interchanges and stations, and farmland between the fingers.
Assessment: transport-led growth decongests the core and creates jobs, but unplanned sprawl raises infrastructure costs, car dependence and loss of farmland and wetlands.
The remedy is to pair transport with land-use planning through transit-oriented development (2017 policy) and value capture finance.
Example 17 (UPSC 2020, 15 marks): Urban sprawl around planned cities evolve leading to emergence of squatter settlements. Discuss the advantages and disadvantages of such outgrowth.
Paper and question: Paper II, Q7(c)
Approach: Explain why squatter settlements emerge in the sprawl around planned cities (labour demand without planned housing), with examples such as Chandigarh, Delhi and Navi Mumbai, then weigh advantages against disadvantages and conclude. Draw a sketch of a planned city and its fringe squatter belt.
Planned cities in India were designed for a fixed population and formal workers but did not plan for the construction workers, domestic helpers and vendors they attract. These workers settle in the urban sprawl at the edge as squatter settlements, an outgrowth that planners did not foresee.
Examples: Chandigarh's labour colonies and slums such as Colony No. 4 and Bapu Dham, and sprawl into Mohali, Zirakpur and Panchkula; Delhi's jhuggi clusters and unauthorised colonies beyond DDA's planned areas; squatter settlements around Navi Mumbai and Bhubaneswar.
Advantages: (i) affordable shelter for low-income migrants where formal housing is unaffordable; (ii) a ready labour supply for construction, services and industry, sustaining the planned city's economy; (iii) incremental self-help housing, which John F.C. Turner (1972) saw as a positive force; (iv) informal enterprises and social networks that ease migrants' entry.
Disadvantages: (i) lack of water, sanitation and drainage, causing disease; (ii) insecure tenure and repeated evictions; (iii) encroachment on green belts, forests and floodplains; (iv) strain on the city's services without tax contribution; (v) crime and social segregation; (vi) defeat of the master plan's density and land-use controls.
Diagram: Sketch of a planned sector grid with a periphery belt showing squatter clusters along highways, drains and near construction sites, and spill-over towns beyond the administrative boundary.
On balance, such outgrowth is a symptom of planning that ignored the poor. Planned cities should reserve land for economically weaker sections, offer rental housing and upgrade existing squatter settlements in situ rather than demolish them.
Example 18 (UPSC 2019, 10 marks): Correlate the price of land, vertical growth of cities and the growth of slums in large cities of India.
Paper and question: Paper II, Q5(c)
Approach: Establish the causal chain: scarce, costly land leads to vertical growth for the rich and to slums for the poor when supply of affordable floor space is restricted; illustrate with Mumbai and Delhi and conclude. Draw a bid-rent and density diagram.
In large cities, land near the centre commands the highest bid rent (Alonso, 1964), because accessibility is greatest there. High land prices push builders to economise on land by building upwards, so vertical growth follows land value.
Link to slums: when the supply of legal floor space is restricted by low floor area ratios, rent control, and slow land release, formal housing becomes unaffordable for the poor. They occupy marginal, untitled land along railway lines, drains, mangroves and hill slopes, giving high-density horizontal slums amid towers.
Mumbai: some of India's costliest land, long-restrictive floor space rules and an island site produced skyscrapers in Worli and Lower Parel beside Dharavi and about 41% of people in slums (Census 2011). Slum rehabilitation now uses extra floor space to build vertical rehousing, linking all three variables.
Delhi and Bengaluru: costly land and plotted low-rise development created peripheral jhuggi clusters and unauthorised colonies.
Diagram: Bid-rent curve falling from the centre with a building-height curve following it, and slum clusters marked on low-value or untitled land patches.
Thus land price, verticality and slums are correlated; releasing land and allowing higher, affordable floor space reduces slum formation.
Example 19 (UPSC 2019, 15 marks): Provide a reasoned account on emerging conurbations in India and explain with suitable examples the problems associated with it.
Paper and question: Paper II, Q6(b)
Approach: Give a reasoned account of why and where conurbations are emerging in India (core metros and new urban corridors), with named examples, then explain their problems with examples. Draw a map of emerging conurbations.
A conurbation (Patrick Geddes, 1915) forms when expanding towns coalesce into one built-up region. Census 2011 recorded 475 urban agglomerations with 981 outgrowths, and several are merging into conurbations.
Reasons for emergence: concentration of investment and jobs in metros after 1991; migration; industrial and residential decentralisation to satellite towns; transport corridors (expressways, metro, suburban rail); conversion of villages into census towns (3,894 in 2011); and real estate speculation.
Established conurbations: NCR (Delhi, Gurugram, Faridabad, Noida, Ghaziabad); Mumbai Metropolitan Region (Mumbai, Thane, Kalyan–Dombivli, Navi Mumbai, Vasai–Virar); the Hooghly riverside belt around Kolkata.
Emerging conurbations: Pune–Pimpri-Chinchwad; Hyderabad–Secunderabad–Cyberabad; Chandigarh–Mohali–Panchkula tricity; Ahmedabad–Gandhinagar; Coimbatore–Tiruppur; Asansol–Durgapur; and the Kerala rural-urban continuum from Thiruvananthapuram to Kochi, resembling McGee's (1991) desakota.
Problems: governance split across states and municipalities (NCR across four states); traffic congestion; water shortage (Chennai 2019); urban floods (Mumbai 2005, Chennai 2015, Bengaluru 2022); severe air pollution in NCR; slums and unauthorised colonies; loss of farmland, wetlands and Aravalli forests.
Map: Outline map of India marking established conurbations (NCR, MMR, Kolkata) and emerging ones (Pune, Hyderabad, Chandigarh tricity, Ahmedabad–Gandhinagar, Coimbatore–Tiruppur, Asansol–Durgapur, Kerala coast).
Metropolitan planning committees (Article 243ZE), integrated regional transport such as the Delhi–Meerut RRTS, protected green belts and affordable housing near jobs are needed to manage them.
Example 20 (UPSC 2018, 15 marks): Peri-urbanization has created enormous environmental problems. Discuss their causes and consequences with reference to the National Capital Region (N.C.R.) of India.
Paper and question: Paper II, Q7(c)
Approach: Define peri-urbanisation, explain its causes in the NCR, then the environmental consequences (land, water, air, waste, ecology) with named NCR examples, and end with remedies. Draw a map of the NCR.
Peri-urbanisation is the urbanisation of the zone around a city, where farmland and villages are converted to housing, industry and infrastructure, often outside formal planning. The National Capital Region, planned by the NCR Planning Board (Act of 1985) and spread over Delhi, Haryana, Uttar Pradesh and Rajasthan, is India's largest example.
Causes: Delhi's high land prices and Master Plan restrictions; the shift of industries out of Delhi after Supreme Court orders in the 1990s; the IT and service boom in Gurugram and Noida; expressways, metro extensions and the Delhi–Meerut RRTS; private licensed colonies in Haryana; and migration.
Environmental consequences: (i) Land: conversion of farmland and the Aravalli ridge, with illegal construction such as at Kant Enclave in Faridabad, ordered demolished by the Supreme Court in 2018. (ii) Water: groundwater over-extraction has left most blocks of Gurugram and Faridabad over-exploited (Central Ground Water Board); concrete surfaces cause waterlogging, as in Gurugram's July 2016 flood. (iii) Air: construction dust, vehicles, brick kilns and industry make NCR among the most polluted regions; the Commission for Air Quality Management (Act of 2021) now coordinates control. (iv) Waste: overflowing landfills at Ghazipur, Bhalswa and Bandhwari. (v) Ecology: encroachment of the Yamuna floodplain and loss of wetlands such as Najafgarh jheel.
Map: NCR map showing Delhi, Gurugram, Faridabad, Noida, Ghaziabad, Meerut, Sonipat and Alwar, the Aravalli ridge, the Yamuna, major expressways and landfill sites.
Remedies: enforce the NCR Regional Plan and Aravalli protection, groundwater recharge, a single NCR transport and airshed authority, and compact transit-oriented growth.
Example 21 (UPSC 2016, 10 marks): How do slums develop? Give concrete suggestions for their improvement.
Paper and question: Paper II, Q5(c)
Approach: Explain the process of slum formation (push–pull migration, land and housing market failure, weak governance) with Indian data, then give concrete, specific suggestions for improvement. A flow diagram of slum formation helps.
A slum, as defined by Census 2011, is a compact area of at least 300 people or 60–70 households in poorly built, congested tenements lacking proper sanitation and drinking water. India had 6.55 crore slum dwellers in 2011, 17.4% of the urban population.
How slums develop: rural poverty and landlessness push migrants, and urban jobs pull them; formal housing is too costly and scarce (urban housing shortage of 1.88 crore units in 2012, Kundu Committee); migrants squat on vacant public land, drain banks and rail lines; with time, informal settlements densify and are partly regularised.
Diagram: Flow chart: rural push and urban pull → migration → unaffordable formal housing → squatting on marginal land → densification → notified or recognised slum.
Concrete suggestions: (i) in-situ upgrading with secure tenure, as in Odisha's Jaga Mission; (ii) rental housing for migrants (Affordable Rental Housing Complexes, 2020); (iii) household toilets and piped water under SBM-U and AMRUT 2.0; (iv) inclusionary zoning reserving land for weaker sections; (v) community participation and livelihood linkage.
Example 22 (UPSC 2014, 15 marks): Account for the multiple problems of urban agglomerations.
Paper and question: Paper II, Q6(b)
Approach: Account for the multiple problems of Indian urban agglomerations under clear heads (housing and slums, water and sanitation, transport, environment, governance and finance, social), with data and examples, and end with solutions. Draw a map of major UAs.
An urban agglomeration is a continuous urban spread of a town and its outgrowths or of two or more contiguous towns; Census 2011 counted 475 UAs, of which 53 were million-plus, led by Greater Mumbai (1.84 crore) and Delhi (1.63 crore). Rapid, unplanned growth has created multiple, interlinked problems.
Housing and slums: 6.55 crore slum dwellers (Census 2011) and a housing shortage of 1.88 crore units (2012), with about 41% of Greater Mumbai in slums.
Water and sanitation: groundwater depletion in Bengaluru, Delhi and Chennai (Chennai's 2019 water crisis), high leakage, untreated sewage entering rivers such as the Yamuna.
Transport: congestion, rising private vehicles, inadequate buses; long commutes in Mumbai and Bengaluru.
Environment: severe winter smog in Delhi; urban floods (Mumbai 2005, Chennai 2015); urban heat island effect; landfills overflowing.
Governance and finance: multiple agencies, weak municipalities, and municipal revenue of only about 1% of GDP (RBI, 2022).
Social: crime, segregation into gated enclaves and slums, and exclusion of migrants, starkly seen in the exodus during the 2020 lockdown.
Map: Outline map of India marking the eight largest UAs (Mumbai, Delhi, Kolkata, Chennai, Bengaluru, Hyderabad, Ahmedabad, Pune) with their 2011 populations.
Solutions lie in empowered metropolitan governance, AMRUT 2.0, transit-oriented development, affordable rental housing and blue-green infrastructure.
Example 23 (UPSC 2014, 15 marks): How has an inappropriate urban land use policy accounted for undesirable development in and around metropolitan cities?
Paper and question: Paper II, Q8(c)
Approach: Explain which features of urban land use policy (master plan delays, rigid zoning, low FAR, land ceiling and rent control, weak peri-urban control, wetland encroachment) caused undesirable development in and around metro cities, with examples, and suggest reforms. Draw a land-use sketch of a metro and its fringe.
Urban land use policy decides how much land is released, for what use and at what density. In Indian metros, outdated and poorly enforced policy has produced slums, unauthorised colonies, sprawl and environmental damage.
Inappropriate policies and their effects: (i) Delayed and rigid master plans: NITI Aayog (2021) found about 65% of urban settlements had no master plan, so growth outpaces plans. (ii) Urban Land (Ceiling and Regulation) Act, 1976: meant to curb speculation, it locked up land and raised prices until its repeal by Parliament in 1999 (adopted by most states later). (iii) Low floor area ratios and rent control raised housing costs in Mumbai and Delhi, pushing the poor into slums. (iv) Monopoly land acquisition by development authorities such as the DDA was slow, so private unauthorised colonies filled the demand; Delhi had to regularise 1,731 of them under PM-UDAY (2019). (v) Weak control over peri-urban panchayat land allowed haphazard sprawl and farmhouses around Gurugram and Bengaluru. (vi) Neglect of ecology allowed building on lakes, floodplains and mangroves, worsening floods in Bengaluru, Chennai and Mumbai.
Diagram: Sketch of a metro with planned core, slums along drains and rail lines, unauthorised colonies at the fringe, encroached lakes and floodplain, and sprawl along highways beyond the planning boundary.
Reforms: GIS-based master plans for all towns, land pooling and town planning schemes (Gujarat model), higher FAR near transit (TOD Policy, 2017), inclusionary zoning, peri-urban planning areas, and protection of blue-green zones.
4. Town Planning and Problems of Urbanisation
Example 24 (UPSC 2026, 15 marks): Poor road infrastructure and inadequate public transport system remain the key issues in Indian metropolitan areas. Discuss with suitable examples.
Paper and question: Paper II, Q8(b)
Approach: Discuss the road and public transport deficits of Indian metros (road space and design, bus shortage, metro gaps, last-mile, governance) with city examples and their consequences, then the policy response and way forward. Draw a sketch of an integrated transit network.
Mobility is the circulatory system of a metropolis. In Indian metros, road networks and public transport have not kept pace with population and vehicle growth, so congestion, pollution and lost productivity have become chronic.
Road infrastructure issues: narrow, discontinuous roads in old cores (Old Delhi, Kolkata's north), missing links and bottlenecks, potholes and waterlogging in monsoon (Mumbai, Bengaluru), encroached footpaths, and flyover-centred designs that favour cars over pedestrians and cyclists.
Public transport issues: chronic shortage of city buses, with many cities lacking any organised service; overcrowded suburban trains in Mumbai; metro networks that, though about 1,000 km long by 2025, often have low ridership because of poor last-mile connectivity and high fares; and lack of fare and timetable integration.
Consequences: rising private vehicles and two-wheelers; long commutes in Bengaluru, Mumbai and Delhi NCR; vehicle emissions contributing to winter smog; road deaths, with India recording over 1.7 lakh road accident deaths in 2023 (MoRTH).
Governance: roads, buses, metro and traffic police are run by different agencies; Unified Metropolitan Transport Authorities recommended by the National Urban Transport Policy (2006) exist in few cities.
Diagram: Sketch of an integrated network: metro trunk lines, feeder buses, cycle tracks and walkways converging on multimodal hubs, with dense mixed-use development around stations.
Way forward: PM-eBus Sewa (2023) for 10,000 electric buses, bus rapid transit, transit-oriented development (2017 policy), common mobility cards, parking pricing and pedestrian-first street design.
Example 25 (UPSC 2025, 20 marks): Describe the causes of the phenomenon of 'urban heat island'. What are the effective measures to deal with this phenomenon in India?
Paper and question: Paper II, Q6(a)
Approach: Define the urban heat island, explain its causes (surface, built form, anthropogenic heat, loss of vegetation and water, pollution) with Indian evidence, then give effective measures at building, city and policy levels. Draw the UHI temperature profile.
An urban heat island (UHI) is a city area that is warmer than its rural surroundings, especially at night; Luke Howard first recorded the effect for London in the early nineteenth century, and T.R. Oke later explained its energy balance. Indian cities such as Delhi, Ahmedabad, Hyderabad and Bengaluru show it strongly.
Causes: (i) Surface materials: concrete, asphalt and dark roofs have low albedo and high heat storage, releasing heat at night. (ii) Built form: tall buildings and narrow streets create urban canyons that trap radiation and reduce wind, lowering the sky view factor. (iii) Loss of vegetation and water bodies reduces evaporative cooling, as with lake loss in Bengaluru. (iv) Anthropogenic heat from vehicles, industries and air conditioners. (v) Pollution and smog trap long-wave radiation. (vi) Impervious surfaces leave little soil moisture.
Effects: higher night temperatures intensify heatwaves, raise electricity demand, worsen air quality and increase heat illness among outdoor workers and slum dwellers.
Diagram: Temperature profile across a city: low over rural land, rising over suburbs, peaking over the dense CBD, dipping over parks and water bodies, rising again over industrial areas.
Effective measures in India: (i) Heat action plans: Ahmedabad's 2013 plan was the first in South Asia, followed by NDMA guidelines and city plans. (ii) Cool roofs: the Telangana Cool Roof Policy (2023) and white-roof programmes for slums. (iii) Urban greening and forests under the Nagar Van Yojana (2020) and Miyawaki plantations. (iv) Restoring lakes and wetlands under AMRUT 2.0. (v) Green building codes (ECBC, Eco-Niwas Samhita) and passive design with shading and ventilation. (vi) The India Cooling Action Plan (2019) to cut cooling demand. (vii) Better public transport to cut vehicle heat.
Mitigating UHI is now part of climate adaptation; it needs building-level design, city-level green-blue networks and inclusive protection for vulnerable workers.
Example 26 (UPSC 2025, 20 marks): While defining the green architecture, discuss its principles and challenges in response to climate change in India.
Paper and question: Paper II, Q8(a)
Approach: Define green architecture, explain its principles (site, energy, water, materials, indoor environment, waste) with Indian examples and rating systems, then discuss the challenges of adopting it in India as a climate response. A labelled sketch of a green building helps.
Green architecture is the design, construction and operation of buildings that minimise energy, water and material use and environmental impact over their life cycle while keeping occupants healthy. Since buildings use over 30% of India's electricity (Bureau of Energy Efficiency), it is central to climate mitigation and adaptation.
Principles: (i) Climate-responsive passive design: orientation, shading, courtyards, jaalis, thick walls and cross-ventilation, drawing on vernacular forms such as Jaisalmer's havelis and Laurie Baker's low-cost brick buildings in Kerala. (ii) Energy efficiency and renewable energy: insulation, efficient lighting and cooling, rooftop solar. (iii) Water conservation: rainwater harvesting, low-flow fixtures and wastewater recycling. (iv) Low-carbon, local and recycled materials such as fly-ash bricks and bamboo. (v) Healthy indoor environment through daylight and ventilation. (vi) Site protection and waste reduction.
Indian framework and examples: the Energy Conservation Building Code (2007, revised 2017) and Eco-Niwas Samhita (2018) for homes; the GRIHA rating (TERI with MNRE) and IGBC rating (CII). The CII-Sohrabji Godrej Green Business Centre in Hyderabad and the net-zero Indira Paryavaran Bhawan in New Delhi are landmarks.
Diagram: Cross-section of a green building: south-facing overhangs, rooftop solar panels, rainwater harvesting tank, courtyard with stack ventilation, green roof, and greywater recycling unit.
Challenges in India: (i) higher initial cost and lack of finance for small builders; (ii) weak adoption and enforcement of ECBC by states and municipalities; (iii) limited awareness and skilled professionals; (iv) the informal, self-built housing sector lies outside codes; (v) glass-façade designs copied from temperate countries increase cooling load; (vi) demand for air conditioning rising with heatwaves; (vii) embodied carbon of cement and steel.
With most of India's buildings of 2050 yet to be built, mandatory codes, incentives such as extra FAR for rated buildings, and revival of vernacular wisdom can make green architecture mainstream.
Example 27 (UPSC 2023, 15 marks): Poor quality of urban planning in India is a huge constraint in realizing the true economic potentials of urbanization. Critically examine.
Paper and question: Paper II, Q4(b)
Approach: Critically examine how weaknesses in urban planning (capacity, outdated master plans, land use, infrastructure, governance) limit the economic gains of urbanisation, with data and examples, then acknowledge counterpoints and suggest reforms. A flow diagram linking planning quality to agglomeration economies helps.
Cities generate agglomeration economies: larger markets, labour pooling and knowledge spillovers. Indian cities produce a large share of GDP, yet poor planning means India captures less of this potential than East Asian economies did.
How poor planning constrains growth: (i) Capacity: NITI Aayog (2021) found about 65% of 7,933 urban settlements had no master plan and a severe shortage of town planners. (ii) Restrictive land use and low FAR raise land and housing costs, pushing firms and workers to the fringe. (iii) Congestion and long commutes reduce effective labour market size in Bengaluru and Mumbai. (iv) Infrastructure deficits in water, power and drainage; urban floods (Chennai 2015, Bengaluru 2022) disrupt IT and industry. (v) Informal, unplanned growth (6.55 crore slum dwellers, 2011) lowers productivity and health. (vi) Weak municipal finance: own revenue about 1% of GDP (RBI, 2022), so cities cannot invest.
Diagram: Flow chart: weak planning → high land cost, congestion, poor services → lower agglomeration benefits → slower productivity and job growth.
Counterpoints: cities such as Surat, Indore and Ahmedabad's town planning schemes show that good planning yields results; economic potential is also limited by skills and industrial policy, not planning alone.
Reforms: GIS master plans for all towns, land pooling, transit-oriented development, empowered mayors and municipal bonds, as recommended by NITI Aayog (2021).
Example 28 (UPSC 2023, 10 marks): Urban built environment in big cities of India creates key changes in biophysical character of the landscape. Discuss.
Paper and question: Paper II, Q5(b)
Approach: Discuss how the urban built environment changes the biophysical elements of the landscape (land surface, hydrology, climate, vegetation and biodiversity, soils) with Indian city examples, and end with a remedy. A diagram comparing the water balance before and after urbanisation helps.
The built environment of buildings, roads and paved surfaces replaces the natural cover of soil, vegetation and water, transforming the biophysical character of the urban landscape.
Hydrology: impervious surfaces cut infiltration and raise surface runoff, so peak flows rise and groundwater recharge falls; encroached drains and lakes caused floods in Mumbai (2005), Chennai (2015) and Bengaluru (2022).
Climate: concrete and asphalt store heat and reduce evaporation, creating urban heat islands in Delhi and Ahmedabad; tall buildings alter wind flow.
Vegetation and biodiversity: IISc studies by T.V. Ramachandra record a large loss of lakes and tree cover in Bengaluru as built-up area multiplied since the 1970s; mangroves in Mumbai and wetlands such as Pallikaranai in Chennai have shrunk.
Soils and landforms: soil sealing, cutting of hills in Guwahati and the Aravallis, and reclamation of creeks.
Diagram: Two water-balance bars: natural cover (high infiltration and evapotranspiration, low runoff) against urban cover (low infiltration, high runoff).
Blue-green infrastructure, sponge-city design and protection of wetlands can restore part of these functions.
Example 29 (UPSC 2021, 15 marks): Critically examine the importance of Smart Cities Programme for solving urban problems in India.
Paper and question: Paper II, Q3(b)
Approach: Explain the objectives, strategy and achievements of the Smart Cities Mission with data, then critically examine how far it has solved urban problems, and conclude with lessons. A map of selected smart cities helps.
The Smart Cities Mission, launched on 25 June 2015 by the Ministry of Housing and Urban Affairs, selected 100 cities through a competition to provide core infrastructure, a clean environment and a decent quality of life through 'smart solutions'.
Strategy: area-based development (retrofitting, redevelopment or greenfield) in a part of each city, plus pan-city ICT solutions, implemented by special purpose vehicles. The mission formally ended on 31 March 2025; MoHUA reported about 7,790 of 8,064 projects completed by 31 March 2026.
Importance and achievements: Integrated Command and Control Centres in all 100 cities proved useful for traffic, policing and COVID-19 tracking; projects such as Indore's waste management, Pune's cycle plan, Surat's flood warning and Bhubaneswar's town centre improved services; it encouraged data-driven governance and urban competition.
Critical examination: (i) area-based projects covered a small part of each city, deepening intra-city inequality; (ii) SPVs bypassed elected councils, weakening the 74th Amendment; (iii) emphasis on technology over basic needs such as sewerage, housing and drainage; (iv) slow progress in early years and dependence on central funds; (v) little effect on slums and the informal sector.
Map: Outline map of India marking selected smart cities such as Bhubaneswar, Pune, Surat, Indore, Jaipur and Kochi.
Thus the mission improved selected areas and governance tools but cannot alone solve urban problems; it must be integrated with AMRUT 2.0, PMAY-U and strong municipalities.
Example 30 (UPSC 2017, 10 marks): Small towns in India have problems and prospects of their own. Elaborate.
Paper and question: Paper II, Q1(d)
Approach: Explain the role and problems of small towns (infrastructure, economy, planning, finance), then their prospects (rural-urban linkage, agro-processing, decongesting metros) with examples and schemes, and conclude. A diagram of the urban hierarchy helps.
Small towns, generally those below 50,000 people (Census size Classes III–VI) and including the 3,894 census towns of 2011, form the link between villages and large cities in India's urban hierarchy.
Problems: (i) poor water supply, sewerage and roads; many census towns are still governed as villages by panchayats; (ii) weak economic base dependent on trade and agriculture, causing out-migration of youth to metros; (iii) absence of master plans and town planners (NITI Aayog, 2021); (iv) meagre municipal finance; (v) central schemes such as JNNURM favoured big cities, while the earlier Integrated Development of Small and Medium Towns (1979–80) had limited funds.
Prospects: (i) agro-processing and market centres (Rajkot, Erode-type mandis) under food processing schemes; (ii) growth centres that diffuse development to rural hinterlands; (iii) cluster industries (Moradabad brassware, Panipat textiles); (iv) decongesting metros as digital connectivity spreads; (v) coverage under AMRUT 2.0 for all statutory towns and the Rurban Mission.
Diagram: Urban hierarchy pyramid: metros at top, Class I cities, medium towns, small towns and census towns, and villages at the base, with arrows of goods and services.
Strengthening small towns can balance India's urbanisation and reduce pressure on metros.
Example 31 (UPSC 2016, 20 marks): Describe the causes and effects of urbanization in India and explain its impact on rural landscape and urban ecology.
Paper and question: Paper II, Q8(a)
Approach: Describe the causes of urbanisation in India with data, its effects, and then specifically its impact on the rural landscape and on urban ecology, with examples, ending with a balanced conclusion. Draw a map of levels of urbanisation by state.
Urbanisation is the rise in the share of population living in urban areas. India's urban population was 37.7 crore or 31.1% in 2011 (Census), up from 17.3% in 1951, and is projected to reach about 39% by 2036 (Technical Group on Population Projections, 2020).
Causes: (i) natural increase in towns; (ii) rural-urban migration driven by agrarian distress, small holdings and the pull of jobs; (iii) reclassification of large villages as census towns, which rose from 1,362 (2001) to 3,894 (2011); (iv) expansion of city boundaries; (v) post-1991 growth of industry and services, and infrastructure such as highways and SEZs.
Effects: higher incomes, services and social mobility, but also slums (6.55 crore, 2011), congestion and strain on services.
Impact on the rural landscape: conversion of farmland at the fringe; peri-urbanisation with brick kilns, warehouses and plotted colonies; remittances changing village housing to pucca forms; commuting and urban lifestyles diffusing into villages; and feminisation of agriculture as men migrate, as in Bihar and eastern Uttar Pradesh.
Impact on urban ecology: loss of lakes and green cover (Bengaluru), encroachment of floodplains (Yamuna, Mithi), urban heat islands, air pollution (131 non-attainment cities under the National Clean Air Programme, 2019), groundwater depletion, untreated sewage and landfills.
Map: Outline map of India shading states by level of urbanisation in 2011: above 45% (Goa, Mizoram, Tamil Nadu, Kerala, Maharashtra), 30–45%, and below 20% (Himachal Pradesh, Bihar, Assam, Odisha).
Urbanisation is an engine of growth, but it must be planned, compact and ecologically sensitive, linking cities with their rural hinterlands through programmes such as the Rurban Mission and AMRUT 2.0.
Example 32 (UPSC 2014, 10 marks): Analyse the feasibility of 'Smart Towns' Development in India.
Paper and question: Paper II, Q5(c)
Approach: Explain the concept of smart towns, then analyse feasibility by weighing enabling factors (digital growth, policy, investment) against constraints (finance, capacity, land, basic deficits, inclusion), with examples, and give a reasoned verdict. A diagram of smart town components helps.
A smart town uses digital technology and data, together with efficient infrastructure, to deliver services such as water, power, mobility and governance sustainably and inclusively. The idea gained momentum in 2014 and led to the Smart Cities Mission of June 2015.
Enabling factors: rapid growth of mobile and internet use; e-governance experience; greenfield models such as GIFT City and Dholera in Gujarat and Lavasa near Pune; investor interest; and the need to plan for rising urban population (31.1% in 2011).
Constraints: (i) huge basic deficits in water, sewerage and housing must be met first; (ii) weak municipal finance and capacity; (iii) costly, contested land acquisition; (iv) risk of elite enclaves excluding the poor and the informal sector; (v) data privacy and cyber security; (vi) maintenance of technology in small towns.
Diagram: Wheel diagram of smart town components: smart governance, mobility, water and energy, environment, economy and people, around an integrated command centre.
Smart towns are feasible if they are phased, retrofit existing towns, fund basics first and keep citizens at the centre.
Mains points
- Urban questions dominate: slums, conurbations, sprawl and peri-urbanisation appear almost every year, so keep Census 2011 data (31.1% urban, 53 million-plus UAs, 6.55 crore slum dwellers, 3,894 census towns) at your fingertips.
- Examiners reward named Indian examples: NCR, Mumbai Metropolitan Region, Dharavi, Chandigarh, Gurugram, Bengaluru lakes, Chennai floods, not generic 'big cities'.
- Attribute concepts correctly: conurbation (Geddes, 1915), dual city (A.D. King, 1976), generative and parasitic towns (Hoselitz, 1955), functional classification (Harris 1943, Nelson 1955, Asok Mitra 1961), rural-urban fringe (Wehrwein, 1942).
- Link problems to current schemes with years: Smart Cities Mission (2015–2025), AMRUT 2.0 (2021), PMAY-U 2.0 (2024), NCAP (2019), TOD Policy (2017), PM-eBus Sewa (2023), and assess them critically.
- A sketch of city structure, a sprawl diagram or an India map of conurbations and urbanisation levels lifts the score; end with a balanced, forward-looking conclusion.
Did you know?
- Chandigarh was first planned by the American Albert Mayer with Matthew Nowicki; after Nowicki died in a plane crash in 1950, Le Corbusier took over and reshaped the plan into the sector grid we know today.
Geography Optional: All chapters
- Exam Pattern, Syllabus and Strategy
- The Earth's Interior and Tectonics
- Geomorphic Processes and Landscape Development
- Climatology: Atmosphere and Circulation
- Climatology: Weather Systems, Climates and Climate Change
- Oceanography
- Biogeography
- Environmental Geography
- Perspectives in Human Geography
- Economic Geography
- Population Geography
- Settlement Geography
- Regional Planning
- Models, Theories and Laws in Human Geography
- India: Physical Setting I
- India: Physical Setting II
- Resources of India
- Agriculture in India
- Industry in India
- Transport, Communication and Trade
- Cultural Setting and Population of India
- Settlements in India
- Regional Development and Planning in India
- Political Aspects
- Contemporary Issues
- Places for the Map Question