
Geography Optional · UPSC Notes
Agriculture in India — UPSC Geography Optional Notes
Free, exam-focused notes for UPSC Prelims and Mains, with Prelims tips and Mains points for every topic. 6 topics.
Open in the interactive reader: bookmarks, progress tracking and read-aloud.
Agricultural Infrastructure and Institutional Factors
Indian agriculture depends on infrastructure (irrigation, quality seeds, fertilisers, farm power, credit, markets and storage) and on institutional factors (size of land holdings, tenure and land reforms). About half of the net sown area is irrigated, mainly by tube wells, while the average operational holding was only 1.08 ha in the Agriculture Census 2015–16, with 86% of holdings small or marginal. Colonial zamindari, ryotwari and mahalwari systems shaped tenure; post-1947 land reforms abolished intermediaries but had uneven success with ceilings and tenancy.
In simple words
Farming needs both tools and rules.
Tools are the infrastructure: water from canals and tube wells, good seeds, fertiliser, electricity, tractors and markets.
Rules are the institutions: who owns the land, how big the farm is and whether the tiller has secure rights.
A farmer with a tiny plot and no water is like a cook with a small stove and no gas, so UPSC asks how infrastructure and land institutions shape productivity and equity.
1. Concepts and Definitions
Agricultural infrastructure: physical and economic inputs and facilities that support farming: irrigation, seeds, fertilisers, farm power and machinery, rural electricity, roads, credit, storage, markets and extension.
Institutional factors: the social and legal arrangements governing land and labour: ownership, tenancy, size and fragmentation of holdings, land records and land reforms.
Operational holding (Agriculture Census): all land used wholly or partly for agricultural production and operated as one technical unit by one person alone or with others; size classes: marginal (below 1 ha), small (1–2 ha), semi-medium (2–4 ha), medium (4–10 ha) and large (10 ha and above).
Land tenure: the terms on which land is held: owner cultivation, tenancy (fixed rent, share-cropping), and customary or community tenure (common in the North-East).
Land reforms: state measures to redistribute land rights for equity and productivity: abolition of intermediaries, tenancy reform, ceilings on holdings, consolidation and updating of land records.
2. Irrigation
Extent: net irrigated area was about 79.3 million ha in 2022–23 (Land Use Statistics), a little over half of net sown area; Punjab and Haryana have well over 90% of cropped area irrigated, while Maharashtra, Karnataka, Rajasthan and the North-East have low shares.
Sources: tube wells and other wells irrigate over 60% of net irrigated area, canals about a quarter, tanks a small and declining share, and other sources the rest; the shift from canals and tanks to groundwater has been the main trend since the 1970s.
Regional pattern: canals dominate in the Indus–Ganga plains (Bhakra, Western and Eastern Yamuna, Upper Ganga, Sharda canals) and deltas; tanks in the hard-rock Peninsula (Telangana, Tamil Nadu, Karnataka); wells and tube wells in alluvial plains and Gujarat.
Programmes: Pradhan Mantri Krishi Sinchayee Yojana (2015) with 'Har Khet Ko Pani' and 'Per Drop More Crop' (micro-irrigation); Accelerated Irrigation Benefit Programme; Command Area Development; PM-KUSUM (2019) for solar pumps.
3. Seeds, Fertilisers and Farm Power
Seeds: high-yielding varieties drove the Green Revolution; institutions include the National Seeds Corporation (1963), the Seeds Act 1966 and the Protection of Plant Varieties and Farmers' Rights Act 2001; Bt cotton (2002) is the only GM crop in wide commercial use; GM mustard (DMH-11) received environmental release approval in 2022 but its status is before the Supreme Court; ICAR released two genome-edited rice varieties in May 2025.
Fertilisers: consumption rose sharply after the 1960s; the recommended N:P:K ratio is about 4:2:1, but use is skewed towards nitrogen (urea), especially in Punjab, Haryana and western Uttar Pradesh; policies include the Nutrient Based Subsidy (2010), neem-coated urea (2015), Soil Health Cards (2015) and nano urea (2021).
Farm power and mechanisation: tractors, power tillers, combine harvesters and electric pumps; mechanisation is high in Punjab and Haryana and low in hilly and eastern states; custom hiring centres help small farmers.
Credit, markets and storage: Kisan Credit Card (1998), Agriculture Infrastructure Fund (2020), e-NAM (2016), Farmer Producer Organisations (10,000 FPO scheme, 2020) and the Digital Agriculture Mission with Agri Stack (2024).
4. Land Holdings
Agriculture Census 2015–16: about 146.45 million operational holdings; average size 1.08 ha (down from 2.28 ha in 1970–71); marginal holdings about 68.5% and small about 17.6%, together about 86% of holdings but only about 47% of operated area.
11th Agriculture Census (2021–22): fieldwork, using digital collection for the first time, has been completed (Ministry of Agriculture, July 2026), but national results were not yet published at the time of writing; use 2015–16 figures with their year.
Fragmentation: inheritance laws divide land among heirs, producing tiny, scattered plots that raise costs and make mechanisation and irrigation difficult.
Regional variation: average holdings are larger in Rajasthan, Punjab and Nagaland and smallest in Kerala, Bihar, West Bengal and Uttar Pradesh.
5. Land Tenure Systems
Zamindari (Permanent Settlement, 1793, Lord Cornwallis): Bengal, Bihar, Odisha and parts of Uttar Pradesh; zamindars collected revenue fixed in perpetuity, leaving cultivators insecure and investment low.
Ryotwari (Thomas Munro and Alexander Read, from the 1790s, extended in the 1820s): Madras and Bombay presidencies; revenue settled directly with cultivators (ryots), periodically revised.
Mahalwari (Holt Mackenzie, 1822): north-western provinces and Punjab; revenue settled with village communities (mahals).
Legacy: regions under zamindari (eastern India) show lower agricultural investment and productivity than ryotwari areas, a finding associated with Banerjee and Iyer (2005); the causal interpretation is debated.
6. Land Reforms
Abolition of intermediaries (1950s): zamindari abolition acts in all states; largely successful, bringing about 20 million tenants into direct contact with the state.
Tenancy reforms: regulation of rent, security of tenure, ownership rights; Operation Barga in West Bengal (1978) registered sharecroppers; in many states tenancy went underground (concealed tenancy).
Ceilings on holdings: limits fixed in the 1960s and revised in 1972; surplus land distributed was small relative to estimates because of benami transfers and litigation.
Consolidation of holdings: most successful in Punjab, Haryana and western Uttar Pradesh, helping tube well irrigation and the Green Revolution.
Bhoodan and Gramdan (Vinoba Bhave, from 1951): voluntary land gifts, starting at Pochampally (Telangana).
Recent reforms: Digital India Land Records Modernisation Programme (2008, renamed 2016), SVAMITVA (2020) for rural property cards, Unique Land Parcel Identification Number (Bhu-Aadhaar), and the NITI Aayog Model Agricultural Land Leasing Act (2016) to legalise and protect tenancy.
7. Theory and Debates
Farm size and productivity: the 'inverse relationship' between farm size and output per hectare (Amartya Sen, 1962, using Farm Management Studies) suggested small farms were more productive; after the Green Revolution the relationship weakened in some regions; it remains debated.
Institutional vs technological path: Daniel Thorner and P.C. Joshi stressed institutional barriers (semi-feudalism); the Green Revolution strategy prioritised technology in irrigated areas; many scholars argue both are needed.
Groundwater–energy nexus: free or flat-rate power for farm pumps (Punjab, Telangana) increases irrigation but depletes aquifers (Tushaar Shah's work on the 'energy–irrigation nexus').
Fertiliser subsidy debate: urea's low controlled price encourages overuse of nitrogen and soil imbalance; direct benefit transfer and nutrient-based pricing are proposed alternatives.
Land leasing: legal leasing can raise efficiency and let landowners migrate safely, but critics fear it may weaken tenant protection.
8. Maps and Diagrams to Draw
Irrigation map: shade states by percentage of net sown area irrigated; mark major canal systems (Bhakra, Indira Gandhi, Upper Ganga, Sharda, Nagarjuna Sagar, Krishna and Godavari delta canals) and tank regions.
Bar chart: number vs area share of marginal, small, semi-medium, medium and large holdings (Agriculture Census 2015–16).
Tenure map: outline British India showing zamindari (east), ryotwari (south and west) and mahalwari (north-west) zones.
Flow chart: small holdings → low investment and credit access → low mechanisation → low productivity → poverty, with breakpoints such as FPOs, leasing and consolidation.
9. Using It in the Exam
10 marks: sources of irrigation and their regional pattern, with a map.
15 marks: land holdings and fragmentation, with census data and consequences.
20 marks: land reforms: objectives, components, regional success (West Bengal, Kerala, Punjab consolidation), failures (ceilings), and new digital reforms, with an evaluation.
Keywords: operational holding, fragmentation, concealed tenancy, Operation Barga, consolidation, micro-irrigation, NPK balance, land records digitisation.
Attributed idea: Banerjee and Iyer (2005) linked colonial landlord-based revenue systems to lower agricultural investment and productivity after independence.
| Size class | Size range | Share of holdings | Share of area |
|---|---|---|---|
| Marginal | Below 1 ha | About 68.5% | About 24% |
| Small | 1–2 ha | About 17.6% | About 23% |
| Semi-medium | 2–4 ha | About 9.5% | About 24% |
| Medium | 4–10 ha | About 3.8% | About 20% |
| Large | 10 ha and above | About 0.6% | About 9% |
| All holdings | Average 1.08 ha | About 146.45 million | About 157.8 million ha |
Mains points
- Questions ask about the role of irrigation, fertiliser imbalance, land holdings and fragmentation, or the success and failure of land reforms.
- Always quote Agriculture Census 2015–16 figures with the year and note that the 2021–22 census results are awaited.
- Show regional contrasts with maps: irrigation intensity, tenure history (zamindari vs ryotwari), consolidation success in Punjab–Haryana.
- Evaluate land reforms component-wise and cite case studies (Operation Barga, Kerala's land reforms, Bhoodan).
- Add current institutional reforms (DILRMP, SVAMITVA, Bhu-Aadhaar, Agri Stack, Model Land Leasing Act 2016) to show awareness.
- Common mistake: treating infrastructure and institutions separately; show how they interact (small holdings limit access to irrigation and credit).
Did you know?
- Memory trick for tenure systems: 'Cornwallis Zamindari 1793, Munro Ryotwari, Mackenzie Mahalwari 1822' — Z-R-M runs east to south to north-west.
Cropping Pattern, Productivity, Intensity, Crop Combination and Land Capability
The cropping pattern is the proportion of area under different crops at a point of time; in India cereals dominate, but the pattern is shifting towards maize, oilseeds, pulses and horticulture. Geographers measure agricultural productivity with indices by Kendall (1939), Enyedi (1964) and Bhatia (1967), cropping intensity as gross cropped area over net sown area (about 156% in 2022–23), and crop combination with Weaver's (1954) and Doi's (1959) methods. Land capability classification (USDA, eight classes) guides how each parcel should be used.
In simple words
Imagine a farmer's field as a plate: the cropping pattern tells which foods are on the plate and in what share.
Productivity tells how much each hectare yields, intensity tells how many times a year the plate is filled, and crop combination tells which crops usually appear together.
Land capability is a health check of land, saying which plots are fit for crops, grazing or forest.
UPSC asks you to measure and map these and explain regional differences.
1. Concepts and Definitions
Cropping pattern: the proportion of area under various crops at a given time; it changes with physical (climate, soil, water), economic (prices, markets, MSP, input costs), technological (seeds, irrigation) and institutional (holding size, tenure, policy) factors.
Cropping system: the order and combination of crops grown on a field over time (sequential, mixed, intercropping, relay cropping), e.g. rice–wheat in the Indo-Gangetic plains, cotton–wheat in Punjab and Haryana, rice–rice in the deltas.
Agricultural productivity: output per unit of input, usually per hectare (land productivity); agricultural efficiency is a broader concept covering all inputs.
Cropping intensity: (gross cropped area ÷ net sown area) × 100; it shows how many times the same land is cropped in a year.
Crop combination: the group of crops that together dominate an area, identified statistically from percentage shares of cropped area.
Land capability: the inherent capacity of land to sustain use without degradation, based on soil, slope, erosion, drainage and climate.
2. Cropping Pattern in India
Area shares: foodgrains occupy roughly three-fifths of gross cropped area; rice has the largest area, followed by wheat; oilseeds, pulses, cotton, sugarcane and horticulture make up most of the rest.
Production 2025–26: record foodgrain output of 376.56 million tonnes (Third Advance Estimates, Ministry of Agriculture, May 2026), with rice about 154.0 MT, wheat about 120.7 MT and maize a record 55.1 MT.
Regional patterns: rice in the eastern and southern deltas, Assam, West Bengal, Punjab–Haryana (irrigated); wheat in Punjab, Haryana, Uttar Pradesh and Madhya Pradesh; cotton on black soils of Maharashtra, Gujarat and Telangana; sugarcane in Uttar Pradesh and Maharashtra; pulses in Madhya Pradesh, Rajasthan and Maharashtra; millets in Rajasthan and Karnataka.
Trends: diversification towards maize (poultry feed, ethanol), soybean in Madhya Pradesh and Maharashtra, horticulture (fruits and vegetables now exceed foodgrains in tonnage), and away from coarse cereals; the International Year of Millets (2023) aimed to revive millets.
Problems: rice–wheat monoculture in the north-west depletes groundwater and causes residue burning; sugarcane in water-scarce Maharashtra; diversification programmes in Punjab and Haryana have had limited success.
3. Measuring Agricultural Productivity
Kendall's ranking coefficient (Kendall, 1939): rank each areal unit by yield per hectare of selected crops, then average the ranks; a lower average rank means higher productivity.
Enyedi's index (Enyedi, 1964): the ratio of yield in a unit to the national (or regional) yield for each crop, weighted by area; values above 100 indicate above-average productivity.
Bhatia's index (Bhatia, 1967): yield indices weighted by the share of each crop in cropped area, applied to Indian districts.
Other approaches: Shafi's productivity index and composite indices of agricultural development used in Indian studies; value of output per hectare (prices) allows comparison across crops.
Indian pattern: high productivity in Punjab, Haryana, western Uttar Pradesh, coastal Andhra Pradesh and Tamil Nadu deltas; low productivity in rain-fed central India, Rajasthan, Odisha interior and the North-East; yield gaps compared with China or world averages remain large for pulses and oilseeds.
4. Cropping Intensity
National level: gross cropped area about 219.4 Mha and net sown area about 140.7 Mha in 2022–23 give a cropping intensity of about 156% (calculated from Land Use Statistics).
High intensity: Punjab and Haryana (around 180–190%), West Bengal, Bihar and Tripura, where irrigation, short-duration varieties and labour availability allow two or three crops.
Low intensity: Rajasthan, Gujarat, Maharashtra, Karnataka and much of the rain-fed Deccan, where a single kharif crop is common.
Determinants: assured irrigation, soil moisture, short-duration varieties, mechanisation, credit, market access and labour; raising intensity is a key strategy because net sown area cannot grow much.
5. Crop Combination and Concentration
Weaver's method (Weaver, 1954, Middle West USA): compare the actual percentage shares of crops with theoretical distributions (100% for one crop, 50–50 for two, 33.3 each for three and so on), compute variance for each combination, and choose the combination with the least variance.
Doi's method (Doi, 1959, Japan): a simplified version using the sum of squared differences with a ready reference table, faster for large datasets.
Modifications: Thomas (1963) included all crops; Rafiullah's 'maximum positive deviation' method has been used widely for Indian districts; Weaver tends to give too many crops in a combination in diversified regions.
Crop concentration: the location quotient method (used by S.S. Bhatia, 1965) compares a crop's share in a district with its share nationally; values above 1 show concentration (e.g. cotton in Vidarbha, sugarcane in western Uttar Pradesh).
Crop diversification: measured by the Gibbs and Martin index (1962) or entropy and Herfindahl indices; higher diversification lowers risk for rain-fed farmers.
Indian results: two-crop combinations such as rice–wheat dominate Punjab and Haryana; single-crop rice dominates the eastern deltas and Assam; multi-crop combinations (jowar–bajra–pulses–cotton) characterise the Deccan.
6. Land Capability Classification
USDA system (Klingebiel and Montgomery, 1961): eight classes: I–IV suited to cultivation with increasing limitations; V–VII suited to pasture, grazing or forestry; VIII only for wildlife, recreation or watershed protection; subclasses indicate limitations (e for erosion, w for wetness, s for soil, c for climate).
Use in India: the All India Soil and Land Use Survey and ICAR–NBSS&LUP use capability classes in watershed planning and soil survey reports; much of the Himalaya and degraded uplands fall in classes VI–VIII.
Land suitability (FAO framework, 1976): rates land as highly, moderately or marginally suitable or not suitable for a specific use, complementing capability classes.
Planning value: matching use to capability prevents erosion, e.g. converting class VII slopes under cultivation in the North-East back to forest or horticulture.
7. Theory and Debates
Determinism vs economics: early studies emphasised physical controls on cropping, while later work (e.g. Raj Krishna on price response in Punjab, 1963) showed that farmers respond strongly to prices and MSP, which explains rice and wheat dominance.
Measurement problems: yield-based indices ignore input costs and environmental damage; value-based indices depend on prices; scholars argue for total factor productivity and sustainability-adjusted measures.
Statistical choices: Weaver's method is sensitive to the number of crops considered; results differ by method, so authors must state the method used.
Intensification vs sustainability: high cropping intensity in Punjab has brought groundwater decline and soil degradation, raising the question of 'optimal' rather than maximum intensity.
8. Maps and Diagrams to Draw
Cropping intensity map: choropleth of states or districts with classes above 175%, 150–175%, 125–150% and below 125%.
Crop combination map: label regions with dominant combinations (e.g. R–W in Punjab, R in West Bengal, C–J–P in Vidarbha) using Weaver or Doi results.
Productivity map: high, medium and low productivity regions using Enyedi or Bhatia indices.
Weaver worked example: a small table with three crops' percentages, theoretical values and variance to show how the least-variance combination is chosen.
Land capability diagram: a hill-slope profile showing class I on the valley floor, classes III–IV on gentle slopes, VI–VII on steep slopes and VIII on rocky ridges.
9. Using It in the Exam
10 marks: define and compute cropping intensity with latest data, or explain Weaver's method in steps.
15 marks: determinants of cropping pattern and its changing trends in India with examples.
20 marks: measurement of agricultural productivity (Kendall, Enyedi, Bhatia), regional pattern with a map and causes, or land capability classification and its role in planning.
Keywords: cropping pattern, cropping system, cropping intensity, Kendall ranking, Enyedi index, Weaver's least variance, location quotient, land capability classes.
Attributed idea: Weaver's crop combination method (1954) chooses the crop group whose actual shares deviate least from a theoretical even distribution.
| Measure | Method and author | Basis | Limitation |
|---|---|---|---|
| Productivity | Ranking coefficient, Kendall (1939) | Average rank of yields | Ignores magnitude of differences |
| Productivity | Yield index, Enyedi (1964) | Local yield ÷ national yield, area-weighted | Depends on choice of crops |
| Crop combination | Least variance, Weaver (1954) | Actual vs theoretical shares | Too many crops in diverse areas |
| Crop combination | Doi (1959) | Sum of squared deviations with table | Similar sensitivity to crop list |
| Concentration | Location quotient, Bhatia (1965) | Local share ÷ national share | Relative, not absolute |
| Land capability | USDA classes, Klingebiel and Montgomery (1961) | Soil, slope, erosion, wetness | Not crop-specific |
Mains points
- Questions may ask for a method (Weaver, Kendall, Enyedi), its application to India, or the determinants and trends of cropping patterns.
- Explain methods step by step with a tiny worked example; examiners reward procedural clarity.
- Use latest data: foodgrains 376.56 MT (2025–26, 3rd AE), cropping intensity about 156% (2022–23, computed from Land Use Statistics).
- Draw maps of cropping intensity, crop combinations or productivity regions with a clear legend.
- Discuss limitations of each method and the sustainability angle (rice–wheat, groundwater, residue burning).
- Common mistake: confusing cropping pattern (area shares) with cropping system (sequence of crops).
Did you know?
- Weaver devised his crop combination method for the American Middle West, yet it became one of the most widely used techniques in Indian district-level agricultural geography.
Green Revolution and Dry Farming
The Green Revolution (from 1966–67) combined high-yielding varieties of wheat and rice with irrigation, fertilisers, credit and assured prices, turning India from a food-deficit to a food-surplus country. It concentrated gains in irrigated Punjab, Haryana and western Uttar Pradesh, widened regional and interpersonal inequalities and left an ecological legacy of groundwater depletion, soil degradation and residue burning. Dry farming in rain-fed areas, which still cover about half of the net sown area, is essential for pulses, oilseeds, millets and livelihoods, and is the focus of a 'second' and more inclusive green revolution.
In simple words
In the 1960s India was importing food grain to avoid hunger.
New dwarf wheat and rice seeds, plus water, fertiliser and fair prices, made harvests jump: this was the Green Revolution.
It worked best where canals and tube wells existed, like Punjab, and it later caused falling water tables and tired soils.
Dry farming is growing crops with little rain by saving every drop, and UPSC asks about both the gains and costs of the Green Revolution and how to help dry regions.
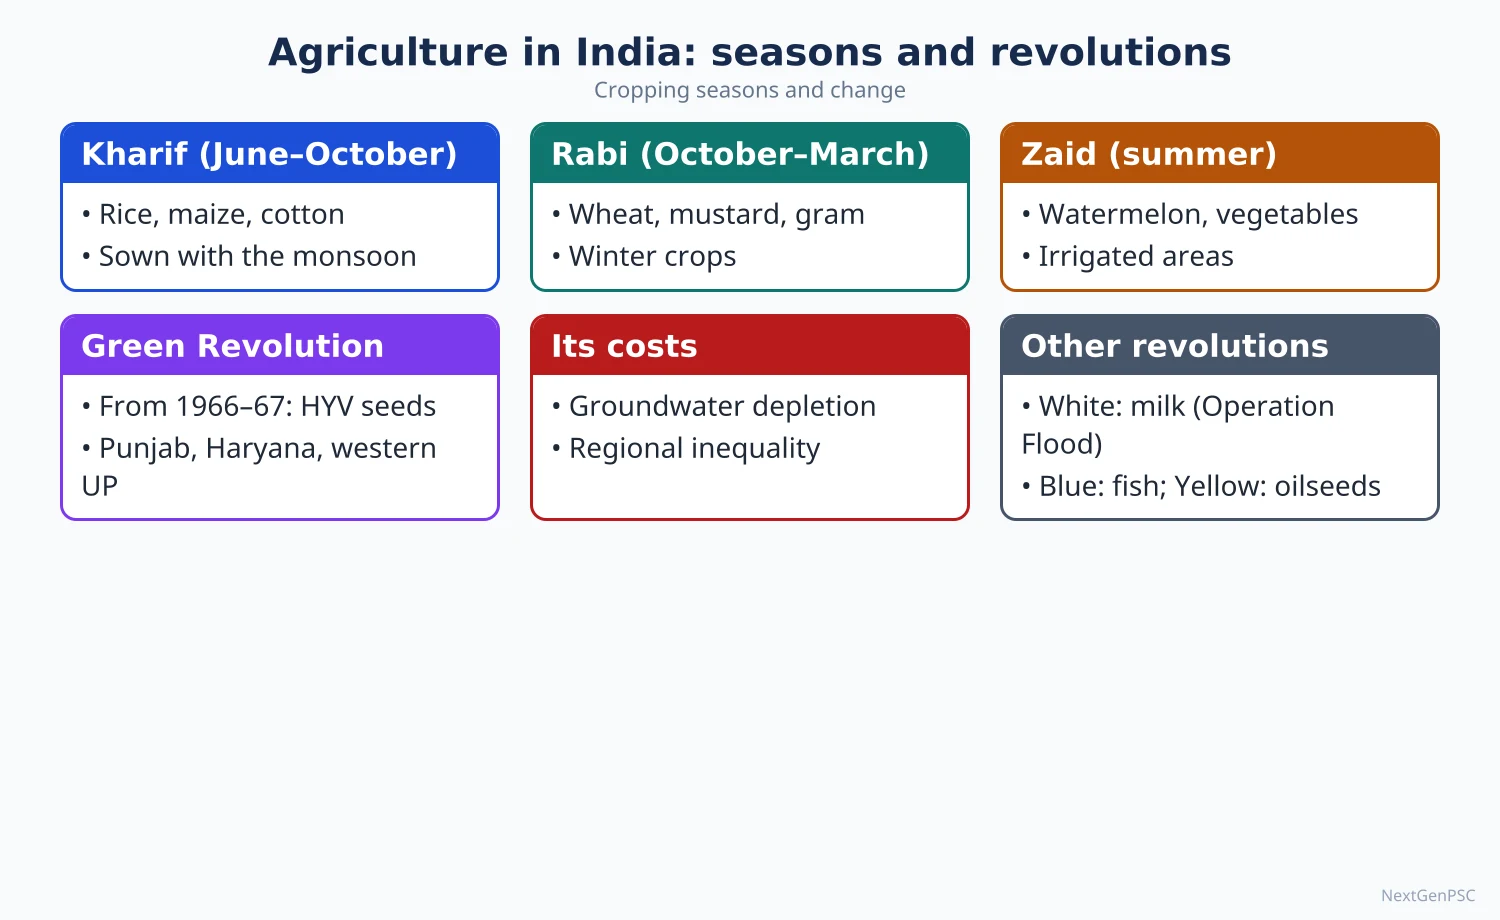
1. Concepts and Definitions
Green Revolution: the rapid increase in cereal yields from the mid-1960s through a package of high-yielding varieties (HYVs), assured irrigation, chemical fertilisers, pesticides, credit, minimum support prices and procurement; the term was used by William Gaud of USAID in 1968.
HYV seeds: semi-dwarf wheat developed by Norman Borlaug at CIMMYT, Mexico (Nobel Peace Prize 1970), and rice IR-8 from IRRI, Philippines; adapted in India under M.S. Swaminathan with political backing from C. Subramaniam.
Dry farming: cultivation in areas receiving less than about 750 mm of annual rainfall without irrigation, relying on moisture conservation; dryland farming is sometimes used for 750–1,150 mm areas and rainfed farming for areas above that, though usage varies.
Rainfed agriculture: about half of India's net sown area remains rainfed (National Rainfed Area Authority estimates), producing most of the coarse cereals, pulses, oilseeds and cotton.
2. Strategy and Spread of the Green Revolution
Background: droughts of 1965 and 1966, dependence on US PL-480 wheat imports and the Bengal-famine memory led to a new agricultural strategy.
Programmes: Intensive Agricultural District Programme (IADP, 1960–61, initially seven districts), Intensive Agricultural Areas Programme (IAAP, 1964), High Yielding Varieties Programme (1966–67); support from the Food Corporation of India and Agricultural Prices Commission (both 1965).
Spatial spread: first in Punjab, Haryana and western Uttar Pradesh (wheat), then irrigated rice areas of coastal Andhra Pradesh and Tamil Nadu; it reached eastern India (Bihar, Odisha, West Bengal) much later.
Results: wheat output roughly doubled between the mid-1960s and early 1970s; India ended dependence on food aid; foodgrain production has since risen to a record 376.56 million tonnes in 2025–26 (Third Advance Estimates).
Later phases: Bringing Green Revolution to Eastern India (BGREI, 2010–11), National Food Security Mission (2007), Rashtriya Krishi Vikas Yojana (2007) and M.S. Swaminathan's call for an 'Evergreen Revolution' combining productivity with ecology.
3. Socio-economic Implications
Positive: food security and buffer stocks, rising farm incomes in core regions, growth of agro-industries, farm machinery and rural markets, demand for labour that attracted seasonal migrants from Bihar and eastern Uttar Pradesh.
Regional inequality: irrigated north-west India gained most, while rain-fed central and eastern India lagged; G.S. Bhalla and Gurmail Singh's district studies documented widening regional disparities.
Interpersonal inequality: larger farmers adopted the package faster because of credit and irrigation access; Francine Frankel (India's Green Revolution: Economic Gains and Political Costs, 1971) highlighted rising tensions; later studies showed small farmers also adopted once inputs spread, so the debate is nuanced.
Crop imbalance: wheat and rice benefited, while pulses, oilseeds and millets were neglected, contributing to later import needs (edible oils, pulses) and nutritional issues.
Mechanisation and labour: tractors and combines displaced some labour; at the same time new labour demand arose in multiple cropping.
Political economy: procurement and MSP became concentrated on wheat and rice in a few states, making crop diversification politically difficult.
4. Ecological Implications
Groundwater depletion: Punjab, Haryana and Rajasthan have a stage of groundwater extraction above 100% (DGWRA 2025); the Punjab Preservation of Subsoil Water Act 2009 delayed paddy transplanting to reduce pumping.
Soil degradation: waterlogging and salinity in canal command areas, declining soil organic carbon, micronutrient deficiencies (zinc), imbalanced NPK use.
Pesticide and health concerns: heavy pesticide use in Punjab's Malwa region has been linked in media and some studies to health problems, though causal links are debated.
Air pollution: burning of rice straw in Punjab and Haryana each October–November worsens smog in the Delhi region; Commission for Air Quality Management (2021) and in situ residue management schemes respond.
Biodiversity loss: replacement of traditional landraces by a few HYVs reduced genetic diversity; Vandana Shiva (The Violence of the Green Revolution, 1991) is a prominent critic.
5. Dry Farming
Areas: western Rajasthan, Kutch and Saurashtra, rain-shadow Maharashtra (Marathwada), north Karnataka, Rayalaseema, Telangana interior, Bundelkhand and parts of Tamil Nadu.
Significance: rain-fed areas produce most of India's pulses, oilseeds, millets and cotton; they hold large livestock populations and many of India's poorest farm households, so their development is key to inclusive growth.
Techniques: in situ moisture conservation (contour and graded bunds, ridges and furrows, mulching), deep summer ploughing, drought-tolerant crops (bajra, jowar, ragi, pulses, guar, castor), intercropping (e.g. sorghum–pigeonpea), farm ponds, watershed development, contingency crop plans, and agroforestry (khejri-based systems in Rajasthan).
Institutions and schemes: Central Arid Zone Research Institute, Jodhpur (1959), All India Coordinated Research Project on Dryland Agriculture (1970), Central Research Institute for Dryland Agriculture, Hyderabad (1985), National Rainfed Area Authority (2006), National Mission for Sustainable Agriculture (2014–15) with Rainfed Area Development, and the millet push (Shree Anna, International Year of Millets 2023).
Problems: high rainfall variability, low and uncertain yields, poor credit and insurance coverage, soil erosion and degradation, and distress migration in drought years.
6. Theory and Debates
Induced innovation (Hayami and Ruttan, 1971): technology adapts to factor scarcity; land-scarce India favoured land-saving biological and chemical technology, explaining the HYV strategy.
Diffusion of innovation (Torsten Hägerstrand, 1953): the spatial spread of HYVs from core irrigated areas outward illustrates neighbourhood and hierarchical diffusion.
Neo-Malthusian vs optimistic views: Paul Ehrlich (The Population Bomb, 1968) predicted famine in India; the Green Revolution was seen as a refutation, while critics stress its environmental limits.
Second Green Revolution: debate on whether it should rely on biotechnology and GM crops or on agro-ecology, natural farming (National Mission on Natural Farming, 2024) and rain-fed development; this remains contested.
7. Maps and Diagrams to Draw
Green Revolution core map: shade Punjab, Haryana and western Uttar Pradesh (wheat core), coastal Andhra Pradesh and Kaveri delta (rice), with arrows showing later spread eastward.
Dry farming map: shade areas with less than 75 cm annual rainfall and mark CAZRI Jodhpur and CRIDA Hyderabad.
Graph: foodgrain production from 1950–51 to 2025–26 with a sharp rise after 1966–67.
Dry farming field sketch: contour bunds, ridges and furrows, mulch, intercrop rows and a farm pond at the lowest point.
Impact web: HYV package at the centre with arrows to positive (food security, income) and negative (groundwater, inequality, residue burning) outcomes.
8. Using It in the Exam
10 marks: significance of dry farming with techniques and regions, or ecological effects of the Green Revolution.
15 marks: socio-economic implications of the Green Revolution with regional examples and data.
20 marks: critical evaluation of the Green Revolution and the need for a second, inclusive, sustainable green revolution centred on rain-fed areas, with maps.
Keywords: HYV package, regional disparity, interpersonal inequality, groundwater depletion, residue burning, moisture conservation, rain-fed areas, evergreen revolution.
Attributed idea: M.S. Swaminathan called for an 'Evergreen Revolution' that raises productivity in perpetuity without ecological harm (paraphrased).
| Dimension | Positive effects | Negative effects | Example |
|---|---|---|---|
| Production | Food self-sufficiency, buffer stocks | Neglect of pulses, oilseeds, millets | Edible oil and pulse imports |
| Regional | Prosperity in irrigated north-west | Lagging rain-fed and eastern India | Punjab vs Bundelkhand |
| Social | Higher incomes, rural markets | Gains skewed to larger farmers initially | Frankel (1971) |
| Water | Expanded irrigation | Groundwater over-exploitation | Punjab extraction above 100% (2025) |
| Soil and air | Higher input response | Salinity, nutrient imbalance, stubble burning | Delhi smog each autumn |
| Biodiversity | Uniform high-yield crops | Loss of landraces | Traditional rice varieties lost |
Mains points
- Typical questions: socio-economic and ecological implications of the Green Revolution, significance of dry farming, need for a second green revolution in eastern or rain-fed India.
- Balance gains and costs; quote scholars (Frankel, Bhalla, Shiva, Swaminathan) and current data (foodgrains 2025–26, groundwater 2025).
- Use maps to show the Green Revolution core and dry farming regions; a production graph helps.
- For dry farming, list concrete techniques and institutions (CAZRI, CRIDA, NRAA, NMSA) and link to watershed management.
- Bring theory: Hägerstrand's diffusion and Hayami–Ruttan induced innovation.
- Common mistake: describing the Green Revolution as uniformly successful across India or crops.
Did you know?
- Norman Borlaug's semi-dwarf wheat had short, stiff stems so that heavy grain heads fed by fertiliser would not make the plant fall over (lodging).
Livestock, White Revolution, Aquaculture, Sericulture, Apiculture and Poultry
India has one of the world's largest livestock populations (535.78 million in the 20th Livestock Census, 2019) and is the world's largest milk producer, with 247.87 million tonnes in 2024–25 and per capita availability of 485 g a day (Basic Animal Husbandry Statistics 2025). The White Revolution (Operation Flood, 1970–96) built a cooperative dairy network on the Anand model. Aquaculture, sericulture, apiculture and poultry diversify farm incomes; India is the second-largest producer of fish, eggs and raw silk.
In simple words
For many small farmers, a cow, a few hens or a fish pond is like a savings account that pays every day.
India became the world's top milk producer through village cooperatives, where farmers pool milk and share profits: the White Revolution.
Fish ponds, silkworms and honeybees add further income from the same small farm.
UPSC asks where these activities are concentrated, why, and how they help rural livelihoods and nutrition.
1. Concepts and Definitions
Livestock resources: domesticated animals (cattle, buffalo, sheep, goats, pigs, camels, yaks, mithun) and poultry raised for milk, meat, eggs, wool, draught power and manure.
Mixed farming: integration of crop cultivation with livestock rearing, typical of Indian smallholdings, where crop residues feed animals and dung returns to fields.
White Revolution: the rapid growth of milk production through Operation Flood (1970–1996), led by the National Dairy Development Board (NDDB, founded 1965 at Anand) under Verghese Kurien.
Aquaculture: farming of fish, prawns and other aquatic organisms in controlled conditions (ponds, tanks, cages, brackish-water farms), as opposed to capture fisheries.
Sericulture: rearing silkworms to produce raw silk; apiculture: beekeeping for honey and wax; poultry: rearing chickens, ducks and other birds for eggs and meat.
Colour revolutions (popular labels): White (milk), Blue (fisheries), Golden fibre (jute), Silver (eggs), Sweet (honey), Pink (meat, sometimes onion).
2. Livestock Resources
20th Livestock Census (2019): total livestock 535.78 million; cattle about 192.5 million, buffaloes about 109.9 million, goats about 148.9 million, sheep about 74.3 million, pigs about 9.1 million; poultry about 851.8 million.
21st Livestock Census: enumeration was conducted from late 2024 into 2025 with digital tools; national results had not been released at the time of writing, so quote 2019 data with its year.
Distribution: cattle are widespread, with large numbers in Uttar Pradesh, Madhya Pradesh, West Bengal and Rajasthan; buffaloes in Uttar Pradesh, Rajasthan, Gujarat and Punjab; sheep in Rajasthan, Telangana, Andhra Pradesh and Karnataka; goats in Rajasthan, West Bengal and Uttar Pradesh; camels in Rajasthan; yaks and mithun in the Himalaya and North-East.
Breeds: indigenous cattle such as Gir and Kankrej (Gujarat), Sahiwal (Punjab), Red Sindhi, Tharparkar and Rathi (Rajasthan), Ongole (Andhra Pradesh), Hallikar and Amrit Mahal (Karnataka); buffalo Murrah (Haryana) and Jaffarabadi (Gujarat).
Other products: meat production 10.50 MT and wool 34.57 million kg in 2024–25 (BAHS 2025); India is a leading exporter of buffalo meat.
Schemes: Rashtriya Gokul Mission (2014) for indigenous breeds, National Livestock Mission (2014), National Animal Disease Control Programme (2019) for foot-and-mouth disease and brucellosis, Animal Husbandry Infrastructure Development Fund (2020).
3. The White Revolution
Phases of Operation Flood: Phase I (1970–80) linked 18 milk sheds to four metro markets; Phase II (1981–85) expanded to 136 milk sheds; Phase III (1985–96) consolidated cooperatives and veterinary services; funded partly by sale of donated dairy commodities (EEC, World Food Programme).
Anand pattern: a three-tier cooperative structure: village dairy cooperative society → district milk union → state federation (Gujarat Cooperative Milk Marketing Federation, brand Amul).
Results: milk output rose from about 17 MT in 1950–51 to 247.87 MT in 2024–25; India produces roughly a quarter of the world's milk (FAO estimates); per capita availability 485 g a day (2024–25).
Leading states: Uttar Pradesh, Rajasthan, Madhya Pradesh, Gujarat and Maharashtra produce over half of India's milk (BAHS 2025).
Issues: low yield per animal compared with world averages, fodder and feed shortages, cattle diseases (lumpy skin disease outbreak 2022), stray cattle after slaughter restrictions, and dominance of small, unorganised producers.
4. Aquaculture and Fisheries
Production: total fish production about 197.75 lakh tonnes in 2024–25 (projected, Department of Fisheries), with inland fisheries and aquaculture about 77%; India is the world's second-largest fish producer and a major shrimp exporter.
Freshwater aquaculture: Indian major carps (catla, rohu, mrigal) in ponds and tanks of Andhra Pradesh, West Bengal, Odisha and Bihar; Andhra Pradesh leads fish production.
Brackish-water aquaculture: shrimp (mainly Pacific white shrimp, Litopenaeus vannamei) in coastal Andhra Pradesh, Gujarat, Odisha, West Bengal and Tamil Nadu.
Policies: Blue Revolution scheme (2015–16), Pradhan Mantri Matsya Sampada Yojana (2020), Fisheries and Aquaculture Infrastructure Development Fund (2018–19), Kisan Credit Card for fishers.
Concerns: conversion of mangroves and farmland to shrimp ponds, antibiotic use, salinisation of groundwater, disease outbreaks and export market risks.
5. Sericulture
Types of silk: India is the only country producing all four commercial silks: mulberry (Karnataka, Andhra Pradesh, Tamil Nadu, West Bengal), tasar (tropical tasar in Jharkhand, Chhattisgarh and Odisha; oak tasar in the sub-Himalaya), eri (Assam and the North-East) and muga (golden silk, Assam, which has a GI tag).
Status: India is the world's second-largest raw silk producer after China (Central Silk Board); Karnataka is the largest producer of mulberry silk; Jharkhand leads tasar.
Geography: mulberry needs moderate temperatures (about 24–28°C) and humidity; tasar depends on forest host trees (arjun, asan, sal), so it supports tribal livelihoods.
Schemes: Central Silk Board (1948), Silk Samagra (integrated scheme for silk development).
6. Apiculture and Poultry
Apiculture: species include the Indian hive bee (Apis cerana indica), the European bee (Apis mellifera), the rock bee and stingless bees; leading states include Uttar Pradesh, West Bengal, Punjab, Bihar and Rajasthan; National Beekeeping and Honey Mission (2020) under the 'Sweet Revolution' supports bee boxes, testing labs and honey FPOs; bees also raise crop yields through pollination (mustard, sunflower, fruits).
Poultry: egg production 149.11 billion in 2024–25 with per capita availability of 106 eggs a year (BAHS 2025); India ranks second in the world in eggs; Andhra Pradesh, Tamil Nadu (Namakkal egg belt), Telangana, West Bengal and Karnataka lead.
Organisation: broiler production has become vertically integrated (contract farming by integrators), while backyard poultry with indigenous breeds (Kadaknath of Madhya Pradesh, Aseel) supports poor households.
Risks: avian influenza outbreaks, feed price volatility (maize and soybean) and antibiotic use.
7. Theory and Debates
Livestock revolution (Christopher Delgado and others, 1999): rising incomes and urbanisation in developing countries raise demand for animal products, shifting agriculture towards livestock and feed crops; India's rising milk, egg and meat output fits this trend.
Cooperative vs corporate dairying: the Anand cooperative model is praised for empowering small producers and women; critics point to political interference and the growing role of private dairies.
Environment: livestock contribute methane emissions and pressure on grazing lands; FAO's Livestock's Long Shadow (2006) highlighted this globally; in India, low-input mixed farming is less intensive but large in scale.
Indigenous vs crossbred cattle: crossbreeding raised yields, but conservation of heat-tolerant, disease-resistant indigenous breeds is now emphasised; the balance is debated.
8. Maps and Diagrams to Draw
Milk production map: shade top states (Uttar Pradesh, Rajasthan, Madhya Pradesh, Gujarat, Maharashtra) and mark Anand.
Allied activities map: mark carp aquaculture (Andhra Pradesh, West Bengal), shrimp belts (coastal Andhra Pradesh, Gujarat), mulberry silk (Karnataka), tasar (Jharkhand), muga and eri (Assam), poultry hubs (Namakkal, Hyderabad region).
Anand model diagram: three-tier cooperative pyramid with flows of milk upward and payments and services downward.
Mixed farming cycle: crops → residue as fodder → animals → milk, draught power and dung → manure and biogas → crops.
9. Using It in the Exam
10 marks: short note on Operation Flood, sericulture or aquaculture with regions and data.
15 marks: distribution of livestock resources and their role in the rural economy with census data and a map.
20 marks: 'allied activities as a strategy for doubling farm incomes': livestock, dairy, fisheries, sericulture, apiculture, poultry, with data, maps and challenges.
Keywords: mixed farming, Anand pattern, Operation Flood, per capita availability, inland aquaculture, four silks, Sweet Revolution, vertical integration.
Attributed idea: Verghese Kurien argued that dairy development should be 'by the farmers, for the farmers' through cooperatives owned and controlled by producers (paraphrased).
| Product | Output | Year | Leading states |
|---|---|---|---|
| Milk | 247.87 million tonnes | 2024–25 (BAHS 2025) | UP, Rajasthan, MP, Gujarat, Maharashtra |
| Eggs | 149.11 billion | 2024–25 (BAHS 2025) | Andhra Pradesh, Tamil Nadu, Telangana |
| Meat | 10.50 million tonnes | 2024–25 (BAHS 2025) | UP, West Bengal, Maharashtra |
| Fish | About 197.75 lakh tonnes | 2024–25 (projected) | Andhra Pradesh, West Bengal |
| Wool | 34.57 million kg | 2024–25 (BAHS 2025) | Rajasthan, J&K, Gujarat |
| Raw silk | World's second largest | Central Silk Board | Karnataka (mulberry), Jharkhand (tasar), Assam (muga, eri) |
Mains points
- Questions ask about the White Revolution, livestock distribution, aquaculture's prospects and problems, or the role of allied activities in rural livelihoods.
- Quote BAHS 2025 (milk, eggs, meat for 2024–25), fish production 2024–25 and the 2019 Livestock Census, noting that 21st census results are awaited.
- Explain the Anand model with a diagram and evaluate cooperative dairying.
- Show geography: link each activity to physical and economic factors (fodder, water bodies, forest host plants for tasar, climate for mulberry).
- Draw a map of allied activities with named centres (Anand, Namakkal, Karnataka silk belt, Assam muga).
- Common mistake: claiming India is the largest egg or fish producer; it is second in both, but first in milk.
Did you know?
- Muga silk of Assam is naturally golden and is produced only in the Brahmaputra valley region; it received a Geographical Indication tag in 2007.
Agricultural Regionalisation, Agro-climatic Zones and Agro-ecological Regions
Agricultural regionalisation divides a country into areas of broadly similar agricultural characteristics to guide research and planning. In India, the Planning Commission's Agro-Climatic Regional Planning (1988–89) identified 15 agro-climatic regions, ICAR's National Agricultural Research Project created about 127 smaller agro-climatic zones, and ICAR–NBSS&LUP delineated 20 agro-ecological regions and 60 sub-regions using physiography, soils, bioclimate and the length of growing period. These schemes help match crops, technologies and investments to local resource endowments.
In simple words
Just as a doctor gives different medicine to different patients, agriculture needs different plans for different regions.
Regionalisation groups places with similar climate, soil and water into zones, such as the Trans-Gangetic plains or the Western Dry Region.
Each agro-climatic zone then gets suitable crops, seeds and schemes instead of one plan for the whole country.
UPSC asks you to describe these zones, compare the schemes and explain their use in planning.
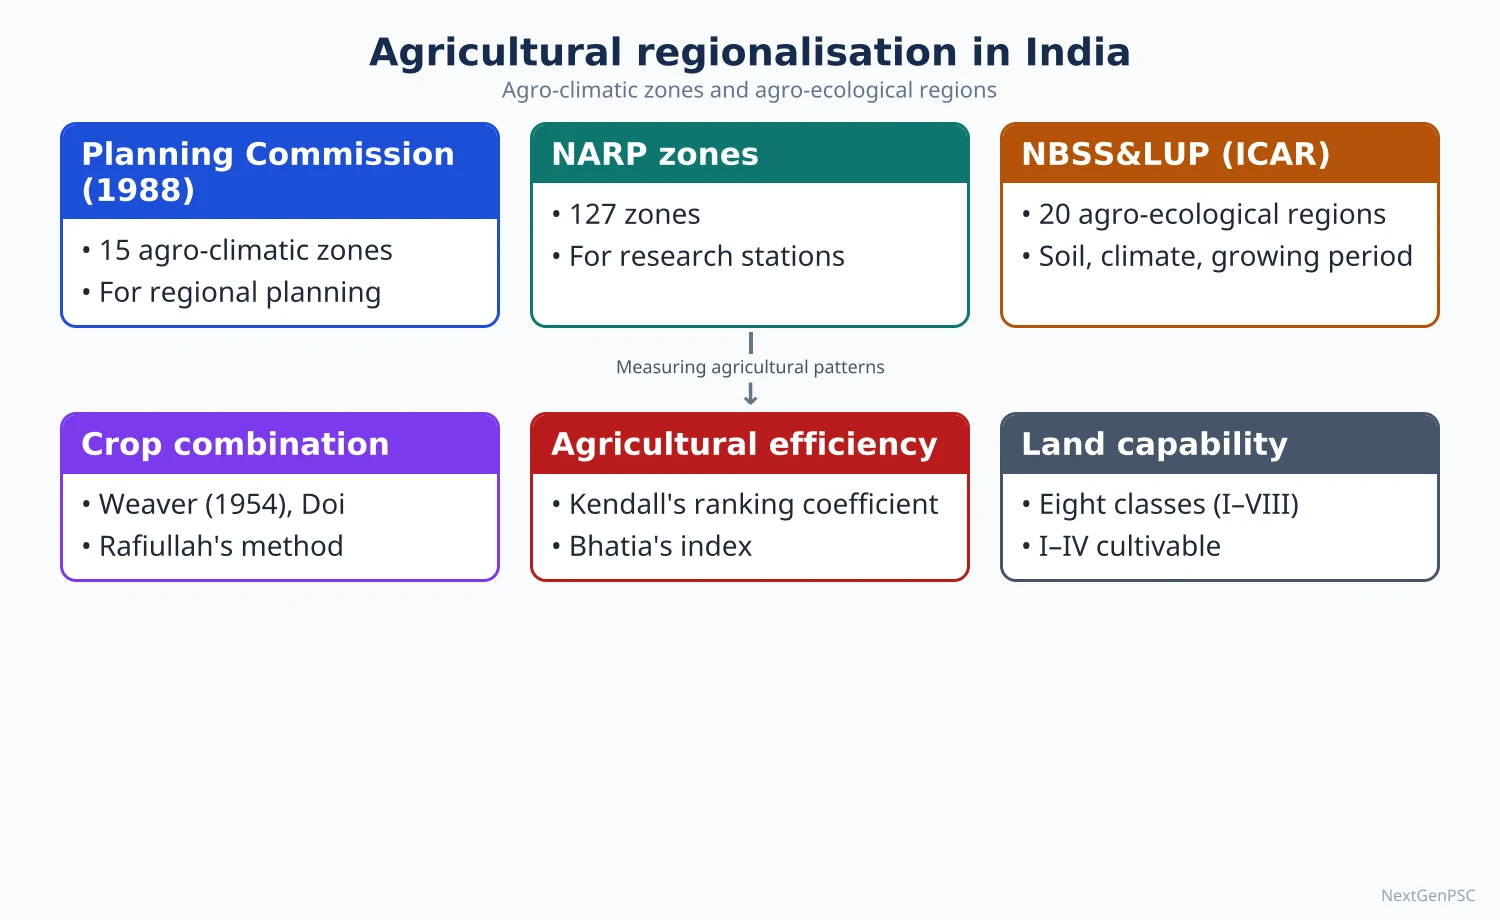
1. Concepts and Definitions
Agricultural region: an area with broad uniformity in the combination of physical conditions (climate, soil, relief, water), crops and farming practices, distinct from neighbouring areas; Derwent Whittlesey (1936) used crop and livestock association, intensity, technology, and settlement to define world agricultural regions.
Agro-climatic zone (FAO): a land unit defined by climate, especially temperature and moisture, suitable for a certain range of crops and cultivars.
Agro-ecological zone/region: a land unit carved out of an agro-climatic zone by superimposing landform and soils, which together determine the length of growing period (FAO Agro-ecological Zones project, 1978 onwards).
Length of growing period (LGP): the number of days in a year when precipitation exceeds half of potential evapotranspiration, plus the time needed to use stored soil moisture; it is the main criterion separating arid, semi-arid, sub-humid and humid regions.
Purpose: to guide location-specific research, extension, crop planning, irrigation, contingency plans and investment, moving away from uniform national plans.
2. Early Agricultural Regionalisation of India
Crop-based schemes: early studies grouped India into rice, wheat, millet and plantation regions based on dominant crops and rainfall; M.S. Randhawa's scheme (1950s) recognised broad temperate Himalayan, northern dry (wheat), eastern wet (rice), western wet (Malabar) and southern (millets) regions.
Statistical approaches: crop concentration (Bhatia, 1965), crop combination (Weaver and Doi methods applied to districts) and agricultural productivity indices formed the basis of later regionalisation.
Economic regionalisation: P. Sengupta and Galina Sdasyuk (Economic Regionalisation of India: Problems and Approaches, 1968) produced macro and meso economic regions incorporating agriculture.
Composite approaches: later Indian geographers (e.g. Jasbir Singh) combined physical factors, crop associations, productivity and levels of development into agricultural regions and development zones.
3. Planning Commission's Agro-climatic Regions (1988–89)
Origin: the Agro-Climatic Regional Planning (ACRP) project, associated with Y.K. Alagh, divided India into 15 agro-climatic regions based on physiography, soils, rainfall, temperature, cropping patterns and water resources, for the Seventh and Eighth Plans; regions were further divided into 73 sub-zones.
The 15 regions: (1) Western Himalayan, (2) Eastern Himalayan, (3) Lower Gangetic Plains, (4) Middle Gangetic Plains, (5) Upper Gangetic Plains, (6) Trans-Gangetic Plains, (7) Eastern Plateau and Hills, (8) Central Plateau and Hills, (9) Western Plateau and Hills, (10) Southern Plateau and Hills, (11) East Coast Plains and Hills, (12) West Coast Plains and Ghats, (13) Gujarat Plains and Hills, (14) Western Dry Region, (15) Islands Region.
Examples of strategies: Trans-Gangetic Plains (Punjab, Haryana): diversify from rice–wheat, conserve groundwater; Lower Gangetic Plains (West Bengal): rice, jute, fisheries; Western Dry Region (western Rajasthan): dryland crops, livestock, agroforestry; Eastern Plateau and Hills (Jharkhand, Chhattisgarh, Odisha): watershed development, upland rice, horticulture; West Coast Plains and Ghats: plantation crops, spices, fisheries.
Value: brought resource-based, region-specific planning into national policy; criticised for large, internally diverse regions that hide local variation.
Indicators used for each region: rainfall and its variability, temperature regime, soil type, irrigation intensity, cropping pattern, yields and the scope for diversification, so each region received a resource-to-strategy profile.
4. NARP Agro-climatic Zones
National Agricultural Research Project (ICAR, from 1979, with World Bank support): divided the country into about 127 agro-climatic zones within state boundaries, each with a Zonal Research Station under a State Agricultural University.
Criteria: rainfall, temperature, soils, topography, cropping patterns and irrigation; zones follow district boundaries for administrative convenience.
Use: zonal research and extension; District Agriculture Contingency Plans prepared by ICAR–CRIDA build on these zones; Krishi Vigyan Kendras (one or more per district) deliver technology.
Example: Punjab has five NARP zones (sub-mountain undulating, undulating plain, central plain, western plain and western zone), showing how a small, apparently uniform state still contains distinct farming environments.
5. Agro-ecological Regions (ICAR–NBSS&LUP)
Delineation: the National Bureau of Soil Survey and Land Use Planning, Nagpur (Sehgal and others, early 1990s) divided India into 20 agro-ecological regions (AERs) by superimposing maps of physiography, soils, bioclimate (aridity) and length of growing period; these were refined into 60 agro-ecological sub-regions (AESRs) in 1999.
Examples of AERs: Western Himalaya cold arid (Ladakh, LGP under 90 days); western plain and Kutch hot arid; northern plain hot semi-arid; Deccan plateau hot semi-arid; eastern plateau hot sub-humid; Bengal and Assam plains hot humid; Western Ghats and coastal plains hot humid–per-humid; eastern Himalaya warm per-humid; islands hot humid–per-humid.
Bioclimatic classes: arid (LGP up to about 90 days), semi-arid (90–150 days), sub-humid (150–210 days), humid and per-humid (above 210 days), with cold and hot variants.
Uses: land use planning, crop suitability, rainfed technology transfer, watershed planning, climate change adaptation and contingency crop planning.
Relation to other schemes: AERs are ecological units that cross state boundaries, whereas NARP zones nest inside states; planners often overlay both to combine ecological logic with administrative delivery.
6. Theory and Debates
Formal vs functional regions: agro-climatic and agro-ecological regions are formal (homogeneous) regions; critics argue planning also needs functional linkages (markets, value chains, cities).
Scale problem: the 15 Planning Commission regions are too coarse; the 127 NARP zones follow administrative boundaries rather than ecology; AESRs cut across states, complicating administration; there is no single best scale.
Static vs dynamic: regions based on 20th-century climate data may shift with climate change; NBSS&LUP and CRIDA work on vulnerability atlases shows changing LGP.
Implementation gap: despite region-specific recommendations, national price and procurement policy (MSP for rice and wheat) often overrides regional plans, as seen in the Trans-Gangetic plains.
Link to Whittlesey and possibilism: regionalisation reflects Vidal de la Blache's view that human choices operate within environmental limits, now expressed as matching technology to agro-ecology.
7. Maps and Diagrams to Draw
15 agro-climatic regions map: outline India, divide into the 15 regions with numbers and a key (Western Himalayan in J&K–HP–Uttarakhand, Eastern Himalayan in Sikkim–Darjeeling–North-East, Trans-Gangetic in Punjab–Haryana–Delhi, and so on).
Agro-ecological map: broad belts of arid (Ladakh, western Rajasthan), semi-arid (northern plain and Deccan), sub-humid (eastern plateau, middle Ganga plain) and humid (Bengal, Assam, Western Ghats coast) regions.
LGP diagram: a graph of monthly precipitation and half PET showing the start and end of the growing period, with stored soil moisture extending it.
Flow chart: climate map + soil map + physiography map → overlay → agro-ecological region → crop and technology recommendations.
8. Using It in the Exam
10 marks: list and briefly characterise the 15 agro-climatic regions with a map.
15 marks: distinguish agro-climatic zones and agro-ecological regions, with criteria and examples.
20 marks: evaluate agricultural regionalisation as a tool for planning: schemes (Planning Commission, NARP, NBSS&LUP), strengths, weaknesses, climate change, with a map.
Keywords: formal region, agro-climatic regional planning, length of growing period, AER and AESR, location-specific technology, contingency plans.
Attributed idea: Whittlesey (1936) defined agricultural regions by combining crop and livestock association, methods, intensity, disposal of produce and farm buildings.
Common mistake: mixing the numbers (15 Planning Commission regions, about 127 NARP zones, 20 AERs and 60 AESRs); state each with its agency and year.
| Scheme | Agency and year | Number of units | Main criteria |
|---|---|---|---|
| Agro-climatic regions | Planning Commission (ACRP), 1988–89 | 15 regions, 73 sub-zones | Physiography, soil, rainfall, temperature, cropping, water |
| Agro-climatic zones | ICAR, National Agricultural Research Project, from 1979 | About 127 zones | Rainfall, soils, cropping; district boundaries |
| Agro-ecological regions | ICAR–NBSS&LUP, early 1990s | 20 regions | Physiography, soils, bioclimate, LGP |
| Agro-ecological sub-regions | ICAR–NBSS&LUP, 1999 | 60 sub-regions | Finer LGP, soils and landform classes |
Mains points
- Questions ask to delineate agro-climatic regions with a map, compare agro-climatic and agro-ecological regionalisation, or assess their planning value.
- Memorise the 15 Planning Commission regions in order and be able to map them quickly.
- Explain the length of growing period clearly; it is the key concept for agro-ecological regions.
- Use examples of region-specific strategies (Trans-Gangetic diversification, Western Dry Region livestock and agroforestry).
- Critically evaluate: scale, administrative vs ecological boundaries, climate change, policy override by MSP.
- Common mistake: using 'agro-climatic' and 'agro-ecological' interchangeably; define both.
Did you know?
- Memory aid for the 15 agro-climatic regions: think of a journey from the Himalaya (2 regions) down the Ganga (4 plains), across the plateaus (4), along the coasts (2), then Gujarat, the Western Dry Region and the islands (3).
UPSC Previous Year Questions: Agriculture in India
From 2014 to 2026 UPSC asked 34 question parts worth 520 marks from this chapter in Paper II, the most of any chapter in this part. Institutional and infrastructural factors (11 parts) and cropping pattern, productivity and diversification (10 parts) lead, followed by the Green Revolution and dry farming (6), agricultural regionalisation (4) and livestock (3). Every question below has a model answer written to the UPSC word limit, with the map or diagram an examiner expects.
In simple words
Read the question and write your own answer first, keeping to the word limit (10 marks about 150 words, 15 marks about 200, 20 marks about 250).
Then compare it with the model answer: did you use Agricultural Census, NCRB, livestock census or Ministry of Agriculture data with the year, name the scheme or geographer correctly, and draw a map of the crop regions involved?
Note what you missed in one line and reread that part of the notes before trying the next question.
1. Agricultural Infrastructure and Institutional Factors
Example 1 (UPSC 2024, 20 marks): Institutional factors are playing a dominant role in controlling the agricultural prosperity in India. Justify with evidences.
Paper and question: Paper II, Q2(a)
Approach: Define institutional factors, then justify with evidence how each (land tenure and holdings, credit, markets and MSP, insurance, cooperatives, extension and research) shapes regional agricultural prosperity, with a balanced conclusion. Draw a map contrasting prosperous and lagging agricultural regions.
Institutional factors are the man-made arrangements (land tenure, size of holdings, credit, markets, prices, insurance and extension) within which farmers use land and technology. Alongside physical factors, they largely explain why agricultural prosperity in India is so uneven.
Land tenure and holdings: where zamindari was abolished and holdings consolidated, as in Punjab, Haryana and western Uttar Pradesh, farmers invested in tube-wells and machines. Insecure tenancy and fragmented holdings in Bihar and eastern Uttar Pradesh hold back investment; the average holding is only 1.08 ha, and 86% of holdings are marginal or small (Agricultural Census 2015–16).
Assured markets and MSP: procurement of wheat and paddy is concentrated in Punjab, Haryana and Madhya Pradesh, giving their farmers stable incomes, while farmers in eastern India often sell below MSP.
Credit and cooperatives: strong cooperative banks and dairy cooperatives in Gujarat and Maharashtra (Amul, sugar cooperatives) spread prosperity, whereas moneylender dependence persists in tribal and eastern regions.
Infrastructure and extension: canal networks, rural electrification, regulated mandis and agricultural universities such as Pantnagar and Ludhiana drove the Green Revolution in the north-west.
Recent institutions: PM-KISAN (2019), PM Fasal Bima Yojana (2016), e-NAM (2016), FPOs and the Agriculture Infrastructure Fund (2020) aim to spread these benefits more widely.
Balanced view: physical factors still set limits, as dryland Rajasthan shows, but within those limits institutions decide who prospers.
Map: Map of India contrasting high-productivity regions with strong institutions (Punjab, Haryana, western Uttar Pradesh, coastal Andhra Pradesh) and lagging regions (Bihar, eastern Uttar Pradesh, Odisha, Jharkhand).
Reforming tenancy, markets and credit in the lagging east is therefore the key to inclusive agricultural prosperity.
Example 2 (UPSC 2024, 10 marks): Examine the transitional role of technology on Indian agriculture sector.
Paper and question: Paper II, Q5(c)
Approach: Trace how technology has carried Indian agriculture through successive transitions (Green Revolution, mechanisation, biotechnology, digital and precision farming), with its benefits and limits. Draw a timeline diagram.
Technology has repeatedly carried Indian agriculture from one stage to the next, from subsistence to surplus and now towards precision and sustainability.
Transitions: (i) the Green Revolution (from 1966–67) with high-yielding wheat and rice, fertilisers and tube-wells turned food deficit into self-sufficiency; (ii) mechanisation with tractors, harvesters and pumps raised cropping intensity; (iii) biotechnology, such as Bt cotton (2002), raised cotton output, while climate-resilient varieties are spreading; (iv) digital agriculture: soil health cards (2015), e-NAM (2016), Kisan drones, satellite crop insurance assessment and the Digital Agriculture Mission (2024) improve inputs, prices and risk management; (v) micro-irrigation and solar pumps save water.
Limits: benefits have favoured irrigated regions and larger farmers, and overuse of inputs has degraded soils and groundwater.
Diagram: Timeline from the Green Revolution through mechanisation and Bt cotton to digital and precision farming, showing yields rising and the shift from quantity to sustainability.
Technology must now be climate-smart, affordable and inclusive to complete this transition.
Example 3 (UPSC 2024, 15 marks): How do small and fragmented landholdings affect the agro-ecological system in rural India? What are the resilient steps needed to overcome this issue?
Paper and question: Paper II, Q7(c)
Approach: Give data on small and fragmented holdings, explain their effects on the agro-ecological system (soil, water, biodiversity, farming practices, livelihoods), then suggest resilient steps. Draw a map of average holding size by state.
The Agricultural Census 2015–16 found an average operational holding of only 1.08 ha, with marginal and small holdings (below 2 ha) making up about 86% of holdings but only about 47% of the operated area. Holdings are smallest in Kerala, Bihar, West Bengal and Uttar Pradesh, and each is often split into scattered plots.
Effects on the agro-ecological system: (i) soil: small farmers cannot leave land fallow or rotate crops, so they mine nutrients, and boundary bunds waste land; (ii) water: many individual borewells on tiny plots cause over-extraction and well interference, while scattered plots make canal and drip irrigation hard to organise; (iii) inputs: cheap urea is overused, and pesticides are sprayed without advice; (iv) biodiversity: pressure to maximise cash returns pushes monocropping and the loss of traditional varieties; (v) livelihoods: low incomes, debt and distress migration, with women increasingly managing farms.
Resilient steps: consolidation of holdings and digitised land records (DILRMP, SVAMITVA); legal tenancy through land-leasing laws based on the Model Act (2016); collective action through FPOs and cooperative farming; custom hiring centres for machines; diversified, integrated farming (crops, livestock, fish, trees); natural farming and soil health cards; micro-irrigation and community groundwater management; and crop insurance and income support (PM-KISAN).
Map: Map of India showing average operational holding size by state, smallest in Kerala, Bihar and West Bengal and largest in Nagaland, Punjab and Rajasthan.
Collective, diversified farming can turn the weakness of small holdings into ecological resilience.
Example 4 (UPSC 2023, 15 marks): Discuss the significance of organic farming for sustainable agricultural development in India.
Paper and question: Paper II, Q6(b)
Approach: Define organic farming, explain its significance for sustainable development (ecological, economic, health, climate), give Indian examples and schemes, and note its limits. Draw a map of leading organic areas.
Organic farming is a production system that avoids synthetic fertilisers, pesticides and GM seeds and relies on crop rotation, compost, green manure, biofertilisers and biological pest control to sustain soil health and ecosystems.
Ecological significance: it restores soil organic carbon and microbial life degraded by decades of chemical-intensive farming in the Green Revolution belt, reduces nitrate and pesticide pollution of water, and conserves pollinators and agro-biodiversity.
Economic significance: lower input costs reduce debt for small farmers; premium prices and exports of organic tea, spices, basmati and cotton raise incomes.
Health and climate: it yields food with fewer chemical residues, and healthier soils store more carbon and hold more moisture, improving resilience to drought.
Indian examples and schemes: Sikkim became India's first fully organic state (2016); the Paramparagat Krishi Vikas Yojana (2015) supports cluster-based organic farming; the Mission Organic Value Chain Development for the North Eastern Region (2015–16) targets the hill states; and the National Mission on Natural Farming (2024) promotes chemical-free farming. Large rainfed and tribal areas are 'organic by default'.
Limits: yields often fall during conversion, certification is costly, markets and supply chains are thin, and food security needs balanced, integrated nutrient management rather than a sudden total switch.
Map: Map of India marking Sikkim and other north-eastern states, Madhya Pradesh, Uttarakhand, Kerala and other leading organic areas.
Organic and natural farming, scaled through clusters and FPOs, can make Indian agriculture more sustainable while protecting food security.
Example 5 (UPSC 2022, 20 marks): Discuss the recent changes brought about in institutional frameworks of agriculture in India. Evaluate its impact on the agrarian economy of the country.
Paper and question: Paper II, Q3(a)
Approach: List the recent changes in agricultural institutions (income support, insurance, markets, FPOs, infrastructure finance, digital systems, the 2020 farm laws and their repeal), then evaluate their impact on the agrarian economy with evidence. Draw a diagram of the institutional framework.
Since about 2015, India has reshaped the institutional framework of agriculture, the rules and organisations governing land, credit, markets, prices and risk, with the declared aim of raising farm incomes.
Recent changes: (i) income support: PM-KISAN (2019) transfers ₹6,000 a year to landholding farmers; (ii) risk cover: the Pradhan Mantri Fasal Bima Yojana (2016); (iii) markets: e-NAM (2016) links regulated mandis online, and Kisan Credit Cards were extended to animal husbandry and fisheries; (iv) collectives: the scheme for 10,000 Farmer Producer Organisations (2020) and a new Ministry of Cooperation (2021); (v) infrastructure: the Agriculture Infrastructure Fund of ₹1 lakh crore (2020) for warehouses and cold chains; (vi) soil and digital: soil health cards (2015), Agristack and the Digital Agriculture Mission (2024); (vii) market reform attempts: three farm laws of 2020 on trade outside mandis, contract farming and the Essential Commodities Act were repealed in 2021 after prolonged farmer protests centred in Punjab and Haryana.
Positive impacts: direct transfers have reached a very large number of farmers, insurance has covered more weather risk, FPOs have improved bargaining power in places, and storage investment has risen.
Limitations: PM-KISAN excludes tenants and the landless; insurance claims are delayed and coverage has fallen in some states; e-NAM trade remains small compared with physical mandis; and MSP procurement remains regionally skewed towards Punjab, Haryana and Madhya Pradesh.
Overall impact: the reforms have improved income security more than productivity or market structure, and agricultural growth has stayed moderate while regional disparities persist.
Diagram: Diagram of the agricultural institutional framework linking the farmer with income support, credit, insurance, markets (mandis, e-NAM, FPOs), infrastructure and digital platforms.
Consensus-based market reform, inclusion of tenants and stronger FPOs are needed for these institutions to transform the agrarian economy.
Example 6 (UPSC 2022, 15 marks): Evaluate the role of the National Food Security Act, 2013 in providing access of food to the poor in India.
Paper and question: Paper II, Q8(c)
Approach: Outline the provisions of the NFSA, evaluate its achievements in food access with evidence, then its shortcomings and regional variations, and suggest improvements. Draw a map of PDS performance or nutrition outcomes.
The National Food Security Act, 2013 made access to subsidised food grains a legal right, covering up to 75% of the rural and 50% of the urban population, about 81 crore people.
Provisions: 5 kg of grain per person per month for priority households and 35 kg per household for Antyodaya Anna Yojana families; maternity benefits; meals for children through anganwadis and schools (now PM POSHAN); and women aged 18 and above as heads of household for ration cards.
Achievements: (i) a safety net that proved vital during the COVID-19 pandemic, when additional free grain was given under PM Garib Kalyan Anna Yojana, and grain under the Act has been free since January 2023; (ii) reforms such as Aadhaar seeding, ePoS machines and One Nation One Ration Card (portability for migrants) reduced leakages; (iii) states such as Chhattisgarh, Odisha and Tamil Nadu built strong systems.
Shortcomings: coverage is still based on Census 2011 population, so many eligible people are excluded; biometric failures cause exclusion in remote areas; the basket is cereal-heavy, while NFHS-5 (2019–21) still found 35.5% of children under five stunted; and procurement and storage are concentrated in a few northern states.
Improvements: update coverage, add millets, pulses and oils, fortify rice, strengthen grievance systems and decentralise procurement.
Map: Map of India showing states with strong PDS (Tamil Nadu, Chhattisgarh, Odisha) and the states with the highest child stunting (Bihar, Meghalaya, Uttar Pradesh).
The NFSA has improved access to calories, but nutrition security needs a more diverse and inclusive approach.
Example 7 (UPSC 2020, 15 marks): The Essential Commodities (Amendment) Bill 2020 aims to deregulate the production, supply and distribution of farm produce. Critically examine its spatial consequences.
Paper and question: Paper II, Q4(c)
Approach: State what the 2020 amendment changed and its intent, then critically examine its likely spatial consequences for producing, consuming and storage regions, noting its repeal in 2021. Draw a map of surplus and deficit regions for the commodities concerned.
The Essential Commodities (Amendment) Act, 2020 removed cereals, pulses, oilseeds, edible oils, onions and potatoes from routine stock limits, allowing regulation only in extraordinary situations such as war, famine or steep price rises. It aimed to attract private investment in storage, processing and supply chains, but it was repealed in late 2021 together with the other farm laws.
Expected positive spatial effects: (i) investment in warehouses and cold storage in surplus regions, for example onion in Nashik (Maharashtra), potato in Agra and Hooghly, and pulses in Madhya Pradesh and Rajasthan; (ii) agro-processing clusters near production areas, raising local value addition; (iii) smoother inter-state movement from surplus to deficit regions.
Critical concerns: (i) concentration: large traders and corporations with storage capacity could hoard and dominate markets, especially in regions with few buyers; (ii) consumer regions: deficit and urban regions such as the north-east, hill states and big cities could face price spikes, as with onion prices in 2019; (iii) regional imbalance: investment would favour well-connected surplus regions (Punjab, Maharashtra, Gujarat), widening the gap with the poorly connected east and north-east; (iv) weaker state role: states lost routine powers to curb hoarding in local shortages.
Map: Map of India marking surplus production regions for onion, potato, pulses and oilseeds, major storage hubs, and deficit consumer regions.
Storage investment is needed, but with safeguards against hoarding and with special attention to lagging regions.
Example 8 (UPSC 2020, 10 marks): Elucidate the benefits of neem coated urea scheme for Indian agriculture.
Paper and question: Paper II, Q5(b)
Approach: Explain what neem coating does to urea, then list its agronomic, economic and environmental benefits, with a brief note on limits. Draw a diagram of nitrogen release from coated and uncoated urea.
In 2015 the Government made it mandatory for all domestically produced and imported subsidised urea to be neem-coated, using neem oil, which slows the conversion of urea nitrogen (nitrification) in the soil.
Benefits: (i) higher nitrogen use efficiency: slower release keeps nitrogen in the root zone longer and reduces losses by leaching and volatilisation, so crops use more of it; (ii) yield gains and lower doses: studies reported modest increases in yields of paddy, wheat and sugarcane with less urea; (iii) stopping diversion: neem-coated urea cannot easily be used by industries such as plywood, dyes and adhesives, so subsidised urea reaches farmers and the subsidy bill is better targeted; (iv) environment: less nitrate pollution of groundwater and lower nitrous oxide emissions; (v) pest effect: neem has mild pesticidal properties.
Limits: it does not correct the skewed NPK ratio caused by cheap urea, so balanced fertilisation, soil health cards and nano urea remain necessary.
Diagram: Graph comparing nitrogen available in soil over time from ordinary and neem-coated urea, showing the slower, longer release of the latter.
Neem coating is thus a simple, low-cost reform that improves both fertiliser efficiency and subsidy governance.
Example 9 (UPSC 2019, 20 marks): Discuss the use of chemical fertilizers, pesticides and insecticides in agriculture and its impact on human health.
Paper and question: Paper II, Q3(a)
Approach: Describe the pattern and regional distribution of agrochemical use, explain the reasons for overuse and misuse, then the impacts on human health with Indian evidence, and suggest remedies. Draw a map of high agrochemical-use regions and health hotspots.
Chemical fertilisers, pesticides and insecticides were central to the Green Revolution and helped make India self-sufficient in food. Their use, however, is regionally concentrated and often unbalanced or unsafe.
Pattern of use: fertiliser use per hectare is highest in Punjab, Haryana, Telangana, Andhra Pradesh and western Uttar Pradesh, and lowest in the north-eastern and hill states. Because urea is heavily subsidised, nitrogen dominates, and the NPK ratio is far from the recommended 4:2:1. Pesticide use per hectare is low by world standards, but it is concentrated on cotton, paddy, vegetables and fruit, with frequent spraying in Punjab, Andhra Pradesh, Telangana and Maharashtra.
Reasons for misuse: subsidies, lack of soil testing and extension advice, illiteracy about doses and safety, spurious products, and pest resistance that leads to higher doses.
Impacts on human health: (i) acute poisoning: farmers spraying without protection suffer poisoning, as in Yavatmal (Maharashtra) in 2017, when many cotton farmers died; (ii) chronic disease: studies have linked pesticide exposure in the Malwa region of Punjab to cancers, giving rise to the so-called 'cancer train' from Bathinda to Bikaner, and endosulfan spraying in Kasaragod (Kerala) to birth defects and disabilities, which led to a Supreme Court ban in 2011; (iii) residues in food: vegetables, fruit and milk often carry residues above safe limits; (iv) nitrate in water: excess fertiliser raises nitrate in groundwater, which can cause methaemoglobinaemia in infants; (v) endocrine and neurological effects are suspected from long-term exposure.
Remedies: balanced fertilisation guided by soil health cards, neem-coated and nano urea, integrated pest management, bans on highly hazardous pesticides, residue monitoring, protective equipment, and organic and natural farming.
Map: Map of India showing high fertiliser and pesticide use (Punjab, Haryana, Andhra Pradesh, Telangana) with health hotspots at Malwa (Punjab), Kasaragod and Yavatmal.
Moving from chemical-intensive to knowledge-intensive farming is essential to protect both productivity and public health.
Example 10 (UPSC 2017, 15 marks): Land reform is a key to modern agriculture in India. Describe various measures taken in this direction after Independence.
Paper and question: Paper II, Q4(c)
Approach: Explain why land reform is key to modern agriculture, then describe the post-Independence measures (intermediary abolition, tenancy reform, ceilings, consolidation, Bhoodan, record modernisation, leasing) with regional outcomes. Draw a map of reform success regions.
Land reform aims to give the tiller secure rights to land so that he has the incentive and ability to invest in modern inputs. At Independence, zamindari, insecure tenancy and fragmented holdings were the main barriers to modern agriculture.
Measures: (i) abolition of intermediaries (zamindari, jagirdari) in the early 1950s, which brought tenants into direct contact with the state and was the most successful reform; (ii) tenancy reforms regulating rent and giving security, notably Operation Barga in West Bengal (1978) and reforms in Kerala; (iii) land ceilings to redistribute surplus land, which had limited success because of benami transfers and loopholes; (iv) consolidation of holdings, highly successful in Punjab, Haryana and western Uttar Pradesh, which laid the base for the Green Revolution; (v) Bhoodan and Gramdan (Vinoba Bhave, 1951), a voluntary land-gift movement.
Recent measures: computerisation of land records (DILRMP), drone-based property cards under SVAMITVA (2020), the Model Agricultural Land Leasing Act (2016) to legalise tenancy, and unique land parcel identification numbers.
Map: Map of India marking consolidation success in Punjab and Haryana, tenancy reform in West Bengal and Kerala, and weak reform areas in Bihar and eastern Uttar Pradesh.
Modernising agriculture today requires clear titles, legal leasing and land markets that also protect small farmers.
Example 11 (UPSC 2015, 15 marks): Explain how modernization of Indian agriculture is affected by unfavourable institutional factors with suitable examples.
Paper and question: Paper II, Q2(c)
Approach: Define modernisation and institutional factors, then explain with examples how each unfavourable factor (holdings, tenancy, credit, markets, extension, insurance, cooperatives) hinders it, region by region. Draw a map of regions affected.
Modernisation of agriculture means the adoption of improved seeds, machines, irrigation, scientific practices and market orientation. Its spread depends heavily on institutional factors, which are unfavourable in much of India.
Small and fragmented holdings: with an average of 1.08 ha (Agricultural Census 2015–16), tractors, harvesters and drip systems are uneconomic for most farmers, as in Bihar, West Bengal and Kerala.
Insecure tenancy: oral, unrecorded leases in Bihar, Odisha and Andhra Pradesh deny tenants credit, insurance and PM-KISAN, so they avoid long-term investment.
Credit: small and tribal farmers still borrow from moneylenders at high interest, as in Jharkhand and Odisha.
Markets and prices: a thin network of regulated mandis in the east and north-east, and MSP procurement concentrated in Punjab and Haryana, reduce the incentive to modernise elsewhere.
Extension and research: few extension workers per farmer and weak links between research and farms slow the spread of new technology in rainfed areas.
Weak cooperatives and insurance: where cooperatives are weak, input supply and marketing are poor, and delayed insurance claims discourage risk-taking.
Map: Map of India contrasting modernised north-western and southern delta regions with institutionally constrained eastern, central tribal and north-eastern regions.
Institutional reform must therefore accompany technology for modernisation to reach all regions.
2. Cropping Pattern, Productivity, Intensity, Crop Combination and Land Capability
Example 12 (UPSC 2026, 20 marks): Examine the causes and consequences of crop diversification in India. How can crop diversification contribute to sustainable agriculture?
Paper and question: Paper II, Q3(a)
Approach: Define crop diversification, examine its causes (demand, prices, technology, water, policy) and consequences (incomes, food security, ecology, regional effects), then show how it contributes to sustainable agriculture. Draw a map of diversification trends.
Crop diversification is a shift from a few dominant crops (usually cereals) to a wider mix of crops and high-value enterprises such as fruits, vegetables, pulses, oilseeds, spices and flowers. It can be measured with indices such as Gibbs and Martin's index or the Herfindahl index.
Causes: (i) rising incomes and urbanisation have increased demand for fruits, vegetables, milk and processed foods; (ii) better prices and exports for high-value crops; (iii) technology such as drip irrigation, polyhouses, cold chains and improved seeds; (iv) water scarcity and falling water tables, which push farmers away from paddy and sugarcane; (v) policy support, including the Mission for Integrated Development of Horticulture, oilseed and pulse missions, and Punjab and Haryana's crop diversification incentives.
Consequences: (i) horticulture output has exceeded food grain output since 2012–13, raising farm incomes in Maharashtra (grapes, pomegranates), Himachal Pradesh (apples) and Andhra Pradesh (horticulture and aquaculture); (ii) greater nutritional diversity; (iii) more market risk and price volatility, as with onions and tomatoes; (iv) uneven spread, since diversification is fastest near cities and in irrigated areas while the Punjab–Haryana rice–wheat system has hardly changed; (v) a possible decline in coarse cereals in some areas.
Contribution to sustainability: (i) crop rotation with pulses fixes nitrogen and restores soil health; (ii) shifting from paddy to maize, millets, pulses and oilseeds saves groundwater; (iii) a mix of crops spreads climate and price risk; (iv) agroforestry and integrated farming add biodiversity and income; (v) millets and pulses support nutrition and climate resilience.
Constraints: MSP and procurement that favour wheat and paddy, poor markets for alternative crops, and lack of storage.
Map: Map of India showing regions of high diversification (Maharashtra, Himachal Pradesh, Andhra Pradesh, Karnataka) and low diversification (Punjab–Haryana rice–wheat belt).
Crop diversification backed by assured markets and price support for alternative crops is thus a central pathway to sustainable agriculture.
Example 13 (UPSC 2025, 10 marks): How does Himalayan ecosystem regulate the cropping pattern and agricultural activities in Himalayan region of India? Discuss.
Paper and question: Paper II, Q1(c)
Approach: Show how Himalayan relief, altitude, aspect, climate, soils and water regulate cropping and farming systems, with examples from the western, central and eastern Himalaya. Draw an altitudinal cropping diagram.
In the Himalaya, the mountain ecosystem, not just markets, decides what is grown, where and when.
Altitude: rice, maize and wheat dominate valleys and terraces below about 1,500 m (Kangra, Doon, Imphal valley); temperate fruits such as apple, pear and cherry, with potato and peas, are grown between about 1,500 and 2,500 m (Shimla, Kullu, Kashmir); and barley, buckwheat and amaranth occupy the high zones of Lahaul–Spiti, Ladakh and upper Uttarakhand.
Slope and aspect: steep slopes force terracing and small fields; sunny south-facing slopes are preferred for cultivation, and orchards occupy well-drained slopes.
Climate and water: a short growing season at high altitude allows only one crop, whereas the warm, moist eastern Himalaya permits rice, jhum, tea, large cardamom (Sikkim) and oranges. Snowmelt-fed kuhls (Himachal Pradesh) and zings (Ladakh) irrigate fields.
Farming systems: agro-pastoral transhumance (Gaddi, Gujjar), agroforestry and livestock integration.
Diagram: Mountain profile showing rice and maize in valleys, apple and potato on mid-slopes, barley and buckwheat in high zones, and alpine pastures above.
Climate change is now pushing apple belts upward, so cropping must adapt.
Example 14 (UPSC 2025, 10 marks): Discuss the necessary conditions for the cultivation of fox nuts and describe the areas of its production in India.
Paper and question: Paper II, Q5(e)
Approach: State the climatic, water and soil conditions makhana needs and the cultivation methods, then describe its producing areas with Bihar's dominance. Draw a map of makhana areas.
Fox nut or makhana (Euryale ferox) is an aquatic plant of the water-lily family whose popped seeds are a high-value, nutritious food.
Conditions: (i) a warm, humid tropical to subtropical climate with temperatures of roughly 20–35°C and high humidity during growth; (ii) abundant rainfall (roughly 1,000 mm or more) and perennial still water; (iii) shallow ponds, ox-bow lakes, wetlands (chaurs) or low-lying fields with standing water about 1–2 m deep; (iv) clayey, organic-rich bottom soils; (v) skilled labour for diving and popping, traditionally the Mallah community.
Cultivation: traditionally grown in ponds, it is now also grown as a field crop in 30–40 cm of water, a method developed by ICAR at Darbhanga.
Producing areas: Bihar produces most of India's makhana, especially in the Mithila and Kosi–Seemanchal districts of Darbhanga, Madhubani, Purnea, Katihar, Saharsa and Supaul; 'Mithila Makhana' received a GI tag in 2022, and a Makhana Board was announced in the Union Budget 2025–26. It is also grown in Assam, Manipur and West Bengal.
Map: Map of north Bihar marking Darbhanga, Madhubani, Purnea, Katihar and Saharsa, with smaller areas in Assam, Manipur and West Bengal.
Makhana turns flood-prone wetlands into income.
Example 15 (UPSC 2023, 20 marks): Why India lags behind many other countries in agricultural productivity? Suggest suitable measures to raise productivity across the regions in a sustainable manner.
Paper and question: Paper II, Q8(a)
Approach: Show the productivity gap with comparative evidence, explain its physical, technological, institutional and economic causes, then suggest region-specific sustainable measures. Draw a map of crop yield variation across India.
India is among the world's largest producers of rice, wheat, pulses and milk, but its agricultural productivity (output per hectare and per worker) lags behind countries such as China, Egypt and the United States; for example, its paddy yield is well below China's, and yields vary several-fold between Punjab and Jharkhand.
Physical causes: about half the net sown area is rain-fed and exposed to monsoon variability, while soils are degraded by erosion, salinity and nutrient mining.
Technological causes: low seed replacement rates, imbalanced fertiliser use, limited mechanisation on small farms and weak extension services.
Institutional causes: tiny and fragmented holdings (average 1.08 ha), insecure tenancy, inadequate credit and insurance, and MSP procurement concentrated in a few states and crops.
Economic causes: poor markets, storage and processing raise post-harvest losses; low public investment in research and irrigation; and disguised unemployment, with too many workers on the land, lowers labour productivity.
Measures (region-specific and sustainable): (i) eastern India: extend the Bringing Green Revolution to Eastern India approach with tube-wells, flood-tolerant rice and better markets; (ii) rain-fed central and western India: watershed development, micro-irrigation, drought-tolerant millets and pulses, and soil moisture conservation; (iii) north-west: diversify away from paddy, restore soil health and save groundwater; (iv) hills and north-east: horticulture, organic farming and value chains; (v) everywhere: quality seeds, soil health cards, digital advisories, FPOs, crop insurance, investment in research and climate-resilient varieties.
Map: Map of India showing districts of high yields (Punjab, Haryana, western Uttar Pradesh, coastal Andhra Pradesh) and low yields (rain-fed Rajasthan, Jharkhand, Odisha, the north-east).
Raising yields in lagging regions, rather than further intensifying already high-input areas, is the most sustainable way to increase India's agricultural productivity.
Example 16 (UPSC 2020, 15 marks): Identify oilseeds producing areas in India and discuss the measures to promote edible oil industry.
Paper and question: Paper II, Q3(b)
Approach: Identify the producing areas of each major oilseed, explain India's edible oil deficit, then discuss measures to promote the edible oil sector. Draw a map of oilseed regions.
India is a major producer of oilseeds but also one of the world's largest importers of edible oil, meeting more than half of its consumption through imports of palm, soybean and sunflower oil.
Producing areas: (i) soybean on the black soils of Madhya Pradesh (Malwa), Maharashtra (Vidarbha, Marathwada) and Rajasthan (Hadoti); (ii) rapeseed–mustard, a rabi crop, in Rajasthan, the leading producer, followed by Haryana, Madhya Pradesh and Uttar Pradesh; (iii) groundnut in Gujarat (Saurashtra), Rajasthan, Tamil Nadu and Andhra Pradesh (Anantapur); (iv) sunflower in Karnataka; (v) sesame in Gujarat, West Bengal and Rajasthan; (vi) castor (non-edible) mostly in Gujarat; (vii) coconut in Kerala, Karnataka and Tamil Nadu; (viii) oil palm in Andhra Pradesh, Telangana and the north-east.
Why the deficit: about three-quarters of oilseeds are rain-fed with low yields, there is little irrigation and quality seed, and price competition from cheap imports discourages farmers.
Measures: (i) the National Mission on Edible Oils–Oil Palm (2021) to expand oil palm in the north-east and Andaman and Nicobar; (ii) the National Mission on Edible Oils–Oilseeds (2024) for high-yielding seeds and area expansion, including rice fallows; (iii) better MSP and procurement, and calibrated import duties; (iv) processing clusters, solvent extraction and the use of rice bran and cottonseed oil.
Map: Map of India showing soybean (Malwa–Vidarbha), mustard (Rajasthan–Haryana), groundnut (Saurashtra, Tamil Nadu), coconut (Kerala) and oil palm (Andhra Pradesh, north-east) areas.
A new 'Yellow Revolution' is needed to reduce import dependence.
Example 17 (UPSC 2020, 10 marks): Canal irrigation has led to monocropping in India. Explain with suitable examples.
Paper and question: Paper II, Q5(c)
Approach: Explain how canal irrigation encourages monocropping (assured water, water-intensive crops, procurement), give named examples, and note the consequences. Draw a map of canal commands and their dominant crops.
Canal irrigation supplies large, assured volumes of water at a flat, low charge, which encourages farmers to grow the same water-intensive crop season after season, leading to monocropping.
Examples: (i) the Bhakra, Sirhind and Western Yamuna canal commands of Punjab and Haryana, where a rice–wheat monoculture dominates, backed by MSP procurement; (ii) the Upper Ganga canal command of western Uttar Pradesh, with sugarcane; (iii) the Krishna–Godavari and Kaveri deltas, with continuous paddy; (iv) the Tungabhadra and Nagarjuna Sagar commands, with paddy and sugarcane; (v) the Indira Gandhi Canal in Rajasthan, where desert farmers shifted to water-hungry crops.
Consequences: waterlogging and soil salinity (Chambal, Indira Gandhi Canal and Sharda Sahayak commands), falling soil fertility, pest build-up, groundwater decline and vulnerability to price shocks.
Map: Map of India marking major canal commands (Bhakra, Indira Gandhi, Upper Ganga, Tungabhadra, Krishna–Godavari, Kaveri) and their dominant crops.
Volumetric water pricing, crop diversification and micro-irrigation can break this pattern.
Example 18 (UPSC 2018, 15 marks): Explain the contemporary agricultural scenario in the context of rapid urbanization in India.
Paper and question: Paper II, Q2(b)
Approach: Show the pace of urbanisation and explain how it is reshaping agriculture (land, demand, crop mix, peri-urban farming, labour, water, value chains), with positive and negative effects. Draw a von Thünen-type diagram around an Indian metropolis.
India's urban population was 31.1% in Census 2011 and has grown since, with expanding metros and many new towns. This rapid urbanisation is reshaping the agricultural scenario.
Land: farmland on city edges is converted to housing, industry and roads, as around Delhi NCR, Bengaluru, Hyderabad and Pune, and rising land prices make farming less attractive.
Demand and crop mix: urban consumers demand more fruits, vegetables, milk, eggs, meat and processed foods, encouraging horticulture, dairy and poultry near cities, which resembles von Thünen's concentric rings.
Peri-urban agriculture: intensive vegetable, flower and dairy farming around cities, sometimes irrigated with untreated wastewater, as along the Musi river in Hyderabad.
Labour and incomes: rural men migrate to cities, leading to the feminisation of agriculture, labour shortages and faster mechanisation, while remittances fund farm investment.
Value chains: organised retail, e-commerce, cold chains, contract farming and FPO supply to cities create new market links.
Water competition: cities draw water from rural reservoirs and aquifers, as Chennai and Bengaluru do.
Diagram: Concentric diagram around an Indian metropolis showing urban sprawl, then peri-urban vegetables, dairy and flowers, then field crops, then extensive farming.
Planned peri-urban agricultural zones and safe wastewater reuse can turn urbanisation into an opportunity for farmers.
Example 19 (UPSC 2018, 20 marks): Examine the ongoing process of agricultural diversification and its implications for food security in India.
Paper and question: Paper II, Q3(a)
Approach: Describe the ongoing diversification (crops, horticulture, livestock, fisheries, non-farm), its drivers and regional pattern, then examine its implications for each dimension of food security (availability, access, nutrition, stability). Draw a map of diversification.
Agricultural diversification is the shift of resources from staple cereals towards high-value crops (fruits, vegetables, spices, flowers), pulses and oilseeds, and allied activities (dairy, poultry, fisheries), as well as towards non-farm rural work.
The ongoing process: horticulture output has exceeded food grain output since 2012–13; India is the largest producer of milk and among the largest of eggs and fish; livestock and fisheries now contribute a growing share of agricultural value added; and coarse cereals have lost area to soybean, maize and cotton.
Drivers: rising incomes and urban demand, better roads and cold chains, export markets, water scarcity, and programmes such as the Mission for Integrated Development of Horticulture and the Blue Revolution.
Regional pattern: diversification is strongest in Maharashtra, Karnataka, Andhra Pradesh, Himachal Pradesh, Kerala and Gujarat, and weakest in the Punjab–Haryana rice–wheat belt and the poor eastern states.
Implications for food security: (i) availability: food grain production has still grown, exceeding 350 million tonnes in 2024–25 (Ministry of Agriculture estimates), so diversification has not undermined staples; (ii) access: higher farm incomes from high-value products improve household purchasing power; (iii) nutrition: greater supply of fruits, vegetables, milk, eggs and fish improves dietary diversity, which matters because NFHS-5 shows persistent stunting and anaemia; (iv) stability: a varied portfolio spreads climate and price risks.
Concerns: the decline of millets and pulses in some areas weakens nutrition and dryland resilience; perishable products face price crashes and post-harvest losses; and small farmers without market access may be left out.
Map: Map of India showing high diversification (Maharashtra, Karnataka, Andhra Pradesh, Himachal Pradesh, Kerala) and cereal-dominated regions (Punjab, Haryana, eastern Uttar Pradesh, Bihar).
Diversification that keeps a secure cereal base while promoting millets, pulses and animal products can strengthen both food and nutrition security.
Example 20 (UPSC 2016, 10 marks): Define agricultural intensity and bring out its regional distribution in India.
Paper and question: Paper II, Q1(d)
Approach: Define agricultural (cropping) intensity with its formula, give the national figure, then describe its regional distribution with reasons. Draw a choropleth map of cropping intensity.
Agricultural intensity, usually measured as cropping intensity, is the number of times a piece of land is cropped in a year: (gross cropped area ÷ net sown area) × 100. A value of 100 means one crop a year and 200 means two crops on all land. India's cropping intensity is a little over 150% (Land Use Statistics, Ministry of Agriculture).
High intensity (above about 180%): Punjab, Haryana and West Bengal, owing to assured canal and tube-well irrigation, fertile alluvium, mechanisation and MSP procurement for rice and wheat (Punjab), and multiple rice crops (aman, aus, boro) in West Bengal.
Medium intensity (about 130–170%): Bihar, Madhya Pradesh, Tripura and parts of Andhra Pradesh, Telangana and Tamil Nadu, where irrigation is partial.
Low intensity (below about 130%): Rajasthan, Gujarat, Maharashtra, Karnataka, Jharkhand, Mizoram and other rain-fed or hilly states, owing to low and erratic rainfall, poor irrigation and shallow soils.
Map: Choropleth map of India showing cropping intensity by state in three classes: high, medium and low.
Expanding irrigation, short-duration varieties and rabi cropping on rice fallows in eastern India can raise intensity sustainably.
Example 21 (UPSC 2015, 20 marks): Distinguish between 'agricultural productivity' and 'agricultural efficiency', and bring out the disparity in regional distribution of agricultural efficiency.
Paper and question: Paper II, Q3(a)
Approach: Define and distinguish productivity and efficiency (concept, measurement, authors), noting that the terms are sometimes used interchangeably, then describe the regional disparity in agricultural efficiency with reasons. Draw a map of efficiency regions.
Agricultural productivity is the ratio of output to a single input, most often yield per hectare (land productivity) or output per worker (labour productivity). It is a physical measure of how much a unit of land or labour produces.
Agricultural efficiency is a broader, relative concept: how well a region converts all its inputs (land, labour, water, capital, technology) into output compared with other regions or with its potential. It is measured with composite indices covering several crops, such as M.G. Kendall's ranking coefficient (1939), later used by L.D. Stamp, S.S. Bhatia's weighted yield index (1967) and Mohammad Shafi's productivity–efficiency index.
Distinction: productivity is crop-specific and absolute (for example, wheat yield in tonnes per hectare), whereas efficiency is multi-crop, relative and influenced by the combination of inputs and management. Many Indian studies, however, use the two terms loosely, so the distinction should be stated clearly.
Regional disparity in efficiency: (i) high efficiency: Punjab, Haryana and western Uttar Pradesh (irrigation, HYVs, mechanisation, procurement), the Krishna–Godavari and Kaveri deltas, and parts of Kerala and coastal Karnataka with high-value plantations; (ii) medium efficiency: irrigated parts of Gujarat, Maharashtra, Madhya Pradesh, West Bengal and Bihar; (iii) low efficiency: rain-fed western Rajasthan, Bundelkhand, the tribal plateau of Jharkhand, Chhattisgarh and Odisha, and the hill and north-eastern states, which face poor irrigation, degraded soils, small holdings and weak markets.
Reasons: the disparity reflects differences in irrigation, soils and rainfall, the uneven spread of the Green Revolution, institutional factors such as tenancy and markets, and the level of infrastructure.
Map: Map of India showing high-, medium- and low-efficiency regions based on a composite index, with the Green Revolution belt and the deltas highlighted.
Narrowing efficiency gaps requires extending irrigation, technology and institutional reform to the lagging eastern and rain-fed regions.
3. Green Revolution and Dry Farming
Example 22 (UPSC 2023, 15 marks): Why are millets considered as 'nutri-cereals' and climate-resilient? Discuss the constraints and opportunities of millet cultivation in India.
Paper and question: Paper II, Q2(b)
Approach: Explain why millets are called nutri-cereals (nutritional profile) and climate-resilient (physiology and agronomy), then discuss constraints and opportunities with Indian policy. Draw a map of millet-growing regions.
Millets (jowar, bajra, ragi and small millets such as kodo, kutki, foxtail and barnyard) were notified as nutri-cereals by the Government of India in 2018, and 2023 was declared the International Year of Millets by the UN on India's proposal; they are promoted as 'Shree Anna'.
Why nutri-cereals: they are rich in dietary fibre, protein, minerals and vitamins; ragi is very rich in calcium, and bajra in iron. They are gluten-free with a low glycaemic index, which helps manage diabetes, and so they help address India's 'hidden hunger' (anaemia and micronutrient deficiency).
Why climate-resilient: most are hardy, short-duration crops that grow on poor, shallow soils with 200–600 mm of rain; many, such as bajra and jowar, are C₄ plants that use water efficiently, tolerate heat and drought, need few inputs and have a lower carbon footprint than rice.
Constraints: low yields and little research investment; the shift of area to rice, wheat, soybean and maize after the Green Revolution; weak MSP procurement and markets; processing difficulties (dehulling small millets); limited shelf life; and changing consumer preferences.
Opportunities: inclusion in PDS and PM POSHAN, state millet missions (Odisha Millet Mission, 2017), health-conscious urban and export markets, start-ups and value-added products, and the Global Centre of Excellence at the Indian Institute of Millets Research, Hyderabad.
Map: Map of India showing bajra (Rajasthan, Uttar Pradesh, Haryana, Gujarat), jowar (Maharashtra, Karnataka), ragi (Karnataka, Tamil Nadu, Uttarakhand) and small millet (Odisha, Madhya Pradesh, Chhattisgarh) regions.
Millets can link nutrition security with climate adaptation if markets and processing are strengthened.
Example 23 (UPSC 2022, 15 marks): Discuss the importance of 'Dry-land' farming in the drought-prone regions of India.
Paper and question: Paper II, Q4(b)
Approach: Define dryland farming and its extent, then discuss its importance in drought-prone regions (food, livelihoods, livestock, ecology, climate resilience), its techniques and problems, with programmes. Draw a map of dryland regions.
Dryland farming is crop production without irrigation in areas of low and erratic rainfall, typically below about 750 mm, relying on conserved soil moisture. Rain-fed land makes up about half of India's net sown area and, according to ICAR's Central Research Institute for Dryland Agriculture, produces about 40% of the country's food grains.
Importance in drought-prone regions: (i) food and nutrition: it supplies most of India's coarse cereals, pulses and oilseeds, such as bajra in Rajasthan, jowar in Maharashtra and Karnataka, tur and gram, and groundnut in Saurashtra and Anantapur; (ii) livelihoods: it supports a large share of India's rural poor in Rajasthan, Marathwada, Vidarbha, Rayalaseema, Bundelkhand and interior Karnataka; (iii) livestock: crop residues and pastures sustain much of the country's livestock, which acts as drought insurance; (iv) ecology: drought-hardy crops and low-input farming conserve scarce groundwater and soils; (v) climate resilience: millets and pulses withstand heat and drought better than rice and wheat.
Techniques: contour bunding, ridges and furrows, mulching, farm ponds, intercropping, short-duration varieties, and integrated crop–livestock–tree systems.
Problems and support: low yields, crop failure and farmer distress are common, but watershed development under PMKSY, the National Mission for Sustainable Agriculture, crop insurance and millet promotion offer support.
Map: Map of India showing dryland regions with less than 750 mm rainfall: western Rajasthan, Kutch, Marathwada, Rayalaseema, interior Karnataka, Bundelkhand and the Deccan rain shadow.
Making dryland farming productive is central to drought-proofing India's agriculture.
Example 24 (UPSC 2019, 10 marks): Explain the significance of dry farming in drought prone areas of India.
Paper and question: Paper II, Q1(d)
Approach: Define dry farming briefly, then give its significance in drought-prone areas (food, livelihoods, conservation, resilience) with key techniques. Draw a map of drought-prone dry farming areas.
Dry farming is cultivation in areas receiving less than about 750 mm of rain without irrigation, using techniques that conserve every drop of soil moisture. It is the dominant farming system in India's drought-prone areas.
Significance: (i) it is the only viable farming in large parts of western Rajasthan, Kutch, Marathwada, Rayalaseema, interior Karnataka and Bundelkhand, where irrigation is limited; (ii) it produces most of India's millets, pulses and oilseeds, which are vital for nutrition and reduce edible oil and pulse imports; (iii) it sustains the livelihoods of millions of small farmers and of pastoralists whose livestock depend on crop residues; (iv) drought-hardy crops conserve groundwater; (v) it builds resilience to climate change.
Techniques: deep ploughing and mulching to retain moisture, contour bunds and farm ponds, short-duration and drought-tolerant varieties, intercropping (for example bajra with moth or guar), and agroforestry with khejri.
Map: Map of India marking drought-prone dry farming areas: western Rajasthan, Kutch, Marathwada, Rayalaseema, interior Karnataka and Bundelkhand.
Watershed programmes and millet promotion can make dry farming more productive and secure.
Example 25 (UPSC 2016, 15 marks): "India has paid heavily for achievement of Green Revolution in the form of economic, social and ecological cost." Discuss.
Paper and question: Paper II, Q8(b)
Approach: Acknowledge the achievements of the Green Revolution briefly, then discuss its economic, social and ecological costs with regional evidence, ending with a balanced judgement. Draw a map of the Green Revolution belt and its problem areas.
The Green Revolution (from 1966–67), based on high-yielding wheat and rice, fertilisers, irrigation and assured prices, ended India's dependence on food imports. But its gains were concentrated, and its costs have grown.
Economic costs: rising input costs (seeds, fertilisers, diesel, pesticides) and falling returns once yields plateaued; a huge fertiliser, power and procurement subsidy burden; regional inequality, since Punjab, Haryana and western Uttar Pradesh gained while the rain-fed east and centre lagged; and indebtedness among small farmers.
Social costs: widening gaps between large and small farmers and landless labourers; displacement of labour by machines; decline of crop and dietary diversity as rice and wheat replaced millets and pulses; and, in Punjab, rural distress, farmer suicides and health problems linked to agrochemicals.
Ecological costs: groundwater depletion (Punjab's stage of extraction about 156%, CGWB 2025); soil degradation, salinity and micronutrient deficiency; pesticide residues and water pollution; stubble burning that worsens air pollution in north India every October–November; and loss of traditional crop varieties.
Balanced view: the costs were real, but without the Green Revolution India could have faced famine in the 1960s; the problem lies in continuing an unchanged model rather than in the revolution itself.
Map: Map of India showing the Green Revolution core (Punjab, Haryana, western Uttar Pradesh) with groundwater-stressed blocks, salinity patches and stubble-burning areas.
An 'evergreen revolution', in M.S. Swaminathan's phrase, that raises productivity without ecological harm is now the need.
Example 26 (UPSC 2015, 15 marks): With the help of a map, indicate the principal areas of dryland farming in the country and account for farmers' suicides mainly in those areas.
Paper and question: Paper II, Q3(b)
Approach: Describe and map the principal dryland farming areas, then account for the concentration of farmer suicides there (climatic, economic, institutional and social causes) with NCRB data, ending with remedies. Draw the map the question asks for.
Dryland farming is practised without irrigation in areas receiving less than about 750 mm of rain.
Principal areas: western Rajasthan and Kutch; the Deccan rain-shadow belt of Marathwada, Vidarbha (partly), north interior Karnataka, Telangana and Rayalaseema (Anantapur); Bundelkhand in Uttar Pradesh and Madhya Pradesh; and parts of interior Tamil Nadu and Gujarat (Saurashtra).
Farmer suicides: NCRB's Accidental Deaths and Suicides in India report recorded about 11,290 suicides in the farming sector in 2022, with Maharashtra the highest, and they cluster in Vidarbha, Marathwada, north Karnataka, Telangana and Anantapur.
Reasons: (i) climatic risk: erratic rain and repeated droughts cause crop failure; (ii) costly cash crops: farmers shifted to Bt cotton and soybean with high input costs, and pest attacks such as the pink bollworm cause losses; (iii) debt: loans from moneylenders at high interest, and limited formal credit for tenants; (iv) prices: volatile prices and weak procurement of cotton and pulses; (v) institutional gaps: limited irrigation, delayed insurance claims and poor extension; (vi) social factors: wedding and health expenses, and the stigma of failure.
Remedies: watershed development and protective irrigation, crop diversification towards millets and pulses, timely insurance, institutional credit for tenants, income support, and mental-health and counselling services.
Map: Outline map of India shading dryland farming areas (Rajasthan, Kutch, Marathwada, Vidarbha, north Karnataka, Telangana, Rayalaseema, Bundelkhand) and marking suicide-prone districts such as Yavatmal and Anantapur.
Farmer distress in drylands is thus a product of risk without protection, and it can be reduced by making dryland farming resilient.
Example 27 (UPSC 2014, 15 marks): 'In spite of various negative impacts of Green Revolution, there is a demand for New Green Revolution'. Elaborate.
Paper and question: Paper II, Q4(b)
Approach: Summarise the negative impacts of the first Green Revolution, then explain why a new Green Revolution is still demanded (food demand, lagging regions, nutrition, climate) and what it should look like. Draw a map of target regions.
The first Green Revolution made India food self-sufficient but left regional imbalance, groundwater depletion, soil degradation, chemical pollution and a narrow rice–wheat focus.
Why a new Green Revolution is demanded: (i) rising demand: a growing, richer population needs more and more varied food; (ii) stagnant yields: yields in the Punjab–Haryana belt have plateaued, while eastern India has untapped potential with abundant water and fertile soils; (iii) nutrition: pulses, oilseeds, millets, fruits, vegetables and animal products are needed to fight malnutrition; (iv) climate change: heat-tolerant, flood- and drought-resistant varieties are required; (v) farm incomes: small farmers need higher-value, lower-cost production.
What it should be: (i) regionally targeted, as in Bringing Green Revolution to Eastern India (2010–11) for Bihar, eastern Uttar Pradesh, Odisha, West Bengal, Assam, Jharkhand and Chhattisgarh; (ii) sustainable, using micro-irrigation, balanced nutrients, integrated pest management and natural farming; (iii) technology-led, with biotechnology, digital agriculture and precision farming; (iv) inclusive, through FPOs, credit and market access for small farmers; (v) diversified, covering pulses, oilseeds, horticulture, dairy and fisheries.
Map: Map of India marking the first Green Revolution belt (Punjab, Haryana, western Uttar Pradesh) and the target regions for a new one (eastern India, rain-fed central India, the north-east).
A new 'evergreen revolution' must raise output without repeating the ecological mistakes of the first.
4. Livestock, White Revolution, Aquaculture, Sericulture, Apiculture and Poultry
Example 28 (UPSC 2025, 15 marks): What are the challenges of dairy sector in India? Describe the contribution of bovine population.
Paper and question: Paper II, Q3(c)
Approach: Give the size and contribution of India's bovine population and dairy output with official data, then discuss the challenges of the dairy sector and the responses. Draw a map of milk-producing regions.
India is the world's largest milk producer, with output of about 239 million tonnes in 2023–24 (Basic Animal Husbandry Statistics, 2024), and the 20th Livestock Census (2019) counted about 303 million bovines (cattle and buffalo), the largest bovine population in the world.
Contribution of bovines: (i) milk: buffaloes and crossbred cattle supply most of the milk, making dairy India's largest agricultural product by value; (ii) livelihoods: dairy supports tens of millions of rural households, mainly smallholders and landless families, and women do much of the work; (iii) draught power and dung: bullocks still work small farms, and dung provides manure, fuel and biogas; (iv) leading states: Uttar Pradesh, Rajasthan, Madhya Pradesh, Gujarat and Andhra Pradesh are the top producers.
Challenges: (i) low yield per animal compared with world averages; (ii) shortage of green and dry fodder and grazing land; (iii) diseases such as foot-and-mouth disease and lumpy skin disease (2022); (iv) heat stress from climate change; (v) a large unorganised sector with poor quality and cold chains, especially in eastern India where cooperatives are weak; (vi) stray and unproductive cattle.
Responses: Rashtriya Gokul Mission (2014) for indigenous breeds, the National Animal Disease Control Programme (2019), the National Programme for Dairy Development, and expansion of cooperatives under the White Revolution 2.0 plan.
Map: Map of India showing leading milk-producing states and cooperative milk-sheds (Anand in Gujarat, Punjab, western Uttar Pradesh).
Raising productivity per animal and extending cooperatives to the east are the keys to the sector's future.
Example 29 (UPSC 2023, 15 marks): India's poultry sector has become one of the fastest growing areas of the country's agricultural sector. Examine its opportunities and challenges.
Paper and question: Paper II, Q7(b)
Approach: Show the growth and geography of the poultry sector with data, then examine its opportunities and challenges, ending with the way forward. Draw a map of poultry clusters.
India's poultry sector has grown far faster than crop agriculture, turning from backyard rearing into a commercial, largely vertically integrated industry. India produced about 143 billion eggs in 2023–24 (Basic Animal Husbandry Statistics) and is among the world's leading producers of eggs and broiler meat.
Geography: the industry is concentrated in the south and west, with Andhra Pradesh, Tamil Nadu (the Namakkal egg cluster), Telangana, Karnataka and Maharashtra leading, alongside Haryana and West Bengal; backyard poultry remains important in tribal and north-eastern areas.
Opportunities: (i) rising demand for affordable animal protein with urbanisation and changing diets; (ii) short production cycles and quick returns suit small farmers through contract farming; (iii) nutrition gains, since eggs in mid-day meals and anganwadis help tackle malnutrition; (iv) employment for women in backyard units.
Challenges: (i) feed costs, since maize and soybean meal make up most of the cost and their prices are volatile; (ii) diseases such as avian influenza, which force mass culling; (iii) antibiotic misuse and antimicrobial resistance; (iv) dependence of contract growers on large integrators; (v) weak cold chains and processing, as most chicken is sold live.
Way forward: feed security through maize expansion, biosecurity and vaccination, controls on antibiotics, processing and cold chains, and support for backyard poultry under the National Livestock Mission.
Map: Map of India marking major poultry clusters: Namakkal, Hyderabad–Chittoor, Pune–Nashik, Haryana and West Bengal.
With sustainable feed and biosecurity, poultry can remain the fastest-growing source of farm income and nutrition.
Example 30 (UPSC 2015, 15 marks): Discuss the scope of replication of 'White Revolution' in India.
Paper and question: Paper II, Q4(c)
Approach: Explain the White Revolution model (Operation Flood and the Anand pattern) and the conditions behind its success, then assess where and how it could be replicated (sectors and regions), with limits. Draw a map of milk-sheds and replication regions.
The White Revolution refers to Operation Flood (1970–1996), run by the National Dairy Development Board under Verghese Kurien, which replicated Gujarat's Anand pattern of village milk cooperatives (Amul, 1946) across India and made the country the world's largest milk producer.
Why it succeeded: a three-tier cooperative structure (village, district union, state federation) owned by producers; assured procurement and fair prices; a national milk grid linking rural milk-sheds to urban markets; veterinary, breeding and feed services; and inclusion of small and landless producers, especially women.
Scope for replication by sector: (i) fisheries (the Blue Revolution) through fisher cooperatives, cold chains and PMMSY (2020); (ii) oilseeds and pulses, as tried in the Technology Mission on Oilseeds (1986), through cooperative procurement and processing; (iii) horticulture, as with Maharashtra's grape cooperatives (Mahagrapes) and FPOs; (iv) poultry, honey and sericulture through collective marketing.
Scope for replication by region: dairy cooperatives remain weak in Bihar (where Sudha has had some success), Jharkhand, Odisha, Assam and the north-east, so extending the Anand pattern there could raise rural incomes.
Limits: perishable products need costly cold chains; political interference and poor management have weakened many cooperatives; and private dairies and FPOs now compete.
Map: Map of India marking strong dairy cooperative regions (Gujarat, Karnataka, Maharashtra, Punjab), weak regions with scope (Bihar, Odisha, Assam, the north-east) and potential Blue and Yellow Revolution areas.
The core lesson, producer ownership with assured markets, can be replicated wherever small producers dominate.
5. Agricultural Regionalisation, Agro-climatic Zones and Agro-ecological Regions
Example 31 (UPSC 2026, 15 marks): Divide India into agro-ecological regions and highlight the salient features of any one of them.
Paper and question: Paper II, Q4(c)
Approach: Explain the basis of the agro-ecological regions (NBSS&LUP), give the broad grouping of the 20 regions with examples, then describe one region in detail. Draw a map of agro-ecological regions.
An agro-ecological region is an area with broadly uniform physiography, soils, bioclimate and length of growing period (LGP, the days when moisture and temperature allow crop growth). On this basis ICAR's National Bureau of Soil Survey and Land Use Planning (NBSS&LUP) divided India into 20 agro-ecological regions and 60 sub-regions in the early 1990s.
Broad grouping: (i) arid regions with LGP under about 90 days, such as the cold arid western Himalaya (Ladakh) and the hot arid Thar and Kutch; (ii) semi-arid regions with LGP of about 90–150 days, such as the Deccan plateau; (iii) sub-humid regions with LGP of about 150–210 days, such as the middle Gangetic plain and Chotanagpur; (iv) humid to per-humid regions with LGP above 210 days, such as the Bengal–Assam plains and the north-east; (v) coastal regions, the eastern coastal plain and the Western Ghats with the west coast; and (vi) the islands.
Region in detail: Western Ghats and west coastal plain (hot humid to per-humid): (i) very heavy south-west monsoon rain, often above 2,000–3,000 mm, giving a long growing period of over 210 days; (ii) laterite, red and coastal alluvial soils that are acidic and leached; (iii) rice in valleys and coastal lowlands, with plantation crops (coconut, arecanut, rubber, cashew, coffee, pepper, cardamom) on slopes; (iv) problems of erosion, landslides and acidity.
Map: Map of India showing the 20 agro-ecological regions grouped by bioclimate, with the Western Ghats and coastal region highlighted.
Agro-ecological regions help match crops to ecological potential.
Example 32 (UPSC 2025, 15 marks): How does the agricultural sector of India confront with the contemporary physical and politico-economic changes in the different regions of the country? Elucidate.
Paper and question: Paper II, Q2(c)
Approach: Identify the contemporary physical changes (climate, water, soil, hazards) and politico-economic changes (policy, markets, trade, technology), then show region by region how agriculture is confronting them, ending with adaptation. Draw a map of regional challenges.
Indian agriculture today faces two sets of change at once: physical changes driven by climate and resource stress, and politico-economic changes in policy, markets and trade, and their combination differs by region.
North-western plains (Punjab, Haryana, western Uttar Pradesh): physically, falling water tables, soil fatigue and heat stress on wheat; politically and economically, dependence on MSP procurement of rice and wheat, resistance to market reform (the 2020–21 protests against the farm laws). The response is a slow move towards diversification and direct seeding of rice.
Eastern plains (Bihar, eastern Uttar Pradesh, West Bengal, Assam): floods, waterlogging and erratic monsoons combine with small holdings, weak procurement and outmigration. The region is responding with boro rice, maize, makhana and fisheries.
Central and Deccan drylands (Vidarbha, Marathwada, Telangana, Karnataka): recurrent droughts and pest outbreaks meet volatile cotton and soybean prices and farmer distress, so farmers are turning to micro-irrigation, millets and crop insurance.
Coastal and delta regions: cyclones, salinity intrusion and sea-level rise affect the Kaveri and Godavari deltas and Odisha, while export demand drives aquaculture.
Himalaya and the north-east: warming shifts apple belts upward and causes cloudbursts, while organic and horticulture missions offer opportunities.
National politico-economic changes: PM-KISAN, digital agriculture, FPOs, export bans on wheat (2022) and some rice (2023) affect all regions.
Map: Map of India marking each region's main physical stress and policy issue: groundwater and MSP in the north-west, floods in the east, drought and distress in the Deccan, cyclones in the deltas, and warming in the Himalaya.
Region-specific, climate-smart strategies backed by stable policy are needed to help farmers adapt.
Example 33 (UPSC 2022, 20 marks): How do agro-climatic and land capability indicators assist in macro-agricultural regionalisation of India? Illustrate with an appropriate map.
Paper and question: Paper II, Q8(a)
Approach: Explain agro-climatic indicators and land capability indicators, show how they are combined in macro-regionalisation, illustrate with the Planning Commission's 15 agro-climatic regions (1989), and evaluate. Draw the map the question asks for.
Agricultural regionalisation divides a country into areas with similar conditions and potential for farming. At the macro level, it relies on two sets of indicators: agro-climatic indicators, which show what the climate allows, and land capability indicators, which show what the land can sustain.
Agro-climatic indicators: rainfall amount and variability, temperature, the moisture index (Thornthwaite) and length of growing period, which decide the cropping season and crop choice.
Land capability indicators: soil depth, texture, fertility, slope, erosion hazard, drainage, salinity and irrigation potential, grouped in the USDA-derived system into eight classes: classes I–IV are suitable for cultivation with increasing limitations, and classes V–VIII are suitable only for pasture, forestry or wildlife.
How they assist: overlaying climatic zones on land capability classes identifies homogeneous macro-regions with similar potentials and constraints, and these then guide crop planning, irrigation, soil conservation and research priorities.
Illustration: the Planning Commission's Agro-Climatic Regional Planning (1989) divided India into 15 regions: the Western Himalayan, Eastern Himalayan, Lower Gangetic Plain, Middle Gangetic Plain, Upper Gangetic Plain, Trans-Gangetic Plain, Eastern Plateau and Hills, Central Plateau and Hills, Western Plateau and Hills, Southern Plateau and Hills, East Coast Plains and Hills, West Coast Plains and Ghats, Gujarat Plains and Hills, Western Dry Region, and the Islands. Their boundaries combine climate (for example, the Western Dry Region below about 500 mm) with land capability (hill slopes, plateau soils and fertile plains).
Evaluation: the scheme links planning to natural potential, but it follows district boundaries for administrative convenience and its regions are large and internally varied; ICAR's 127 agro-climatic zones and NBSS&LUP's 20 agro-ecological regions provide finer detail.
Map: Outline map of India showing the 15 agro-climatic regions of the Planning Commission, with major isohyets and areas of land capability classes V–VIII (hills, desert) indicated.
Combining climatic and land capability indicators therefore makes regionalisation a practical tool for sustainable agricultural planning.
Example 34 (UPSC 2019, 20 marks): Correlate the agro-climatic zones with agro-ecological regions of India.
Paper and question: Paper II, Q2(a)
Approach: Define both schemes (agencies, criteria, number, boundaries, purpose), then correlate them region by region, showing where they coincide and where they diverge, and conclude on their complementary use. Draw a comparative map.
Agro-climatic zones were delineated by the Planning Commission (1989) as 15 regions for resource-based planning, using climate, physiography, soils, water resources and cropping, with district boundaries. Agro-ecological regions were delineated by ICAR–NBSS&LUP in the early 1990s as 20 regions (60 sub-regions), using physiography, soils, bioclimate and length of growing period, with ecological rather than administrative boundaries.
Common basis: both rest on climate (especially moisture availability), relief and soils, so their broad patterns coincide.
Correspondences: (i) the Western Dry Region corresponds to the hot arid western plain and Kutch; (ii) the Trans-Gangetic and Upper Gangetic plains correspond to the semi-arid and sub-humid northern plain; (iii) the Middle and Lower Gangetic plains correspond to the sub-humid Gangetic plain and the humid Bengal–Assam plain; (iv) the Western and Southern Plateau and Hills correspond to the hot semi-arid Deccan regions; (v) the Eastern Plateau and Hills correspond to the sub-humid Chotanagpur plateau and Chhattisgarh basin; (vi) the West Coast Plains and Ghats correspond to the humid Western Ghats and coastal plain; (vii) the Western and Eastern Himalayan regions correspond to the cold arid, sub-humid and humid Himalayan regions; and (viii) the Islands match in both.
Divergences: (i) the Western Himalayan agro-climatic region contains both cold arid Ladakh and sub-humid Himachal, which the agro-ecological scheme separates; (ii) agro-ecological regions cut across state and district lines, for example the semi-arid Deccan spans Maharashtra, Karnataka and Telangana.
Purpose: agro-climatic regions serve administrative planning and resource allocation, while agro-ecological regions serve land-use planning and crop suitability; ICAR's 127 zones bridge the two for research and extension.
Map: Comparative map of India overlaying the 15 agro-climatic region boundaries on the 20 agro-ecological regions, showing areas of correspondence and divergence.
The two schemes are complementary: agro-ecological regions show ecological potential, and agro-climatic regions turn it into district-level plans.
Mains points
- Institutional questions (land reforms, holdings, credit, MSP, NFSA, farm laws, e-NAM, FPOs) recur almost every year: give the scheme, its year, its spatial effect and a critical evaluation.
- Geography of agriculture is regional: always say where (Punjab–Haryana rice–wheat, Vidarbha cotton, Bihar makhana, Malwa soybean) and support it with a crop or region map.
- Use the standard measures and their authors: cropping intensity, Weaver's crop combination, Bhatia's and Shafi's efficiency indices, Kendall's ranking coefficient, and land capability classes.
- Link the Green Revolution, dry farming and millets to sustainability: groundwater, soil health, climate resilience, nutrition and farmer distress (NCRB data).
- Regionalisation questions expect the Planning Commission's 15 agro-climatic regions (1989), ICAR–NBSS&LUP's 20 agro-ecological regions and a comparison of the two, with a map.
Did you know?
- Bihar's Mithila region grows most of India's makhana (fox nut), which received a GI tag as 'Mithila Makhana' in 2022; the seeds are harvested by divers from the muddy beds of ponds.
Geography Optional: All chapters
- Exam Pattern, Syllabus and Strategy
- The Earth's Interior and Tectonics
- Geomorphic Processes and Landscape Development
- Climatology: Atmosphere and Circulation
- Climatology: Weather Systems, Climates and Climate Change
- Oceanography
- Biogeography
- Environmental Geography
- Perspectives in Human Geography
- Economic Geography
- Population Geography
- Settlement Geography
- Regional Planning
- Models, Theories and Laws in Human Geography
- India: Physical Setting I
- India: Physical Setting II
- Resources of India
- Agriculture in India
- Industry in India
- Transport, Communication and Trade
- Cultural Setting and Population of India
- Settlements in India
- Regional Development and Planning in India
- Political Aspects
- Contemporary Issues
- Places for the Map Question