
Economics Optional · UPSC Notes
Agriculture after Liberalisation — UPSC Economics Optional Notes
Free, exam-focused notes for UPSC Prelims and Mains, with Prelims tips and Mains points for every topic. 5 topics.
Open in the interactive reader: bookmarks, progress tracking and read-aloud.
Agriculture and the WTO
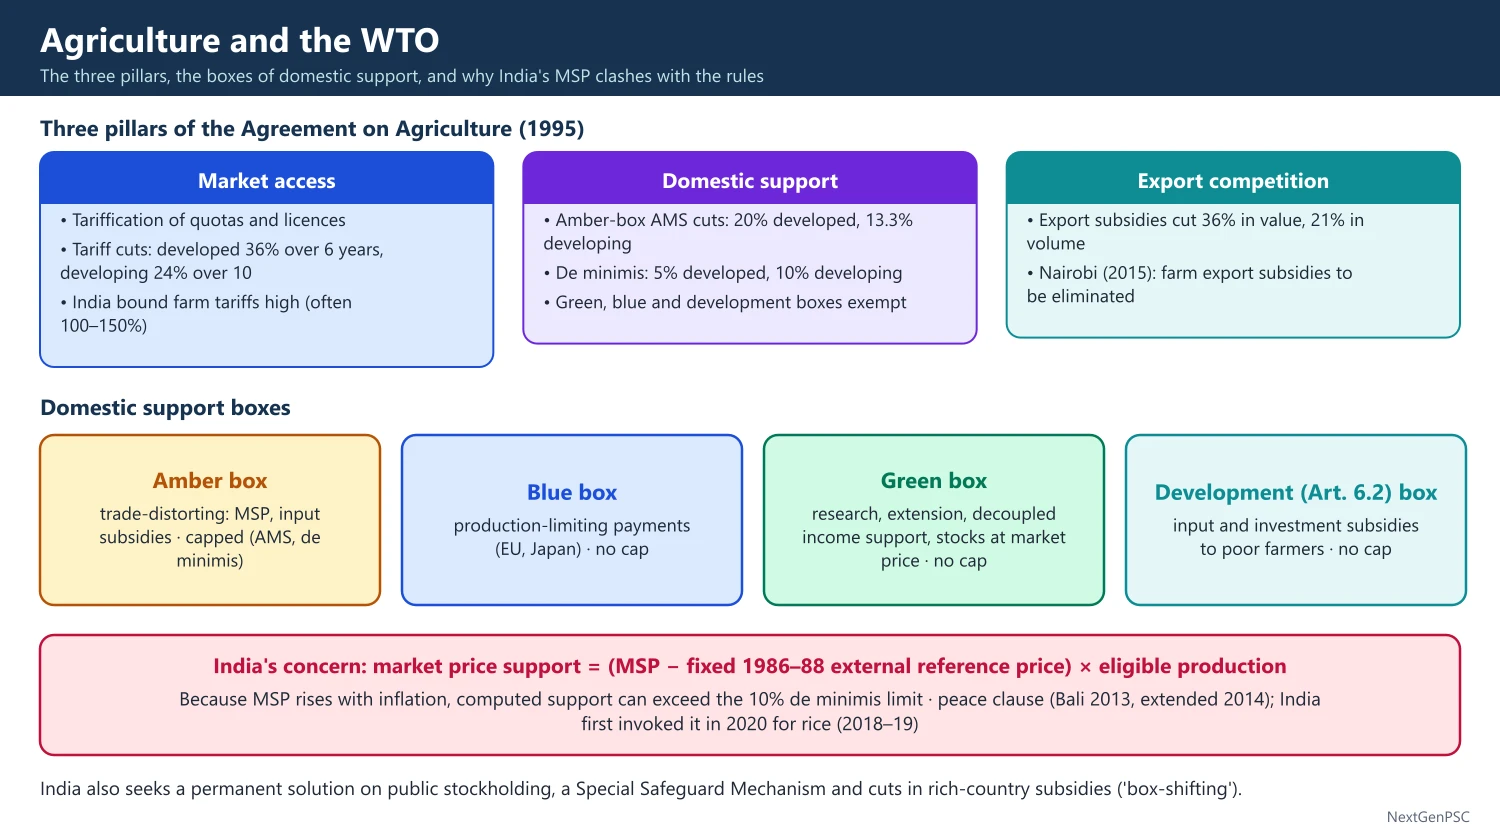
The Agreement on Agriculture (AoA, 1995) brought farm trade under WTO rules through three pillars: market access, domestic support and export competition. India's main concerns are the treatment of MSP-based procurement for public stockholding under the amber box, the 1986–88 external reference price, a special safeguard mechanism for developing countries, and the large subsidies of rich countries.
In simple words
The WTO's Agreement on Agriculture sets rules on how much countries can protect and subsidise their farmers.
Think of it as a referee in a race where rich runners already have expensive shoes; poor runners want time to catch up.
India buys rice and wheat at MSP to feed the poor, and WTO rules may count this as a trade-distorting subsidy, so India fights for a permanent solution.
UPSC asks how WTO rules affect Indian farmers, food security and MSP.
1. Background and Concepts
From GATT to WTO: agriculture was largely outside GATT disciplines until the Uruguay Round (1986–94); the WTO began on 1 January 1995 with the AoA as one of its agreements.
Why agriculture was special: rich countries (EU's Common Agricultural Policy, US farm bills) paid large subsidies and dumped surpluses, depressing world prices for developing-country farmers.
Tariffication: all non-tariff barriers (quotas, licences) were converted into tariff equivalents and bound; India, as a developing country, bound most farm tariffs at high ceilings (often 100–150%), leaving wide policy space.
Special and differential treatment (S and DT): developing countries got lower reduction commitments and longer periods; least developed countries were exempt from reductions.
2. The Three Pillars of the AoA
Market access: developed countries cut tariffs by an average 36% over six years and developing countries by 24% over ten years; minimum access tariff quotas were set.
Domestic support — amber box: trade-distorting support (market price support, input subsidies) measured by the Aggregate Measurement of Support (AMS); developed countries cut it 20% over six years and developing countries 13.3% over ten years.
De minimis: amber-box support is allowed up to 5% of the value of production for developed and 10% for developing countries, product-specific and non-product-specific.
Blue box: payments linked to production-limiting programmes (Article 6.5), used by the EU and Japan.
Green box: minimally trade-distorting support (Annex 2) such as research, extension, infrastructure, decoupled income support and public stockholding at market prices; not capped, which rich countries use heavily.
Development box (Article 6.2): investment subsidies and input subsidies to low-income or resource-poor farmers in developing countries are exempt; India's fertiliser, power and irrigation subsidies largely fall here.
Export competition: developed countries cut export subsidy value by 36% and volume by 21%; the Nairobi Ministerial (2015) agreed to eliminate agricultural export subsidies (developed immediately, developing by 2018 with some until 2023).
3. India's Concerns: MSP and Public Stockholding
The problem: market price support is calculated as (administered price − fixed external reference price) × eligible production, with the reference price fixed at 1986–88 levels; because MSP has risen with inflation, the computed support can exceed the 10% de minimis limit even though real support is small.
Bali Ministerial (December 2013): an interim 'peace clause' protected public stockholding programmes for food security from legal challenge, subject to transparency conditions; the General Council (November 2014) extended it until a permanent solution is found.
India invokes the peace clause: in 2020 India became the first country to invoke it, for rice support in the 2018–19 marketing year exceeding 10% of the value of production, and it has invoked it again for later years.
Challenges: the US, Australia and others have questioned India's wheat, rice and pulses support in WTO committees; in the sugar dispute brought by Australia, Brazil and Guatemala, a panel (December 2021) found India's sugar support and export subsidies inconsistent; India appealed 'into the void' as the Appellate Body has not functioned since December 2019.
India's demands: a permanent solution on public stockholding, updating the reference price for inflation, a Special Safeguard Mechanism (SSM) to raise tariffs during import surges or price falls, and cuts in rich-country subsidies, including green-box payments that critics call 'box-shifting'.
4. Ministerial Conferences and Recent Developments
Doha Round (2001): the 'development round' stalled, mainly over agriculture; the July 2008 talks collapsed over the SSM dispute between India and the US.
MC12, Geneva (June 2022): agreed to exempt World Food Programme humanitarian purchases from export restrictions, a food security declaration, an Agreement on Fisheries Subsidies (which entered into force on 15 September 2025) and a TRIPS waiver for COVID-19 vaccines.
MC13, Abu Dhabi (February–March 2024): no outcome on agriculture or public stockholding.
MC14, Yaoundé, Cameroon (26–29 March 2026): ended without agreement on agriculture, and the moratorium on customs duties on electronic transmissions lapsed for the first time since 1998; draft texts were sent back to the General Council.
India's export restrictions: India banned or restricted wheat (May 2022), broken rice (September 2022) and non-basmati white rice exports (July 2023) to control domestic prices, drawing criticism from importers; most rice curbs were eased in 2024.
5. Impact on Indian Agriculture
Expected gains: reformers argued that cuts in rich-country subsidies would raise world prices and India's farm exports; India's agricultural exports grew strongly in the 2000s (rice, marine products, spices, cotton, buffalo meat).
Actual outcome: rich-country support shifted to the green box rather than falling, so price distortions remained (the 'box-shifting' critique by Third World Network and others).
Import surges: after QRs were removed in 2001 (following the US BoP dispute that India lost in 1999), edible oil imports surged and India now imports over half its edible oil.
Policy space: high bound tariffs and the development box mean the AoA has so far constrained India less than feared; the main legal risk is the MSP calculation.
Food security vs trade: the peace clause protects NFSA procurement, but stocks procured under it cannot distort world trade, which limits exports from public stocks.
6. Diagrams to Draw
Effect of an export subsidy: draw world supply and demand; an export subsidy by a large country shifts world supply right, lowering the world price from P1 to P2, which hurts unsubsidised exporters and farmers in importing developing countries.
Tariff in a small country: draw domestic D and S with a horizontal world price Pw; a tariff raises the domestic price to Pw + t; show the fall in imports, the gain to producers, the tariff revenue and the two deadweight-loss triangles.
Three boxes chart: draw three columns (amber, blue, green) with examples and limits to show what is capped and what is not.
7. Theory and Debates
Free trade view: Bhagwati and others argue that freer farm trade raises efficiency and that rich-country subsidies, not WTO rules, hurt the poor.
Food sovereignty view: groups like La Via Campesina and many Indian economists (e.g. Biswajit Dhar) argue that food security and livelihoods justify protection and public stockholding.
Prebisch-Singer link: volatile and declining terms of trade for primary goods support the case for safeguards such as the SSM.
Indian example — rice exports: India became the world's largest rice exporter (around 40% of world trade in some recent years), so its export curbs in 2022–23 moved world prices, showing how domestic food policy and trade rules interact.
Indian example — edible oils: low applied tariffs on palm oil kept consumer prices down but hurt domestic oilseed farmers, which led to the National Mission on Edible Oils (2021 for oil palm; 2024 for oilseeds).
World example: the US cotton subsidy case (Brazil vs US, DS267, 2004–05) showed that WTO rulings can discipline rich-country subsidies, but compliance was slow and was settled through compensation.
8. Using It in the Exam
10-mark answer: define the three pillars and three boxes, and state India's MSP and public stockholding concern.
15/20-mark answer: add de minimis and the reference price formula, the peace clause (Bali 2013, India 2020), MC12–MC14 outcomes, the sugar dispute and a balanced view on impact.
Keywords: AoA, AMS, de minimis, green box, peace clause, external reference price, SSM, box-shifting, food sovereignty.
Quotable line: India's stand that food security of 800 million people is non-negotiable at the WTO (paraphrase of the government's position).
| Box | Nature | Examples | Limit |
|---|---|---|---|
| Amber | Trade-distorting | Market price support (MSP), input subsidies | AMS cuts; de minimis 5% developed, 10% developing |
| Blue | Production-limiting | EU payments tied to set-aside | No cap |
| Green | Minimal distortion | Research, extension, decoupled income support, stocks at market price | No cap |
| Development (Art. 6.2) | Developing-country exemption | Input subsidies to low-income farmers, investment subsidies | No cap |
Mains points
- Explain the three pillars and three boxes before discussing India; the structure earns marks.
- Show the MSP problem with the formula (administered price − 1986–88 reference price) × eligible production.
- Give the timeline: Bali 2013, General Council 2014, India's invocation in 2020, MC12 2022, MC13 2024, MC14 2026.
- Mention box-shifting by rich countries to balance the argument.
- Common mistake: saying the WTO bans MSP; it limits trade-distorting support, and India is protected by the peace clause and Article 6.2.
- Conclude with India's demands: permanent solution, SSM and reference price update.
Did you know?
- Memory trick for boxes: traffic lights — amber means slow down (reduce), green means go (allowed), blue sits in between.
- The external reference price used to judge India's MSP is from 1986–88, before most of today's farmers were born.
Agricultural Prices, MSP and Agricultural Subsidies
Agricultural price policy rests on the minimum support price (MSP) recommended by the CACP for 22 crops and backed by procurement mainly of rice and wheat. Since 2018–19 MSP is fixed at least at 1.5 times the A2+FL cost. Agricultural subsidies on fertiliser, power, irrigation, credit and crop insurance, plus PM-KISAN income support, form a large share of public spending on farming.
In simple words
The MSP is a price the government promises to pay farmers for certain crops so that a bumper harvest does not ruin them.
It works like a safety net under a trapeze artist: it does not lift you up, but it stops a deadly fall.
In practice the government buys mainly rice and wheat, so the safety net is strong for some crops and states and weak for others; subsidies cut farmers' costs.
UPSC asks about MSP's effects, legal guarantee demands and subsidy reform.
1. Institutions and Concepts
Agricultural Prices Commission (1965): set up on the L.K. Jha Committee's (1964) advice along with the Food Corporation of India (1965); renamed the Commission for Agricultural Costs and Prices (CACP) in 1985.
MSP: the price at which the government stands ready to buy; announced before sowing for 22 mandated crops (14 kharif, 6 rabi and 2 commercial: jute and copra) plus the Fair and Remunerative Price (FRP) for sugarcane.
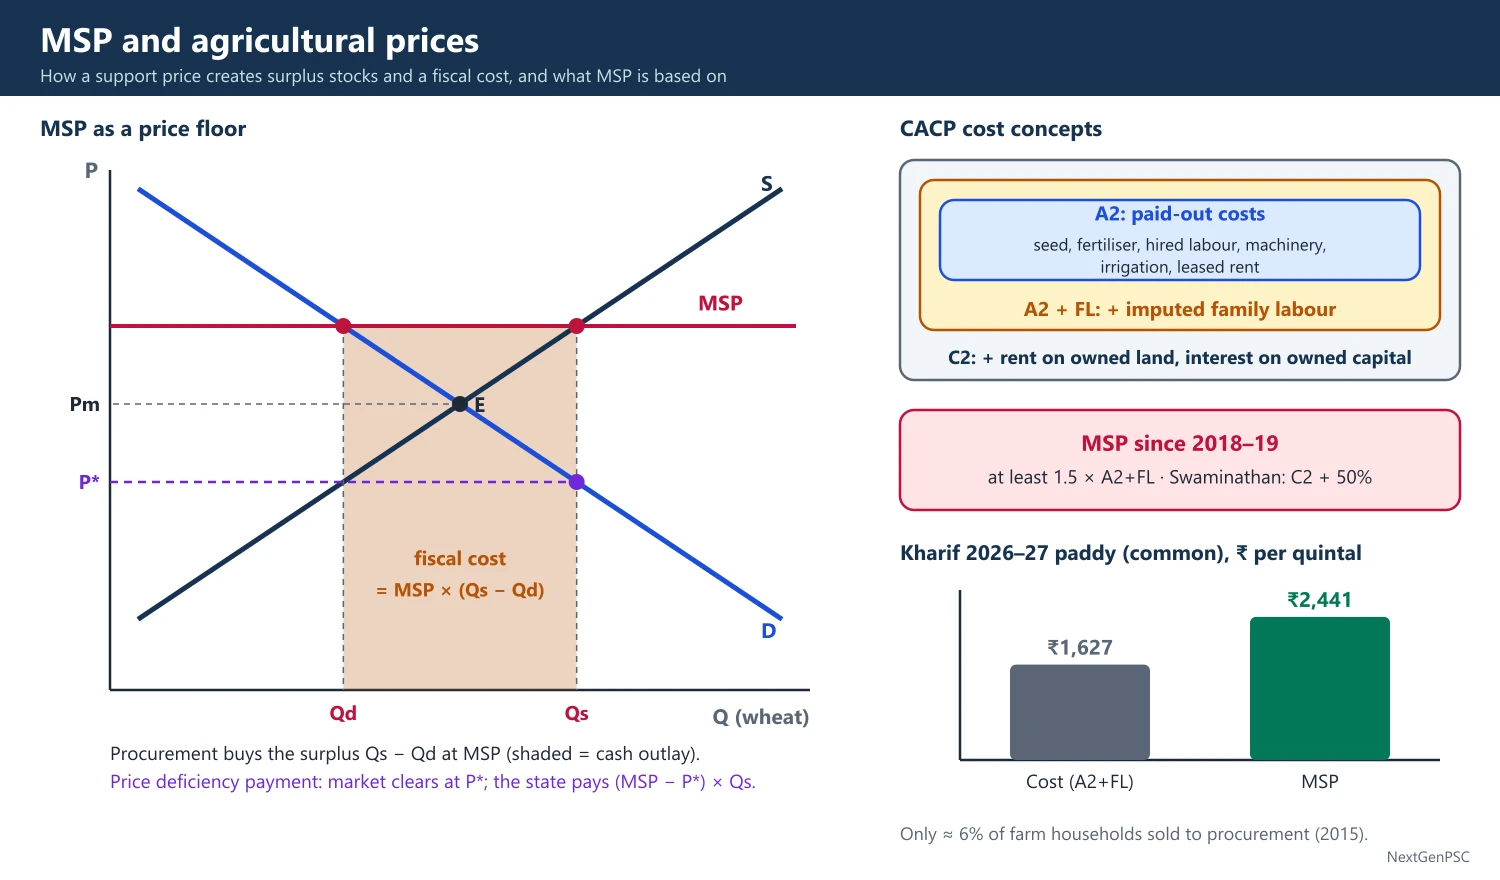
Cost concepts (CACP): A2 = paid-out costs (seed, fertiliser, hired labour, machinery, irrigation); A2+FL = A2 + imputed value of family labour; C2 = comprehensive cost including rent on owned land and interest on owned capital.
Swaminathan Commission (National Commission on Farmers, 2004–06): recommended MSP at least 50% above the weighted average cost of production, widely read as C2 + 50%.
Budget 2018–19: the government fixed MSP at least 1.5 times A2+FL from kharif 2018; farm groups argue C2 should be the base.
Factors CACP considers: cost of production, demand-supply, domestic and international prices, inter-crop price parity, terms of trade between agriculture and non-agriculture, and the likely effect on consumers.
2. Current MSPs
Kharif 2026–27: paddy (common) ₹2,441 per quintal, up ₹72 from ₹2,369; Grade A ₹2,461 (CCEA, 13 May 2026); the cost of production of paddy was estimated at ₹1,627, so MSP is about 50% above A2+FL.
Rabi marketing season 2026–27: wheat ₹2,585 per quintal, up ₹160 from ₹2,425 (CCEA, 1 October 2025).
Procurement reach: effective procurement is concentrated in rice and wheat and in Punjab, Haryana, Madhya Pradesh, Chhattisgarh, Telangana and a few others; the Shanta Kumar Committee (2015), using NSS Situation Assessment Survey data, noted that only about 6% of farm households sold to procurement agencies.
PM-AASHA (2018): umbrella scheme with the Price Support Scheme (physical procurement of pulses, oilseeds and copra), Price Deficiency Payment Scheme (pay the gap between MSP and market price, modelled on Madhya Pradesh's Bhavantar Bhugtan Yojana, 2017) and a private procurement pilot.
3. Effects of MSP: Theory
Price floor model: MSP above the market-clearing price raises farm income and output but creates surplus stocks that the government must buy and store; the cost is borne by taxpayers.
Cropping distortion: assured procurement of rice and wheat encouraged their monoculture in Punjab and Haryana, depleting groundwater and worsening stubble burning, while pulses and oilseeds lagged.
Inflation link: rising MSP raises cereal prices and can feed food inflation (a debated effect; studies find MSP a significant but not dominant driver).
Stocks: central pool stocks often far exceed buffer norms, raising carrying costs of the FCI.
Legal guarantee demand: after the 2020–21 farm protests, farm unions demanded a legal right to MSP for all crops; critics (e.g. Ashok Gulati) argue this would be fiscally costly and distort markets, while supporters say it would protect incomes; it is debated.
4. Market Reforms
APMC system: state Agricultural Produce Market Committee Acts required sales in regulated mandis; the Model APMC Act (2003) and Model APLM Act (2017) sought private markets, direct buying and a single licence.
e-NAM (April 2016): an electronic trading portal linking regulated mandis, now covering over 1,000 mandis.
Farm laws (2020): three laws on trade outside APMCs, contract farming and the Essential Commodities Act were passed in September 2020 and repealed by the Farm Laws Repeal Act, 2021 after year-long protests.
FPOs: the scheme to form 10,000 Farmer Producer Organisations (2020) aims to give small farmers bargaining power.
5. Agricultural Subsidies
Fertiliser: the largest input subsidy; urea prices are controlled while P and K fertilisers have the Nutrient Based Subsidy (NBS) since 2010, which created a price gap and overuse of urea, skewing the N:P:K ratio away from the recommended 4:2:1; neem-coated urea (2015) and nano urea aim to cut misuse.
Power and irrigation: free or cheap farm power in many states encourages groundwater overuse; these subsidies are paid by states and electricity distribution companies.
Credit: the Modified Interest Subvention Scheme gives short-term crop loans up to ₹3 lakh at 7%, falling to 4% with prompt repayment; the Kisan Credit Card (1998) is the delivery channel.
Crop insurance: the Pradhan Mantri Fasal Bima Yojana (2016) caps farmers' premium at 2% for kharif, 1.5% for rabi and 5% for commercial and horticultural crops.
PM-KISAN (February 2019): ₹6,000 a year in three instalments to landholding farmer families by direct benefit transfer; tenants and landless labourers are excluded, a key criticism.
State schemes: Telangana's Rythu Bandhu (2018) and Odisha's KALIA (2018–19) pioneered per-acre or per-family income support.
6. Diagrams to Draw
MSP as a price floor: draw D and S for wheat; mark the market price Pm at their intersection and MSP above it as a horizontal line; show the surplus (Qs − Qd) that the government must procure, and shade the fiscal cost (MSP × surplus).
Price deficiency payment: on the same diagram, let the market clear at P* below MSP; the government pays (MSP − P*) × Q to farmers; compare its cost with procurement.
Fertiliser subsidy: draw demand for urea with a subsidised price below cost; show the higher quantity used and the deadweight loss from overuse.
7. Theory and Debates
Subsidies vs investment: Gulati and Narayanan (The Subsidy Syndrome in Indian Agriculture, 2003) and Fan, Gulati and Thorat (2008) found that input subsidies crowded out public investment and gave lower returns than roads, research and irrigation.
Cash transfers: the Shanta Kumar Committee and many economists favour replacing input subsidies with direct cash per hectare; critics fear loss of input use by poor farmers and price shocks.
Terms of trade: MSP aims to keep farm terms of trade favourable; some years of falling real farm prices (2014–18) fed rural distress.
Punjab example: the rice-wheat cycle supported by MSP and free power has led to groundwater falling in most of the state's blocks, which are classified as over-exploited by the Central Ground Water Board.
Pulses example: higher MSPs and procurement of pulses after 2016 raised output sharply (record production around 2017–18), showing that price support can change cropping when backed by procurement.
World example: the US and EU moved from price support to decoupled direct payments (EU's 2003 CAP reform; US 1996 farm bill), an approach that resembles India's PM-KISAN.
Inflation link in practice: food weight in the CPI is about 46% (2012 base), so MSP and cereal price changes matter for the RBI's inflation target.
8. Using It in the Exam
10-mark answer: define MSP and cost concepts, give the latest MSP with year, and list two effects.
15/20-mark answer: draw the price-floor diagram, discuss procurement concentration, cropping distortion, fiscal cost, legal MSP debate, subsidy reform and the investment alternative.
Keywords: CACP, A2+FL, C2, PM-AASHA, PDPS, NBS, PM-KISAN, crowding out of public investment.
Quotable line: the Swaminathan Commission's recommendation that MSP be at least 50% above the weighted average cost of production (paraphrased).
| Concept | What it includes | Use |
|---|---|---|
| A2 | All paid-out costs: seed, fertiliser, pesticide, hired labour, machinery, irrigation, leased-in land rent | Cash cost |
| A2+FL | A2 plus imputed value of family labour | Basis of MSP at 1.5 times since 2018–19 |
| C2 | A2+FL plus rent on owned land and interest on owned fixed capital | Swaminathan C2 + 50% demand |
Mains points
- Define MSP, CACP and the three cost concepts with the 1.5 × A2+FL rule.
- Quote the latest MSP with season and date (paddy ₹2,441 for kharif 2026–27; wheat ₹2,585 for RMS 2026–27).
- Discuss both benefits (income floor, food stocks) and costs (cropping distortion, groundwater, fiscal burden).
- Add the legal-MSP debate with both sides and a middle path (PDPS, procurement of pulses and oilseeds).
- Link subsidies to the subsidy-vs-investment evidence (Fan, Gulati and Thorat, 2008).
- Common mistake: treating PM-KISAN as covering all farmers; it excludes tenants and landless workers.
Did you know?
- Memory trick: 'A2 is cash, FL is family, C2 is complete' — the three cost levels climb from paid-out to full cost.
Public Distribution System and Food Security
India's Public Distribution System grew from wartime rationing into the Targeted PDS (1997) and then the rights-based National Food Security Act, 2013, which covers up to 75% of rural and 50% of urban people. Since January 2024 foodgrains are free for about 81.35 crore beneficiaries under PMGKAY for five years. Digitisation and One Nation One Ration Card have cut leakages and enabled portability.
In simple words
The PDS is a network of ration shops where poor families get rice and wheat cheaply, now free.
It is like a common kitchen run by the state: grain is bought from farmers at MSP, stored by the FCI and handed out through fair price shops.
It protects the poor from hunger and price shocks, but has faced leakages and exclusion, which Aadhaar-linked digital systems have tried to fix.
UPSC asks about PDS reform, NFSA, cash vs grain and food security.
1. Concepts of Food Security
Definition: the 1996 World Food Summit (FAO) defined food security as existing when all people, at all times, have physical and economic access to sufficient, safe and nutritious food for an active and healthy life.
Four pillars: availability (production, stocks, imports), access (income, prices, PDS), utilisation (nutrition, health, sanitation) and stability over time.
Entitlement approach: Amartya Sen (Poverty and Famines, 1981) showed that famines, such as the Bengal famine of 1943, arise from collapse of entitlements (purchasing power) rather than lack of food.
Hidden hunger: micronutrient deficiency (iron, vitamin A, iodine); NFHS-5 (2019–21) found 35.5% of children under five stunted and 57% of women aged 15–49 anaemic.
2. Evolution of the PDS
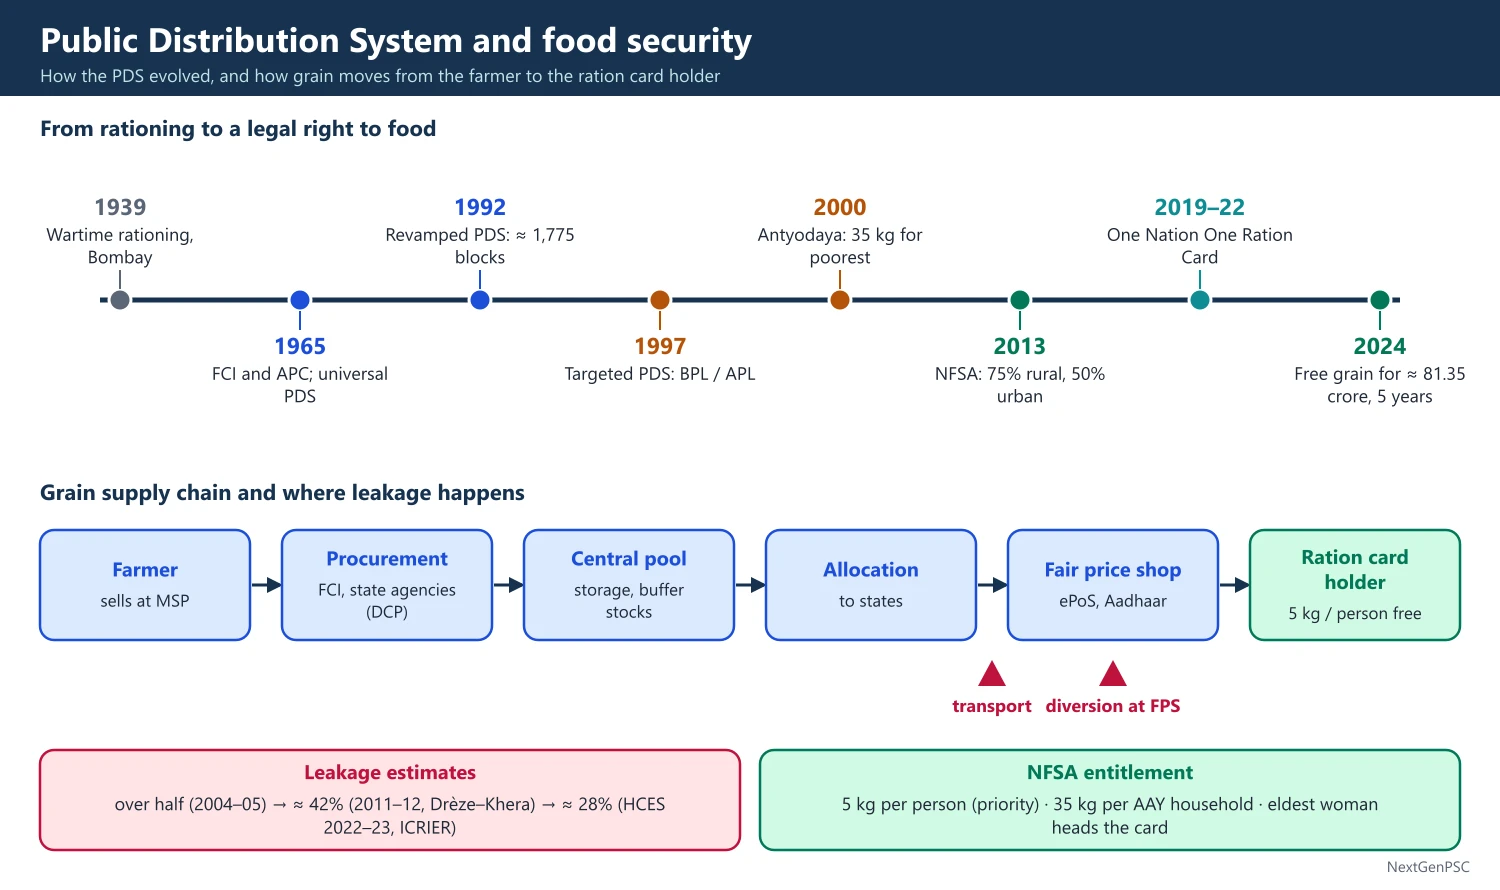
Origins: rationing began during the Second World War (Bombay, 1939); after Independence the PDS expanded in the 1960s with the FCI (1965) and APC (1965) after the food crises of 1965–67.
Universal PDS: until 1992 the PDS was general, with an urban bias and weak reach in poor states.
Revamped PDS (1992): focused on about 1,775 blocks in drought-prone, tribal and hilly areas.
Targeted PDS (June 1997): divided households into BPL and APL with different prices, based on Planning Commission poverty estimates; it led to large exclusion errors and diversion of APL grain.
Antyodaya Anna Yojana (December 2000): 35 kg per month at ₹2 per kg wheat and ₹3 per kg rice for the poorest one crore households (later expanded).
Right to Food case: PUCL vs Union of India (2001 onward) led the Supreme Court to turn schemes like midday meals and ICDS into legal entitlements.
3. National Food Security Act, 2013
Coverage: up to 75% of the rural and 50% of the urban population, about 81.35 crore people, split into Priority Households and AAY households.
Entitlement: 5 kg per person per month for priority households and 35 kg per AAY household at ₹3/₹2/₹1 per kg for rice/wheat/coarse grains (central issue prices).
Other provisions: maternity benefit of at least ₹6,000, nutrition for children through anganwadis and midday meals, the eldest woman as head of household for ration cards, and grievance redress.
Allocation: state-wise coverage was fixed by the then Planning Commission using NSS 2011–12 consumption data.
4. PMGKAY, ONORC and Digitisation
PMGKAY: launched in April 2020 during COVID-19 to give an extra 5 kg free per person; from 1 January 2023 NFSA grain became free and PMGKAY was merged with it; in November 2023 the Cabinet extended free grain for five years from 1 January 2024 for about 81.35 crore beneficiaries at an estimated ₹11.80 lakh crore.
One Nation One Ration Card: launched as a pilot in 2019, it became nationwide in 2022 (Assam was the last state to join, June 2022), letting migrants draw rations at any ePoS fair price shop.
End-to-end computerisation: digitised ration cards, Aadhaar seeding, ePoS machines with biometric authentication and online supply chain management.
Fortified rice: distribution of iron-fortified rice through PDS, ICDS and PM POSHAN was scaled up by March 2024 and extended to December 2028.
Food subsidy cost: the Centre's food subsidy is about ₹2 lakh crore a year (Budget 2025–26 estimate about ₹2.03 lakh crore), mostly FCI economic cost minus the (now zero) issue price.
5. Leakages, Exclusion and Reforms
Leakage estimates: using NSS data, Himanshu and Sen and others estimated leakage at over half of grain around 2004–05; Drèze and Khera estimated it fell to about 42% in 2011–12, with sharp falls in states like Chhattisgarh, Odisha and Tamil Nadu.
Recent estimate: an ICRIER study by Gulati and colleagues using HCES 2022–23 estimated leakage near 28% (2025), still large in some states; such estimates depend on matching survey and offtake data and are debated.
Shanta Kumar Committee (2015): recommended cutting NFSA coverage to about 40% of the population, cash transfers in surplus states and FCI restructuring (decentralised procurement, involvement of private players).
Chhattisgarh model (2004 onward): de-privatised fair price shops to panchayats and cooperatives, computerised supply and used SMS alerts, cutting leakage.
Aadhaar exclusion: biometric failures in Jharkhand and elsewhere caused exclusion and alleged starvation deaths (2017–18), prompting offline fallbacks.
Cash vs kind: DBT for food was piloted in Chandigarh, Puducherry and Dadra and Nagar Haveli (2015); evidence showed problems with bank access and price exposure, so in-kind PDS remains the main tool.
6. Diagrams to Draw
Supply chain diagram: draw a flowchart: farmer, MSP procurement (FCI/state agencies, DCP states), central pool storage, allocation to states, fair price shop, ration card holder; mark leakage points (transport, FPS diversion).
Subsidy and consumer welfare: draw the budget line of a poor household with food on the x-axis; free PDS grain shifts the line out by the ration quantity (a kinked line); show higher utility and the inframarginal effect.
Dual pricing: draw open-market price and issue price lines over time to show the subsidy gap and its rise with MSP.
7. Theory and Debates
Targeting vs universality: Drèze, Khera and Sen favour near-universal coverage to avoid exclusion; others favour tight targeting to cut fiscal cost.
Nutrition transition: cereal-centred PDS may not address protein and micronutrient needs; proposals include adding pulses, millets and edible oil (several states do).
Fiscal cost vs welfare gain: free grain reduces household spending on cereals, freeing money for diverse diets (HCES 2023–24 shows imputed transfers raising MPCE).
Tamil Nadu example: runs a near-universal PDS with free rice since 2011, showing that universal coverage reduces exclusion errors.
Kerala and Andhra Pradesh: add pulses, oil or other items through state schemes, showing how states top up central entitlements.
World examples: Brazil's Fome Zero (2003) and Bolsa Família combined cash transfers and food programmes, and the US SNAP uses electronic food vouchers.
Buffer norms: the FCI must hold minimum stocks of rice and wheat for each quarter (operational and strategic reserve norms); actual stocks have often been two to three times the norm, raising carrying costs.
8. Using It in the Exam
10-mark answer: trace PDS to TPDS to NFSA, give coverage and entitlements, and mention ONORC and PMGKAY.
15/20-mark answer: add leakage evidence, Shanta Kumar recommendations, state models, cash vs kind, nutrition and fiscal cost, with a supply chain diagram.
Keywords: TPDS, AAY, NFSA, PMGKAY, ONORC, ePoS, leakage, exclusion error, entitlement approach.
Quotable line: Sen's insight that famines result from failure of entitlements rather than lack of food (Poverty and Famines, 1981, paraphrased).
| Phase | Year | Key feature |
|---|---|---|
| Wartime rationing | 1939 | Urban rationing in Bombay |
| Universal PDS | 1960s–1992 | FCI and APC (1965); urban bias |
| Revamped PDS | 1992 | About 1,775 backward blocks |
| Targeted PDS | 1997 | BPL/APL split; poverty-line targeting |
| Antyodaya Anna Yojana | 2000 | 35 kg for the poorest households |
| NFSA | 2013 | Legal right; 75% rural, 50% urban coverage |
| PMGKAY / free grain | 2020; extended from 1 Jan 2024 for five years | Free grain for about 81.35 crore people |
Mains points
- Trace the shift from welfare scheme to legal right (PUCL case, NFSA 2013).
- Give current facts: free grain for 81.35 crore people from 1 January 2024 for five years, ₹11.80 lakh crore outlay.
- Discuss leakages with estimates and their sources, and state reforms (Chhattisgarh, Tamil Nadu).
- Balance cash vs kind with evidence from the 2015 DBT pilots.
- Add nutrition: stunting and anaemia data from NFHS-5, fortified rice, millets.
- Common mistake: confusing food availability with food security; use Sen's entitlement approach.
Did you know?
- Memory trick for NFSA prices: '3-2-1' — ₹3 rice, ₹2 wheat, ₹1 coarse grains (now all free).
- The PDS network has over 5 lakh fair price shops, one of the largest food distribution systems in the world.
Food Processing, Public Investment and Agricultural Growth
Food processing links farms to markets and can cut post-harvest losses, raise farm prices and create jobs; schemes such as PM Kisan SAMPADA Yojana, PMFME and the PLI for food processing support it. Public investment in irrigation, roads, research and power drives agricultural growth and crowds in private investment; evidence shows it gives higher returns than input subsidies.
In simple words
Food processing turns raw crops into products like flour, juice, pickles and packaged snacks.
It is like turning tomatoes that would rot in a week into ketchup that lasts a year, which saves waste and earns more.
When the government builds canals, roads, cold stores and funds research, farmers produce more and private firms invest too; this works better than only giving cheap inputs.
UPSC asks about food processing potential and the role of public investment in farm growth.
1. Food Processing: Concepts and Importance
Definition: food processing covers primary processing (cleaning, grading, milling) and secondary and tertiary processing (canning, packaging, ready-to-eat foods); it is a link between agriculture and manufacturing.
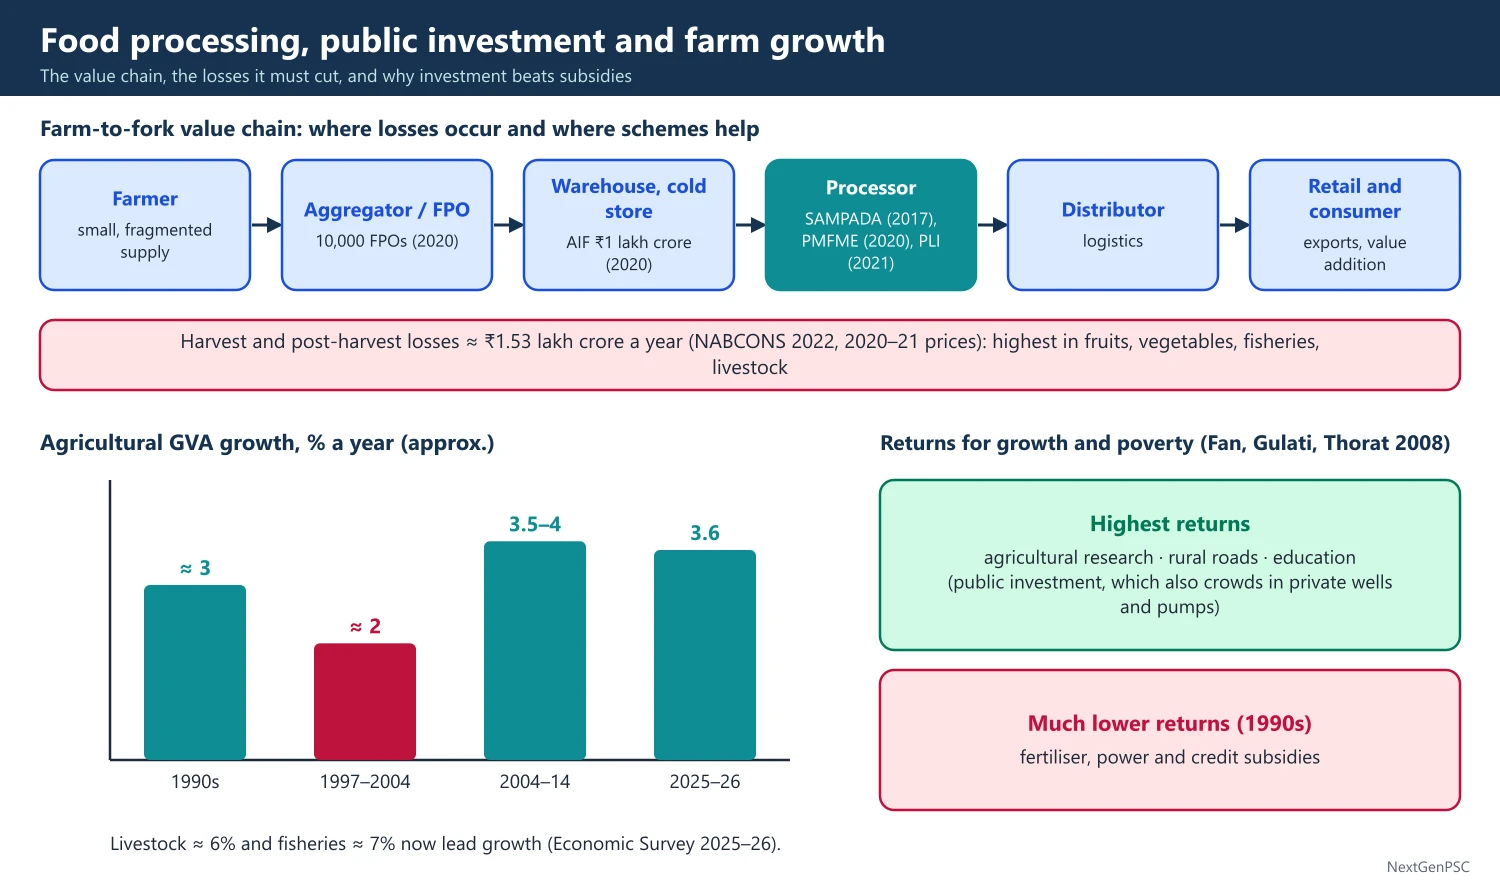
Value chain: the 'farm to fork' chain involves aggregation, storage, cold chain, processing, logistics and retail; gaps at any stage cause losses and low farm prices.
Why it matters: it reduces price volatility (e.g. tomato and onion gluts), raises farm incomes through value addition, generates labour-intensive jobs, and boosts exports.
Ministry of Food Processing Industries (MoFPI): set up in 1988; the sector is a priority sector for bank lending and allows 100% FDI under the automatic route.
Level of processing: India processes only a small share of its fruits and vegetables compared with countries like the US, Brazil or Thailand, so the potential for growth is large.
2. Post-harvest Losses and Schemes
Loss estimates: a NABCONS study (2022) for MoFPI estimated harvest and post-harvest losses at about ₹1.53 lakh crore a year (at 2020–21 prices), highest in fruits, vegetables, fisheries and livestock products.
Pradhan Mantri Kisan SAMPADA Yojana (PMKSY, 2017): umbrella scheme for mega food parks, integrated cold chain, agro-processing clusters, backward and forward linkages and food testing labs.
PMFME (June 2020): PM Formalisation of Micro Food Processing Enterprises, an outlay of ₹10,000 crore with a 'One District One Product' approach for micro units.
PLI for Food Processing (2021): production-linked incentive scheme with an outlay of ₹10,900 crore for 2021–22 to 2026–27, covering ready-to-eat foods, processed fruits and vegetables, marine products, mozzarella cheese and millet-based products.
Operation Greens (2018): began for tomato, onion and potato (TOP) to stabilise prices and was later extended to more perishables.
Agriculture Infrastructure Fund (2020): a ₹1 lakh crore financing facility for post-harvest infrastructure with interest subvention.
Constraints: fragmented supply, small farms, weak cold chain, high packaging and power costs, food safety compliance, and frequent export bans that hurt processors.
3. Public Investment and Agricultural Growth
Types of capital formation: public investment (irrigation projects, rural roads, research, electrification, markets) and private investment (wells, pumps, tractors, land improvement).
Trend: public gross capital formation in agriculture fell in real terms in the 1980s and 1990s as states diverted funds to subsidies and salaries, while private investment grew; public investment revived in the mid-2000s.
Crowding in: canals and power supply make private wells and pumps profitable, so public investment tends to 'crowd in' private investment (Shetty, Mishra and Chand; Gulati and Bathla) — though some studies find weak links in certain periods, so it is debated.
Fan, Gulati and Thorat (2008): using state data from 1960 to 2000, found that agricultural research, rural roads and education gave the highest returns for growth and poverty reduction, while fertiliser, power and credit subsidies gave much lower returns in the 1990s.
R and D spending: India spends well under 1% of agricultural GDP on agricultural research; the ICAR system and the Green Revolution showed the high payoff of research.
Irrigation: the Pradhan Mantri Krishi Sinchayee Yojana (2015) with 'Har Khet Ko Pani' and 'Per Drop More Crop' (micro-irrigation) aims to expand assured irrigation.
4. Agricultural Growth after Liberalisation
Growth phases: agricultural GVA grew about 3% a year in the 1990s, slowed to around 2% in 1997–2004 (the 'agrarian crisis' years with farmer suicides), and recovered to about 3.5–4% in 2004–14.
Recent trend: the Economic Survey 2025–26 estimated farm growth at 3.6% in 2025–26 (advance estimate) and noted that livestock (about 6% growth) and fisheries (about 7%) are leading the sector.
Diversification: horticulture output now exceeds foodgrains in tonnage; dairy (India is the largest milk producer) and fisheries drive growth, showing a shift towards high-value agriculture.
New initiatives: the PM Dhan-Dhaanya Krishi Yojana (announced in Budget 2025–26) targets 100 low-productivity districts by converging schemes; the National Mission on Natural Farming (2024) promotes chemical-free farming.
Doubling farmers' income: the Ashok Dalwai Committee (2016–18) set out strategies to double real farm incomes by 2022–23; the target was not met according to most assessments.
5. Diagrams to Draw
Value chain diagram: draw a chain from farmer to aggregator, warehouse or cold store, processor, distributor, retailer and consumer; mark where losses occur and where schemes (PMKSY, AIF, PMFME) intervene.
Public investment vs subsidy: draw a bar chart comparing returns per rupee for research, roads, education, irrigation, fertiliser subsidy and power subsidy (based on Fan, Gulati and Thorat); research and roads have the tallest bars.
Supply shift: draw agricultural supply curve S1 and show public investment shifting it to S2 (lower cost), increasing output and lowering prices for consumers.
6. Theory and Debates
Mellor's rural growth linkages: John Mellor (The New Economics of Growth, 1976) argued that farm growth creates demand for rural non-farm goods and services, multiplying its effect on employment.
Investment vs subsidies: subsidies are politically popular and immediate, while investment pays over the long term; this creates a fiscal bias towards subsidies (political economy view).
Private sector role: contract farming and corporate processing can bring technology and markets but may squeeze small farmers; experience in Punjab (PepsiCo, 1989 onward) is mixed.
Amul example: the cooperative dairy model (Anand, Gujarat, 1946; Operation Flood from 1970 under Verghese Kurien) linked millions of small producers to processing and markets, a model for value chains.
Shrimp and marine exports: processing and cold chains made frozen shrimp India's largest marine export, mainly from Andhra Pradesh.
Thailand and Brazil: strong agro-processing and export orientation turned these countries into major processed-food exporters, which India seeks to emulate.
Green Revolution lesson: public investment in research (HYV seeds, ICAR, agricultural universities), irrigation and credit in the 1960s–70s raised wheat output dramatically, the clearest case of high returns to public investment.
Eastern India: the 'Bringing Green Revolution to Eastern India' programme (2010–11) targeted rice productivity in Assam, Bihar, Chhattisgarh, Jharkhand, Odisha, eastern UP and West Bengal.
Climate risk: heatwaves (e.g. March 2022 hurting wheat) and erratic monsoons raise the need for investment in climate-resilient seeds, irrigation and insurance.
Credit flow: agricultural credit targets rose to over ₹27 lakh crore in recent budgets, but much goes to larger farmers and agribusiness; small and tenant farmers still depend on informal lenders (NSS 77th round, 2019).
7. Using It in the Exam
10-mark answer: define food processing, give its importance and two schemes with outlay and year.
15/20-mark answer: link food processing to losses and value chains, discuss public vs private investment with Fan-Gulati-Thorat, give growth phases and the diversification trend.
Keywords: value chain, post-harvest loss, PMKSY, PMFME, PLI, crowding in, returns to public investment, diversification.
Quotable line: Fan, Gulati and Thorat's finding that public investment in research, roads and education gives higher returns than input subsidies (paraphrased).
| Scheme | Year | Purpose | Outlay |
|---|---|---|---|
| PM Kisan SAMPADA Yojana | 2017 | Food parks, cold chain, clusters | Umbrella scheme |
| PMFME | 2020 | Formalise micro food units (ODOP) | ₹10,000 crore |
| PLI for Food Processing | 2021 | Incentives for large processors | ₹10,900 crore (2021–22 to 2026–27) |
| Agriculture Infrastructure Fund | 2020 | Credit for post-harvest infrastructure | ₹1 lakh crore financing |
| PM Krishi Sinchayee Yojana | 2015 | Irrigation and micro-irrigation | Multi-year |
Mains points
- Present food processing as the bridge between agriculture and industry, with loss data (NABCONS 2022).
- Name schemes with year and outlay: PMKSY, PMFME, PLI, AIF.
- Use Fan, Gulati and Thorat (2008) to argue for investment over subsidies.
- Explain crowding in of private investment by public investment, and note it is debated.
- Give growth phases after 1991 and the shift to livestock, fisheries and horticulture.
- Common mistake: listing schemes without analysis; always link to income, prices and jobs.
Did you know?
- India is the world's largest producer of milk and the second largest producer of fruits and vegetables, yet loses a large part of perishables after harvest.
UPSC Previous Year Questions: Agriculture after Liberalisation
UPSC asked 38 question parts worth 510 marks on agriculture after liberalisation in Paper II from 2014 to 2026. The most-asked areas are food processing, public investment and agricultural growth (13 parts) and MSP and agricultural subsidies (11 parts), followed by the WTO and the PDS (7 parts each). Every question below has a model answer written to the UPSC word limit.
In simple words
Read the question and write your own answer in the time UPSC allows: about 7 minutes for 10 marks and 11 minutes for 15 or 20 marks.
Then compare it with the model answer: did you define the scheme or agreement, give Indian data with its year, name the committee and end with a balanced way forward?
Note the facts you missed (MSP, AoA boxes, NFSA, PMFME, Fan-Gulati-Thorat) and revise them in the notes of this chapter before trying the next question.
1. Agriculture and the WTO
Example 1 (UPSC 2026, 15 marks): Examine the implications of the WTO agreements on Indian agriculture with special reference to food security, subsidies and market access.
Paper and question: Paper II, Q6(b)
Approach: Explain the three pillars of the Agreement on Agriculture briefly, then assess their effect on India under three heads asked: food security, subsidies and market access, and close with India's negotiating agenda.
The WTO's Agreement on Agriculture (AoA, 1995) disciplines farm trade through three pillars: market access (tariffication and bound tariffs), domestic support (Amber, Blue and Green boxes) and export competition. Its effects on India are mixed.
Food security: India procures rice and wheat at MSP to feed about 81.35 crore people under the NFSA, 2013. Market price support is counted in the Amber Box against a de minimis limit of 10% of the value of production, using the 1986–88 external reference price. This outdated price inflates India's measured support, so India invoked the Bali (2013) peace clause for rice in 2020. No permanent solution emerged at MC13 (2024) or MC14 (Yaoundé, March 2026).
Subsidies: India's input subsidies to low-income, resource-poor farmers are exempt under Article 6.2, and its product-specific support for most crops is within limits. Developed countries, however, shifted support into the Green Box (box-shifting) and kept large payments, so the field remains uneven.
Market access: India bound its farm tariffs at high levels, keeping policy space against import surges. Farm exports reached about USD 50 billion in 2024–25, though sanitary and phytosanitary standards limit access.
India's agenda is therefore a permanent solution on public stockholding, a Special Safeguard Mechanism and cuts in trade-distorting support of developed countries. On balance, the AoA has constrained India less than feared, but the food security question remains unresolved.
Example 2 (UPSC 2025, 15 marks): Examine the implications for India due to agreements on agriculture that are signed under the World Trade Organisation (WTO) in 1995.
Paper and question: Paper II, Q6(b)
Approach: Recall what India signed in 1995 under each AoA pillar, then examine the positive and negative implications for Indian farmers, exports and food policy, ending with a balanced assessment.
The Agreement on Agriculture, part of the Uruguay Round results that created the WTO on 1 January 1995, brought farm trade under multilateral rules. As a developing country India received special and differential treatment: smaller cuts over ten years and exemptions for input subsidies to poor farmers.
Commitments: under market access, quantitative restrictions were converted into tariffs; India, having BoP cover, kept QRs until a WTO panel ruling (1999) led to their removal by April 2001, and its bound tariffs stayed high. Under domestic support, trade-distorting support (AMS) is capped at 10% of production value for developing countries. Under export competition, India had no export subsidies to cut, and the Nairobi decision (2015) later banned them.
Positive implications: farm exports grew as world prices became less distorted, India became the largest rice exporter, and high bound tariffs protected sensitive crops.
Negative implications: cheap imports after QR removal hurt edible oil and some plantation growers; the external reference price of 1986–88 makes MSP look like large support and exposed India to challenges, such as the sugar dispute in which a panel ruled against India in 2021 (India appealed). Developed countries kept high Green Box spending.
Thus the AoA opened export opportunities but left a food security risk, which India manages through the peace clause while seeking a permanent solution.
Example 3 (UPSC 2023, 20 marks): Discuss the characteristic features of Agreement on Agriculture (AOA) under Uruguay Round of GATT and examine its impact on Indian agriculture.
Paper and question: Paper II, Q6(a)
Approach: Describe each pillar of the AoA with its numerical commitments and the boxes, then examine its impact on Indian agriculture under trade, support policy and food security, giving recent facts.
The Agreement on Agriculture was negotiated in the Uruguay Round of GATT (1986–94) and came into force with the WTO in 1995. It aimed to make farm trade fair and market-oriented through three pillars.
Market access: all non-tariff barriers were converted into tariffs (tariffication) and bound; developed countries cut tariffs by 36% on average over six years, developing countries by 24% over ten years. A special safeguard was allowed.
Domestic support: trade-distorting support is the Amber Box, measured as the Aggregate Measurement of Support (AMS); developed countries cut it by 20%, developing countries by 13.3%, and support below the de minimis level (5% of production value for developed, 10% for developing countries) is exempt. The Blue Box (production-limiting payments) and Green Box (research, extension, decoupled income support) are exempt. Article 6.2 exempts input and investment subsidies in developing countries.
Export competition: export subsidies were cut by 36% in value and 21% in volume by developed countries; the Nairobi Ministerial (2015) agreed to eliminate them.
Impact on India: farm exports grew from about USD 6 billion in 1995–96 to about USD 50 billion in 2024–25. High bound tariffs preserved policy space and Article 6.2 protected input subsidies. But QR removal in 2001 exposed growers of edible oils to cheap imports.
The biggest problem is food security: market price support is measured against the fixed 1986–88 reference price, so rising MSPs appear to breach the 10% limit. India invoked the Bali peace clause for rice in 2020, and the sugar case (2021) went against India.
Overall, the AoA helped Indian exports, but its rules favour countries that subsidise through the Green Box. India seeks a permanent solution on public stockholding and an updated reference price.
Example 4 (UPSC 2022, 10 marks): Discuss the prospects and challenges faced by Indian Agriculture due to World Trade Organisation (WTO) provisions.
Paper and question: Paper II, Q5(b)
Approach: In about 150 words list the prospects (exports, policy space) and the challenges (subsidy limits, standards, unequal rules) that WTO provisions create for Indian agriculture.
WTO provisions on agriculture, mainly the Agreement on Agriculture and the SPS Agreement (1995), shape India's farm trade and support policies.
Prospects: lower distortions in world markets open export chances for rice, spices, marine products, fruits and processed food, in which India has a cost advantage; farm exports reached about USD 50 billion in 2024–25. High bound tariffs and Article 6.2 exemptions keep space to protect small farmers, and the Green Box allows unlimited spending on research, irrigation and income support such as PM-KISAN.
Challenges: MSP-based procurement is measured against the 1986–88 reference price, so support for rice appears to breach the 10% de minimis limit, forcing India to rely on the peace clause; strict SPS standards in the EU and US reject Indian consignments; developed countries' large Green Box payments depress world prices; and disputes such as the sugar case (2021) target Indian support.
India must use WTO-compatible tools: shift support to the Green Box, improve quality systems and push for a permanent solution on public stockholding.
Example 5 (UPSC 2021, 10 marks): Analyse the effectiveness of the major commitments of Agreement on Agriculture (AoA) of the Uruguay Round of WTO on Indian agriculture.
Paper and question: Paper II, Q5(b)
Approach: Take each major AoA commitment (market access, domestic support, export subsidies) and judge how effective it has been for India, then conclude.
The Agreement on Agriculture of the Uruguay Round (in force 1995) made three main commitments, and their effectiveness for India has been uneven.
Market access: tariffication was meant to open rich-country markets, but developed countries set very high bound tariffs (dirty tariffication) and used tariff-rate quotas, so gains for Indian exporters were limited. India itself bound tariffs high, which protected sensitive crops after QRs went in 2001.
Domestic support: AMS cuts were effective on paper, but rich countries moved support into the Green and Blue Boxes, so total support stayed large. For India, Article 6.2 protected input subsidies, while the de minimis rule with the 1986–88 reference price created a legal risk for MSP, managed through the peace clause (Bali 2013).
Export subsidies: cuts and the 2015 Nairobi decision to eliminate them were the most effective commitment, reducing dumping that had hurt Indian producers.
Overall the AoA was only partly effective: it curbed export subsidies but did not level the playing field on domestic support, which India continues to contest.
Example 6 (UPSC 2019, 15 marks): Critically examine the role of WTO on agricultural exports in India.
Paper and question: Paper II, Q6(c)
Approach: Show how WTO rules helped India's agricultural exports grow and diversify, then critically point out the limits (standards, subsidies abroad, India's own export bans), with data.
By bringing agriculture under multilateral rules in 1995, the WTO was expected to raise developing countries' farm exports through lower tariffs and fewer export subsidies in rich countries.
Positive role: India's agricultural exports rose from about USD 6 billion in 1995–96 to about USD 39 billion in 2018–19 and about USD 50 billion in 2024–25. India became the world's largest rice exporter (since 2011–12) and a leading exporter of buffalo meat, spices and shrimp. Binding rules and the dispute settlement system gave exporters predictability, and the Nairobi decision (2015) to end export subsidies helped India compete in third markets.
Limitations: tariff peaks and escalation in developed countries discourage processed exports; strict sanitary and phytosanitary (SPS) measures, such as EU limits on pesticide residues in rice and spices, block consignments; and heavy Green Box support in the US and EU keeps world prices low. India's share of world farm exports is still only about 2%.
Some barriers are domestic: frequent export bans (wheat in 2022, non-basmati white rice in 2023), weak cold chains and quality certification, and the WTO limit on exporting from subsidised public stocks.
Thus the WTO opened a door, but India's export performance depends more on domestic reforms: stable trade policy, quality infrastructure and an Agriculture Export Policy (2018) that is actually implemented.
Example 7 (UPSC 2014, 20 marks): Subsidy is a contentious issue and roadblock in the WTO. Examine India's stand for protecting its farmers' interests.
Paper and question: Paper II, Q8(a)
Approach: Explain why subsidies are the sticking point (AMS, de minimis, reference price), then set out India's stand at Bali and after, with the coalitions it leads, and assess it.
Farm subsidies are the most divisive issue in the WTO's Doha Round (2001): developed countries want developing countries to cut support while keeping huge Green and Blue Box subsidies of their own.
Why subsidies are contentious: under the Agreement on Agriculture, trade-distorting (Amber Box) support of a developing country must stay within de minimis, 10% of the value of production. Market price support is calculated as (administered price − fixed external reference price of 1986–88) × eligible production. Because the reference price is nearly three decades old and ignores inflation, India's MSP for rice and wheat appears to exceed the limit even though Indian support per farmer is tiny compared with the US or EU.
India's stand: first, food security of hundreds of millions of poor people cannot be traded away; at Bali (December 2013) India, with the G-33 coalition, secured an interim peace clause protecting public stockholding programmes from challenge. Second, in July 2014 India refused to ratify the Trade Facilitation Agreement until a permanent solution was assured; the General Council (November 2014) then extended the peace clause indefinitely. Third, India defends Article 6.2 exemptions for input subsidies to low-income, resource-poor farmers, who are over 85% of Indian farmers.
India also demands a Special Safeguard Mechanism and an inflation-adjusted reference price.
Assessment: India's stand protects the NFSA, 2013, and the livelihood of small farmers. Critics argue that open-ended procurement distorts markets and India must also reform: target support better, shift to Green Box measures such as income transfers, research and irrigation, and keep stocks near buffer norms.
A balanced approach combines firm defence of food security in Geneva with domestic reform that reduces dependence on price support.
2. Agricultural Prices, MSP and Agricultural Subsidies
Example 8 (UPSC 2024, 10 marks): What are the implications of "PM-Kisan Samman Nidhi" scheme?
Paper and question: Paper II, Q1(e)
Approach: Describe PM-KISAN briefly with its size, then examine its implications for farm incomes, investment, fiscal policy, WTO compatibility and equity (tenants excluded).
PM-Kisan Samman Nidhi, announced in the interim Budget of February 2019, is a Central Sector scheme that transfers ₹6,000 a year in three instalments of ₹2,000 directly to the bank accounts of landholding farmer families. The 21st instalment (November 2025) reached about 9 crore farmers, and cumulative transfers crossed ₹4 lakh crore; the 2026–27 Budget provides ₹63,500 crore.
Implications: (1) It gives assured liquidity at sowing time, reducing dependence on moneylenders; IFPRI surveys found beneficiaries spent more on inputs. (2) As a decoupled income transfer, it falls in the WTO Green Box, unlike price support.
Limitations: the amount is small, about ₹500 a month, against rising input costs; tenants and landless labourers, often the poorest, are excluded because eligibility rests on land records; and its cost is several times the budget for agricultural research, raising the question of better public investment.
PM-KISAN is a useful floor of income support, but it complements, not replaces, investment in irrigation, research and markets.
Example 9 (UPSC 2024, 15 marks): What are the various forms of subsidies that go into agriculture sector in India? What is the justification for these?
Paper and question: Paper II, Q8(c)
Approach: Classify the subsidies (input, price, credit, insurance, income support) with current figures, then give the economic and social justifications and a short caution.
An agricultural subsidy is a transfer that lowers the cost of inputs or raises the price received by farmers below or above market levels. In India both the Centre and the states give them.
Forms: (1) Fertiliser subsidy: urea at a fixed MRP and phosphatic and potassic fertilisers under the Nutrient Based Subsidy (2010); about ₹1.71 lakh crore in the 2026–27 Budget. (2) Power and irrigation subsidies of states: free or flat-rate power for pumps (Punjab since 1997) and canal water priced below operating cost. (3) Credit: interest subvention giving short-term crop loans at an effective 4% with prompt repayment. (4) Crop insurance: PMFBY (2016) with farmer premiums of 2% (kharif), 1.5% (rabi) and 5% (commercial crops). (5) Price support through MSP and procurement. (6) Income support: PM-KISAN, ₹6,000 a year.
Justification: about 86% of holdings are small and marginal (Agriculture Census 2015–16), so subsidies make modern inputs affordable and speed technology adoption, as in the Green Revolution. They offset market failures in credit and insurance, compensate for weather and price risk, keep food cheap for consumers, and support food security and rural incomes.
However, input subsidies favour larger farmers and cause overuse of urea, water and power. The best justification is for targeted, Green Box support and public investment rather than open-ended input subsidies.
Example 10 (UPSC 2023, 10 marks): Distinguish between explicit and implicit subsidies. Explain the trends in explicit subsidies on irrigation and fertilizer in India during post-economic reform period.
Paper and question: Paper II, Q5(a)
Approach: Define explicit and implicit subsidies with examples, then trace post-1991 trends in fertiliser (explicit, budgeted) and irrigation (largely implicit) subsidies with figures.
An explicit subsidy is a direct budgetary outlay shown in government accounts, such as the fertiliser or food subsidy. An implicit subsidy is hidden: it is the gap between the cost of a publicly provided good and the revenue recovered from users, as with canal irrigation and farm power.
Fertiliser subsidy: it rose from about ₹4,400 crore in 1990–91 to about ₹62,000 crore in 2010–11 and a peak of about ₹2.5 lakh crore in 2022–23. The 1992 decontrol of P and K fertilisers and the Nutrient Based Subsidy (2010) kept urea controlled, so urea became relatively cheap and use became imbalanced. The allocation eased to about ₹1.71 lakh crore in 2026–27.
Irrigation subsidy: water rates have not been revised in many states for years, so receipts from canal irrigation cover only a small part of operating and maintenance costs, and the implicit subsidy has grown.
Both trends show rising subsidies but falling efficiency, which is why reformers favour DBT and better cost recovery.
Example 11 (UPSC 2022, 15 marks): Discuss the rationale for continuance of power and irrigation subsidy in the agriculture sector in India.
Paper and question: Paper II, Q4(c)
Approach: Give the rationale for power and irrigation subsidies (risk, small farmers, food security, positive externality), then note the costs and suggest how they can continue in a smarter form.
Power and irrigation subsidies are mainly given by states: free or flat-rate electricity for pumpsets (Punjab, Tamil Nadu, Telangana and others) and canal water priced far below cost. Punjab alone spends roughly ₹10,000 crore a year on farm power subsidy.
Rationale for continuance: (1) Irrigation is the key input of the Green Revolution technology; about 55% of net sown area is irrigated, and assured water raises yields and cropping intensity. (2) About 86% of holdings are small and marginal, and without support many could not afford pumps or electricity at cost. (3) Irrigation reduces the risk of drought, stabilises output and supports food security and procurement. (4) Irrigation has positive externalities, such as higher employment and rural demand, which justify public support. (5) Farmers face falling terms of trade in some years and price volatility, and the subsidy works as income support. (6) Politically, it is hard to withdraw, as states that tried metering faced protests.
Costs: free power encourages paddy in water-scarce regions and groundwater depletion; the Central Ground Water Board classifies about three-fourths of Punjab's blocks as over-exploited. It also drains distribution companies' finances and benefits larger farmers with more pumps.
Hence continuance is justified only in a reformed form: separate agricultural feeders (Gujarat's Jyotigram), metering with direct cash transfer per acre (Punjab's Paani Bachao Paise Kamao pilot), solar pumps under PM-KUSUM (2019) and micro-irrigation under PMKSY.
Example 12 (UPSC 2021, 15 marks): Examine the procurement policy of the Government of India in the post-liberalisation period and its impact on agricultural prices.
Paper and question: Paper II, Q6(c)
Approach: Outline how procurement works after 1991 (MSP, FCI, DCP, PM-AASHA), then examine its effect on market prices, crop pattern and regional spread, with a diagram of price support.
Procurement policy means government purchase of farm produce at the Minimum Support Price announced on the advice of the CACP, mainly by the FCI and state agencies, to support farmers and stock grain for the PDS.
Post-1991 changes: MSPs were raised sharply in the late 1990s and after 2007–08; Decentralised Procurement (1997–98) let states procure and distribute themselves; from 2018–19 MSPs are set at least 1.5 times the A2+FL cost; PM-AASHA (2018) added price deficiency payments and pulses and oilseeds procurement. For 2026–27 the MSP of common paddy is ₹2,441 per quintal and of wheat ₹2,585.
Diagram: wheat market with demand D and supply S; the market price Pm lies below the MSP; at MSP farmers supply Qs while private buyers take Qd; government buys the surplus Qs − Qd; mark the gain in producer surplus and the cost of procurement as the rectangle MSP × (Qs − Qd).
Impact on prices: procurement sets an effective floor for rice and wheat in states with active purchase, raising farm-gate and market prices; open-ended purchase also raised stocks well above buffer norms, as in 2002 and 2012, keeping open market prices high, which the Shanta Kumar Committee (2015) linked to food inflation. In states with weak procurement, such as Bihar or eastern Uttar Pradesh, market prices often stay below MSP.
Other effects: a bias towards rice and wheat over pulses, oilseeds and millets, concentration in Punjab, Haryana and Madhya Pradesh, and only about 6% of farmers selling to procurement agencies (Shanta Kumar, from NSS data).
Procurement has stabilised cereal prices but needs to be broadened to more crops and regions, with price deficiency payments where procurement is impractical.
Example 13 (UPSC 2020, 10 marks): Analyse the impact of fertilizer subsidy on agricultural productivity growth during the post reform period.
Paper and question: Paper II, Q1(e)
Approach: Explain how the fertiliser subsidy was meant to raise productivity, then show why its effect weakened after reforms (imbalanced NPK, falling response), and end with reforms.
The fertiliser subsidy, through the Retention Price Scheme (1977) and later the New Urea Policy and the Nutrient Based Subsidy (2010), kept fertilisers cheap so that farmers would adopt high-yielding varieties, which respond strongly to nutrients.
Positive impact: fertiliser use rose from under 13 million tonnes of nutrients in 1991–92 to about 30 million tonnes in recent years, supporting record foodgrain output and the spread of HYVs to eastern and rainfed areas.
Weakening impact after reform: the decontrol of P and K in 1992 and the NBS left urea under price control, so urea became much cheaper than DAP and potash; the NPK use ratio moved far from the recommended 4:2:1, damaging soil health. The yield response per kilogram of nutrient has declined sharply since the 1970s, so total factor productivity growth slowed even as subsidy costs soared.
Reforms such as neem-coated urea (2015), Soil Health Cards (2015), DBT at retail points (2018) and nano urea (2021) aim to restore balanced use and productivity gains.
Example 14 (UPSC 2019, 10 marks): How has the movement of agricultural prices during the post-liberalisation period been responsible for farmers' distress in India?
Paper and question: Paper II, Q1(d)
Approach: Link post-1991 price movements (terms of trade, volatility, low realisation, rising costs) to farmers' distress, citing years and evidence, and suggest remedies briefly.
Liberalisation was expected to improve farmers' terms of trade by removing the anti-agriculture bias of protection, and the terms of trade did improve in the 1990s. But price movements later contributed to distress in several ways.
First, volatility: integration with world markets transmitted global price falls, as in cotton and oilseeds around 1998–2002 and after 2014, while onion, tomato and potato prices swing in boom-bust cycles. Second, low price realisation: outside rice and wheat in procurement states, most farmers sell below MSP; the farm price deflation of 2014–18 and the 2016 demonetisation cut incomes. Third, input costs (seeds, diesel, labour, Bt cotton seed and pesticides) rose faster than output prices in many years, squeezing margins. Fourth, sudden export bans and stock limits cap prices just when farmers could gain.
Indebtedness from these losses is a leading factor in farmer suicides recorded by NCRB. Price stabilisation funds, wider MSP coverage, e-NAM, futures markets and stable trade policy can reduce this distress.
Example 15 (UPSC 2016, 15 marks): "Agriculture Subsidy is both an Economic as well as Social issue, hence the Government finds it difficult to take a decisive decision". Comment on the above statement.
Paper and question: Paper II, Q8(b)
Approach: Show the economic side (cost, inefficiency, distortion) and the social side (small farmers, food security, equity, politics) of subsidies, explain why this makes a decisive choice hard, and suggest a middle path.
The statement is largely valid. Agricultural subsidies in India (fertiliser, power, irrigation, credit, insurance and price support) have an economic dimension of cost and efficiency and a social dimension of livelihoods and equity, and these pull in opposite directions.
Economic issue: subsidies cost the Centre and states several lakh crore rupees a year, crowd out public investment in irrigation, research and roads (Gulati and Narayanan, 2003; Fan, Gulati and Thorat, 2008), and distort input use: cheap urea unbalances soil nutrients and free power depletes groundwater. A large part goes to bigger farmers and to fertiliser and power producers.
Social issue: over 45% of the workforce depends on agriculture and about 86% of holdings are small and marginal; for them subsidies are a safety net against weather and price risk. Cheap inputs keep food prices low for poor consumers and support food security, and withdrawal could deepen rural distress.
Why decisions are difficult: the benefits are concentrated and visible while the costs are diffuse, so farm groups resist cuts; power and irrigation are state subjects, needing Centre-state consensus; and attempts at reform, such as the 2020 farm laws (repealed in 2021), show the political sensitivity.
The way forward is gradual reform: convert input subsidies into targeted cash transfers, cap benefits per farmer, and redirect savings to public investment, so that the social goal is met at lower economic cost.
Example 16 (UPSC 2015, 15 marks): What are the different types of agricultural subsidies that are given to the farmers in India? How can these be rationalised?
Paper and question: Paper II, Q3(b)
Approach: List the main agricultural subsidies with who gives them, then propose concrete rationalisation measures for each, drawing on the Shanta Kumar Committee and DBT.
Agricultural subsidies in India are given by the Centre and the states, mainly on inputs and through price support.
Types: (1) Fertiliser subsidy (Centre): urea at a controlled price and P and K fertilisers under the Nutrient Based Subsidy (2010). (2) Power subsidy (states): free or flat-rate electricity for pumps. (3) Irrigation subsidy (states): canal water charges far below cost. (4) Credit subsidy: interest subvention on short-term crop loans. (5) Seed, farm machinery and micro-irrigation subsidies. (6) Crop insurance premium subsidy. (7) Price support: MSP with procurement of rice and wheat, which also includes the economic cost of FCI operations.
Rationalisation: (1) Bring urea under the nutrient-based regime and pay the fertiliser subsidy directly to farmers; the Shanta Kumar Committee (2015) suggested a cash subsidy of about ₹7,000 per hectare. (2) Meter farm power, separate agricultural feeders and give a fixed cash amount per acre so that saving power earns money; promote solar pumps. (3) Revise water rates through water user associations to cover maintenance costs. (4) Link credit subvention to tenants and small farmers through Kisan Credit Cards. (5) Shift price support towards price deficiency payments and diversify procurement to pulses and oilseeds.
Rationalisation does not mean abolition: savings should be ploughed into irrigation, research and markets, which give higher returns.
Example 17 (UPSC 2015, 15 marks): High Minimum Support Prices (MSP) induce distortions, some of which ultimately hurt the poor. Examine its merits and demerits.
Paper and question: Paper II, Q4(b)
Approach: Explain how a high MSP works with a diagram, then weigh its merits against the distortions that hurt the poor (higher food prices, stocks, crop pattern, groundwater), and conclude.
The Minimum Support Price, fixed by the Centre on CACP recommendations since 1965, is a floor price backed by procurement. When it is set well above the market-clearing level it changes incentives across the food economy.
Diagram: demand D and supply S for wheat; market equilibrium at Pe, Qe; a high MSP above Pe raises supply to Qs and cuts private demand to Qd; the surplus Qs − Qd is procured and stored; consumers outside the PDS pay a higher price.
Merits: it assures farmers a remunerative price and reduces risk, encouraged adoption of Green Revolution technology, and supplies grain for the PDS and buffer stocks, which underpin food security for about 81 crore people.
Demerits that hurt the poor: (1) high MSP raises open-market cereal prices, and the poor who buy part of their food from the market pay more; the Shanta Kumar Committee (2015) linked excessive stocks to food inflation. (2) Stocks far above buffer norms raise carrying costs and the food subsidy, crowding out spending on health and nutrition. (3) It skews cropping towards rice and wheat, reducing pulses and oilseeds, whose prices then rise, hurting protein intake of poor households. (4) Free power plus assured paddy prices deplete groundwater in Punjab and Haryana. (5) Benefits go mainly to surplus farmers in a few states; only about 6% of farmers sell to procurement agencies.
A balanced MSP policy would align prices with cost and market signals, extend support to pulses, oilseeds and millets, and use price deficiency payments rather than open-ended procurement.
Example 18 (UPSC 2014, 15 marks): What are the factors responsible for large number of farmers' suicides in relatively richer Indian States? Examine.
Paper and question: Paper II, Q4(b)
Approach: Explain the paradox that suicides are concentrated in relatively richer states (Maharashtra, Andhra Pradesh, Karnataka), then examine the factors: cash crops, costs, debt, rainfed risk, prices and weak support, with NCRB data.
NCRB recorded about 11,772 farmer suicides in 2013, with the largest numbers in Maharashtra, undivided Andhra Pradesh, Karnataka and Madhya Pradesh, which have above-average per capita incomes. The paradox shows that distress comes not from poverty alone but from commercialised, high-risk farming without safety nets.
Factors: (1) Shift to cash crops such as cotton, soybean and sugarcane on rainfed land, as in Vidarbha and Marathwada; these need costly seeds, pesticides and fertiliser, so a crop failure wipes out large investments. (2) Indebtedness to private moneylenders at high interest, because institutional credit reaches tenants and small farmers poorly; studies of Maharashtra by Srijit Mishra (IGIDR) found debt the strongest correlate. (3) Low irrigation in these regions, so droughts and erratic monsoons cause repeated losses. (4) Price volatility and low realisation: integration with world markets transmitted cotton price falls, and procurement covers mainly rice and wheat. (5) Spurious seeds and pest attacks, such as pink bollworm on Bt cotton. (6) Weak crop insurance and extension.
Richer states also have more commercial farmers, more land markets and better recording, which partly raises reported numbers.
The remedy lies in irrigation and watershed development in rainfed areas, wider institutional credit and debt relief for the distressed, effective crop insurance, crop diversification suited to rainfall, and counselling and support through local bodies.
3. Public Distribution System and Food Security
Example 19 (UPSC 2025, 10 marks): What are the structural shortcomings of the 'Public Distribution System (PDS)' in India? Explain.
Paper and question: Paper II, Q5(c)
Approach: Define the PDS briefly and list its structural (built-in) shortcomings: targeting, leakage, cereal bias, fiscal and storage costs, federal design, with evidence.
The Public Distribution System supplies subsidised (now free) grain through about 5.4 lakh fair price shops to about 81 crore people under the NFSA, 2013, using grain procured at MSP by the FCI and states.
Structural shortcomings: (1) Targeting errors: coverage is still fixed on Census 2011 population, so newer households and migrants face exclusion errors, while better-off families hold cards (inclusion errors). (2) Leakage: diversion between godown and shop persists; an ICRIER study (2025) using HCES 2022–23 put it near 28%. (3) Cereal bias: rice and wheat dominate, with little pulses, oil or micronutrients, so it does little for nutrition. (4) High economic cost: FCI's cost of procurement, storage and transport far exceeds market prices. (5) It is tied to open-ended procurement in a few states, distorting cropping patterns. (6) Split responsibility: the Centre procures and allocates, states distribute, blurring accountability.
Reforms such as end-to-end computerisation, ePoS, ONORC and fortified rice address some of these, but targeting and nutrition remain the core gaps.
Example 20 (UPSC 2023, 15 marks): State the key features of the Targeted Public Distribution System (TPDS) in India. Do you believe that TPDS has been successful in achieving its objectives? Justify your answer.
Paper and question: Paper II, Q6(b)
Approach: State the features of TPDS (1997) and its NFSA (2013) form, then judge success against its objectives (targeting the poor, price stability, food security, efficiency) with evidence, and give a reasoned verdict.
The Targeted Public Distribution System replaced the universal PDS in June 1997 to focus subsidies on the poor and cut the fiscal cost.
Key features: households were divided into BPL and APL, with BPL families getting grain at about half the economic cost; Antyodaya Anna Yojana (2000) gave 35 kg a month to the poorest at ₹2 for wheat and ₹3 for rice. The NFSA, 2013, turned it into a legal right covering up to 75% of rural and 50% of urban people: 5 kg per person a month for priority households and 35 kg per AAY household. Grain became free from January 2023 and is assured for five years from January 2024.
Successes: it gave a reliable food floor during droughts and the COVID-19 shock, when PMGKAY distributed extra free grain to about 80 crore people; leakage fell from over half around 2004–05 to about 42% in 2011–12 (Drèze and Khera) and near 28% by 2022–23 (ICRIER); ONORC made rations portable.
Shortfalls: targeting under BPL lists had large exclusion errors, which the NFSA's wide coverage only partly solved; its cereal focus did not reduce malnutrition (stunting 35.5% in NFHS-5, 2019–21); and the economic cost remains high.
I believe TPDS has been partly successful: it achieved calorie security and price stability for the poor, but not nutrition security or full efficiency.
Example 21 (UPSC 2022, 10 marks): Discuss the features of targeted Public Distribution System in India and point out the obstacles in its implementation.
Paper and question: Paper II, Q1(b)
Approach: Give the features of TPDS in brief, then list the main obstacles in implementation (identification, leakage, viability of shops, technology exclusion, logistics).
Features: the Targeted PDS (June 1997) gives subsidised grain to identified poor households through fair price shops. The Centre procures, stores and allocates grain through the FCI; states identify beneficiaries, issue ration cards and run the shops. Antyodaya Anna Yojana (2000) targets the poorest with 35 kg a month. Under the NFSA, 2013, up to 75% of rural and 50% of urban people are covered, with 5 kg per person, a legal entitlement and grievance redressal; grain has been free since 2023.
Obstacles: (1) Identifying beneficiaries: BPL surveys and later state lists suffer inclusion and exclusion errors, and coverage is frozen at Census 2011. (2) Leakages and diversion to the open market, especially where shops are privately run. (3) Low dealer commissions make shops unviable, encouraging malpractice. (4) Aadhaar-based authentication fails for some elderly and manual workers, and network gaps exclude remote villages. (5) Transport, storage losses and delays in lifting grain.
States such as Chhattisgarh show that computerisation, community-run shops and doorstep delivery can overcome many of these obstacles.
Example 22 (UPSC 2020, 15 marks): Examine the efficacy and resilience of the Public Distribution System in India for providing food security.
Paper and question: Paper II, Q6(b)
Approach: Define food security in its three dimensions, then assess the PDS on efficacy (coverage, leakage, nutrition, cost) and resilience (droughts, COVID-19, migrants), and conclude.
Food security, as defined at the World Food Summit (1996), exists when all people at all times have physical and economic access to sufficient, safe and nutritious food. It has three dimensions: availability, access and absorption. India's main instrument is the Public Distribution System, given legal backing by the NFSA, 2013.
Efficacy: the PDS covers about 81 crore people and has improved access: leakage fell from over half of grain around 2004–05 to about 42% in 2011–12 (Drèze and Khera) and further after computerisation, Aadhaar seeding and ePoS machines. But its efficacy for absorption is weak: it supplies mainly rice and wheat, while NFHS-5 (2019–21) still found 35.5% of children stunted and 57% of women anaemic. Targeting errors and the high economic cost of the FCI also limit it.
Resilience: the system proved resilient in shocks. During COVID-19, PMGKAY (April 2020) gave an extra 5 kg free to about 80 crore beneficiaries using record central stocks, and One Nation One Ration Card let migrants draw rations anywhere. During droughts, states with universal PDS, such as Tamil Nadu and Chhattisgarh, protected consumption. Weak points were migrants without cards and urban poor outside the lists.
Overall the PDS is effective and resilient for calorie security, but nutrition security needs pulses, millets, fortified grain and links with ICDS and school meals.
Example 23 (UPSC 2019, 10 marks): What reforms would you advocate to make the public distribution system (PDS) in India more effective?
Paper and question: Paper II, Q5(a)
Approach: Propose a set of specific reforms (technology, targeting, delivery, diversification, cash option, procurement) with Indian examples, in about 150 words.
The Public Distribution System reaches about 81 crore people, but leakage, targeting errors, cereal bias and high cost limit it. I would advocate these reforms.
(1) End-to-end computerisation: digitise ration cards, link them with Aadhaar, track grain from godown to shop with GPS, and use ePoS at every shop, as Chhattisgarh did from 2004. (2) Better targeting: update beneficiary lists using SECC and current data, and allow self-exclusion. (3) Portability through One Nation One Ration Card for migrants. (4) Viable shops: higher dealer margins, community or cooperative management, and allowing shops to sell other goods. (5) Diversification: add pulses, edible oil and millets, and fortified rice, to address nutrition. (6) A cash option through DBT where markets work well, as piloted in Chandigarh and Puducherry in 2015, with safeguards. (7) Decentralised procurement to cut transport costs and the FCI's role refocused as the Shanta Kumar Committee (2015) suggested.
These reforms together would cut leakage and make the PDS a nutrition programme, not only a grain programme.
Example 24 (UPSC 2016, 10 marks): Examine the basic features of the National Food Security Act 2013.
Paper and question: Paper II, Q5(c)
Approach: List the basic features of the NFSA, 2013: coverage, entitlements, women's empowerment, nutrition provisions, cost sharing, grievance redressal and transparency.
The National Food Security Act, passed in September 2013, shifted food policy from a welfare to a rights-based approach, giving legal entitlement to subsidised grain.
Basic features: (1) Coverage: up to 75% of the rural and 50% of the urban population, about 81 crore people. (2) Entitlement: 5 kg of grain per person a month for priority households at ₹3, ₹2 and ₹1 per kg for rice, wheat and coarse grains; Antyodaya households keep 35 kg per household. (3) Nutrition: free meals for children aged 6 months to 14 years through anganwadis and mid-day meals, take-home rations for pregnant and lactating women, and maternity benefit of at least ₹6,000. (4) Women's empowerment: the eldest woman aged 18 or above is head of the household for the ration card. (5) Food security allowance if grain is not supplied. (6) Grievance redressal through District Grievance Redressal Officers and State Food Commissions.
The Act made food a justiciable entitlement, though it focuses on cereals more than nutrition.
Example 25 (UPSC 2015, 10 marks): Highlight the basic features of National Food Security Act (NFSA), 2013. Can it solve the problem of malnutrition in the country? Discuss.
Paper and question: Paper II, Q5(a)
Approach: Highlight the NFSA's main features briefly, then discuss whether it can solve malnutrition, separating calorie access from the other causes of malnutrition, and conclude.
Features: the National Food Security Act, 2013, gives a legal right to 5 kg of grain per person a month at ₹1–3 per kg to up to 75% of rural and 50% of urban people (35 kg per Antyodaya household), free meals for children through anganwadis and schools, maternity benefit of at least ₹6,000 and grievance redressal.
Can it solve malnutrition? Only partly. It improves calorie access and acts as an income transfer, freeing money for other foods, and its child and maternal provisions target the first 1,000 days. But malnutrition, with about 38% of children under five stunted in NFHS-4 (2015–16), has many causes beyond cereals: lack of protein and micronutrients (hidden hunger), poor sanitation and open defecation that cause infections, low maternal education and age at marriage, and poor feeding practices. The Act supplies mainly rice and wheat.
It must therefore be combined with pulses and fortified food, sanitation, ICDS and health services, as later done under POSHAN Abhiyaan (2018).
4. Food Processing, Public Investment and Agricultural Growth
Example 26 (UPSC 2025, 10 marks): Discuss the components of food processing schemes introduced by the Government of India.
Paper and question: Paper II, Q5(a)
Approach: Name the three main schemes (PMKSY, PMFME, PLISFPI) with year and outlay and list the components of each, ending with their combined purpose.
The Ministry of Food Processing Industries runs three main schemes to raise value addition and cut post-harvest losses.
(1) Pradhan Mantri Kisan SAMPADA Yojana (PMKSY, 2017), an umbrella scheme whose components are Mega Food Parks, Integrated Cold Chain and Value Addition Infrastructure, creation and expansion of food processing capacity, Agro-processing Clusters, Backward and Forward Linkages, Food Safety and Quality Assurance Infrastructure, and Operation Greens (2018, first for tomato, onion and potato, later widened).
(2) PM Formalisation of Micro Food Processing Enterprises (PMFME, June 2020), outlay ₹10,000 crore: One District One Product approach, a 35% credit-linked capital subsidy for micro units, seed capital for self-help group members, common infrastructure, and branding, marketing and training support.
(3) Production Linked Incentive Scheme for Food Processing (PLISFPI, 2021), outlay ₹10,900 crore for 2021–22 to 2026–27: incentives on incremental sales of ready-to-eat foods, processed fruits and vegetables, marine products, mozzarella cheese and millet products, plus support for branding abroad.
Together they cover the whole chain, from farm-gate infrastructure to micro units and large export-oriented firms.
Example 27 (UPSC 2024, 15 marks): For faster increase in farmers' income, is it necessary to link them with corporate-sector in India? Discuss.
Paper and question: Paper II, Q4(b)
Approach: Explain how corporate linkage (contract farming, value chains) can raise incomes, then the risks for small farmers, and argue that linkage is useful but not necessary, with FPOs and cooperatives as alternatives.
Farm incomes are low because 86% of holdings are small and marginal and farmers capture a small share of the consumer's rupee. Linking farmers with the corporate sector through contract farming, direct procurement and value chains is one route to faster income growth.
Benefits: assured price and market reduce risk; firms supply quality seed, credit, technology and extension; produce moves to high-value crops and processing; and middlemen are cut out. Examples include PepsiCo's potato contracts in Punjab, ITC's e-Choupal (2000) for soybean, and poultry integration in Tamil Nadu, where growers earn steady fees.
Risks: unequal bargaining power lets firms reject produce on quality grounds or delay payment; contracts favour larger farmers; monocropping raises ecological risk; and disputes are hard for small farmers to fight. The 2020 farm laws, which included a contract farming law, were repealed in 2021 after protests, showing distrust.
Is it necessary? Not strictly. Collective models also raise incomes: Amul's dairy cooperatives, and Farmer Producer Organisations under the scheme for 10,000 FPOs (2020), which give small farmers scale and bargaining power. Public investment in irrigation, markets (e-NAM) and price support remains essential.
Corporate linkage is therefore helpful when mediated by FPOs and backed by enforceable contracts and fair dispute settlement, but it is one of several routes, not a precondition.
Example 28 (UPSC 2023, 15 marks): Explain the main reasons for deceleration in agricultural growth in India during the post-economic reform period.
Paper and question: Paper II, Q2(c)
Approach: Give the growth phases after 1991 with data, then explain the reasons for the slowdown (public investment, technology fatigue, resources, prices, institutions), and note the later recovery.
Agricultural growth was about 3% a year in the early 1990s but slowed to about 2% between 1997 and 2004, the years of the 'agrarian crisis', before recovering to about 3.5–4% in 2004–14. The deceleration had several causes.
(1) Decline in public investment: states diverted funds to subsidies and salaries, so public capital formation in irrigation, power and roads fell in real terms in the 1990s. (2) Technology fatigue: Green Revolution varieties reached their yield plateau, and research and extension spending stayed low, about 0.4–0.5% of agricultural GDP. (3) Falling input response: imbalanced fertiliser use and soil degradation reduced yields per unit of input. (4) Water stress: groundwater depletion in the north-west and slow completion of canal projects. (5) Shrinking holdings, averaging 1.08 hectares in 2015–16. (6) Price factors: world prices fell around 1998–2002, and terms of trade turned against farmers. (7) Weak credit and institutions: the share of moneylenders rose again in the 1990s, and market reforms such as APMC changes were slow. (8) Recurrent droughts, such as 2002.
Growth recovered after 2004 through higher public investment, credit doubling, RKVY and NFSM (2007) and better prices, and the Economic Survey 2024–25 reports about 5% average growth in 2016–17 to 2022–23, led by livestock and fisheries.
Sustaining growth needs public investment in research and irrigation, water-saving technology and diversification.
Example 29 (UPSC 2021, 10 marks): Analyse the new initiatives taken by the Government of India to boost food processing sector.
Paper and question: Paper II, Q5(c)
Approach: List the main recent initiatives (PMFME, PLI, PMKSY, Agri Infrastructure Fund, Operation Greens, FDI policy) with years and outlays, and analyse briefly what they achieve and what limits them.
The food processing sector links farmers to consumers and can cut post-harvest losses, which a NABCONS study (2022) put at about ₹1.5 lakh crore a year. Recent initiatives include:
(1) PMFME (June 2020), ₹10,000 crore, formalising 2 lakh micro units through One District One Product, credit-linked subsidy and branding. (2) PLI scheme for food processing (2021), ₹10,900 crore, rewarding incremental sales and global brands. (3) PMKSY (2017): mega food parks, cold chains, agro-processing clusters. (4) The Agriculture Infrastructure Fund (2020), ₹1 lakh crore of financing with interest subvention for warehouses, cold stores and processing units. (5) Operation Greens extended in 2020 from tomato, onion and potato to all fruits and vegetables. (6) 100% FDI under the automatic route in food processing, and 100% FDI through the government route in trading of food products made in India (2016).
These improve infrastructure and scale, but fragmented supply, weak cold chains and unstable export policy still hold the sector back.
Example 30 (UPSC 2021, 20 marks): What are the major components of public expenditure on agriculture in India? Would you recommend any changes in the pattern of public expenditure on agriculture to stimulate agricultural growth?
Paper and question: Paper II, Q6(a)
Approach: Classify public expenditure on agriculture into subsidies, income transfers and investment (Centre and states), then use Fan-Gulati-Thorat evidence to recommend a shift from subsidies to investment, with a bar diagram.
Public expenditure on agriculture is spread across the Centre and states and over several ministries. It can be grouped into four components.
(1) Input subsidies: fertiliser subsidy of the Centre (about ₹1.71 lakh crore in 2026–27), and power and irrigation subsidies of states. (2) Income and price support: PM-KISAN (₹6,000 a year per farm family), MSP operations and the food subsidy, crop insurance premium subsidy under PMFBY and interest subvention on crop loans. (3) Public investment: major and medium irrigation (mostly states), PMKSY for micro-irrigation and watersheds, rural roads, electrification, markets and storage, and the Agriculture Infrastructure Fund. (4) Research, education and extension through ICAR, agricultural universities and Krishi Vigyan Kendras, about 0.4–0.5% of agricultural GDP.
The pattern is tilted heavily towards subsidies and transfers, which are several times larger than investment and research.
Diagram: bar chart of the marginal return to growth and poverty reduction per rupee of public spending: tallest bars for agricultural research, rural roads and education, medium for irrigation, shortest for fertiliser, power and credit subsidies (based on Fan, Gulati and Thorat, 2008).
Recommended changes: (1) Raise research and extension spending towards 1% of agricultural GDP, focusing on climate-resilient seeds, pulses and oilseeds. (2) Shift power and fertiliser subsidies into direct cash transfers per acre and use the savings for irrigation completion, watershed and micro-irrigation. (3) Invest in post-harvest infrastructure, e-NAM and warehousing to raise price realisation. (4) Strengthen livestock and fisheries, the fastest-growing segments. (5) Give more to rainfed and eastern regions, where marginal returns are higher.
Such a reallocation would crowd in private investment and raise productivity growth, while targeted cash support protects small farmers' incomes.
Example 31 (UPSC 2020, 10 marks): Do you think the food processing sector as the sunrise sector in India during the post-reform period? Justify your answer.
Paper and question: Paper II, Q5(b)
Approach: Take a position (yes, with qualifications) and justify it with growth, demand drivers, linkages and policy support, then mention the constraints.
A sunrise sector is a young industry with high growth potential. Food processing qualifies in India, with some qualifications.
Justification: (1) Its GVA has grown faster than agriculture in the post-reform period, about 7–8% a year in the years before 2020 (Ministry of Food Processing Industries). (2) Demand is rising with incomes, urbanisation, nuclear families and women's work, shifting diets towards packaged and ready-to-eat foods. (3) It is a large employer, about one-eighth of employment in registered factories (Annual Survey of Industries), with strong backward linkages to farmers. (4) India is a leading producer of milk, fruits, vegetables and fish, so raw material is abundant, and processed food is a growing share of agricultural exports. (5) Policy support: 100% FDI under the automatic route, Mega Food Parks and later PMFME and PLI.
Qualifications: the share of output processed remains low, the sector is dominated by unorganised micro units, and cold chains and food safety systems are weak.
Thus it is a sunrise sector whose potential is only partly realised.
Example 32 (UPSC 2020, 20 marks): Explain the trend in gross capital formation in agriculture in India during the post liberalisation period. Do you think that private investment has been crowded out by the public investment during this period?
Paper and question: Paper II, Q6(a)
Approach: Describe the post-1991 trend of agricultural capital formation (total, public, private) with data and a time-series diagram, then answer the crowding-out question with theory and evidence, concluding that crowding-in dominates.
Gross capital formation (GCF) in agriculture is investment in irrigation, land development, machinery, livestock, orchards and farm buildings. It is the main source of long-run productivity growth.
Trend: (1) In the 1990s total GCF in agriculture stagnated as a share of agricultural GDP, at about 10–11%. Public GCF, mainly irrigation by states, fell in real terms as funds were diverted to subsidies and salaries, so its share in agricultural GCF dropped to around one-fourth. (2) After 2003–04, investment rose sharply, with the ratio of GCF to agricultural GVA crossing 15% by the late 2000s, driven by private investment in tubewells, tractors and allied activities, helped by credit doubling (2004) and better prices. (3) In the 2011–12 series, the ratio has stayed roughly in the 15–20% range, and the private sector, households in particular, accounts for about four-fifths.
Diagram: time on the x-axis (1990–91 to 2020–21) and GCF in agriculture at constant prices on the y-axis; draw a rising private GCF line, a flat-then-slowly-rising public GCF line, and the total above both; shade the 1990s dip in public investment.
Crowding out or crowding in? In macro theory, public investment can crowd out private investment by raising interest rates or competing for resources. In agriculture, the evidence points the other way. Public canals, power lines and roads raise the return on private wells, pumps and land improvement, so they crowd in private investment; studies by Shetty (1990), Mishra and Chand (1995) and Gulati and Bathla (2001) found complementarity. Private investment did grow while public investment fell in the 1990s, but this was driven by subsidised power and credit rather than substitution, and it led to groundwater depletion.
So private investment was not crowded out; if anything, falling public investment weakened its quality and sustainability, which calls for raising public investment in irrigation, research and markets.
Example 33 (UPSC 2019, 15 marks): Do you think that the fall in public investment in agriculture adversely affects the productivity growth of this sector in India? Give reasons.
Paper and question: Paper II, Q3(c)
Approach: Answer yes, explain the channels through which public investment raises productivity, support with evidence on the 1990s slowdown and returns to public spending, and note qualifications.
Yes. Public investment in irrigation, research, roads, power and markets creates public goods that private farmers cannot provide, so its decline lowers productivity growth.
Channels: (1) Irrigation raises yields and cropping intensity and allows HYV adoption; canal projects need public funds. (2) Agricultural research and extension generate new varieties; the Green Revolution itself came from public research. (3) Rural roads and markets cut transport costs and raise price realisation, encouraging input use. (4) Public investment crowds in private investment in wells, pumps and machinery.
Evidence: public capital formation in agriculture fell in real terms through the 1990s, and total factor productivity and output growth slowed to about 2% a year in 1997–2004. Fan, Gulati and Thorat (2008) found research, roads and education gave the highest returns, while input subsidies gave the lowest. Research spending at about 0.4–0.5% of agricultural GDP is below the 1% often recommended.
Qualifications: the quality of investment matters, as many irrigation projects remain incomplete, and private investment partly filled the gap through tubewells.
Reversing the decline, with better project completion, is essential for productivity growth.
Example 34 (UPSC 2018, 10 marks): Horticulture is now the growth driver of Indian Agriculture. Discuss the issue in the broad context of rural diversification.
Paper and question: Paper II, Q5(b)
Approach: Support the statement with output and growth data for horticulture, explain why it drives growth, and place it within rural diversification (livestock, fisheries, non-farm work), noting constraints.
Rural diversification means a shift of rural output and employment from staple cereals towards high-value agriculture (fruits, vegetables, livestock, fisheries) and non-farm activities. Horticulture is a leading part of it.
Horticultural output has exceeded foodgrain output since 2012–13 and reached about 371 million tonnes in 2024–25 against about 358 million tonnes of foodgrains, from a much smaller area. Horticulture yields several times more value per hectare than cereals, absorbs more labour, and responds to rising demand from higher incomes and urbanisation, as Engel's law predicts. India is the second-largest producer of fruits and vegetables. The Mission for Integrated Development of Horticulture (2014–15) supports it.
Within diversification, livestock and fisheries have grown even faster, and together these high-value segments explain most of agricultural growth after 2004.
Constraints: perishability, weak cold chains, price crashes in onion and tomato, and poor market access for small growers. With storage, processing and FPOs, horticulture can drive both farm growth and rural incomes.
Example 35 (UPSC 2018, 10 marks): Explain why the use of organic farming should be encouraged in India.
Paper and question: Paper II, Q5(d)
Approach: Define organic farming, give the ecological, health, economic and export reasons to encourage it with Indian schemes and examples, and add a short caution about yields and transition.
Organic farming is a system that avoids synthetic fertilisers and pesticides and relies on crop rotation, compost, green manure and biological pest control to maintain soil health.
Reasons to encourage it: (1) Ecology: decades of imbalanced urea use and pesticides have degraded soils and polluted water; organic methods restore soil organic carbon and biodiversity. (2) Health: lower pesticide residues for consumers and farm workers. (3) Economics: lower input costs suit small and rainfed farmers, who already use few chemicals, and organic produce fetches premium prices. (4) Exports: global demand is rising, and India has the largest number of organic producers in the world.
India supports it through Paramparagat Krishi Vikas Yojana (2015), the Mission Organic Value Chain Development for the North Eastern Region, and the National Mission on Natural Farming (2024). Sikkim became fully organic in 2016.
However, yields can fall during transition, as Sri Lanka's abrupt switch in 2021 showed, so a gradual, region-specific shift with certification and market support is needed.
Example 36 (UPSC 2017, 15 marks): Even though India is self-sufficient in the production of foodgrains, Indian agriculture is faced with some major challenges. Elucidate.
Paper and question: Paper II, Q6(c)
Approach: Acknowledge foodgrain self-sufficiency with data, then elucidate the major challenges (productivity, resources, holdings, incomes, nutrition and imports, markets, climate), ending with a way forward.
India moved from 'ship-to-mouth' dependence in the 1960s to record foodgrain output of about 275 million tonnes in 2016–17, with large public stocks and rice exports. Yet self-sufficiency in grain hides deep problems.
(1) Low productivity: yields of rice, wheat and pulses are well below those of China and other leaders. (2) Small holdings: average size fell to 1.08 hectares (Agriculture Census 2015–16), limiting mechanisation and credit. (3) Water and soil stress: over half the cropped area is rainfed, groundwater is over-exploited in the north-west, and imbalanced fertiliser use degrades soils. (4) Low farm incomes and distress: incomes lag non-farm incomes, and farmer suicides continue. (5) Imbalanced self-sufficiency: India imports a large part of its edible oil and some pulses, so nutritional security is weaker than grain security. (6) Market and price problems: restrictive APMC markets, volatile prices and post-harvest losses. (7) Climate change, with more frequent droughts, floods and heat waves. (8) Disguised unemployment: agriculture still employs about half the workforce for a much smaller share of GVA.
The way forward lies in raising productivity through research and irrigation, crop diversification, market reform, and doubling farmers' incomes as the Dalwai Committee (2016–18) proposed.
Example 37 (UPSC 2015, 15 marks): What is your opinion on the view that the economic reform process has largely bypassed agriculture?
Paper and question: Paper II, Q6(a)
Approach: Agree largely: show that 1991 reforms targeted industry, trade and finance while agricultural institutions and investment were neglected, then note the indirect gains and later reforms, and conclude with a balanced view.
The view has considerable merit. The economic reforms of 1991 focused on industrial delicensing, trade liberalisation, the exchange rate, the financial sector and fiscal correction; agriculture had no comparable reform package.
Why reforms bypassed agriculture: (1) Core institutions stayed unreformed for long: APMC Acts, the Essential Commodities Act, restrictions on land leasing and on private trade and storage. (2) Fiscal correction cut public investment in irrigation and research, while subsidies kept rising. (3) Growth slowed to about 2% a year in 1997–2004, while non-agriculture grew fast, widening the income gap. (4) Rural credit stagnated in the 1990s as banks cut rural branches and priority lending fell short. (5) The workforce shift out of agriculture was slow.
Indirect effects and later reforms: the reforms did help agriculture indirectly: devaluation and lower industrial protection improved the terms of trade for agriculture in the 1990s, and the WTO opened export markets. In the 2000s the Model APMC Act (2003), credit doubling (2004), NFSM and RKVY (2007) and later e-NAM (2016) followed.
On balance, agriculture was largely bypassed by the first generation of reforms; its own reforms came late, partially and through states, which explains the uneven growth since 1991.
Example 38 (UPSC 2015, 15 marks): Agro-based industries, especially food-processing units, can alter the fate of rural India. Discuss.
Paper and question: Paper II, Q7(c)
Approach: Explain how agro-based and food-processing units transform rural economies (employment, value addition, prices, women, non-farm income) with Indian examples, then state the conditions needed for this to happen.
Agro-based industries use farm, livestock, forest or fishery produce as raw material: food processing, dairy, sugar, cotton ginning, jute, edible oil, leather. Located near farms, they can change the fate of rural India.
How: (1) Employment: they are labour-intensive and absorb surplus rural labour into non-farm work, easing disguised unemployment. (2) Value addition: processing raises the value of produce several times and keeps more of it in villages. (3) Better prices and lower losses: assured demand from processors stabilises farm prices and cuts post-harvest losses. (4) Diversification: demand for fruits, vegetables, milk and fish encourages high-value farming. (5) Women and self-help groups find work in small processing units. (6) Backward and forward linkages create rural transport, storage and services.
Examples: Amul's cooperative dairy model in Gujarat raised incomes of millions of small producers and drove Operation Flood; the cooperative sugar factories of Maharashtra built rural schools, credit and roads.
Conditions: rural infrastructure (roads, power, cold chains), credit for micro units, quality standards, farmer collectives to bargain with processors, and stable trade policy. Without these, units concentrate near cities and farmers gain little.
With such support, agro-processing can become the bridge between agriculture and industry that rural India needs.
Mains points
- WTO questions recur every few years: examiners reward the three pillars of the AoA with the boxes, the 10% de minimis limit, the 1986–88 external reference price problem and the peace clause (Bali 2013, invoked by India in 2020).
- Subsidy questions want a classification (explicit vs implicit, input vs output, Centre vs state) with figures and years, and the Fan-Gulati-Thorat (2008) finding that public investment beats input subsidies.
- MSP and procurement answers score when they name the CACP, the 2018 rule of MSP at least 1.5 times A2+FL, the Shanta Kumar Committee (2015) and the distortions: cereal bias, groundwater loss and regional concentration.
- PDS questions expect TPDS (1997) to NFSA (2013) to PMGKAY and ONORC, with leakage estimates attributed to their authors and reforms such as DBT pilots and end-to-end computerisation.
- Growth and investment questions reward phases of growth with data, the crowding-in debate, diversification into horticulture and livestock, and a way forward on value chains and food processing.
Did you know?
- Since 2012–13 India's horticulture output has been larger than its foodgrain output: in 2024–25 it was about 371 million tonnes against about 358 million tonnes of foodgrains.
Economics Optional: All chapters
- Exam Pattern, Syllabus and Strategy
- Price Determination and Theories of Distribution
- Market Structures
- Welfare Economics
- Theories of Employment, Income and Interest
- Money and Monetary Management
- Public Finance
- Theories of International Trade
- Trade Policy, Protection and the WTO
- Balance of Payments and Exchange Rates
- Theories of Growth
- Economic Development
- Indian Economy in the Pre-Independence Era
- Planning in India
- Agriculture before Liberalisation
- Industry before Liberalisation
- National Income, Poverty and Inequality
- Agriculture after Liberalisation
- Industry after Liberalisation
- External Sector after Liberalisation
- Public Finance and Fiscal Federalism in India
- Monetary System and the RBI
- Employment, Wages and Poverty Alleviation