
Economics Optional · UPSC Notes
Employment, Wages and Poverty Alleviation — UPSC Economics Optional Notes
Free, exam-focused notes for UPSC Prelims and Mains, with Prelims tips and Mains points for every topic. 4 topics.
Open in the interactive reader: bookmarks, progress tracking and read-aloud.
Employment and Unemployment in India
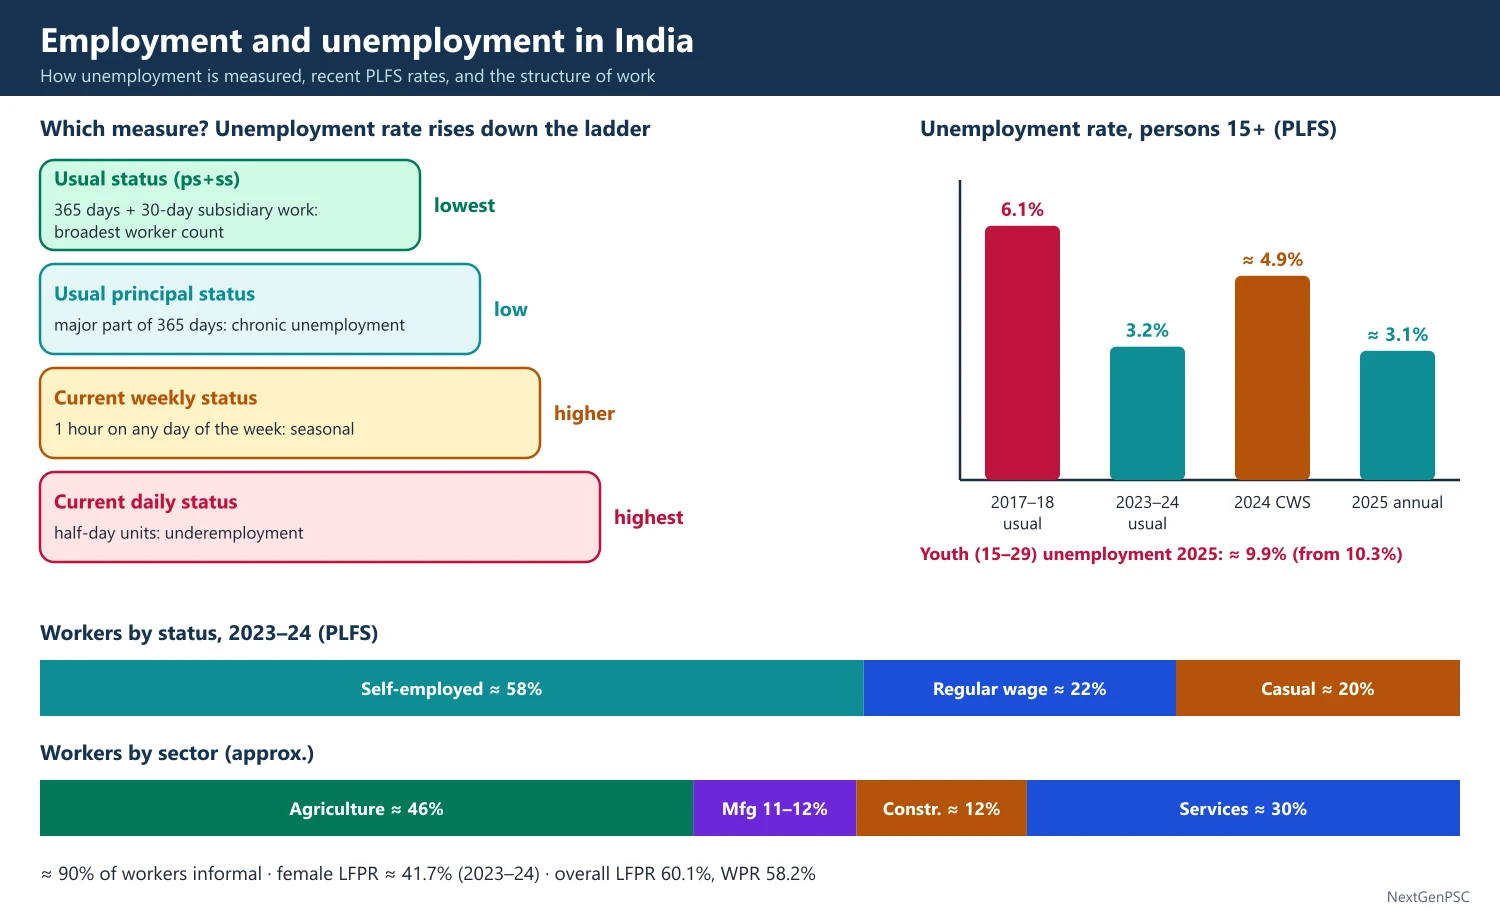
India measures employment through the Periodic Labour Force Survey (PLFS, from 2017–18), using usual status and current weekly status. Open unemployment is low (about 3% on usual status in 2023–24 and 2025) but the real problems are underemployment, low-quality informal work, low female participation and high youth unemployment. Debate continues over whether growth has been 'jobless'.
In simple words
Unemployment means people who want work and are looking for it cannot find it.
In India few people are fully idle, because the poor cannot afford to be; instead many do low-paid, part-time or family work, like five people sharing a farm that needs three.
So the key issues are poor job quality, too few women working and many educated youth without jobs, measured by the PLFS survey.
UPSC asks about measurement, trends, jobless growth and policy.
1. Concepts and Measures
Labour force: persons working or seeking/available for work; LFPR = labour force / population; WPR = workers / population; UR = unemployed / labour force.
Usual principal status (UPS): activity status for the major part of the 365 days before the survey.
Usual status (ps+ss): adds those who worked in a subsidiary capacity for at least 30 days; this gives the broadest measure of workers and the lowest unemployment rate.
Current weekly status (CWS): a person is employed if he or she worked for at least one hour on any day of the reference week; captures seasonal unemployment.
Current daily status (CDS): measures person-days of unemployment in the week (half-day units); best for capturing underemployment, so it gives the highest unemployment rate.
Types: open, disguised (Nurkse; zero marginal product in agriculture), seasonal, structural, frictional, educated unemployment and underemployment (visible and invisible).
Committees: the Dantwala Committee (1970) recommended presenting labour force data by several measures rather than a single number; the Bhagwati Committee on Unemployment (1973) reviewed employment policy; the Task Force on Employment Opportunities (Montek Singh Ahluwalia, 2001) and the S.P. Gupta Special Group (2002) set job targets for the Tenth Plan.
2. Data Sources
NSS Employment-Unemployment Surveys: quinquennial rounds from 1972–73 to 2011–12 (68th round).
PLFS (from 2017–18): annual estimates for rural and urban areas and quarterly urban CWS estimates; from January 2025 the design was revamped to give monthly CWS estimates (first monthly bulletin for April 2025) and a calendar-year annual report.
Other sources: EPFO payroll data, the Annual Survey of Industries, the Annual Survey of Unincorporated Sector Enterprises (ASUSE), the RBI's KLEMS database and private CMIE surveys (methods differ).
3. Trends
2017–18 shock: PLFS 2017–18 showed an unemployment rate of 6.1% (usual status), described in media as a 45-year high, though comparability with NSS rounds was debated; female LFPR fell to about 23%.
PLFS 2023–24 (July–June, usual status, age 15 and above): LFPR 60.1%, WPR 58.2%, unemployment rate 3.2%; female LFPR rose to about 41.7%, driven mostly by rural self-employment.
PLFS 2024 (calendar year, CWS): unemployment rate of about 4.9% for persons aged 15 and above (4.2% rural, 6.7% urban).
PLFS 2025 annual report (March 2026, first calendar-year report on the new design): unemployment for persons aged 15 and above of about 3.1% (rural about 2.4%, urban about 4.8%); youth (15–29) unemployment fell to about 9.9% from 10.3%.
Youth and educated unemployment: unemployment is highest among educated urban youth, especially graduates, reflecting skill mismatches and a preference for formal jobs.
4. Structure of Employment
Status: in 2023–24 about 58% of workers were self-employed (including unpaid family helpers), about 22% regular wage/salaried and about 20% casual labourers (PLFS).
Sector: agriculture still employs about 46% of workers, manufacturing about 11–12%, construction about 12% and services about 30%; the shift out of agriculture reversed temporarily during COVID-19.
Informality: about 90% of workers are informal; the NCEUS (Arjun Sengupta, 2007) found 77% of the population living on less than ₹20 a day in 2004–05 and most workers lacking social security.
Regular jobs without contracts: over half of regular wage workers have no written contract or social security benefits (PLFS).
Gig and platform work: NITI Aayog (2022) estimated about 77 lakh gig workers in 2020–21, projected to reach about 2.35 crore by 2029–30; the Code on Social Security (2020) recognises gig and platform workers.
e-Shram portal (August 2021): a national database of unorganised workers, with over 30 crore registrations.
5. Jobless Growth Debate
Evidence for: NSS data showed total employment almost stagnant between 2004–05 and 2011–12 despite about 8% growth; employment elasticity fell sharply (Mehrotra and others; Himanshu); manufacturing created few jobs.
Evidence against: part of the fall reflected women and youth leaving the labour force to study; RBI KLEMS data suggest employment grew faster after 2017–18, reaching over 64 crore in 2023–24; critics reply that much of the rise is low-quality self-employment and unpaid family work.
Causes of weak job creation: capital- and skill-intensive growth, rigid labour laws (debated), small firm size, weak labour-intensive manufacturing, and automation.
Female participation: India's female LFPR is low by global standards because of social norms, care work, lack of safe transport and suitable jobs (Goldin's U-shaped curve suggests it falls then rises with development).
6. Labour Market Reforms
Labour Codes: the Code on Wages (2019), Industrial Relations Code (2020), Code on Social Security (2020) and Occupational Safety, Health and Working Conditions Code (2020) replaced 29 central laws and came into force on 21 November 2025, with central rules notified in 2026.
Key changes: a statutory national floor wage, a uniform definition of wages, higher thresholds for prior approval of layoffs (from 100 to 300 workers), fixed-term employment, and social security for gig and platform workers.
Critiques: unions argue the codes weaken job security and the right to strike; employers welcome flexibility; outcomes depend on state rules.
Employment schemes: the Employment Linked Incentive scheme, renamed PM Viksit Bharat Rozgar Yojana, has an outlay of ₹99,446 crore to support more than 3.5 crore jobs created between 1 August 2025 and 31 July 2027.
7. Diagrams to Draw
Lewis model: draw the industrial sector's marginal product of labour curve and a horizontal labour supply at the subsistence wage; as capital accumulates, the MPL curve shifts right and employment expands until the turning point where labour supply turns upward.
Harris-Todaro model (1970): draw the urban and rural labour demand curves facing each other; migration continues until the expected urban wage (wage × probability of a job) equals the rural wage, explaining urban unemployment.
Measurement ladder: draw a bar chart showing UR by UPS, usual status (ps+ss), CWS and CDS, rising in that order, to show why the measure matters.
Kerala and Bihar examples: Kerala has high educated unemployment and large emigration to the Gulf, while Bihar has low measured unemployment but very low wages and heavy out-migration, showing that the unemployment rate alone misleads.
China comparison: China moved hundreds of millions of workers from farms to export factories in 1980–2010; India's slower shift explains why agriculture still holds almost half of its workers.
Bangladesh garments: labour-intensive garment exports drew millions of women into factory work, a model often cited for raising India's female participation.
8. Using It in the Exam
10-mark answer: define the measures, give the latest PLFS figures with year and basis, and name two structural problems.
15/20-mark answer: add trends since 2004–05, structure and informality, the jobless growth debate with both sides, female LFPR, labour codes and schemes, with the Lewis or Harris-Todaro diagram.
Keywords: UPS, ps+ss, CWS, CDS, disguised unemployment, informality, employment elasticity, female LFPR, labour codes, ELI.
Quotable line: the NCEUS finding that most Indian workers are informal and lack social security (Arjun Sengupta, 2007, paraphrased).
| Measure | Reference period | Captures | Unemployment rate |
|---|---|---|---|
| Usual principal status | 365 days, major time | Chronic unemployment | Low |
| Usual status (ps+ss) | 365 days plus 30-day subsidiary work | Broadest worker count | Lowest |
| Current weekly status | 7 days, at least one hour | Seasonal unemployment | Higher |
| Current daily status | Each day of the week, half-day units | Underemployment | Highest |
| Survey | Basis | LFPR | Unemployment rate |
|---|---|---|---|
| PLFS 2017–18 | Usual status | About 49.8% | 6.1% |
| PLFS 2023–24 | Usual status | 60.1% | 3.2% |
| PLFS 2024 (calendar year) | CWS | About 56% | About 4.9% |
| PLFS 2025 (calendar year) | As per MoSPI annual report (March 2026) | About 59% | About 3.1% |
Mains points
- Explain UPS, ps+ss, CWS and CDS and why the measure changes the unemployment rate.
- Quote PLFS figures with year and basis; do not mix usual status and CWS numbers.
- Stress quality of jobs: informality, self-employment, low female LFPR and youth unemployment.
- Present both sides of the jobless growth debate with sources (NSS, PLFS, RBI KLEMS).
- Bring in the Labour Codes (in force 21 November 2025) and PM-VBRY for current relevance.
- Common mistake: treating low open unemployment as proof of a healthy labour market.
Did you know?
- Memory trick for measures: 'Year, Week, Day' — usual status (year) gives the lowest rate and daily status (day) the highest.
Rural Wages and Employment Generation
Rural wages depend on farm productivity, non-farm demand (especially construction), public works and migration. Real rural wages rose quickly in 2007–14, helped by MGNREGA and a construction boom, but grew slowly or stagnated after about 2014–15 (Labour Bureau data, debated). Employment generation policy combines self-employment credit (PMEGP, MUDRA), skilling (PMKVY, DDU-GKY), wage employment and newer incentives such as the ELI scheme (2025).
In simple words
Rural wages are what farm and non-farm labourers in villages earn for a day's work.
They rise when there is more work than workers, as when a building boom or a public works scheme pulls labour away from farms.
Higher real wages cut poverty, so government tries to create jobs through loans for small businesses, skills training and guaranteed public works.
UPSC asks about trends in rural wages, their causes and job creation schemes.
1. Concepts
Nominal vs real wage: real wage = nominal wage / price index (CPI-Agricultural Labourers or CPI-Rural Labourers); only real wages show changes in living standards.
Data sources: the Labour Bureau's Wage Rates in Rural India (WRRI) monthly series by occupation and state, PLFS earnings data and the RBI's Handbook of Statistics on Indian States.
Rural labour markets: segmented by caste, gender and season; casual labour is paid daily; tied labour and interlinked credit-labour contracts persist in some regions (Bardhan, Rudra).
Gender wage gap: women's rural casual wages are well below men's, a gap partly narrowed by MGNREGA's equal wages.
2. Determinants of Rural Wages
Agricultural productivity: Green Revolution areas (Punjab, Haryana) have higher wages; higher crop prices and yields raise demand for labour.
Non-farm demand: construction, transport and services in nearby towns pull labour out of farming; construction was the largest absorber of rural workers after 2004.
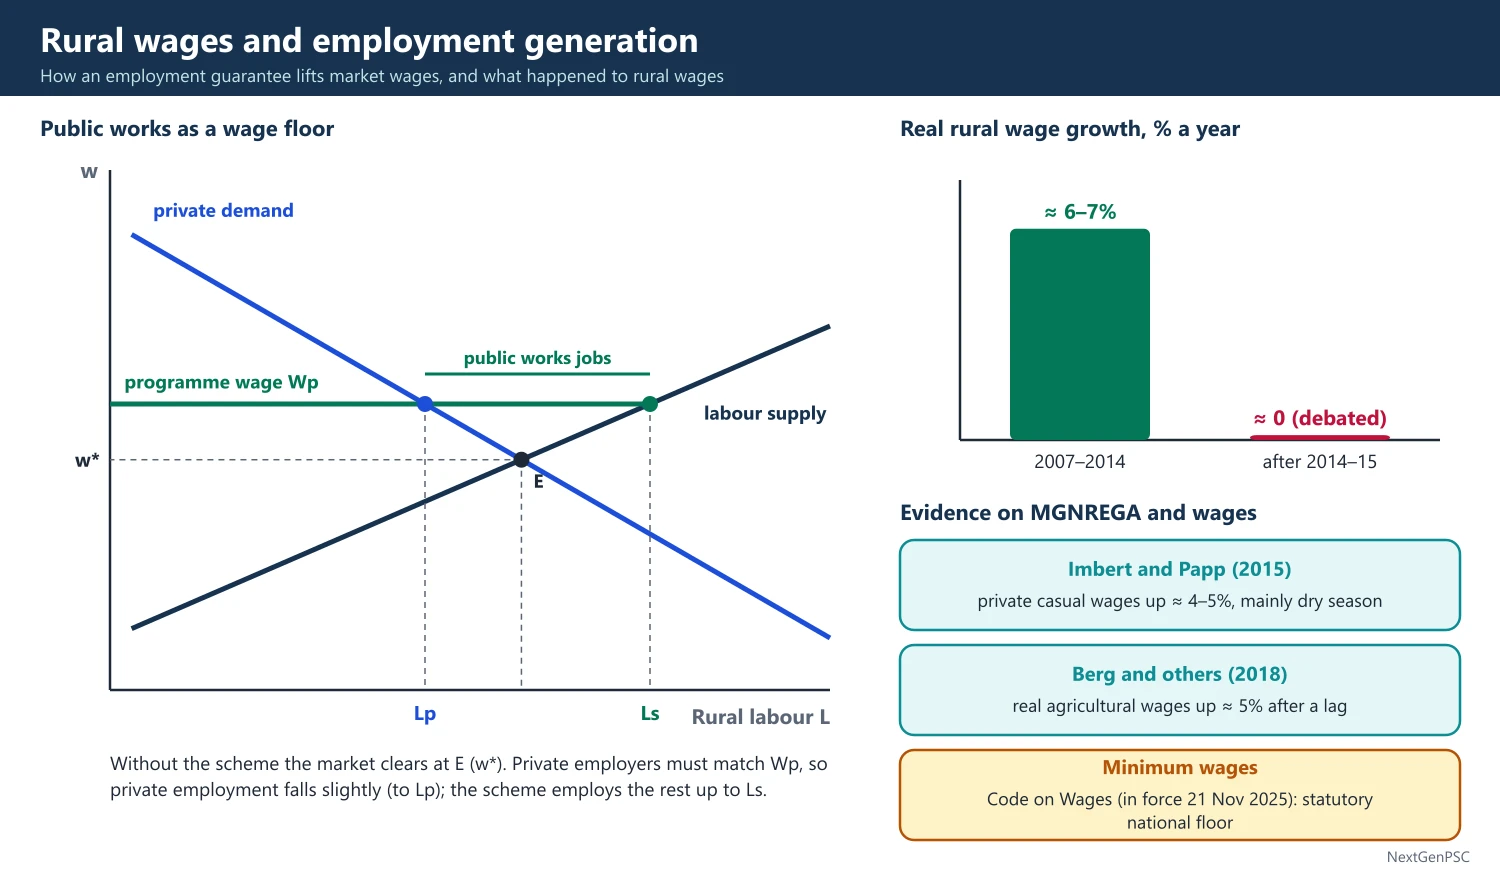
Public works: employment guarantee schemes set an effective wage floor and raise workers' bargaining power.
Migration and remittances: seasonal migration from Bihar, Uttar Pradesh and Odisha reduces local labour supply and raises wages.
Mechanisation: tractors, harvesters and herbicides reduce labour demand, especially for women.
Lewis turning point: when surplus labour is absorbed, wages rise above subsistence; some economists argued India neared this point around 2010, but later stagnation casts doubt (debated).
3. Trends in Real Rural Wages
1980s–1990s: real agricultural wages grew moderately in the 1980s and slowed in the 1990s.
2007–2014 surge: real rural wages grew about 6–7% a year, driven by high growth, the construction boom, rising farm prices and MGNREGA (Gulati, Jain and Satija, 2013, and others).
After 2014–15: Labour Bureau data show real rural wage growth close to zero or slightly negative for several years, reflecting low farm prices, demonetisation, the COVID-19 shock and an increase in labour supply; some analysts using other deflators find small positive growth, so the trend is debated.
Implications: stagnant real wages alongside high GDP growth point to weak labour demand and help explain weak rural consumption in parts of the 2010s.
4. Evidence on Public Works and Wages
Imbert and Papp (2015): found that MGNREGA raised private sector casual wages by about 4–5% in early-phase districts, mainly in the dry season.
Berg and others (2018): estimated MGNREGA raised real agricultural wages by about 5% after a lag.
Muralidharan, Niehaus and Sukhtankar (2016, 2023): found that biometric smartcard payments in Andhra Pradesh reduced leakage and that better-implemented NREGS raised market wages and earnings, with general equilibrium effects.
Critics: some farmers argue that higher wages raised farm costs and caused labour shortages at peak seasons, an argument used for the 60-day agricultural pause in the 2025 Act.
5. Minimum Wages
Minimum Wages Act, 1948: states set scheduled minimum wages, with hundreds of rates and weak enforcement for casual workers.
National Floor Level Minimum Wage: a non-statutory benchmark (₹176 a day from 2017, ₹178 from 2019).
Code on Wages, 2019: in force from 21 November 2025, it makes a national floor wage statutory and requires state minimum wages to be at least that floor, covering all workers.
Debate: minimum wages raise incomes but may reduce formal hiring in low-productivity firms; evidence from India and elsewhere (Card and Krueger, 1994, for the US) suggests modest employment effects.
6. Rural Non-farm Employment and Job Creation
RNFE growth: the share of non-farm work in rural employment rose from about a fifth in the early 1990s to over a third by the 2010s, led by construction, trade and transport.
PMEGP (2008): the Prime Minister's Employment Generation Programme, formed by merging PMRY (1993) and REGP (1995), gives credit-linked subsidies for micro enterprises through KVIC.
MUDRA (April 2015): collateral-free loans up to ₹10 lakh (limit raised to ₹20 lakh in Budget 2024–25 for borrowers who repaid earlier loans) in Shishu, Kishore and Tarun categories.
Skilling: Skill India Mission (2015), Pradhan Mantri Kaushal Vikas Yojana (2015) and Deen Dayal Upadhyaya Grameen Kaushalya Yojana (2014) for rural youth placement; outcomes have been mixed, with low placement rates in several evaluations.
Budget 2024–25 package: a ₹2 lakh crore package for employment and skilling over five years, including employment-linked incentives and an internship scheme for one crore youth in top companies.
PM Viksit Bharat Rozgar Yojana (2025): approved by the Cabinet on 1 July 2025 with ₹99,446 crore; Part A pays first-time employees up to one month's wage (up to ₹15,000) in instalments and Part B pays employers for additional hires over two years; jobs created between 1 August 2025 and 31 July 2027 qualify.
Rural livelihoods: DAY-NRLM self-help groups and the 'Lakhpati Didi' target of three crore women earning at least ₹1 lakh a year support rural self-employment.
7. Diagrams to Draw
Rural labour market with public works: draw labour demand and supply; public works add a perfectly elastic segment at the programme wage Wp above the market wage; private employers must pay at least Wp, so the wage rises and private employment falls slightly.
Monopsony and minimum wage: draw an upward-sloping labour supply, a steeper marginal cost of labour and the MRP curve; a minimum wage between the monopsony wage and the competitive wage raises both wages and employment.
Real wage trend chart: draw real rural wage growth from 2000 to 2025, peaking around 2010–14 and flattening after 2015.
8. Theory and Debates
Lewis vs neoclassical: Lewis predicts constant wages until surplus labour ends; Schultz (1964) argued that marginal product in agriculture is not zero, so withdrawing labour lowers output.
Efficiency wage theory: Leibenstein and later Dasgupta and Ray (1986) linked nutrition and productivity, explaining why wages may not fall to market-clearing levels.
Feminisation of agriculture: as men migrate, women do more farm work but at lower wages and with little land ownership.
9. Using It in the Exam
10-mark answer: give determinants of rural wages, the 2007–14 surge and post-2014 stagnation, and two schemes.
15/20-mark answer: add evidence on MGNREGA and wages (Imbert-Papp, Muralidharan and others), minimum wage reforms under the Code on Wages, RNFE and employment schemes including PM-VBRY, with the public works diagram.
Keywords: real wage, CPI-AL, Lewis turning point, wage floor, RNFE, PMEGP, MUDRA, PMKVY, ELI, monopsony.
Quotable line: Imbert and Papp's finding that the employment guarantee raised private casual wages in rural India (paraphrased).
| Programme | Year | Type | Key feature |
|---|---|---|---|
| PMEGP | 2008 | Self-employment | Credit-linked subsidy via KVIC |
| DDU-GKY | 2014 | Skilling | Placement-linked training for rural youth |
| PMKVY | 2015 | Skilling | Short-term training and certification |
| MUDRA | 2015 | Self-employment credit | Collateral-free loans in three tiers |
| PM Viksit Bharat Rozgar Yojana | 2025 | Employment-linked incentive | ₹99,446 crore; over 3.5 crore jobs targeted |
Mains points
- Always speak of real wages and name the deflator (CPI-AL or CPI-RL).
- Explain the 2007–14 surge and post-2014 stagnation with causes, and mark the stagnation claim as debated.
- Use evidence on MGNREGA and wages (Imbert-Papp 2015; Muralidharan, Niehaus and Sukhtankar).
- Link the Code on Wages' statutory floor wage to minimum wage enforcement.
- Cover job creation schemes with dates and outlays, including PM-VBRY (2025).
- Common mistake: treating higher nominal wages as better living standards without adjusting for inflation.
Did you know?
- Construction absorbed more rural workers leaving farming after 2004 than manufacturing did, making the building site, not the factory, India's main exit from agriculture.
Poverty Alleviation Schemes and Rural Employment Guarantee
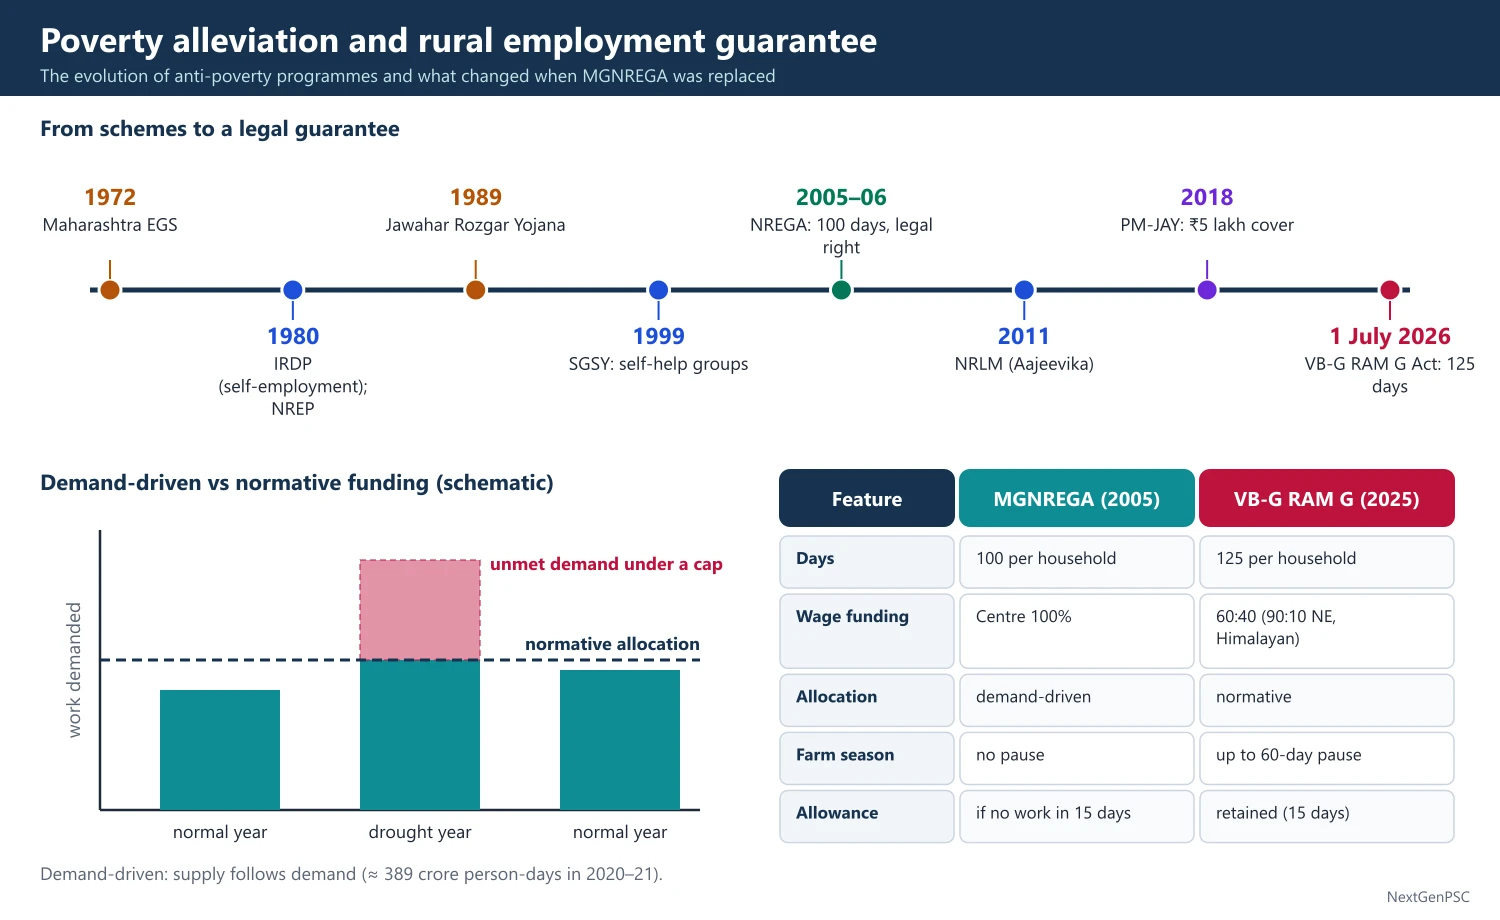
India's anti-poverty strategy combines growth with direct programmes: self-employment (IRDP 1980, SGSY 1999, NRLM 2011), wage employment (NREP 1980 to MGNREGA 2005), and social security and basic services. MGNREGA gave a legal right to 100 days of work from 2006. From 1 July 2026 it was replaced by the VB-G RAM G Act, 2025, which guarantees 125 days but shifts to normative funding, 60:40 cost sharing and a 60-day agricultural pause.
In simple words
Poverty alleviation schemes help poor families earn more or get basic needs directly: loans for small businesses, guaranteed work, food, housing and pensions.
MGNREGA worked like an insurance policy: any rural adult could ask for manual work and the state had to provide it within 15 days.
In 2025 Parliament replaced it with a new law that promises 125 days but changes how money is shared and when work is offered.
UPSC asks you to evaluate these schemes, especially the rural employment guarantee and its replacement.
1. Approaches to Poverty Alleviation
Trickle-down: the early Plans relied on growth to reduce poverty; slow growth and persistent poverty led to a shift in the 1970s.
Direct attack: 'Garibi Hatao' (1971) and the Fifth Plan (1974–79) introduced targeted programmes and the Minimum Needs Programme (1974) for basic services.
Three pillars: self-employment (asset creation for the poor), wage employment (public works), and social security and basic services (food, housing, health, pensions).
Rights-based approach: from the 2000s, laws created entitlements: NREGA (2005), RTE (2009), NFSA (2013).
DBT and JAM: since 2013 and especially after 2015, direct benefit transfers through Jan Dhan, Aadhaar and Mobile have reduced leakages.
2. Self-employment Programmes
IRDP: the Integrated Rural Development Programme (pilot 1978–79, nationwide from 2 October 1980) gave subsidised loans to buy assets such as milch cattle; evaluations found poor targeting, low-quality assets and high default.
Allied schemes: TRYSEM (1979) for youth training and DWCRA (1982) for women's groups.
SGSY (April 1999): Swarnjayanti Gram Swarozgar Yojana merged IRDP and allied schemes and focused on self-help groups and clusters.
NRLM / Aajeevika (June 2011): following the Radhakrishna Committee (2009), it built a professional support structure for women's SHGs and federations; renamed DAY-NRLM (2016); about 10 crore women are members of SHGs.
Urban: SJSRY (1997) was replaced by NULM (2013), now DAY-NULM; PM SVANidhi (2020) gives working capital loans to street vendors.
3. Wage Employment Programmes before MGNREGA
Maharashtra Employment Guarantee Scheme (1972–73, Act of 1977): introduced during a drought, inspired by V.S. Page, the model for a national guarantee.
Central programmes: Food for Work (1977), NREP (1980), RLEGP (1983), Jawahar Rozgar Yojana (1989), Employment Assurance Scheme (1993), JGSY (1999), SGRY (2001) and the National Food for Work Programme (November 2004).
Limitations: these were budget-limited schemes with no legal right, weak targeting, contractors and leakages.
4. MGNREGA: Design and History
Enactment: the National Rural Employment Guarantee Act was passed in August 2005 and notified on 7 September 2005; it began on 2 February 2006 in 200 districts, extended to 130 more in 2007–08 and to all rural districts from 1 April 2008; renamed MGNREGA on 2 October 2009.
Entitlement: at least 100 days of unskilled manual work a year per rural household whose adult members volunteer; work within 15 days of demand or an unemployment allowance paid by the state; work within 5 km of residence.
Design features: at least one-third of workers women; equal wages for men and women; no contractors or labour-displacing machines; a 60:40 wage-material ratio at the district level; worksite facilities; wages paid into bank or post office accounts.
Funding: the Centre paid 100% of unskilled wages and 75% of material and skilled wages; states paid 25% of material costs and the unemployment allowance; the scheme was demand-driven, so spending rose in bad years (about 389 crore person-days in 2020–21 during COVID-19).
Governance: Gram Sabhas planned works and carried out social audits (pioneered in Andhra Pradesh); the MKSS movement in Rajasthan shaped transparency.
Achievements: provided work to about 5–7 crore households a year, women's share of person-days above half, raised rural wages, smoothed consumption during droughts and created assets like ponds and farm bunds.
Problems: payment delays (the Supreme Court in Swaraj Abhiyan vs Union of India, 2016, ordered timely payment), wages below state minimum wages in many states, rationing of work when funds ran short, deletion of job cards, and mandatory Aadhaar-based payment from January 2024.
5. The VB-G RAM G Act, 2025
Name and passage: the Viksit Bharat – Guarantee for Rozgar and Ajeevika Mission (Gramin) Act, 2025 was passed by Parliament in December 2025 and received the President's assent the same month.
Commencement: the government notified on 11 May 2026 that the Act would come into force across India from 1 July 2026, the date MGNREGA, 2005 stood repealed; ongoing works and e-KYC-verified job cards continued.
Guarantee: 125 days of unskilled manual work per rural household per financial year, up from 100; unemployment allowance if work is not provided within 15 days.
Agricultural pause: states may notify periods adding up to 60 days during peak sowing and harvesting when works are suspended, to keep farm labour available; work is guaranteed in the rest of the year.
Funding: a centrally sponsored scheme with 60:40 Centre-state sharing (90:10 for north-eastern and Himalayan states and full central funding for Union Territories without legislatures); central allocations to states are normative, based on objective parameters, rather than open-ended demand.
Works: four priority areas: water security, core rural infrastructure, livelihood infrastructure and climate resilience; planned through Viksit Gram Panchayat Plans linked to PM Gati Shakti, with Gram Panchayats implementing at least half the works by cost.
Monitoring: social audits at least every six months, biometric attendance, geo-tagging and digital dashboards; administrative expenses raised from 6% to 9%.
Supporters' view: more days, predictable budgeting, better assets, convergence with infrastructure plans and protection of farm labour supply.
Critics' view: normative allocations and ceilings dilute a demand-driven legal right into a budget-capped scheme; states must now pay 40% of wages, straining their finances; a uniform 60-day pause may hurt landless workers in local lean seasons; digital systems risk exclusion; NREGA Sangharsh Morcha and several states argued that allocations are too small to fund 125 days.
6. Social Security and Basic Services
Pensions: the National Social Assistance Programme (1995) covers old-age, widow and disability pensions.
Housing: Indira Awaas Yojana (1985) became PMAY-Gramin (2016); PMAY-Urban (2015).
Health: Ayushman Bharat PM-JAY (September 2018) gives hospital cover of ₹5 lakh per family a year to about 12 crore families, extended in 2024 to all citizens aged 70 and above.
Basic services: Swachh Bharat (2014), Ujjwala LPG (2016), Saubhagya electrification (2017) and Jal Jeevan Mission (2019) improved MPI indicators.
Income support: PM-KISAN (2019) and state cash transfer schemes for women (e.g. Madhya Pradesh's Ladli Behna, 2023).
7. Diagrams to Draw
Self-targeting public works: draw a labour supply curve; only those whose reservation wage is below the programme wage join, so the scheme self-selects the poor (Besley and Coate, 1992).
Demand-driven vs normative funding: draw work demanded rising in a drought year; under demand-driven funding supply matches demand; under a normative cap, supply is fixed, leaving unmet demand shaded.
Scheme timeline: draw a line from 1972 (Maharashtra EGS) to 1980 (IRDP, NREP), 1989 (JRY), 1999 (SGSY), 2005 (NREGA), 2011 (NRLM) and 2025–26 (VB-G RAM G).
8. Theory and Debates
Targeting vs universality: self-targeting through manual work reduces errors compared with BPL lists.
Rights vs schemes: Drèze and others argue that legal rights create accountability; critics say rights without funding are hollow.
Cash vs in-kind vs work: the Economic Survey 2016–17 discussed a universal basic income as an alternative to many schemes; others prefer guaranteed work for its assets and self-targeting.
Asset quality: studies (IIM, IISc) found many MGNREGA water assets raised groundwater and yields, but quality varies.
9. Using It in the Exam
10-mark answer: list the three approaches with one scheme each and state MGNREGA's key features and its replacement from 1 July 2026.
15/20-mark answer: trace the evolution of self-employment and wage employment schemes, evaluate MGNREGA with evidence, compare it with the VB-G RAM G Act, and conclude on balancing rights, fiscal sustainability and asset creation.
Keywords: self-targeting, demand-driven guarantee, social audit, normative allocation, agricultural pause, SHG, convergence, DBT.
Quotable line: Drèze's view that the employment guarantee is a right that turns the state's duty into the worker's entitlement (paraphrased).
| Feature | MGNREGA (2005) | VB-G RAM G Act (2025, from 1 July 2026) |
|---|---|---|
| Days guaranteed | 100 per household | 125 per household |
| Funding of wages | Centre 100% of unskilled wages | 60:40 Centre-state (90:10 NE and Himalayan states) |
| Allocation | Demand-driven | Normative, based on objective parameters |
| Agricultural season | No pause | Up to 60 days pause notified by states |
| Works | Wide list of permissible works | Four priority areas linked to Viksit Gram Panchayat Plans |
| Unemployment allowance | If work not given in 15 days | Retained (15 days) |
| Type | Programmes (year) |
|---|---|
| Self-employment (rural) | IRDP (1980), TRYSEM (1979), DWCRA (1982), SGSY (1999), NRLM (2011), DAY-NRLM (2016) |
| Wage employment | Maharashtra EGS (1972), NREP (1980), RLEGP (1983), JRY (1989), EAS (1993), SGRY (2001), NREGA (2005), VB-G RAM G (2025) |
| Social security and services | NSAP (1995), PMAY-G (2016), PM-JAY (2018), Ujjwala (2016), NFSA (2013) |
Mains points
- Classify schemes into self-employment, wage employment and social security, with years.
- Give MGNREGA's history precisely: passed 2005, began 2 February 2006, all districts 2008, renamed 2009.
- Evaluate MGNREGA with evidence: wages, consumption smoothing, women's work, assets, and problems like payment delays.
- Compare MGNREGA with the VB-G RAM G Act (in force from 1 July 2026): 125 days, 60:40 funding, normative allocation, 60-day pause.
- Present both supporters' and critics' views of the new Act and conclude on fiscal federalism and the right to work.
- Common mistake: describing MGNREGA as still in force after 1 July 2026, or the new Act as simply a renaming.
Did you know?
- NREGA was launched on 2 February 2006 at Bandlapalli village in Anantapur district of Andhra Pradesh.
- Memory trick for the 2025 Act: '125–60–60:40' — 125 days, 60-day pause, 60:40 funding.
UPSC Previous Year Questions: Employment, Wages and Poverty Alleviation
From 2014 to 2026 UPSC asked 32 question parts worth 485 marks on employment, wages and poverty alleviation in Paper II. The most-asked area is poverty alleviation schemes and the rural employment guarantee (15 parts: MGNREGA, UBI, DBT, Dreze–Sen), followed by employment and unemployment (9 parts: jobless growth, casualisation, quality of jobs, demographic dividend) and rural wages and employment generation (8 parts). Every question below has a model answer written to the UPSC word limit.
In simple words
First read the question and write your own answer in the time UPSC gives: about 7 minutes for 10 marks and 10–12 minutes for 15 or 20 marks.
Then compare it with the model answer: did you quote PLFS data with its year, name the schemes with their launch years, and give a balanced judgement?
Note the points you missed and rewrite the answer once; doing this for every question is the fastest way to learn this chapter.
1. Employment and Unemployment in India
Example 1 (UPSC 2026, 20 marks): "Economic development without employment generation is meaningless." Give your views. Critically analyze the phenomenon of 'jobless growth' in India in post-reform period, and its impact on poverty and social sector outcomes.
Paper and question: Paper II, Q7(a)
Approach: Give your view on the quotation first, then define jobless growth and analyse its evidence and causes in the post-reform period with data, and finally trace its impact on poverty and social outcomes, ending with a way forward.
Development, in Amartya Sen's sense, is the expansion of people's capabilities; for most households in India the main route to it is a decent job. Growth that does not create work leaves incomes, dignity and human development behind, so the statement is largely valid, though growth still finances public services and transfers.
Jobless growth means output rising fast while employment grows slowly, a falling employment elasticity. NSS data show that between 2004–05 and 2011–12 GDP grew about 8% a year but employment grew under 0.5% a year, and PLFS 2017–18 recorded unemployment of 6.1%, the highest in decades.
Causes: (i) growth led by skill- and capital-intensive services (IT, finance) and capital-intensive industry; (ii) manufacturing stuck at about 11–12% of employment; (iii) rigid labour laws and small firm size; (iv) a skills mismatch; (v) withdrawal of women from the labour force until 2017–18.
Recent trends: PLFS shows unemployment falling to 3.2% in 2023–24 and 3.1% in 2025, but much of the new work is self-employment and unpaid family work in agriculture, whose share in employment rose to 46.1% in 2023–24; youth unemployment was still 9.9% in 2025.
Impact: poverty fell sharply (Tendulkar ratio 37.2% in 2004–05 to 21.9% in 2011–12; NITI Aayog MPI 29.2% in 2013–14 to 11.3% in 2022–23) mainly through transfers, rising rural wages and public programmes, not through good jobs. But informality keeps earnings low and volatile, limits social security, weakens women's empowerment and slows gains in nutrition and learning.
The way forward is labour-intensive manufacturing (textiles, food processing, electronics assembly), MSME credit, skills, urban jobs and women's participation, so that growth becomes employment-rich.
Example 2 (UPSC 2024, 15 marks): Whether the role of women in agriculture has changed after liberalisation in India? Comment.
Paper and question: Paper II, Q7(b)
Approach: Compare women's role in agriculture before and after 1991 using participation, type of work and ownership data, explain feminisation of agriculture and its causes, and comment on whether this is empowerment or distress.
Women have always been central to Indian farming in sowing, weeding, harvesting, livestock and post-harvest work. After liberalisation their role has changed in share and nature, a trend called the feminisation of agriculture (noted in the Economic Survey 2017–18).
What changed: (i) as men moved to construction and urban jobs, women came to form a growing share of the farm workforce; about three-quarters of rural women workers are in agriculture (PLFS 2023–24); (ii) female labour force participation first fell (rural women withdrew between 2004–05 and 2017–18, partly due to education and income effects) and then rose from 23.3% in 2017–18 to over 40% by 2023–24, mostly as self-employed helpers on family farms; (iii) women increasingly manage farms in migrant households and in dairying, and SHGs under DAY-NRLM (2011) have supported women farmer producer groups and the Mahila Kisan Sashaktikaran Pariyojana.
What has not changed: women operate only about 14% of holdings (Agriculture Census 2015–16), so they lack land titles, credit, insurance and extension; much of their work is unpaid and they earn lower wages than men.
So women's role has grown in extent but much of it reflects distress and male migration rather than empowerment; land rights, credit, women-friendly tools and recognition as farmers are needed.
Example 3 (UPSC 2023, 15 marks): Explain the reasons for sluggish growth in employment in India during the post-economic reform period.
Paper and question: Paper II, Q8(b)
Approach: Show the slow growth of employment after 1991 with NSS/PLFS evidence, then explain the structural, technological, institutional and supply-side reasons, and end with remedies.
Employment in India grew far more slowly than output after 1991: the employment elasticity of growth fell from about 0.4 in the 1980s to near zero in 2004–05 to 2011–12, when GDP grew around 8% a year (NSS data), and unemployment reached 6.1% in 2017–18 (PLFS).
Reasons: (i) structure of growth: services such as IT, telecom and finance led growth but need few, highly skilled workers; (ii) manufacturing failed to absorb labour, its employment share staying around 11–12%, and organised industry chose capital-intensive techniques; (iii) labour laws such as Chapter V-B of the Industrial Disputes Act, 1947 discouraged firms from growing beyond 100 workers, so firms stayed small or used contract labour; (iv) skill mismatch: only about 2% of workers had formal vocational training (NSS 2011–12); (v) agricultural growth slowed and became less labour-absorbing with mechanisation; (vi) public sector hiring fell after 1991; (vii) infrastructure and credit bottlenecks for MSMEs; (viii) women's low participation.
Recent PLFS rounds show lower unemployment (3.2% in 2023–24) but mostly in self-employment and agriculture. Remedies include labour-intensive manufacturing, the four labour codes (in force from November 2025), MSME credit, skilling and urban employment.
Example 4 (UPSC 2021, 15 marks): How does the New Economic Policy change the structure of employment in India? Evaluate.
Paper and question: Paper II, Q8(c)
Approach: Evaluate how the post-1991 reforms changed the sectoral structure, employment status and formality of jobs, using NSS and PLFS data, and give a balanced evaluation.
The New Economic Policy of 1991 (liberalisation, privatisation, globalisation) changed the composition of output quickly, but the structure of employment changed slowly and in an unusual way.
Sectoral shift: agriculture's share of employment fell from about 65% in 1993–94 to about 49% in 2011–12 and 42.5% in 2018–19 (NSS, PLFS), but workers moved mainly into construction (from about 3% to over 10%) and low-end services such as trade and transport, not into manufacturing, whose share stayed around 11–12%. India skipped the manufacturing stage that East Asia followed. During and after COVID-19 agriculture's share rose again, to 46.1% in 2023–24.
Status of employment: regular salaried jobs rose from about 14% (1993–94) to about 22% (2023–24), helped by IT, finance and modern services; casual work fell to 19.8%, while self-employment remains the largest category at 58.4% (PLFS 2023–24).
Formality: growth of contract labour in organised firms, a shrinking public sector and the growth of gig and platform work (about 77 lakh gig workers in 2020–21, NITI Aayog 2022) mean that over 90% of workers remain informal.
Evaluation: reforms created high-productivity jobs for the skilled and raised real wages, but did not generate mass manufacturing employment; labour codes, skilling and labour-intensive exports are needed to complete the structural transformation.
Example 5 (UPSC 2019, 15 marks): Examine the relation between casualisation of employment and poverty in India.
Paper and question: Paper II, Q8(c)
Approach: Define casualisation, show its trend, explain the two-way links with poverty (low and irregular earnings, no social security; poverty forcing casual work), and suggest measures.
Casualisation is the rise in the share of casual wage workers, who are hired by the day or task without contracts, regular pay or social security. Their share rose from about 28% in 1977–78 to about 33% by 1999–2000 (NSS) and then declined to 24.9% in 2017–18 and 19.8% in 2023–24 (PLFS), though contract work grew inside organised firms.
How casualisation causes poverty: (i) earnings are low: casual wages are well below regular salaries and below minimum wages in many states; (ii) work is irregular and seasonal, so annual income is uncertain; (iii) no paid leave, pension, health insurance or maternity benefit, so illness or a drought pushes households into debt; (iv) little scope for skill formation or promotion.
How poverty causes casualisation: landless and marginal households, Scheduled Castes and Tribes, and the uneducated cannot afford to wait for regular jobs and accept any daily work; the NCEUS (2007) found that about 77% of Indians lived on less than ₹20 a day in 2004–05, mostly informal and casual workers. Poverty ratios are highest among agricultural labour households.
Measures: minimum and floor wages under the Code on Wages, social security for unorganised and gig workers under the Code on Social Security (both in force from November 2025), e-Shram registration, rural employment guarantee, and skilling so workers can move to regular jobs.
Example 6 (UPSC 2017, 15 marks): India has a vast potential to reap a demographic dividend. Explain the point and discuss the necessary measures to realise it.
Paper and question: Paper II, Q3(b)
Approach: Explain the demographic dividend and India's window with data, the channels through which it raises growth, and the measures (health, education, skills, jobs, women, migration) needed to realise it.
The demographic dividend is the growth boost that arises when the working-age population (15–64 years) grows faster than dependants, as fertility falls. India's median age is under 30, its working-age share is about two-thirds and rising, and the Economic Survey 2018–19 projected that the share will peak around 2041; East Asia's dividend contributed a large part of its 'miracle' growth.
Channels: (i) more workers per head raise output per capita; (ii) a lower dependency ratio raises household and national savings, financing investment; (iii) smaller families allow more spending on each child's health and education and free women to join the labour force.
Risks: the dividend is only potential. Without jobs it becomes a burden: in 2017–18 unemployment among youth was high, female labour force participation was only about 23%, and many children were stunted (NFHS-4, 2015–16: 38%).
Measures: (i) human capital: nutrition, health and quality schooling (foundational literacy, now NEP 2020); (ii) skills: Skill India and PMKVY (2015) linked to industry; (iii) labour-intensive manufacturing, MSMEs and services exports to create jobs; (iv) labour law reform and social security; (v) raising women's participation through safety, childcare and flexible work; (vi) urbanisation and planned migration from young to ageing states.
With these, India can turn its young population into a growth engine before its population begins to age.
Example 7 (UPSC 2017, 20 marks): The quality of employment, in general, in India is perceived to be alarming. How would you analyse the situation?
Paper and question: Paper II, Q8(a)
Approach: Define quality of employment (decent work), analyse the Indian situation on informality, earnings, security, underemployment and gender with data, explain causes, and suggest remedies.
The ILO's idea of decent work covers productive work with fair income, security, social protection, rights and equality. By this yardstick the quality of employment in India is a bigger problem than the open unemployment rate, which is low because the poor cannot afford to stay unemployed.
Indicators: (i) informality: over 90% of workers are in the informal economy (NCEUS, 2007); (ii) even among regular salaried workers, 71% had no written contract, 54% no paid leave and about half no social security (PLFS 2017–18); (iii) earnings: casual workers earn far less than regular workers, and many earn below minimum wages; (iv) underemployment and disguised unemployment in agriculture, which still employed about 44% of workers in 2017–18 but produced only about a sixth of GVA; (v) about half of workers are self-employed in tiny, low-productivity enterprises; (vi) women are concentrated in unpaid and home-based work; (vii) unsafe conditions in construction and small factories.
Causes: slow growth of organised manufacturing, capital- and skill-intensive growth, rigid labour laws pushing firms to use contract labour, low education and skills, and weak enforcement of labour standards.
Remedies: codification of labour laws with a national floor wage and universal social security (proposed in the labour codes); formalisation through EPFO and ESIC incentives (e.g. Pradhan Mantri Rojgar Protsahan Yojana, 2016); labour-intensive manufacturing; skilling under PMKVY; and support for women's work through childcare and safety.
So the situation is indeed alarming in quality though not in open unemployment; the policy target should be decent jobs, not just more jobs.
Example 8 (UPSC 2014, 15 marks): Examine the Labour Policy of India and its impact on employment (labour) market in Indian economy.
Paper and question: Paper II, Q3(c)
Approach: Outline India's labour policy (laws, institutions, minimum wages, social security), examine its impact on the labour market (rigidity, informality, contract labour) with evidence and debate, and note reforms.
India's labour policy aims to protect workers' rights, wages and security while promoting industrial peace. Labour is in the Concurrent List, and by 2014 there were over 40 central and about 200 state labour laws: the Industrial Disputes Act, 1947, Factories Act, 1948, Minimum Wages Act, 1948, Contract Labour (Regulation and Abolition) Act, 1970, and social security through EPF (1952) and ESI (1948).
Impact on the labour market: (i) rigidity: Chapter V-B of the Industrial Disputes Act requires government permission for layoffs, retrenchment or closure in firms with 100 or more workers, so firms avoid growing large and prefer capital-intensive methods; Besley and Burgess (2004) found that states with pro-worker amendments had lower manufacturing output and employment, though their method is debated; (ii) dualism: a small protected organised sector and a vast unprotected informal sector; (iii) rising contract labour in organised manufacturing to bypass regulations; (iv) multiple laws and inspections raised compliance costs and 'inspector raj'; (v) yet enforcement is weak, so most workers get little protection.
Reforms: the Second National Commission on Labour (2002) recommended grouping laws into codes; Rajasthan (2014) raised the Chapter V-B threshold to 300 workers. The four labour codes were passed in 2019–20 and brought into force on 21 November 2025, replacing 29 central laws.
A balanced policy should combine flexibility for firms with portable social security for workers, a 'flexicurity' model.
Example 9 (UPSC 2014, 10 marks): Employment pattern in India in post-reform period has moved in favour of contractual, casual and self-employment. How public sector employment deceleration would impact the future of labour (employment) market in India? Elaborate.
Paper and question: Paper II, Q5(c)
Approach: Note the shift to contractual, casual and self-employment, give data on public sector employment decline, and elaborate the likely impact on wages, security, social mobility and the labour market.
After 1991, organised employment stagnated and new jobs were mainly contractual, casual or self-employed. Public sector employment, the core of 'good jobs', peaked at about 19.7 million in 1997 and fell to about 17.6 million by 2012 (DGE&T), due to hiring freezes, disinvestment and outsourcing.
Impact on the labour market: (i) loss of the benchmark employer: public jobs set standards for wages, security, pensions and working conditions, so their decline weakens labour standards overall; (ii) more contractualisation, even within government, through outsourcing and contract teachers and health workers, giving lower pay and no security; (iii) reduced social mobility for Scheduled Castes, Tribes and OBCs, for whom reservations in public jobs were a key ladder; (iv) a rush of educated youth to scarce government vacancies, creating 'educated unemployment' and long waits; (v) greater reliance on a private sector that offers little security to the less skilled.
The future will depend on private formal job creation, portable social security and skills; otherwise informality and inequality will deepen.
2. Rural Wages and Employment Generation
Example 10 (UPSC 2025, 15 marks): Why is a National Employment Policy necessary for India? What are the initiatives taken by the Government to facilitate employment generation? Explain.
Paper and question: Paper II, Q6(c)
Approach: Give reasons why India needs a unified National Employment Policy (scale, quality, fragmentation, coordination), then list the government's main employment initiatives by type with years, and conclude on what such a policy should contain.
India adds roughly 7–8 million people to its workforce each year, yet employment has never been the central target of macro policy; it is treated as a by-product of growth. A National Employment Policy would make the quantity and quality of jobs an explicit goal.
Why necessary: (i) the problem is mainly of quality: 58.4% of workers are self-employed and 46.1% are in agriculture (PLFS 2023–24), and most jobs are informal; (ii) youth unemployment (9.9% in 2025, PLFS) and women's low participation need targeted action; (iii) schemes are scattered across ministries without common targets or data; (iv) coordination is needed among trade, industrial, skill, labour and education policies and with states.
Initiatives: (i) wage employment: MGNREGA (2005), replaced from 1 July 2026 by the VB-G RAM G Act with 125 days; (ii) self-employment and credit: PMEGP (2008), MUDRA (2015), Stand-Up India and Startup India (2016), PM SVANidhi (2020); (iii) formal job incentives: PMRPY (2016), ABRY (2020) and the Employment Linked Incentive, renamed PM Viksit Bharat Rozgar Yojana (2025, ₹99,446 crore); (iv) skills: Skill India, PMKVY, DDU-GKY and the PM Internship Scheme (2024); (v) sectoral: PLI schemes (2020) and textile parks; (vi) institutions: National Career Service, e-Shram (2021) and the four labour codes (November 2025).
A national policy should set job targets by sector, prioritise labour-intensive manufacturing and services, link skills to demand, and improve labour market data.
Example 11 (UPSC 2024, 20 marks): What schemes are launched by the Government to deal with the problem of unemployment in India? Why the problem still persists?
Paper and question: Paper II, Q2(a)
Approach: Classify the government's schemes against unemployment (wage employment, self-employment, skills, formal job incentives, sectoral), then explain why unemployment and underemployment persist, and suggest a way forward.
India's unemployment is less open joblessness than underemployment and low-quality work: PLFS 2023–24 put unemployment at 3.2%, but youth unemployment at about 10% and educated youth unemployment much higher.
Schemes: (i) wage employment: MGNREGA (2005), the largest rural safety net (about 389 crore person-days in 2020–21); (ii) self-employment: PMEGP (2008), MUDRA loans (2015), Stand-Up India (2016), DAY-NRLM (2011) and DAY-NULM (2013); (iii) skills: Skill India Mission and PMKVY (2015), DDU-GKY (2014) and apprenticeships under NAPS (2016); (iv) formal job incentives: PMRPY (2016) and Atmanirbhar Bharat Rozgar Yojana (2020), which paid EPF contributions for new hires; (v) entrepreneurship: Startup India (2016) and PM SVANidhi for street vendors (2020); (vi) sectoral: PLI schemes (2020) and Make in India (2014); (vii) the Union Budget 2024–25 announced a package of five schemes for 4.1 crore youth, including an Employment Linked Incentive and the PM Internship Scheme.
Why the problem persists: (i) growth is capital- and skill-intensive, and manufacturing employs only about 11–12% of workers; (ii) most schemes create self-employment of low productivity or temporary wage work, not regular jobs; (iii) skill mismatch: training quality and placement under PMKVY have been weak; (iv) MSMEs face credit, demand and compliance constraints; (v) the education system produces graduates without employable skills, so many wait for government jobs; (vi) women face mobility, safety and care barriers; (vii) agriculture still holds surplus labour (46.1% of workers in 2023–24); (viii) schemes are fragmented and poorly monitored.
The way forward is a jobs-first strategy: labour-intensive manufacturing and exports, faster MSME credit, apprenticeship-based skilling, urban employment, and women's participation, coordinated through a national employment policy.
Example 12 (UPSC 2023, 15 marks): Explain the changes in wage structure in India in the post-economic reform period.
Paper and question: Paper II, Q8(c)
Approach: Explain the changes in India's wage structure after 1991 in phases (real wage growth, regular vs casual, skill premium, gender and regional gaps, minimum wages) with evidence, and conclude.
The wage structure is the pattern of wages across skills, sectors, employment types, gender and regions. After 1991 it changed in three ways.
Rising real wages, rising skill premium: the ILO's India Wage Report (2018) found that average real daily wages almost doubled between 1993–94 and 2011–12. But IT, finance and modern services raised the premium for higher education, so wage inequality among regular workers widened in the 1990s and early 2000s.
Compression at the bottom (2004–2014): casual and rural wages grew faster than regular wages because of the construction boom, agricultural price rises, MGNREGA and tighter rural labour markets; the gender wage gap narrowed from about 48% to 34% between 1993–94 and 2011–12 (ILO).
Slowdown after 2014: real rural wage growth slowed to near zero, and real earnings of regular salaried workers stagnated between 2017–18 and 2023–24 (PLFS).
Persistent features: large gaps between regular and casual wages and between organised and unorganised workers; wages in Kerala far above those in Bihar or Madhya Pradesh; women still paid less; and many workers below statutory minimum wages, which varied across states and occupations.
The Code on Wages, 2019, in force from November 2025, introduces a statutory national floor wage and universal minimum wages, a step towards a fairer wage structure.
Example 13 (UPSC 2022, 10 marks): Analyse the challenges for economic recovery in India posed by sluggish growth in rural wage rates during the pandemic period.
Paper and question: Paper II, Q5(c)
Approach: Show that rural wages grew slowly in real terms during 2020–22, then analyse how this hampered recovery through consumption demand, inequality and labour-market channels, and suggest responses.
During the pandemic years nominal rural wages grew only about 5–6% a year while rural inflation was similar or higher, so real rural wages stagnated or fell in 2020–22 (Labour Bureau data, Economic Survey). Reverse migration of urban workers swelled rural labour supply, and MGNREGA demand hit a record 389 crore person-days in 2020–21.
Challenges for recovery: (i) weak consumption demand: rural India accounts for a large share of consumption of FMCG goods, two-wheelers and tractors, and sales slowed in 2021–22; (ii) a K-shaped recovery: corporate profits and urban formal incomes recovered while wage earners lagged, widening inequality and limiting the multiplier; (iii) higher household debt and asset sales as savings were run down; (iv) slow private investment, since firms saw weak demand; (v) the burden fell on MGNREGA and free grain under PMGKAY, raising fiscal costs.
Responses include sustained rural public investment, adequate funding of employment guarantee, faster farm income support, and reviving labour-intensive manufacturing and construction so that rural wages recover.
Example 14 (UPSC 2022, 15 marks): Highlight the main features of National Policy for Skill Development and Entrepreneurship 2015.
Paper and question: Paper II, Q6(b)
Approach: Introduce the policy with its date and context, list its main features under skill development and entrepreneurship separately, and add a brief assessment.
The National Policy for Skill Development and Entrepreneurship, 2015 was launched on 15 July 2015 (World Youth Skills Day) along with the Skill India Mission and PMKVY, replacing the National Skill Development Policy of 2009. It was framed by the new Ministry of Skill Development and Entrepreneurship (2014) to skill on a large scale, with speed and high standards, and to promote innovation-based entrepreneurship.
Skill development features: (i) make skilling aspirational and integrate vocational training with formal school and higher education; (ii) a common quality framework through the National Skills Qualifications Framework, with certification and assessment; (iii) industry-led standards through Sector Skill Councils and greater use of apprenticeships; (iv) recognition of prior learning for informal workers; (v) modernisation of ITIs and training of trainers; (vi) a focus on women, disadvantaged groups and backward regions; (vii) financing through the National Skill Development Fund, NSDC and a credit guarantee scheme for skill loans.
Entrepreneurship features: (i) entrepreneurship education in schools and colleges; (ii) connecting entrepreneurs to mentors, incubators and credit, including MUDRA; (iii) support for social and grassroots enterprises and for women and SC/ST entrepreneurs; (iv) easier regulation.
The policy built institutions, but outcomes have been modest: placement rates under PMKVY were low and industry links weak, so quality and demand-linkage remain the priority.
Example 15 (UPSC 2020, 15 marks): Examine the recent trend in rural wages in India. Discuss the role of MGNREGA in determining this trend.
Paper and question: Paper II, Q7(c)
Approach: Describe the trend in rural wages in phases (boom to about 2014, slowdown after) with sources, then examine MGNREGA's role in raising wages using empirical studies and the counter-arguments.
Trend: Labour Bureau data on wage rates in rural India show two phases. From about 2007 to 2014 real rural wages, both agricultural and non-agricultural, rose rapidly, the fastest in decades. After 2014–15 real wage growth slowed sharply to near zero, despite steady GDP growth, and remained weak up to 2019–20.
Reasons for the boom: a construction boom that pulled workers out of farms, high food prices and agricultural growth, rising education that reduced labour supply, and MGNREGA. Reasons for the slowdown: falling farm prices and incomes after 2014, low food inflation, slower construction, demonetisation (2016) and the return of surplus labour to villages.
Role of MGNREGA: by guaranteeing work at a notified wage near the village, it acts as a reservation wage floor and raises workers' bargaining power, especially in the lean season and for women. Imbert and Papp (2015) found that public works raised private casual wages in early-implementing districts, and Berg and co-authors (2018) estimated a rise of about 5% in real agricultural wages.
Limits: its effect was strongest in states that implemented it well; MGNREGA wages were often below state minimum wages after 2014, payments were delayed, and funding was rationed, so its upward pressure weakened.
Thus MGNREGA was an important but not the main determinant of the trend, which was driven more by construction demand and farm prices.
Example 16 (UPSC 2014, 10 marks): Skill development and thereby raising labour productivity like that in China would be the only panacea for long-term growth in Indian economy. Discuss.
Paper and question: Paper II, Q5(d)
Approach: Accept the importance of skills and productivity with the China comparison, then argue why skills alone are not the 'only panacea' (capital, infrastructure, manufacturing, institutions), and conclude.
Long-term growth depends on raising labour productivity, output per worker. China raised it through mass basic education, vocational training and the movement of workers from farms to factories; India's productivity lags because only about 2% of its workers had formal vocational training (NSS 2011–12) and nearly half still worked in agriculture.
Why skills matter: with a young population, human capital decides whether India gets a demographic dividend; endogenous growth theory (Lucas, 1988) shows that skills raise the productivity of capital too; skilled workers attract manufacturing investment.
Why skills are not the only panacea: China's success also rested on high investment (over 40% of GDP), world-class infrastructure, export-oriented manufacturing, special economic zones, flexible labour markets and women's high participation. Skills without jobs create educated unemployment; India also needs labour-intensive manufacturing, land and labour reforms, cheaper credit and better logistics.
Skill development is therefore necessary, but it must be part of a wider strategy of investment, industrialisation and institutional reform.
Example 17 (UPSC 2014, 15 marks): Vitalization of rural economy is key to 'inclusive growth' which is possible through 'strategic management' and technological upgradation. Explain.
Paper and question: Paper II, Q7(b)
Approach: Link rural vitalisation to inclusive growth, then explain what 'strategic management' (planning, institutions, convergence, value chains) and technological upgradation mean for the rural economy, with Indian examples.
Inclusive growth, the goal of the Eleventh and Twelfth Plans, requires that the poor share in growth. Since about two-thirds of Indians live in villages and most of the poor depend on farming and rural labour, vitalising the rural economy is central to it.
Strategic management means planning rural development as a whole: (i) convergence of schemes for roads (PMGSY, 2000), housing, water and livelihoods at the village level; (ii) decentralised planning through panchayats under the 73rd Amendment; (iii) strong institutions such as SHGs under the National Rural Livelihoods Mission (2011), cooperatives and farmer producer organisations; (iv) linking farmers to markets and value chains through food processing, warehousing and contract farming; (v) diversifying into dairying, horticulture, fisheries and rural non-farm enterprises; (vi) cluster approaches such as PURA (2004).
Technological upgradation: (i) seeds, micro-irrigation, soil health testing and farm mechanisation to raise yields; (ii) ICT for price information, banking and extension (e-Choupal, mobile advisories); (iii) renewable energy and rural electrification; (iv) technology for rural industries and artisans; (v) skilling rural youth to use these technologies.
Together they can raise productivity, create non-farm jobs and reduce distress migration, making growth genuinely inclusive.
3. Poverty Alleviation Schemes and Rural Employment Guarantee
Example 18 (UPSC 2026, 10 marks): How far is the Direct Benefit Transfer (DBT) scheme in India successful in achieving its objectives?
Paper and question: Paper II, Q5(e)
Approach: State DBT's objectives, assess achievements (coverage, leakages, savings, speed) and shortcomings (exclusion, last-mile, data errors) with examples, and give a balanced verdict.
Direct Benefit Transfer (DBT), launched on 1 January 2013, transfers subsidies and welfare benefits directly into beneficiaries' bank accounts, using the JAM trinity of Jan Dhan accounts, Aadhaar and mobile phones. Its objectives are to cut leakages and middlemen, remove fake and duplicate beneficiaries, speed up payments and improve targeting.
Achievements: (i) scale: over 300 central schemes now use DBT, including PM-KISAN (2019), PAHAL for LPG (2015), pensions and MGNREGA wages; (ii) removal of ghost beneficiaries, with government estimates of cumulative savings of about ₹3.5 lakh crore; (iii) quick relief during COVID-19, when cash was sent to women's Jan Dhan accounts in 2020.
Shortcomings: (i) exclusion errors from Aadhaar authentication failures and mismatched names, as studies of Jharkhand's PDS found; (ii) last-mile problems: distant banking points and business correspondents charging fees; (iii) savings estimates mix genuine leakage with deleted eligible beneficiaries.
DBT has largely achieved its goal of efficient delivery, but grievance redress and safeguards against exclusion are needed for it to reach every eligible person.
Example 19 (UPSC 2023, 10 marks): Examine the effectiveness of universal basic income as an approach to poverty alleviation in India.
Paper and question: Paper II, Q5(e)
Approach: Define UBI and its features, then weigh its effectiveness for poverty alleviation in India (advantages, costs, risks) using the Economic Survey 2016–17 and pilots, and conclude.
Universal basic income (UBI) is a periodic cash payment to every individual, unconditionally and without means testing. The Economic Survey 2016–17 discussed a 'quasi-UBI' for India: about ₹7,620 a year to 75% of the population, costing about 4.9% of GDP.
Effectiveness: (i) it avoids targeting errors that exclude the poor from BPL-based schemes; (ii) it cuts leakages through DBT; (iii) it gives security against shocks and supports risk-taking; (iv) pilots support it: the Madhya Pradesh pilot (SEWA and UNICEF, 2011–13) found better nutrition, schooling and more economic activity, not idleness. Partial versions exist in PM-KISAN (2019), Telangana's Rythu Bandhu and Odisha's KALIA (2018).
Limits: the fiscal cost is high unless existing subsidies are cut, which is politically hard; a small amount spread over everyone may not lift the poorest; it cannot replace public goods like health, education and food security.
UBI is thus a useful complement for poverty reduction, best introduced gradually as a targeted or partial transfer, not a full replacement of existing programmes.
Example 20 (UPSC 2022, 20 marks): Critically examine the various poverty alleviation programmes in India since 1970's.
Paper and question: Paper II, Q7(a)
Approach: Trace poverty programmes since the 1970s in phases (target-group and area programmes, IRDP and wage employment, restructuring in the 1990s, rights-based 2000s, DBT era), then critically examine their outcomes and weaknesses, with poverty data.
From the 1970s, with 'Garibi Hatao' and the Fifth Plan, India moved from relying on growth to trickle down to direct attack on poverty through targeted programmes.
Phases: (i) 1970s: target-group and area programmes: Small Farmers Development Agency (1971), Drought Prone Areas Programme (1973), Food for Work (1977); (ii) 1980s: Integrated Rural Development Programme (1978–80) for asset-based self-employment, and wage employment through NREP (1980), RLEGP (1983) and Jawahar Rozgar Yojana (1989); (iii) 1990s: Employment Assurance Scheme (1993), National Social Assistance Programme (1995), Targeted PDS (1997) and SGSY (1999) based on SHGs; (iv) 2000s: a rights-based approach: NREGA (2005), National Rural Livelihoods Mission (2011) and the National Food Security Act (2013); (v) after 2014: Jan Dhan, DBT, PMAY-G (2016), Ujjwala (2016), Ayushman Bharat (2018), PM-KISAN (2019) and free grain under PMGKAY.
Outcomes: poverty fell from 54.9% in 1973–74 (Lakdawala) to 21.9% in 2011–12 (Tendulkar), and NITI Aayog's MPI headcount fell from 29.2% in 2013–14 to 11.3% in 2022–23. Programmes helped smooth consumption, build rural roads and houses, and empower women through SHGs.
Weaknesses: (i) targeting errors in BPL lists; (ii) leakages and corruption, notably in PDS and IRDP, where many assets did not generate income; (iii) top-down design and weak panchayat role; (iv) multiplicity of schemes and poor convergence; (v) poor quality of assets created; (vi) neglect of urban poor until recently; (vii) growth, rising wages and migration explain much of the fall in poverty.
Thus anti-poverty programmes have evolved from charity to entitlements and direct transfers; their future effectiveness depends on better targeting, convergence and linking safety nets to jobs and human capital.
Example 21 (UPSC 2021, 10 marks): Evaluate the role of MGNREGA in asset creation and poverty alleviation.
Paper and question: Paper II, Q5(e)
Approach: Evaluate MGNREGA on two counts, asset creation and poverty alleviation, with evidence for and against, and conclude briefly.
MGNREGA (2005) guarantees 100 days of wage work a year to every rural household that demands it, with twin aims of livelihood security and creation of durable assets.
Poverty alleviation: it provides a safety net in the lean season and in crises: it generated a record 389 crore person-days in 2020–21 when migrants returned home; women's share of person-days has exceeded half. The NCAER–University of Maryland study (2015) found that it reduced poverty by up to 32% and prevented about 14 million people from falling into poverty between 2004–05 and 2011–12.
Asset creation: rules require at least 60% of expenditure on works linked to agriculture and allied activities; water conservation, farm ponds, land development and individual assets on the land of SC/ST and small farmers have raised irrigation and yields. But many works are incomplete or of poor quality.
Weak funding and delayed wages limited its impact. From 1 July 2026 it has been replaced by the VB-G RAM G Act, 2025, which raises the guarantee to 125 days.
Example 22 (UPSC 2020, 10 marks): Comment on poverty alleviation schemes undertaken by the Government of India for urban poor.
Paper and question: Paper II, Q5(e)
Approach: Briefly characterise urban poverty and list the main schemes for the urban poor by need (livelihood, housing, vendors, health, food, basic services) with years, then comment on their adequacy.
Urban poverty (13.7% in 2011–12 by the Tendulkar method) is marked by informal jobs, slums, insecure housing, poor sanitation and lack of social security, and is often hidden among migrants.
Schemes: (i) livelihood: Swarna Jayanti Shahari Rozgar Yojana (1997), replaced by the National Urban Livelihoods Mission (2013, Deendayal Antyodaya Yojana–NULM from 2016) for skills, self-employment loans, SHGs and shelters for the homeless; (ii) housing: Pradhan Mantri Awas Yojana–Urban (2015) for 'housing for all', and Affordable Rental Housing Complexes for migrants (2020); (iii) street vendors: the Street Vendors Act (2014) and PM SVANidhi (2020) for collateral-free working-capital loans; (iv) health: National Urban Health Mission (2013) and Ayushman Bharat (2018); (v) food: NFSA (2013) covering 50% of urban population, and One Nation One Ration Card; (vi) basic services: AMRUT and Swachh Bharat (2015).
Comment: these schemes improved housing and credit access, but urban poverty policy remains fragmented, migrants and informal workers are often excluded, and India has no urban employment guarantee, though states such as Kerala and Rajasthan run their own.
Example 23 (UPSC 2019, 15 marks): Would you advocate a programme of Universal Basic Income (UBI) to reduce extreme poverty in India? Discuss in detail.
Paper and question: Paper II, Q4(c)
Approach: Take a clear position: explain UBI and its case for ending extreme poverty, examine the fiscal and design objections, and advocate a phased, quasi-universal version linked to rationalisation of subsidies.
Universal basic income is an unconditional, periodic cash transfer to all individuals. The idea goes back to Thomas Paine and has been developed by Philippe Van Parijs; the Economic Survey 2016–17 made it a serious policy option for India.
Case for UBI against extreme poverty: (i) India's welfare system has over 950 central sector and centrally sponsored sub-schemes (Economic Survey 2016–17), with targeting errors: the poorest districts get the least funds; (ii) a universal transfer removes exclusion errors and the stigma of BPL lists; (iii) with JAM, transfers can be made cheaply and with fewer leakages; (iv) evidence from the Madhya Pradesh pilot (2011–13) and global cash transfer studies shows better nutrition, schooling and enterprise, with no fall in work effort.
Objections: (i) the cost: a quasi-UBI of ₹7,620 a year to 75% of people costs about 4.9% of GDP (Economic Survey 2016–17), affordable only by phasing out food, fertiliser and other subsidies, which is politically difficult; (ii) cash may be spent on 'bads' and is eroded by inflation if not indexed; (iii) last-mile banking and Aadhaar failures.
I would advocate a phased, quasi-universal version: begin with vulnerable groups such as women, the elderly and farmers (PM-KISAN, 2019 is a step), fund it by rationalising inefficient subsidies, keep health, education and food security, and expand as fiscal space and banking access grow.
Example 24 (UPSC 2019, 20 marks): What are the core objectives of the Mahatma Gandhi National Rural Employment Guarantee Scheme (MGNREGS)? In what ways has a paradigm shift taken place with the implementation of MGNREGA?
Paper and question: Paper II, Q8(a)
Approach: List the core objectives of MGNREGS as given in the Act and guidelines, then explain the paradigm shift it brought compared with earlier wage employment programmes, and end with an assessment.
The National Rural Employment Guarantee Act was passed in 2005 and launched on 2 February 2006 in 200 districts, covering all rural districts by April 2008; it was renamed after Mahatma Gandhi in 2009.
Core objectives: (i) enhancing livelihood security by providing at least 100 days of guaranteed unskilled wage employment a year to every rural household whose adults volunteer; (ii) creating durable, productive assets; (iii) strengthening the natural resource base of the poor; (iv) proactively ensuring social inclusion of women, SCs and STs; (v) strengthening panchayati raj institutions.
Paradigm shift: (i) from a scheme to a legal right: work must be given within 15 days of demand, otherwise an unemployment allowance is due; (ii) from allocation-based to demand-driven: funds were meant to follow demand rather than fixed budgets; (iii) from top-down to bottom-up planning by Gram Sabhas and panchayats, which must execute at least 50% of works; (iv) from contractors to direct employment: no contractors or labour-displacing machines, and a 60:40 wage–material ratio; (v) transparency: mandatory social audits, public records and RTI; (vi) payment of wages through bank and post office accounts, later DBT, cutting middlemen; (vii) gender equity: at least one-third of beneficiaries women, equal wages, worksite facilities.
Assessment: it became the world's largest public works programme, raised rural wages, empowered women and helped in crises like COVID-19. But delayed wages, rationed funds and poor-quality assets weakened the guarantee in practice.
MGNREGA thus shifted rural welfare from charity to entitlement. Its successor, the VB-G RAM G Act, 2025 (from 1 July 2026), raises the guarantee to 125 days but moves to 60:40 Centre–State funding, which critics see as a step away from the demand-driven design.
Example 25 (UPSC 2018, 10 marks): Do you agree that MGNREGA has been plagued with rampant malpractices, leakage of funds and diversion of resources? Give reasons.
Paper and question: Paper II, Q5(a)
Approach: Take a balanced position: give evidence of malpractices, leakages and diversion, explain their causes, and show the corrective measures that reduced them.
MGNREGA has suffered from malpractices, but 'rampant' overstates the position after the reforms of the 2010s.
Evidence of problems: the CAG's performance audit (2013) found poor record-keeping, incomplete works and irregular expenditure in many states; social audits in Andhra Pradesh and elsewhere detected fake muster rolls, ghost workers and inflated measurements; contractors and machines were used illegally in some states; funds were diverted to non-permissible works; and wage payments were often delayed beyond 15 days, which the Supreme Court criticised in Swaraj Abhiyan (2016).
Causes: weak capacity of panchayats, nexus of local officials and contractors, low awareness among workers, and inadequate social audit units.
Corrections: wage payments through bank accounts and the Aadhaar-based payment system, electronic fund management (eFMS), geo-tagging of assets (GeoMGNREGA, 2016), independent social audit units, and the deletion of duplicate job cards have reduced leakages.
So the charge is partly true, but much of it reflects weak implementation rather than the design, and transparency tools have improved accountability.
Example 26 (UPSC 2017, 10 marks): Explain the concept and the underlying rationale of 'Universal Basic Income'.
Paper and question: Paper II, Q5(b)
Approach: Define UBI with its defining features and origin, then explain the rationale (efficiency, equity, freedom, insurance) with the Indian context of the Economic Survey 2016–17.
Universal basic income (UBI) is a regular cash payment by the state to every individual, irrespective of income or employment. Its five features are that it is universal, unconditional, paid to individuals, periodic and in cash. The idea traces back to Thomas Paine (1797) and was revived by Philippe Van Parijs; the Economic Survey 2016–17 devoted a chapter to it.
Rationale: (i) social justice: a society should guarantee every citizen a minimum income as a basic right; (ii) poverty reduction: it reaches the poor whom targeted schemes miss because of errors in BPL lists; (iii) efficiency: replacing many leaky schemes and in-kind subsidies by DBT cuts administrative costs and corruption; (iv) freedom and dignity: recipients choose how to spend, and no one is stigmatised; (v) insurance against shocks such as illness, drought or job loss; (vi) it supports labour market flexibility by giving workers a fallback.
Critics point to its fiscal cost and the risk of crowding out public services, so the Survey suggested a phased, quasi-universal approach.
Example 27 (UPSC 2017, 20 marks): The various anti-poverty programmes have not achieved the desired socio-economic progress in India. Write down the major programmes and your broad based assessment of their weaknesses.
Paper and question: Paper II, Q6(a)
Approach: Write down the major anti-poverty programmes by category with years, then give a broad assessment of their weaknesses (design, targeting, delivery, convergence, institutions), with evidence, and suggest improvements.
Since the Fifth Plan (1974–79) India has used direct anti-poverty programmes alongside growth. Poverty did fall, from 54.9% in 1973–74 to 21.9% in 2011–12 (Planning Commission), but slower than spending and the number of schemes would suggest.
Major programmes: (i) self-employment: IRDP (1978–80), SGSY (1999), NRLM–Aajeevika (2011); (ii) wage employment: Food for Work (1977), NREP (1980), RLEGP (1983), JRY (1989), Employment Assurance Scheme (1993), SGRY (2001), NREGA (2005); (iii) food security: PDS, Targeted PDS (1997), Antyodaya Anna Yojana (2000), NFSA (2013); (iv) housing: Indira Awaas Yojana (1985); (v) social assistance: NSAP (1995); (vi) urban: SJSRY (1997), NULM (2013); (vii) financial inclusion: Jan Dhan (2014).
Weaknesses: (i) targeting errors: BPL surveys both excluded the poor and included the non-poor; (ii) leakages: a large share of PDS grain was diverted in the 2000s, and IRDP evaluations found many assets sold or unproductive because of weak markets and credit; (iii) top-down, uniform design that ignored local needs and gave panchayats little role; (iv) too many overlapping schemes with thin funding and poor convergence; (v) poor-quality assets in wage programmes; (vi) delays and corruption in delivery; (vii) neglect of human capital: health, education and nutrition outcomes lagged; (viii) weak monitoring and evaluation.
Improvements include better targeting through SECC 2011 data and Aadhaar, direct benefit transfers, social audits, a stronger role for panchayats and SHGs, convergence of schemes, and linking safety nets to skills and jobs.
Example 28 (UPSC 2016, 20 marks): What are the basic features of new national rural employment guarantee scheme? What are the impediments in their implementation?
Paper and question: Paper II, Q8(a)
Approach: Describe the basic features of the rural employment guarantee (NREGA 2005) under entitlement, works, wages, institutions and transparency, then analyse the impediments in implementation with evidence.
The National Rural Employment Guarantee Act, 2005 (renamed MGNREGA in 2009) was launched in February 2006 and extended to all rural districts by 2008. It is the first law in India to make work a legal entitlement.
Basic features: (i) at least 100 days of unskilled manual work a year to every rural household that demands it; (ii) work within 15 days of application, otherwise an unemployment allowance; within 5 km of the village, otherwise extra wages; (iii) at least one-third of workers women, with equal wages and worksite crèches; (iv) wages at notified rates, paid within 15 days into bank or post office accounts; (v) works chosen by Gram Sabhas, with at least 50% executed by gram panchayats; a 60:40 wage–material ratio; no contractors or machines; (vi) permissible works focus on water conservation, drought proofing, land development and rural connectivity; (vii) mandatory social audits and public disclosure; (viii) the Centre pays all unskilled wages and 75% of material costs.
Impediments: (i) delayed wage payments, often beyond 15 days, discouraging workers; (ii) insufficient and late release of funds, which turned a demand-driven scheme into a rationed one; (iii) wages below state minimum wages in many states; (iv) weak capacity of panchayats, shortage of technical staff and poor planning, so assets were incomplete or of low quality; (v) corruption: fake job cards and muster rolls; (vi) low awareness, so demand goes unregistered; (vii) uneven performance: poorer states like Bihar and Uttar Pradesh generated less work than Rajasthan or Andhra Pradesh.
Fixing these needs timely funds, electronic payments, stronger social audits and panchayat capacity. In 2025 Parliament replaced the scheme with the VB-G RAM G Act, effective 1 July 2026, offering 125 days.
Example 29 (UPSC 2015, 15 marks): Market economy excludes poor from the consumer as well as employment market. Discuss how one can safeguard the interests of population below poverty line.
Paper and question: Paper II, Q4(c)
Approach: Explain how markets exclude the poor from both consumption and employment (entitlement failure, imperfect markets), then discuss safeguards through public provision, safety nets, capabilities and inclusion, with Indian examples.
A market economy allocates goods by purchasing power and jobs by skills and assets. The poor have little of either, so they are excluded: as consumers they cannot afford food, health care or education when prices rise, and as workers they lack the skills, capital and networks needed for good jobs. Amartya Sen's entitlement approach shows that famines and hunger can occur even when food is available, because the poor lose command over it.
Safeguards: (i) food security: the Targeted PDS and the National Food Security Act (2013), giving subsidised grain to 67% of the population; (ii) employment: MGNREGA (2005) as a wage floor and safety net; (iii) public provision of merit goods: free schooling under the Right to Education Act (2009), the midday meal, the National Health Mission and Ayushman Bharat; (iv) social security: old-age, widow and disability pensions under NSAP (1995) and insurance for unorganised workers; (v) capability building through skills and credit, such as SHGs under NRLM and MUDRA loans, so the poor can participate in markets; (vi) regulation: minimum wages and protection against exploitative contracts; (vii) financial inclusion and direct benefit transfers to reduce leakages.
The aim is not to replace markets but to make them inclusive: in Sen's terms, expanding the entitlements and capabilities of the poor.
Example 30 (UPSC 2015, 20 marks): Rural poverty continues to be a chronic problem in India, which cannot be taken care of by anti-poverty programmes but by creation of permanent productive assets. Discuss.
Paper and question: Paper II, Q7(a)
Approach: Discuss both sides: why rural poverty is chronic and why transfer-type programmes alone cannot end it, then why productive assets (physical, natural, human, financial) are key, and conclude that both are complementary.
In 2011–12, 25.7% of rural Indians were poor by the Tendulkar line, against 13.7% in urban areas. Much rural poverty is chronic: it persists over long periods and passes across generations, concentrated among landless labourers, marginal farmers, SCs and STs, and rain-fed regions.
Why programmes alone fall short: wage employment and subsidies raise consumption temporarily but do not raise the earning capacity of the poor; when transfers stop, households fall back. IRDP gave assets but without markets, skills or credit, so many beneficiaries sold them; wage programmes before NREGA created roads and ponds that were often poorly maintained.
Why productive assets matter: (i) land: land reforms in West Bengal (Operation Barga, 1978) and Kerala raised security and incomes; (ii) water and soil: irrigation, watershed development and soil conservation raise yields; (iii) livestock and fisheries diversify income; (iv) human capital: education, health and skills open non-farm jobs; (v) financial assets: savings, credit and insurance through SHGs and banks protect against shocks; (vi) rural infrastructure such as roads (PMGSY, 2000) and electricity links villages to markets.
But programmes still matter: safety nets protect assets from distress sales in a drought, and MGNREGA itself can create permanent assets such as farm ponds on the land of small farmers. Evidence from the NCAER–Maryland study (2015) shows MGNREGA reduced poverty.
So the statement is broadly valid: lasting escape from rural poverty needs productive assets and capabilities, while anti-poverty programmes provide the safety net and can be designed to create those assets.
Example 31 (UPSC 2014, 20 marks): Elaborate growth-mediated security and support-led security strategies of poverty alleviation given by Jean Dreze and Amartya Sen.
Paper and question: Paper II, Q2(a)
Approach: Introduce Dreze and Sen's framework from Hunger and Public Action (1989), explain growth-mediated and support-led security with country examples and mechanisms, compare them, and relate them to India.
In Hunger and Public Action (1989), Jean Dreze and Amartya Sen asked how countries achieve social security, in the broad sense of protecting people from deprivation, long life and good health. They identified two successful routes.
Growth-mediated security: rapid, broad-based economic growth raises incomes and employment, and the resources generated are used for public services such as health and education. Examples are South Korea and Hong Kong, where growth was participatory and employment-intensive, and the state invested heavily in basic education and health. Growth alone is not enough: Dreze and Sen contrast this with 'unaimed opulence', as in Brazil, where high growth left many deprived.
Support-led security: skilful public support for health care, education, food and social insurance improves living standards even before incomes become high, because these services are labour-intensive and cheap in poor countries. Examples are Sri Lanka, Costa Rica, Chile, pre-reform China and the Indian state of Kerala, which achieved high life expectancy and literacy at low incomes.
Comparison: growth-mediated security is more sustainable financially but slow to reach the poor if growth is not inclusive; support-led security works quickly but depends on fiscal capacity and may be hard to sustain without growth. They also distinguished protection (preventing a fall in living standards, such as famine relief) from promotion (raising living standards over time).
India: after 1991 India relied on growth, but its human development lagged; Dreze and Sen, in An Uncertain Glory (2013), argued that India needs both, using growth revenues for public services, as Kerala and Tamil Nadu have done, and rights such as MGNREGA and the Food Security Act.
Example 32 (UPSC 2014, 20 marks): National Rural Employment Guarantee Scheme should be reoriented to create productive permanent assets to promote employment and generate income in the rural sector. Critically evaluate.
Paper and question: Paper II, Q4(a)
Approach: Critically evaluate the proposal: give the case for reorienting the scheme towards productive assets, the risks to its employment and rights objectives, the reforms made, and a balanced conclusion.
MGNREGA was designed with two goals: guaranteed wage employment as a safety net and creation of durable assets. By 2014 critics argued that it had become a 'dole' that dug ditches, and that it should be reoriented to productive, permanent assets.
Case for reorientation: (i) productive assets such as irrigation tanks, check dams, land levelling and plantations raise farm productivity and create lasting employment and income, multiplying the effect of wages; (ii) many works were incomplete or washed away, wasting resources; (iii) individual assets on the land of SC/ST, small and marginal farmers (allowed since 2008) directly build the resource base of the poor; (iv) convergence with agriculture, watershed and forestry schemes can improve quality; (v) better assets build public support for the programme.
Risks: (i) the primary purpose is an employment guarantee; emphasising assets may lead to more machines and material, cutting the wage share and rationing work; (ii) productive works need technical skills and planning that panchayats often lack; (iii) assets on private land may favour better-off farmers; (iv) the demand-driven, rights-based character could be weakened if work depends on project availability.
Reforms: the 2013–14 guidelines expanded permissible works and the government required at least 60% of expenditure on works linked to agriculture and allied activities; geo-tagging (2016) and natural resource management works followed. Studies, such as those by the Indian Institute of Science, found improvements in groundwater and soil from such works.
A balanced reorientation is therefore desirable: better planned, durable, productive assets within the 60:40 wage–material norm, without diluting the legal guarantee of work.
Mains points
- MGNREGA is the single most-asked scheme: know its features (2005 Act, 100 days, demand-driven, 15 days, one-third women, social audit), its record, its critiques and its replacement by the VB-G RAM G Act, 2025 (125 days, 60:40 funding) from 1 July 2026.
- Employment questions reward PLFS data with years: unemployment 6.1% (2017–18) to 3.2% (2023–24) and 3.1% (2025), female LFPR 23.3% to over 40%, self-employment 58.4% and casual work 19.8% (2023–24).
- Distinguish quantity from quality of jobs: informality, casualisation, low earnings and lack of social security are the core of 'jobless growth' arguments.
- For poverty questions, show the evolution of programmes (target-group 1970s, wage employment, self-employment, rights-based 2000s, DBT and UBI debate) and cite Dreze–Sen, NCEUS and the NITI Aayog MPI.
- End with a balanced way forward: labour-intensive manufacturing, skills, women's work, social security under the labour codes, and convergence of schemes.
Did you know?
- The idea of a legal right to work in India was pioneered by Maharashtra's Employment Guarantee Scheme of 1972, born in the drought years, more than three decades before MGNREGA.
Economics Optional: All chapters
- Exam Pattern, Syllabus and Strategy
- Price Determination and Theories of Distribution
- Market Structures
- Welfare Economics
- Theories of Employment, Income and Interest
- Money and Monetary Management
- Public Finance
- Theories of International Trade
- Trade Policy, Protection and the WTO
- Balance of Payments and Exchange Rates
- Theories of Growth
- Economic Development
- Indian Economy in the Pre-Independence Era
- Planning in India
- Agriculture before Liberalisation
- Industry before Liberalisation
- National Income, Poverty and Inequality
- Agriculture after Liberalisation
- Industry after Liberalisation
- External Sector after Liberalisation
- Public Finance and Fiscal Federalism in India
- Monetary System and the RBI
- Employment, Wages and Poverty Alleviation