
Economics Optional · UPSC Notes
Trade Policy, Protection and the WTO — UPSC Economics Optional Notes
Free, exam-focused notes for UPSC Prelims and Mains, with Prelims tips and Mains points for every topic. 5 topics.
Open in the interactive reader: bookmarks, progress tracking and read-aloud.
Tariffs and Quotas: Effects and Comparison
A tariff is a tax on imports; a quota is a quantitative limit on them. In a small country a tariff raises the domestic price, increases domestic output, reduces consumption and imports, gives revenue to the government and causes a deadweight loss (production and consumption distortions). A large country can gain through better terms of trade, up to an optimal tariff t* = 1/(e* − 1). The effective rate of protection (Corden, Balassa) measures protection of value added. Under perfect competition a quota is equivalent to a tariff except that the quota rent goes to licence holders; with monopoly or growing demand the two are not equivalent (Bhagwati, 1965).
In simple words
A tariff is a tax on goods coming from abroad; a quota simply allows only a fixed amount to come in.
If India puts a 20% duty on imported mobile phones, local makers can charge more and grow, but buyers pay more.
Both protect local industry, but they waste some resources, and with quotas the extra profit goes to whoever holds the import licence.
UPSC asks you to show tariff effects with a diagram, explain the effective rate of protection and compare tariffs with quotas.
1. Concepts and Definitions
Tariff: a tax on imported goods; specific (fixed amount per unit), ad valorem (percentage of value) or compound; India's customs duty under the Customs Tariff Act, 1975 is mostly ad valorem.
Quota: a direct limit on the quantity or value of imports, usually through licences.
Voluntary export restraint (VER): a quota administered by the exporting country at the importer's request (for example Japan's limits on car exports to the US from 1981).
Tariff-rate quota (TRQ): a low tariff on imports within a quota and a high tariff beyond it; widely used for agriculture after the Uruguay Round.
Non-tariff barriers: quotas, licensing, standards, sanitary rules, local content requirements, anti-dumping duties and subsidies.
2. Partial Equilibrium Effects of a Tariff (Small Country)
Assumptions: the country is a price-taker at world price Pw; perfect competition; homogeneous good; no externalities.
Price effect: a tariff t raises the domestic price to Pw(1 + t); the world price is unchanged.
Protective (production) effect: domestic output rises from S1 to S2.
Consumption effect: domestic consumption falls from D1 to D2.
Trade effect: imports fall from (D1 − S1) to (D2 − S2).
Revenue effect: government earns t × Pw × (D2 − S2).
Redistribution effect: part of the consumer surplus lost goes to producers as extra producer surplus.
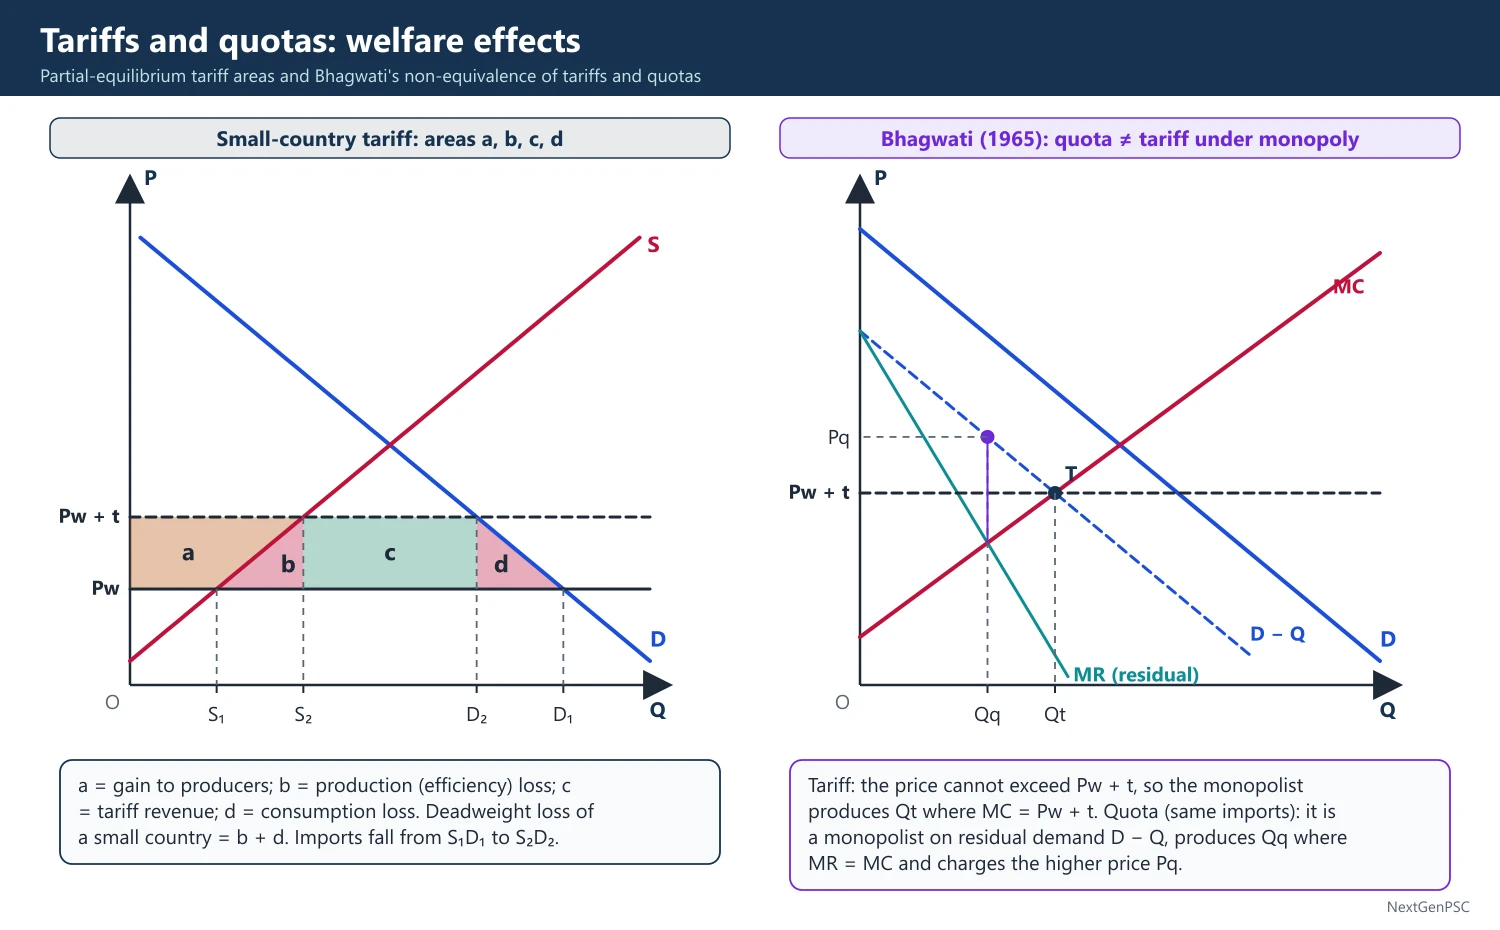
Welfare (in the standard labelling a, b, c, d): consumer surplus falls by a + b + c + d; producer surplus rises by a; revenue is c; the net loss is b + d, where b is the production distortion (high-cost domestic output replacing cheaper imports) and d the consumption distortion.
Prohibitive tariff: a tariff high enough to eliminate imports; revenue becomes zero.
3. Large Country and the Optimal Tariff
Terms of trade effect: a large importer's tariff reduces world demand and lowers the world price; part of the tariff is paid by foreign exporters (area e).
Net welfare: gain = e − (b + d); a small tariff always raises welfare for a large country, but beyond a point losses dominate.
Optimal tariff: t* = 1/(e* − 1), where e* is the elasticity of the foreign offer curve (or of foreign export supply in partial equilibrium, t* = 1/εs); for a small country e* is infinite and t* = 0.
Retaliation: if partners retaliate, both may end up worse off than under free trade (a prisoners' dilemma), as in the 1930s after the US Smoot-Hawley Tariff Act (1930); Harry Johnson (1953–54) showed one country may still gain in a tariff war if elasticities differ greatly.
General equilibrium effects: by the Stolper-Samuelson theorem a tariff raises the real return of the factor intensive in the import-competing good; the Metzler paradox (1949) can occur if foreign demand is very inelastic.
4. Effective Rate of Protection (ERP)
Concept: nominal tariffs on final goods overstate or understate the protection given to domestic value added, because inputs may also carry tariffs; developed by W.M. Corden ('The Structure of a Tariff System and the Effective Protective Rate', Journal of Political Economy, 1966), Bela Balassa (1965) and Harry Johnson.
Formula: ERP = (t − a·tᵢ)/(1 − a), where t is the tariff on the final good, a the share of imported inputs in the free-trade value of the final good and tᵢ the tariff on inputs.
Example: a car worth 100 at world prices uses imported inputs worth 60; a 20% tariff on cars and zero on inputs raise domestic value added from 40 to 60, an ERP of 50%; if inputs also pay 20%, ERP = (20 − 0.6 × 20)/0.4 = 20%.
Tariff escalation: low tariffs on raw materials and high tariffs on finished goods give very high effective protection to final processing; developed countries' escalation on processed tropical products discourages processing in developing countries.
Negative ERP: if input tariffs exceed output tariffs, value added can be taxed, hurting domestic producers (the 'inverted duty structure' in India for some electronics and textiles).
5. Quotas and the Tariff-Quota Comparison
Effects of a quota: limiting imports to the amount that a tariff would allow produces the same rise in price, output and fall in consumption; the area c becomes quota rent, which goes to licence holders (or foreign exporters under a VER) instead of the government.
Equivalence: under perfect competition in all markets and static conditions, a tariff and a quota that give the same import volume are equivalent.
Non-equivalence (Jagdish Bhagwati, 1965, 'On the Equivalence of Tariffs and Quotas'): (i) with a domestic monopolist, a tariff limits its pricing power (the world price plus tariff caps the price) while a quota lets it act as a monopolist on the residual demand, so prices are higher and output lower; (ii) with growing demand, a tariff allows imports to rise at a constant price, while a quota forces the price up; (iii) with foreign monopoly or quota licences sold competitively, results differ again.
Rent-seeking: Anne Krueger, 'The Political Economy of the Rent-Seeking Society' (American Economic Review, 1974), estimated rents from import licences at about 7% of national income in India (1964) and about 15% in Turkey (1968); resources spent chasing licences add a social cost beyond the triangles.
Why quotas were used: certainty about import volumes (balance of payments control), administrative discretion, and avoiding GATT tariff bindings; GATT Article XI generally prohibits quantitative restrictions, with exceptions for BoP (Article XII and XVIII:B).
Ranking: economists generally rank tariffs above quotas (transparent, revenue to government, less rent-seeking, price signals preserved) and production subsidies above tariffs when the goal is to raise domestic output (no consumption distortion: the theory of domestic distortions of Bhagwati and Ramaswami, 1963).
6. Diagrams to Draw
Small-country tariff: draw domestic demand D and supply S; draw the world price Pw as a horizontal line and Pw + t above it; mark S1, D1 at Pw and S2, D2 at Pw + t; label area a (producer surplus gain), b (production loss triangle), c (revenue rectangle between S2 and D2) and d (consumption loss triangle).
Large-country tariff: add a fall in the world price to Pw′ below Pw; the rectangle e between Pw and Pw′ over imports is the terms-of-trade gain; compare e with b + d.
Quota diagram: draw the same D and S; add the quota as a fixed amount to domestic supply to get S + Q; the new price is where S + Q meets D; label the quota rent rectangle.
Monopoly non-equivalence: draw domestic monopolist's MC and the demand curve; under a tariff the monopolist faces a horizontal price line at Pw + t; under a quota, shift demand left by the quota to get residual demand and its MR; the monopolist's price under the quota is higher.
7. Examples and Applications
India: before 1991 India used import licensing and peak customs duties far above 100%; the peak rate was reduced to 150% in 1991–92 and progressively to about 10% for most non-agricultural goods by the late 2000s; quantitative restrictions on consumer goods were removed by April 2001 after a WTO dispute brought by the US; since 2018 duties on electronics, toys and some consumer goods have been raised again to support domestic manufacturing.
India's inverted duty structure: where inputs carried higher duties than final goods (some electronics, textiles), the ERP was low or negative, a reason for duty rationalisation in Union Budgets.
World: the US-China tariff war from 2018, the US 'reciprocal' tariffs of 2025 (which for a time raised duties on many Indian goods to 50%), and the Multi-Fibre Arrangement quotas on textiles (1974–2004) illustrate tariffs and quotas in practice.
8. Using it in the Exam
10 marks: list the effects of a tariff with the a, b, c, d diagram.
15 marks: explain the effective rate of protection with the formula and a numerical example, or the large-country optimal tariff.
20 marks: tariff versus quota: equivalence under competition, non-equivalence under monopoly and growth (Bhagwati), rent-seeking (Krueger), and India's shift from QRs to tariffs.
Keywords: protective, consumption, revenue and redistribution effects, deadweight loss, terms of trade gain, optimal tariff, ERP, tariff escalation, quota rent, VER, non-equivalence, rent-seeking.
Formula to quote: ERP = (t − a·tᵢ)/(1 − a).
| Basis | Tariff | Quota |
|---|---|---|
| Who gets the rent | Government (revenue) | Licence holders or foreign exporters (VER) |
| Effect of rising demand | Imports rise; price unchanged | Price rises; imports fixed |
| Domestic monopoly | Price capped at world price plus tariff | Monopolist exploits residual demand; higher price |
| Transparency | High; price-based | Low; administrative discretion |
| Rent-seeking | Less | More (Krueger, 1974) |
| Certainty of import volume | Low | High |
| GATT/WTO treatment | Allowed, can be bound | Generally prohibited (Article XI) with exceptions |
Mains points
- Draw the small-country tariff diagram and label a, b, c, d; then write the welfare change (net loss b + d).
- For a large country add the terms-of-trade gain and the optimal tariff formula, and warn about retaliation.
- Explain the ERP with a numerical example; mention tariff escalation and India's inverted duty structure.
- For tariff versus quota, state equivalence under competition and Bhagwati's three cases of non-equivalence.
- Use Krueger's rent-seeking estimates for India (1964) to show the hidden cost of quotas and licensing.
- Common mistake: forgetting that in a quota the revenue area becomes rent for licence holders, not for the government.
Did you know?
- Memory trick for tariff effects: 'PCRR' – Protective, Consumption, Revenue, Redistribution; and the welfare triangles are 'b for business waste, d for diner's loss'.
Trade Policy and Developing Countries
Developing countries have debated whether to protect industry or open up. The infant industry argument (Hamilton 1791, List 1841, tested by Mill and Bastable) and export pessimism (Prebisch, Nurkse) supported import-substituting industrialisation (ISI) in India and Latin America from the 1950s. Studies by Little, Scitovsky and Scott (1970), Bhagwati and Krueger showed its costs, and the success of export-oriented East Asia shifted opinion towards openness. The theory of domestic distortions (Bhagwati-Ramaswami, 1963) shows that a distortion should be corrected at its source, usually with a subsidy rather than a tariff, while the revisionists (Amsden, Wade, Rodrik, Chang) argue that East Asia used active industrial policy.
In simple words
Should a poor country shield its new factories from foreign competition, or open its doors to trade?
A young plant needs a fence until it grows strong; the infant industry argument says new industries need protection the same way, but the fence must come down later.
India protected industry for 40 years and grew slowly; East Asian countries pushed exports and grew fast, though with active government support.
UPSC asks you to compare import substitution and export promotion and judge which suits developing countries.
1. Concepts and Definitions
Import-substituting industrialisation (ISI): a strategy of producing at home goods previously imported, behind tariffs, quotas, licensing and overvalued exchange rates; first consumer goods ('easy' phase), then intermediate and capital goods ('hard' phase).
Export-oriented industrialisation (EOI): a strategy that keeps incentives neutral between home and export sales or biases them towards exports, with realistic exchange rates, duty-free inputs for exporters and export credit.
Bias of a trade regime: Bhagwati and Krueger measured it as the ratio of the effective exchange rate for imports to that for exports; above one means anti-export bias (ISI), equal to one means neutrality.
Infant industry: a new industry that cannot yet compete because of learning costs but would become competitive with time and experience.
2. Arguments for Protection in Developing Countries
Infant industry: Alexander Hamilton, Report on Manufactures (1791), and Friedrich List, The National System of Political Economy (1841); J.S. Mill accepted it as the one valid exception to free trade.
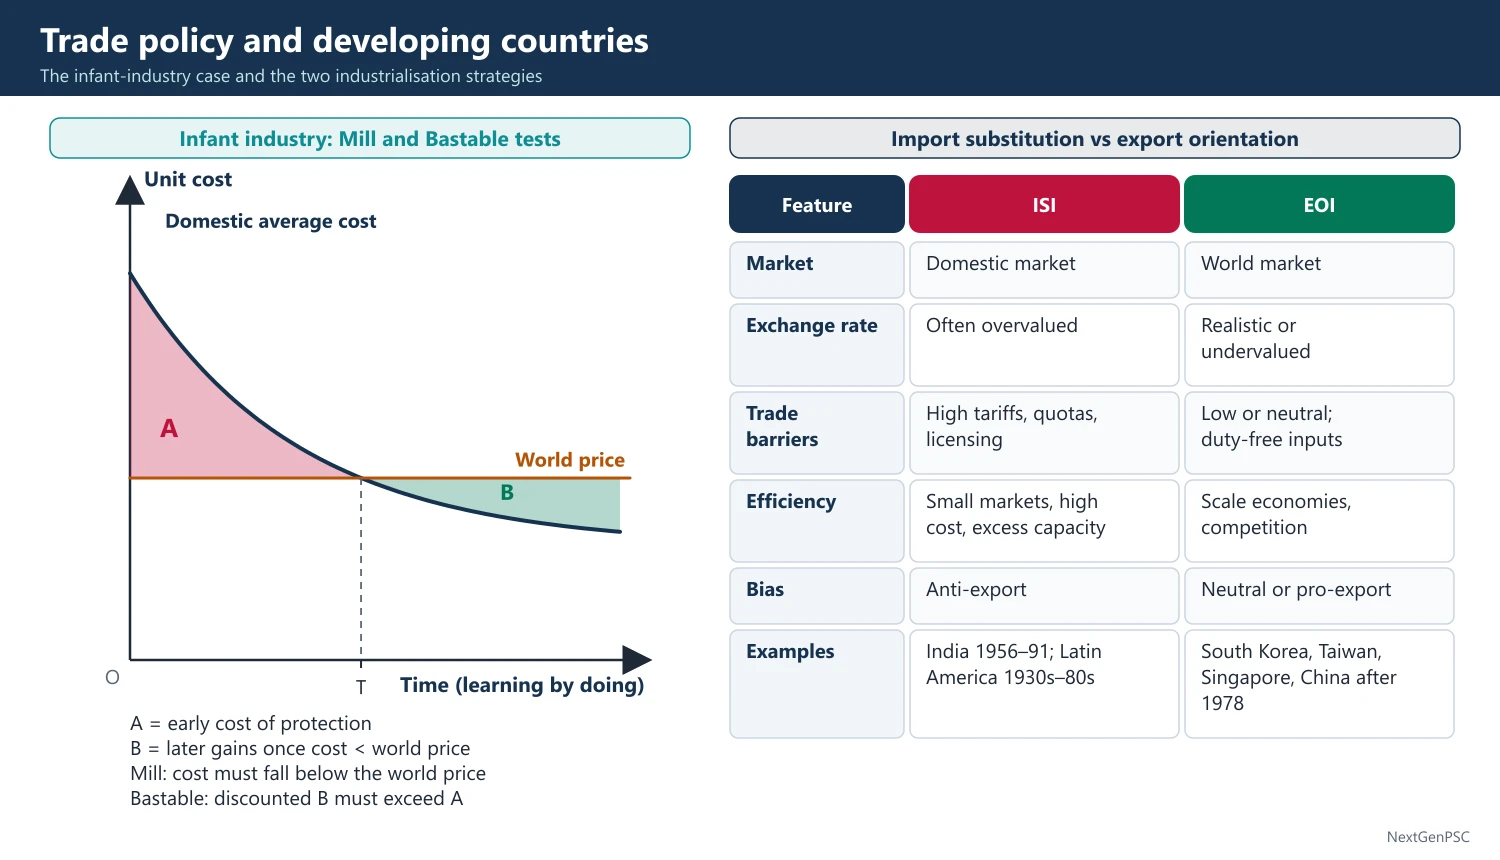
Mill test: the protected industry must eventually survive without protection; Bastable test: the discounted future gains must exceed the present costs of protection; Kemp test: there must be external learning benefits that firms cannot capture, otherwise private capital markets would finance the learning.
Domestic distortions: E.E. Hagen (1958) argued that urban-rural wage differentials make manufacturing look costlier than its social cost, justifying protection.
Export pessimism and terms of trade: Prebisch-Singer (1950) and Nurkse (1959) argued that primary exports had poor prospects, so industrialisation for the home market was needed.
Balance of payments and revenue: tariffs save foreign exchange and are easy to collect where income taxes are weak.
Diversification and employment: reducing dependence on a few commodities and absorbing surplus labour.
Strategic and security reasons: self-reliance in defence, energy and food.
3. Theory of Domestic Distortions and the Ranking of Policies
Bhagwati and Ramaswami (1963): 'Domestic Distortions, Tariffs and the Theory of Optimum Subsidy' (Journal of Political Economy): when the distortion is domestic (wage gap, external economies), the first-best policy is a tax or subsidy at the source of the distortion; a tariff is at best second-best because it adds a consumption distortion.
Johnson (1965): ranked policies for raising domestic production: production subsidy first, tariff second, quota last.
Corden, Trade Policy and Economic Welfare (1974): the principle of targeting: use the instrument that acts most directly on the distortion.
Implication: the infant industry case supports temporary production subsidies or credit, not permanent tariffs; but subsidies need tax revenue, which poor countries may lack, so tariffs are often used in practice.
4. The Experience of Import Substitution
Achievements: rapid initial industrial growth, a diversified industrial base, technical skills and capital goods capacity (India built steel, machinery, chemicals and nuclear capacity).
Costs found by research: I.M.D. Little, Tibor Scitovsky and Maurice Scott, Industry and Trade in Some Developing Countries (1970), Bela Balassa (1971) and the NBER project led by Bhagwati and Krueger (1970s) found very high and uneven effective protection, excess capacity, high-cost production, anti-export bias, neglect of agriculture, capital-intensive techniques despite labour abundance, foreign exchange crises and rent-seeking.
India's case: Jagdish Bhagwati and Padma Desai, India: Planning for Industrialization (1970), and Bhagwati and T.N. Srinivasan, Foreign Trade Regimes and Economic Development: India (1975), documented licensing delays, arbitrary allocation and inefficiency.
Exhaustion of the easy phase: once consumer goods imports are replaced, further ISI in capital goods faces small markets and scale problems, slowing growth.
5. Export Orientation and the East Asian Debate
Neo-classical interpretation: East Asian success came from getting prices right, outward orientation, macro stability and high human capital (World Bank, World Development Report 1987; Krueger; Balassa).
Revisionist (developmental state) interpretation: Alice Amsden, Asia's Next Giant (1989), on South Korea, and Robert Wade, Governing the Market (1990), on Taiwan: governments deliberately 'got prices wrong', directed credit, protected selected industries and disciplined firms with export targets.
Middle ground: World Bank, The East Asian Miracle (1993): fundamentals mattered most, some interventions worked in special institutional conditions; Dani Rodrik stresses investment coordination and institutions; Ha-Joon Chang, Kicking Away the Ladder (2002), argues today's rich countries used protection when developing.
Washington Consensus: John Williamson (1989) listed policies including trade liberalisation, competitive exchange rates and openness to FDI; later criticised for one-size-fits-all reforms.
Sequencing: Ronald McKinnon (1973, 1991) argued for fiscal control first, then domestic financial liberalisation, then current account and finally capital account liberalisation.
6. Developing Countries in the Multilateral System
Special and differential treatment: GATT Part IV (1965) on trade and development, the Generalised System of Preferences (GSP) from 1971 under UNCTAD, and the Enabling Clause (1979) allowing preferences for developing countries.
Uruguay Round bargain: developing countries accepted TRIPS, TRIMs and services rules in exchange for textile quota removal and agricultural reform, a bargain many later saw as unbalanced.
Policy space: WTO rules limit some instruments (export subsidies, local content requirements) used by earlier industrialisers, a concern raised by Rodrik and Chang.
7. Diagrams to Draw
Infant industry: draw output on the horizontal axis and cost on the vertical; draw the domestic average cost curve above the world price line at first, then shifting down over time (learning) below the world price; shade the early cost of protection and the later gains (Bastable test).
Subsidy versus tariff: on a demand-supply diagram for an importable, show that a production subsidy raises domestic output to the same level as a tariff with only the production triangle as loss, while the tariff also has a consumption triangle.
Strategy chart: draw a two-column chart, ISI versus EOI, with rows for exchange rate, tariffs, incentives, market size, efficiency and examples.
8. Examples and Applications
India: ISI from the Second Plan (1956) to 1991; reforms from July 1991 dismantled licensing, devalued the rupee, cut tariffs and removed QRs; the Foreign Trade Policy 2023 (from 1 April 2023, with no fixed end date) aims at exports of 2 trillion US dollars by 2030; RoDTEP (2021) refunds embedded taxes on exports; PLI schemes and Atmanirbhar Bharat (2020) blend export promotion with selective protection.
Latin America: ISI from the 1930s to 1980s ended with debt crises and liberalisation; Chile liberalised early (from 1975).
East Asia: South Korea combined export targets and directed credit with protection of the home market in the 1960s–80s; China combined special economic zones (from 1980) with a protected domestic market.
GSP withdrawal: the US ended India's GSP benefits from 5 June 2019, showing the vulnerability of unilateral preferences.
9. Using it in the Exam
10 marks: infant industry argument with the Mill, Bastable and Kemp tests.
15 marks: ISI versus EOI with India and East Asia, including the costs of ISI.
20 marks: trade policy for developing countries: arguments for protection, theory of domestic distortions and the ranking of policies, the East Asian debate, WTO policy space and India's present policy.
Keywords: infant industry, Mill-Bastable test, export pessimism, ISI, EOI, anti-export bias, domestic distortions, first-best subsidy, developmental state, special and differential treatment.
Statement to quote: Bhagwati and Ramaswami (1963) showed that a domestic distortion is best corrected by a domestic tax or subsidy, not by a tariff.
| Feature | Import substitution (ISI) | Export orientation (EOI) |
|---|---|---|
| Market targeted | Domestic market | World market |
| Exchange rate | Often overvalued | Realistic or undervalued |
| Trade barriers | High tariffs, quotas, licensing | Low or neutral; duty-free inputs for exporters |
| Efficiency and scale | Small markets, high cost, excess capacity | Scale economies, competitive pressure |
| Bias | Anti-export | Neutral or pro-export |
| Examples | India 1956–91, Latin America 1930s–80s | South Korea, Taiwan, Singapore, China after 1978 |
Mains points
- State the infant industry argument with Hamilton and List, then apply the Mill, Bastable and Kemp tests.
- Use the theory of domestic distortions to show why subsidies are first-best and tariffs second-best (Bhagwati-Ramaswami, 1963; Johnson, 1965).
- Present the costs of ISI with research evidence (Little-Scitovsky-Scott, Bhagwati-Desai, Krueger's rent-seeking).
- Present East Asia as a debate: neo-classical versus developmental state (Amsden, Wade) with the World Bank's 1993 middle view.
- Link to India now: Foreign Trade Policy 2023, RoDTEP, PLI, selective tariff increases since 2018 and WTO constraints.
- Common mistake: equating export orientation with laissez-faire; East Asian states intervened heavily.
Did you know?
- Friedrich List borrowed the infant industry idea partly from his years in the United States, where Alexander Hamilton had argued for protecting American manufactures against British competition.
Trade Blocs, Customs Unions and Monetary Unions
Regional integration ranges from preferential trade areas and free trade areas to customs unions, common markets, economic and monetary unions (Balassa, 1961). Jacob Viner, The Customs Union Issue (1950), showed that a customs union is not necessarily good: it causes welfare-raising trade creation but also welfare-reducing trade diversion. A monetary union works best in an optimum currency area (Mundell 1961, McKinnon 1963, Kenen 1969) with labour mobility, openness, diversified economies and fiscal transfers; the euro area's crisis of 2010–12 showed the costs when these are missing.
In simple words
A trade bloc is a group of countries that cut tariffs for each other but not for outsiders, like ASEAN or the European Union.
It is like a club discount: members buy more from each other, which helps if the club member is the cheapest seller, but hurts if a cheaper outsider loses the sale.
Some blocs go further and share one currency, like the euro, which makes trade easy but removes each country's own interest rate and exchange rate.
UPSC asks you to explain trade creation and trade diversion, stages of integration and the theory of optimum currency areas.
1. Stages of Economic Integration
Source: Bela Balassa, The Theory of Economic Integration (1961).
Preferential trade area (PTA): members give each other lower (not zero) tariffs on some goods.
Free trade area (FTA): tariffs among members are removed, but each keeps its own tariffs on outsiders; rules of origin prevent trade deflection (imports entering through the lowest-tariff member).
Customs union (CU): an FTA plus a common external tariff (for example the Southern African Customs Union, the EU customs union).
Common market: a customs union plus free movement of labour and capital (EU single market from 1993).
Economic union: a common market with harmonised economic policies; monetary union: a common currency and central bank (euro area); complete economic integration adds unified fiscal and social policies.
WTO rules: GATT Article XXIV permits FTAs and customs unions covering 'substantially all trade'; the Enabling Clause (1979) allows looser preferences among developing countries; GATS Article V covers services agreements.
2. Viner's Theory of Customs Unions
Source: Jacob Viner, The Customs Union Issue (1950).
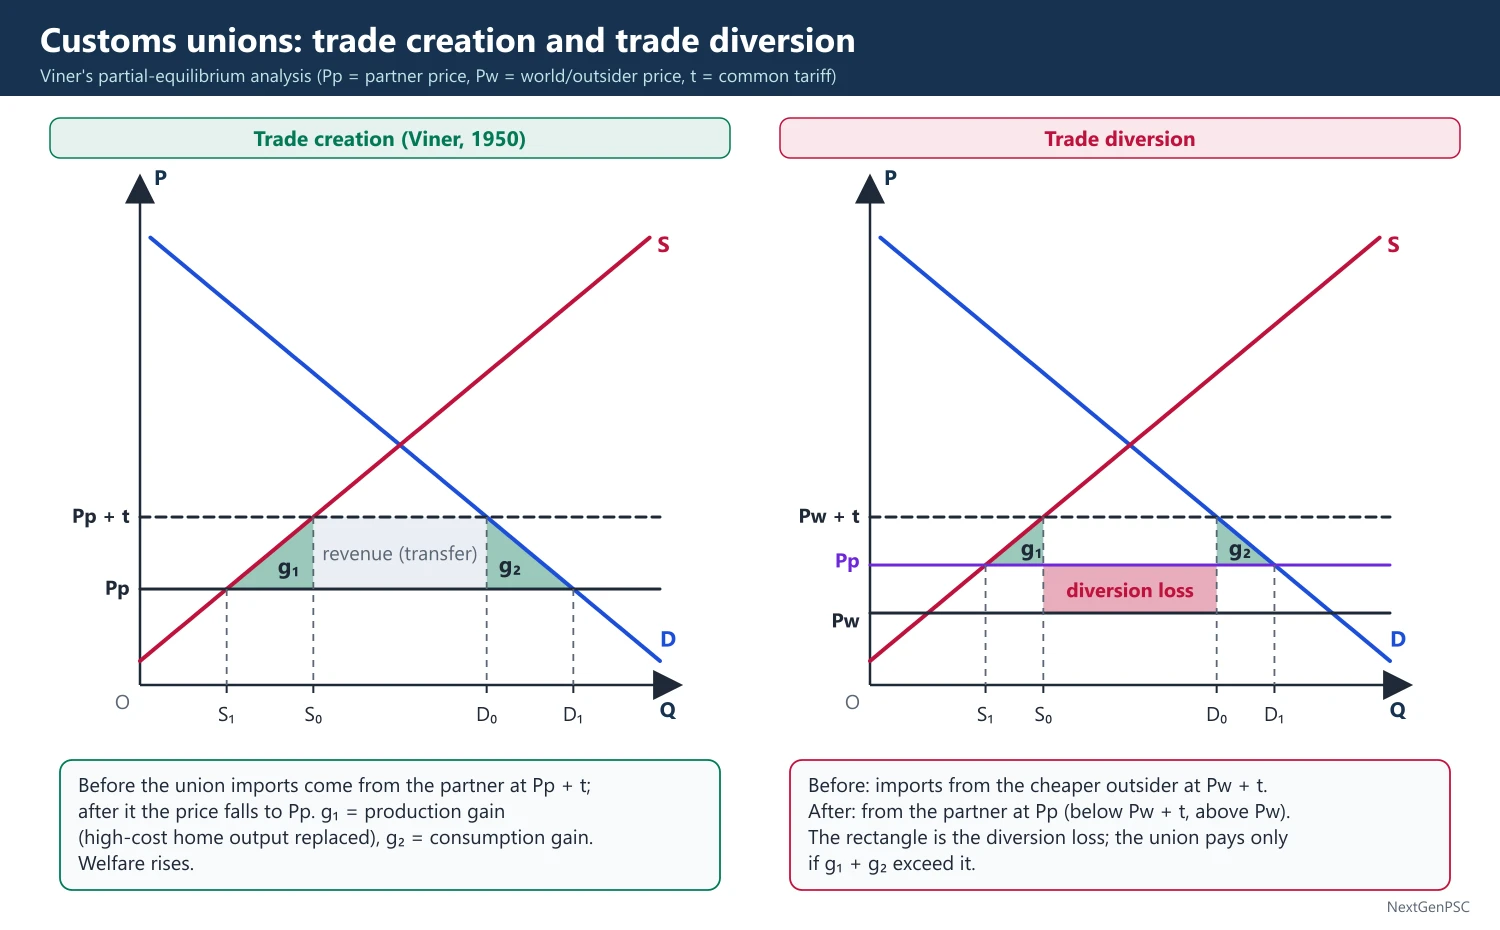
Trade creation: replacement of high-cost domestic production by lower-cost imports from a partner; it raises welfare (production gain) and, with elastic demand, increases consumption (consumption gain).
Trade diversion: replacement of imports from a low-cost outside country by imports from a higher-cost partner because the partner faces no tariff; it lowers welfare because more resources are used to obtain the same goods, and the country loses tariff revenue.
Net effect: a customs union raises welfare if trade creation exceeds trade diversion; it is a case of the theory of the second best (Lipsey and Lancaster, 1956): removing some distortions while others remain need not raise welfare.
Meade (1955) and Lipsey (1957, 1960): added consumption effects: even a trade-diverting union can raise welfare if consumers gain from lower prices on partner goods.
Conditions favouring a beneficial union: high pre-union tariffs among members; low common external tariff; many and large members; members competitive (producing similar goods) but with different cost levels, so there is scope for specialisation; geographical proximity and low transport costs; high pre-union trade among members.
Kemp-Wan theorem (1976): Murray Kemp and Henry Wan showed that a customs union can always be made welfare-improving for members without hurting outsiders by setting the common external tariff so that trade with the rest of the world is unchanged.
Dynamic effects: larger markets give economies of scale, greater competition, more investment and FDI, and faster technology spread; these may outweigh static effects (EU experience).
3. Regionalism and the Multilateral System
Building blocks or stumbling blocks: Jagdish Bhagwati warned that regional agreements divert trade and attention from multilateral liberalisation; others (Lawrence, Baldwin's 'domino theory') see them as building blocks.
Spaghetti bowl: Bhagwati's term (1995) for the tangle of overlapping FTAs with different rules of origin, which raises compliance costs, especially for small firms.
Utilisation problem: many firms do not use FTA preferences because of complex rules of origin; India's FTA utilisation has been reported as low.
Mega-regionals: the Regional Comprehensive Economic Partnership (RCEP, in force from 1 January 2022, which India left in November 2019) and the CPTPP (2018) cover a large share of world trade.
4. Monetary Unions and Optimum Currency Areas
Optimum currency area (OCA): Robert Mundell, 'A Theory of Optimum Currency Areas' (American Economic Review, 1961): a region in which the benefits of a common currency exceed the cost of giving up the exchange rate as an adjustment tool.
Mundell's criterion: high labour mobility between member regions, so that unemployment caused by an asymmetric shock can be absorbed by migration.
McKinnon (1963): the more open the economies (large share of tradables), the less useful the exchange rate and the greater the gain from a common currency.
Kenen (1969): well-diversified economies are less exposed to asymmetric shocks and so are better suited to a common currency; Kenen also stressed fiscal integration (transfers to regions hit by shocks).
Other criteria: wage and price flexibility, similar inflation preferences, symmetric business cycles and political solidarity.
Endogeneity of OCA: Frankel and Rose (1998) argued that a common currency raises trade and synchronises cycles, so a union may become an OCA after it is formed (debated).
Benefits of a monetary union: no exchange rate risk or conversion costs, price transparency, more trade and investment, lower interest rates through credibility.
Costs: loss of independent monetary and exchange rate policy, a 'one size fits all' interest rate, and vulnerability to asymmetric shocks without fiscal transfers.
5. The Euro Area Case
History: Treaty of Rome (1957) created the EEC; the Maastricht Treaty (1992) set the path to monetary union; the euro was launched on 1 January 1999 for accounts and as notes and coins in 2002; Croatia joined as the 20th member in 2023 and Bulgaria as the 21st on 1 January 2026.
Maastricht convergence criteria: inflation within 1.5 percentage points of the three best-performing members; budget deficit not above 3% of GDP; government debt not above 60% of GDP; long-term interest rates within 2 percentage points of the three best; two years in the ERM II without devaluation.
Crisis of 2010–12: Greece, Ireland, Portugal, Spain and Cyprus faced sovereign debt and banking crises; without national currencies they had to adjust through wage cuts and austerity; the European Stability Mechanism (2012), ECB President Mario Draghi's 'whatever it takes' (July 2012) and banking union followed.
Lesson: a monetary union without fiscal union and full labour mobility is fragile, confirming OCA theory.
Other unions: the CFA franc zones in West and Central Africa and the Eastern Caribbean Currency Union.
6. Diagrams to Draw
Trade creation: draw home demand D and supply S; draw the partner's price Pp as a horizontal line and Pp + t above it; before the union home imports at Pp + t (or produces at home); after the union price falls to Pp, domestic output falls, consumption rises; the two triangles are the production and consumption gains.
Trade diversion: draw the world (outsider) price Pw below the partner price Pp; before the union home imports from the outsider at Pw + t; after the union it imports from the partner at Pp (below Pw + t but above Pw); the rectangle (Pp − Pw) × imports is the trade diversion loss; compare with the consumption and production gain triangles.
OCA diagram: draw the degree of economic integration (trade openness) on the horizontal axis and gains or losses on the vertical; the gain (GG) curve rises and the loss (LL) curve falls; joining the union pays to the right of their intersection (Krugman's GG-LL diagram).
Stages ladder: a staircase diagram from PTA to complete economic integration with features added at each step.
7. Examples and Applications
India's agreements: SAFTA (2006); ASEAN-India trade in goods agreement (2010); CEPAs with South Korea (2010) and Japan (2011); India-UAE CEPA (in force May 2022); India-Australia ECTA (December 2022); India-EFTA TEPA (signed March 2024, in force 1 October 2025); India-UK Comprehensive Economic and Trade Agreement (signed 24 July 2025); India-EU FTA negotiations concluded on 27 January 2026.
India and RCEP: India withdrew in November 2019, citing trade deficits with China, inadequate safeguards and rules of origin, a case of fear of trade diversion and import surges.
Other blocs: NAFTA (1994) replaced by USMCA (July 2020); Mercosur (1991); African Continental Free Trade Area (trading from 2021).
8. Using it in the Exam
10 marks: stages of integration (Balassa) or trade creation versus trade diversion with definitions.
15 marks: Viner's analysis with diagrams and conditions for a welfare-raising customs union.
20 marks: monetary unions and OCA theory (Mundell, McKinnon, Kenen), the euro crisis, and India's FTA strategy and RCEP decision.
Keywords: FTA, customs union, common external tariff, rules of origin, trade creation, trade diversion, second best, Kemp-Wan, OCA, asymmetric shocks, convergence criteria, spaghetti bowl.
Statement to quote: Viner (1950) showed that a customs union may reduce welfare if trade diversion outweighs trade creation.
| Stage | Free trade among members | Common external tariff | Free factor movement | Common policies / currency | Example |
|---|---|---|---|---|---|
| Preferential trade area | Partial | No | No | No | SAPTA (1995) |
| Free trade area | Yes | No | No | No | SAFTA, ASEAN-India FTA, USMCA |
| Customs union | Yes | Yes | No | No | Southern African Customs Union |
| Common market | Yes | Yes | Yes | No | EU single market (1993) |
| Economic and monetary union | Yes | Yes | Yes | Yes | Euro area (1999) |
Mains points
- Define trade creation and trade diversion precisely and draw both diagrams; this is the core of most customs union questions.
- List the conditions under which a customs union raises welfare and mention the second-best nature of the problem (Lipsey-Lancaster).
- Add dynamic effects and the Kemp-Wan theorem to go beyond Viner.
- For monetary unions, give Mundell, McKinnon and Kenen criteria and illustrate with the euro crisis.
- Use India's FTA record (UAE CEPA, Australia ECTA, EFTA TEPA in force 2025, UK CETA 2025, EU FTA concluded 2026) and its RCEP exit.
- Common mistake: assuming every regional agreement raises welfare because it 'liberalises trade'.
Did you know?
- Robert Mundell wrote on optimum currency areas in 1961, decades before the euro, and is often called the 'father of the euro'; he received the Nobel Prize in 1999, the year the euro was launched.
GATT and WTO: Rounds, TRIMs, TRIPS and Domestic Measures
The General Agreement on Tariffs and Trade (GATT, 1947) cut tariffs through eight rounds, ending with the Uruguay Round (1986–94), which created the World Trade Organization on 1 January 1995. The WTO rests on most-favoured-nation and national treatment principles and covers goods, services (GATS), intellectual property (TRIPS), investment measures (TRIMs), agriculture and a binding dispute settlement system. Domestic measures such as farm subsidies are disciplined through the amber, blue and green boxes, and trade remedies (anti-dumping, countervailing duties, safeguards) are regulated. The Doha Round (2001) has stalled, the Appellate Body has been non-functional since December 2019, and MC14 at Yaoundé (March 2026) ended with most issues sent back to Geneva.
In simple words
The WTO is the referee and rule-book of world trade: it sets rules on tariffs, subsidies, patents and investment, and settles disputes between countries.
Like cricket rules that apply to every team, its core rule is non-discrimination: a concession given to one member must be given to all.
For India it matters for farm subsidies and food stocks, medicine patents and limits on policies such as local content rules.
UPSC asks about the GATT rounds, TRIMs, TRIPS, the agriculture boxes and India's position in WTO talks.
1. From GATT to WTO
GATT 1947: signed by 23 countries in October 1947 and in force from 1 January 1948, after the proposed International Trade Organization (Havana Charter, 1948) failed to be ratified; India was a founding contracting party.
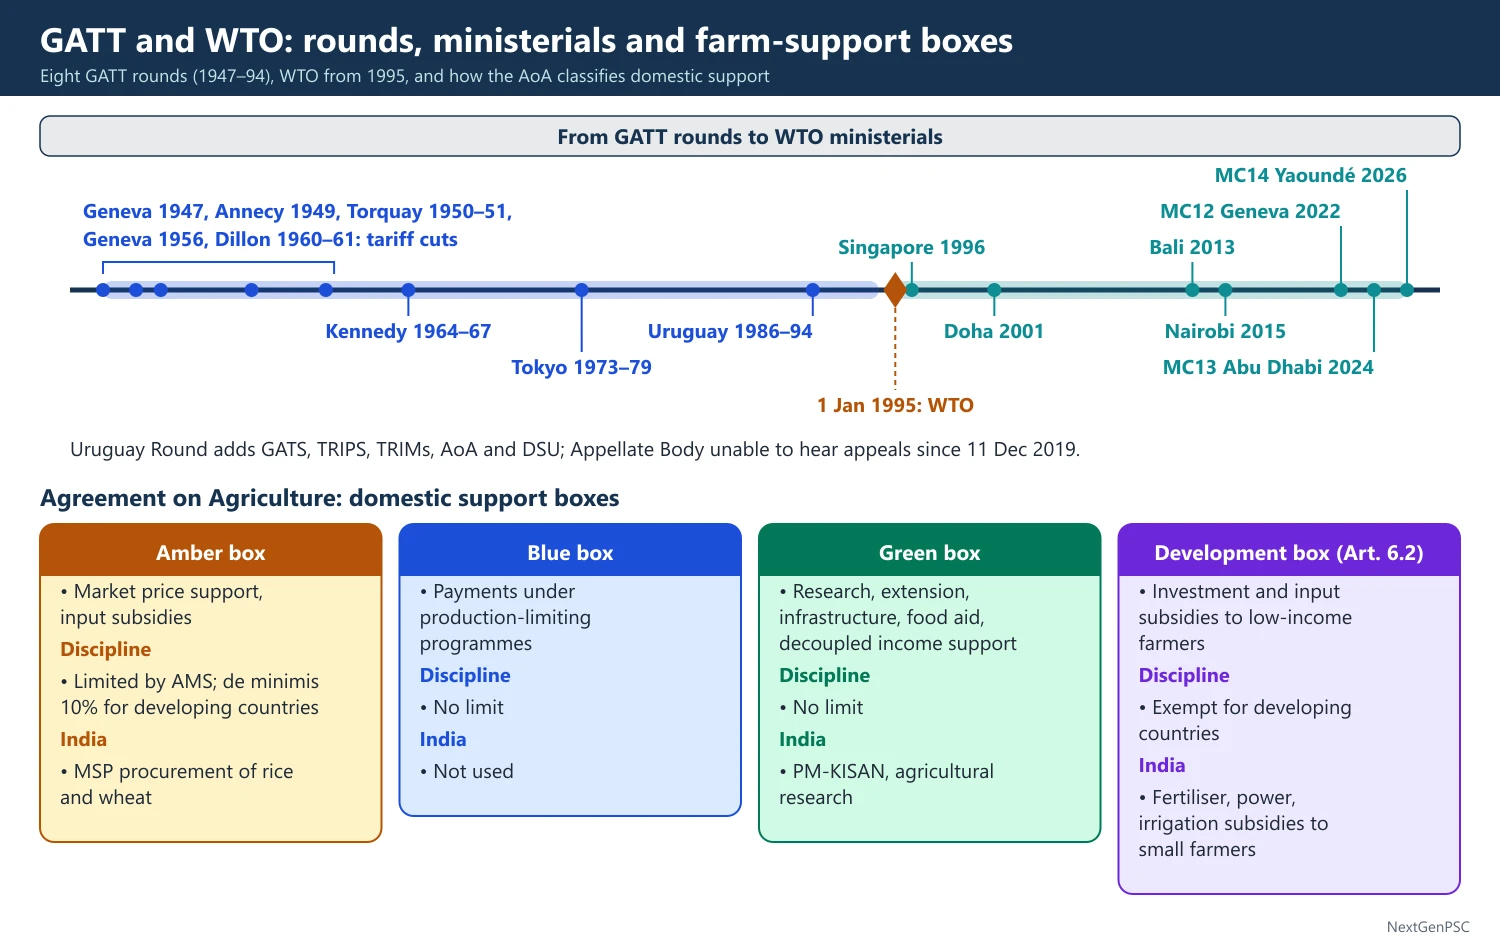
Early rounds: Geneva (1947), Annecy (1949), Torquay (1950–51), Geneva (1956) and the Dillon Round (1960–61) cut tariffs product by product.
Kennedy Round (1964–67): across-the-board tariff cuts and the first Anti-Dumping Code; GATT Part IV on trade and development was added in 1965.
Tokyo Round (1973–79): tariff cuts and plurilateral codes on non-tariff barriers (subsidies, technical barriers, government procurement); the Enabling Clause (1979) for developing countries.
Uruguay Round (1986–94): launched at Punta del Este, concluded with the Marrakesh Agreement (April 1994); brought agriculture and textiles under rules, added services (GATS), TRIPS, TRIMs, and created the WTO with a binding Dispute Settlement Understanding; the Multi-Fibre Arrangement was phased out by 1 January 2005.
WTO: in force from 1 January 1995; 166 members after Comoros and Timor-Leste joined in 2024; decisions by consensus; the Ministerial Conference meets about every two years.
2. Core Principles
Most-favoured-nation (MFN), GATT Article I: any advantage given to one member must be extended to all members; exceptions for FTAs and customs unions (Article XXIV) and preferences for developing countries (Enabling Clause).
National treatment, Article III: imported goods, once inside, must be treated no less favourably than domestic goods in taxes and regulations.
Bound tariffs: members commit not to raise tariffs above bound rates; India's bound rates are much higher than applied rates, giving policy space.
General elimination of quantitative restrictions, Article XI: with exceptions for balance of payments (Articles XII and XVIII:B), and general exceptions (Article XX) for health, environment and conservation, and security exceptions (Article XXI).
Special and differential treatment: longer transition periods and flexibilities for developing and least-developed countries.
3. Trade-Related Investment Measures (TRIMs)
Scope: the TRIMs Agreement applies only to investment measures affecting trade in goods that violate national treatment (Article III) or the ban on quantitative restrictions (Article XI).
Illustrative list of prohibited measures: local content requirements (a firm must buy a share of inputs locally), trade-balancing requirements (imports limited to a share of exports), foreign exchange balancing requirements, and export restrictions linked to local production.
Transition: developed countries had two years, developing countries five years and LDCs seven years to remove notified TRIMs.
Indian cases: India's indigenisation and trade-balancing conditions in the automobile sector were found inconsistent in a dispute brought by the EU and US (panel report, 2001); the US challenged the domestic content requirement in India's National Solar Mission, and the panel and Appellate Body (2016) ruled against India.
Debate: developing countries argue that local content rules are tools of industrial policy once used by developed countries; investment facilitation talks (a plurilateral Investment Facilitation for Development agreement) are opposed by India as outside the WTO's mandate.
4. Trade-Related Aspects of Intellectual Property Rights (TRIPS)
Minimum standards: copyrights (author's life plus 50 years), trademarks, geographical indications (extra protection for wines and spirits, Article 23), industrial designs, layout designs of integrated circuits, trade secrets and patents.
Patents: available for products and processes in all fields of technology, including pharmaceuticals, for at least 20 years from filing (Article 33); plant varieties must be protected by patents or an effective sui generis system (Article 27.3(b)).
Transition: developing countries had until 2000 (2005 for product patents in fields not previously protected, such as pharmaceuticals in India); LDCs have extended transition periods.
Flexibilities: compulsory licensing (Article 31), parallel imports (exhaustion, Article 6), and the Doha Declaration on TRIPS and Public Health (November 2001), which affirmed members' right to protect public health; the Article 31bis amendment (agreed 2005, in force 2017) allows compulsory licences for export to countries without manufacturing capacity.
India's implementation: the Patents (Amendment) Act, 2005 introduced product patents for pharmaceuticals; Section 3(d) bars patents for new forms of known substances without enhanced efficacy (upheld by the Supreme Court in Novartis v Union of India, April 2013); India's first compulsory licence was granted to Natco Pharma for Bayer's cancer drug Nexavar (sorafenib) in 2012; the Protection of Plant Varieties and Farmers' Rights Act, 2001 is India's sui generis system.
COVID-19: India and South Africa proposed a broad TRIPS waiver (October 2020); MC12 (June 2022) adopted a narrower decision easing compulsory licensing for COVID-19 vaccines.
5. Domestic Measures: Agriculture, Subsidies and Trade Remedies
Agreement on Agriculture (AoA) pillars: market access (tariffication of non-tariff barriers and tariff cuts: 36% average over six years for developed, 24% over ten years for developing countries), domestic support and export competition.
Amber box: trade-distorting support (market price support and input subsidies) measured by the Aggregate Measurement of Support (AMS), to be reduced (20% for developed, 13.3% for developing countries); support below the de minimis level (5% of production value for developed, 10% for developing countries) is exempt.
Blue box: payments linked to production-limiting programmes (Article 6.5), not subject to reduction.
Green box: minimally trade-distorting support (research, extension, infrastructure, public stockholding for food security at market prices, domestic food aid, decoupled income support), exempt from limits (Annex 2).
Development box (Article 6.2): investment subsidies and input subsidies to low-income or resource-poor farmers in developing countries are exempt.
Public stockholding issue: India's procurement at MSP counts as market price support calculated against a 1986–88 external reference price, which can breach the 10% de minimis; the Bali Ministerial (2013) gave an interim 'peace clause', made indefinite by the General Council in November 2014, until a permanent solution is agreed; India invoked it for rice from 2018–19 onward.
Export competition: the Nairobi Ministerial (2015) agreed to eliminate agricultural export subsidies (developed countries immediately, developing by 2018 with some extensions to 2023).
Subsidies and Countervailing Measures (SCM) Agreement: prohibited subsidies (export and import-substitution subsidies), actionable subsidies (causing adverse effects), and a non-actionable category that lapsed in 1999; countervailing duties may offset injurious subsidies.
Anti-dumping (GATT Article VI and the Anti-Dumping Agreement): duties allowed when exports are priced below normal value and cause material injury; India is among the most frequent users of anti-dumping measures, mostly against China.
Safeguards (Article XIX and the Safeguards Agreement): temporary protection against import surges causing serious injury, without proving unfair trade.
Other domestic regulations: the SPS Agreement (food safety, animal and plant health) and TBT Agreement (technical standards) require measures to be science-based and non-discriminatory.
6. Doha Round and Recent Ministerials
Doha Development Agenda (2001): focused on agriculture, NAMA, services and development; talks collapsed in July 2008 largely over the special safeguard mechanism for farm imports (India and the US disagreed).
Bali (2013): Trade Facilitation Agreement (in force 22 February 2017) and the peace clause.
Nairobi (2015): elimination of agricultural export subsidies.
MC12, Geneva (June 2022): Agreement on Fisheries Subsidies (curbing subsidies for illegal, unreported and unregulated fishing and for overfished stocks; in force from September 2025), the TRIPS decision on COVID-19 vaccines and food security declarations.
MC13, Abu Dhabi (February–March 2024): Comoros and Timor-Leste joined; no outcome on agriculture or fisheries 'phase two'.
MC14, Yaoundé (March 2026): the moratorium on customs duties on electronic transmissions (in place since 1998) lapsed; decisions and draft texts on WTO reform, e-commerce and other issues were sent to Geneva for further work; agriculture was deferred.
Dispute settlement crisis: the Appellate Body has been unable to hear appeals since 11 December 2019 because the US blocked appointments; some members use the Multi-Party Interim Appeal Arbitration Arrangement (MPIA, 2020), which India has not joined.
7. Diagrams to Draw
Agriculture boxes chart: draw three coloured boxes (amber, blue, green) plus a development box, each with examples and the discipline that applies.
GATT rounds timeline: a horizontal timeline from 1947 to 1994 with the eight rounds, then WTO ministerials from Singapore (1996) to Yaoundé (2026).
Tariffication diagram: show a quota replaced by a tariff equivalent (the gap between domestic and world price) and then cut by the agreed percentage.
8. Using it in the Exam
10 marks: TRIMs (definition, illustrative list, Indian cases) or TRIPS (minimum standards, flexibilities).
15 marks: AoA boxes and India's public stockholding issue with the peace clause.
20 marks: evolution from GATT to WTO through the rounds, WTO principles and agreements, the Doha impasse, the Appellate Body crisis and India's interests.
Keywords: MFN, national treatment, bound tariff, Uruguay Round, AMS, de minimis, green box, peace clause, TRIMs illustrative list, compulsory licence, Section 3(d), Appellate Body, MPIA.
Point to quote: the Doha Declaration (2001) affirmed that TRIPS 'can and should be interpreted and implemented in a manner supportive of WTO members' right to protect public health'.
| Round | Years | Main outcome |
|---|---|---|
| Geneva | 1947 | GATT signed; first tariff cuts |
| Annecy | 1949 | Tariff cuts; new members |
| Torquay | 1950–51 | Tariff cuts |
| Geneva | 1956 | Tariff cuts |
| Dillon | 1960–61 | Tariff cuts; EEC common tariff negotiated |
| Kennedy | 1964–67 | Across-the-board cuts; Anti-Dumping Code |
| Tokyo | 1973–79 | Non-tariff barrier codes; Enabling Clause |
| Uruguay | 1986–94 | WTO, GATS, TRIPS, TRIMs, AoA, DSU |
| Box | Type of support | Discipline | Indian example |
|---|---|---|---|
| Amber | Market price support, input subsidies | Limited by AMS; de minimis 10% for developing countries | MSP procurement of rice and wheat |
| Blue | Payments under production-limiting programmes | No limit | Not used by India |
| Green | Research, extension, infrastructure, food aid, decoupled income support | No limit | PM-KISAN (notified as green box), agricultural research |
| Development (Art. 6.2) | Investment and input subsidies to low-income farmers | Exempt for developing countries | Fertiliser, power and irrigation subsidies to small farmers |
Mains points
- Give a crisp chronology: GATT 1947, eight rounds, Uruguay Round outcomes, WTO 1995, Doha 2001, key ministerials to MC14 (2026).
- For TRIMs, list the illustrative measures and cite India's auto and solar cases.
- For TRIPS, cover minimum standards, flexibilities (compulsory licensing, Doha Declaration, Article 31bis) and India's Section 3(d), Novartis (2013) and Natco (2012).
- Explain the AoA boxes with a table and India's public stockholding problem (1986–88 reference price, peace clause).
- Discuss trade remedies and the Appellate Body crisis to show awareness of current WTO challenges.
- Common mistake: saying TRIMs covers services or FDI rules generally; it covers only goods-related investment measures inconsistent with Articles III and XI.
Did you know?
- GATT was meant to be a temporary agreement until the International Trade Organization was set up, but the ITO never came into being, so the 'provisional' GATT ran world trade rules for 47 years (1948–1994).
UPSC Previous Year Questions: Trade Policy, Protection and the WTO
From 2014 to 2026 UPSC asked 28 question parts (435 marks) from Trade Policy, Protection and the WTO. Tariffs and quotas lead with 12 parts, including two long numericals (quota and tariff welfare effects, effective rate of protection), followed by the WTO (Doha, TRIPS, TRIMs, subsidies: 8 parts), trade blocs and trade strategy for developing countries. Every question below has a model answer written to the UPSC word limit.
In simple words
Read the question and spend five minutes writing your own outline: the concept, the partial-equilibrium diagram with its areas, and the conclusion.
Then read the model answer and tick what you missed: the labelled areas (a, b, c, d), the small versus large country distinction, the WTO agreement and its year.
Solve the numericals yourself first, then compare each step; practise one diagram-based answer a day within the word limit.
1. Tariffs and Quotas: Effects and Comparison
Example 1 (UPSC 2026, 10 marks): "Import tariffs typically result in a net welfare loss for a country". Do you agree? Justify your answer by applying an import tariff for a small economy and a large economy.
Paper and question: Paper I, Q5(a)
Approach: Agree for a small country and qualify for a large one: show the welfare areas of a tariff in partial equilibrium for each case with a diagram.
The statement holds for a small economy but not necessarily for a large one.
Small economy: it cannot affect the world price Pw, so a tariff t raises the domestic price to Pw + t. Consumers lose a + b + c + d; producers gain a; the government collects c. The net loss is b + d: the production distortion (b) from high-cost domestic output replacing imports, and the consumption distortion (d) from reduced consumption. A tariff is always welfare-reducing.
Large economy: by cutting its imports it lowers the world price received by foreign exporters, so part of the tariff is paid by foreigners. Revenue now includes a terms-of-trade gain e (the fall in the world price times imports). Net welfare change = e − (b + d), which is positive for a small tariff, up to the optimum tariff.
Diagram: domestic demand and supply with a horizontal world supply at Pw; the tariff line at Pw + t; label areas a, b, c, d; for the large country show the world price falling to Pw′ and the rectangle e below Pw.
Hence import tariffs usually reduce welfare, but a large country can gain at its partners' expense unless they retaliate.
Example 2 (UPSC 2025, 20 marks): Explain the price effect, protective effect, consumption effect, revenue effect and distributive effect of tariff in partial equilibrium framework.
Paper and question: Paper I, Q6(a)
Approach: Use the partial-equilibrium tariff diagram with labelled areas and explain each effect (price, protective/production, consumption, revenue, redistribution), with the net welfare effect and the role of elasticities.
Consider a small importing country facing a perfectly elastic world supply at price Pw. Under free trade it consumes D₁, produces S₁ and imports D₁ − S₁. An import tariff t is imposed.
Diagram: domestic demand D and supply S; horizontal lines at Pw and Pw + t; production rises from S₁ to S₂ and consumption falls from D₁ to D₂; label area a (between the two price lines left of S₁ above supply), triangle b (S₁ to S₂), rectangle c (S₂ to D₂, the revenue) and triangle d (D₂ to D₁).
Price effect: the domestic price rises from Pw to Pw + t; for a small country by the full tariff, for a large country by less, since the world price falls. Protective (production) effect: domestic output rises from S₁ to S₂, as high-cost domestic producers replace imports; the extra resource cost is triangle b. Consumption effect: consumption falls from D₁ to D₂, causing the loss d. Revenue effect: the government collects t × (D₂ − S₂), area c. Redistributive effect: consumer surplus falls by a + b + c + d, of which a is transferred to producers (higher producer surplus, or economic rent) and c to the government.
Net welfare effect: −(b + d), the deadweight loss. For a large country, the terms-of-trade gain e must be added, so the net effect is e − (b + d).
The size of each effect depends on elasticities: the more elastic is supply, the larger the protective effect and b; the more elastic is demand, the larger the consumption effect and d; with inelastic demand and supply, the revenue effect dominates and the deadweight loss is small. Imports also fall (the trade effect), and if imports fall to zero the tariff becomes prohibitive and no revenue is earned.
Example 3 (UPSC 2024, 10 marks): "Higher tariffs do not increase employment, they just redistribute the unemployed." Do you agree with the statement? Explain.
Paper and question: Paper I, Q5(d)
Approach: Largely agree: explain how a tariff saves jobs in import-competing industries but destroys them elsewhere (exports, user industries, retaliation, exchange rate), give evidence, and note the Keynesian exception.
Largely yes. A tariff raises employment in the protected import-competing industry, but it reduces employment elsewhere, so the aggregate effect is close to zero and the unemployed are redistributed.
Channels of job loss: (i) user industries pay more for protected inputs and become less competitive; (ii) lower imports reduce foreign incomes and demand for the country's exports, and partners often retaliate; (iii) lower demand for foreign currency causes the domestic currency to appreciate, hurting exporters; (iv) consumers spend more on protected goods and less on others. Total employment in the long run depends on aggregate demand, labour-market institutions and productivity, not on the trade balance.
Evidence: studies of the 2018 US steel and aluminium tariffs (Flaaen and Pierce, 2019) found that job gains in steel were outweighed by losses in steel-using manufacturing; the Smoot-Hawley tariff of 1930 provoked retaliation that deepened the Depression.
In a deep recession with fixed exchange rates, a tariff may raise domestic demand in the short run, but only by exporting unemployment (a 'beggar-thy-neighbour' policy).
Example 4 (UPSC 2023, 20 marks): Consider the market for good X for Country 1 and Country 2. The supply and demand functions for Country 1 are given as P = Q + 70 and P = 170 − Q, while that of Country 2 are given as P = 10 + Q and P = 110 − Q. Assume that there are two countries in the world and trade is balanced. Free trade price is stabilized in between autarky prices of both the countries. Based on the above information, answer the following questions:
(i) From the free trade price and zero transportation cost, if the importing country imposes an import quota of 50 units, determine the quantity of good X produced and consumed. Calculate the consumer and producer surplus and protection cost due to import quota.
(ii) From the free trade price, assume that the importing country is small and consider an import tariff of Rs. 10 per unit on good X. Calculate the impact on consumer surplus, producer surplus and government revenue. Does this policy increase national welfare?
Paper and question: Paper I, Q6(a)
Approach: Find autarky and free-trade equilibria from the two countries' curves, then solve (i) the quota case (domestic price, output, consumption, surpluses, deadweight loss and quota rent) and (ii) the small-country tariff case (changes in surpluses, revenue and net welfare), checking each step.
Write the functions as quantities. Country 1: Qs₁ = P − 70, Qd₁ = 170 − P. Country 2: Qs₂ = P − 10, Qd₂ = 110 − P.
Autarky: Country 1: P − 70 = 170 − P gives P = 120, Q = 50. Country 2: P − 10 = 110 − P gives P = 60, Q = 50. Country 1 has the higher price, so it imports and Country 2 exports.
Free trade: imports of Country 1 = 240 − 2P; exports of Country 2 = 2P − 120. Balanced trade: 240 − 2P = 2P − 120, so P = 90, between 60 and 120 as required. Trade = 60 units; Country 1 produces 20 and consumes 80. At P = 90, Country 1's consumer surplus = ½ × 80 × (170 − 90) = 3200 and producer surplus = ½ × 20 × (90 − 70) = 200.
Step 1 (quota of 50): 240 − 2P = 50 gives P = 95 in Country 1. Production = 95 − 70 = 25; consumption = 170 − 95 = 75 (imports 50). Consumer surplus = ½ × 75 × 75 = 2812.5 (a fall of 387.5); producer surplus = ½ × 25 × 25 = 312.5 (a rise of 112.5).
Step 2 (protection cost): production loss = ½ × (25 − 20) × (95 − 90) = 12.5; consumption loss = ½ × (80 − 75) × 5 = 12.5; total protection cost (deadweight loss) = 25. The quota rent at the free-trade price is (95 − 90) × 50 = 250. In the two-country world Country 2 must now export only 50, so its price falls to 85 (2P − 120 = 50), and the rent to licence holders rises to (95 − 85) × 50 = 500, of which 250 is a terms-of-trade gain from Country 2.
Step 3 (tariff of Rs 10, small importer): domestic price = 90 + 10 = 100. Production = 30, consumption = 70, imports = 40. Consumer surplus = ½ × 70 × 70 = 2450, a loss of 750. Producer surplus = ½ × 30 × 30 = 450, a gain of 250. Revenue = 10 × 40 = 400.
Step 4 (net welfare): −750 + 250 + 400 = −100, equal to the two deadweight triangles ½ × 10 × 10 + ½ × 10 × 10 = 50 + 50.
In words: the quota raises Country 1's price to 95, output to 25 and cuts consumption to 75, with a protection cost of 25; the tariff of Rs 10 lowers national welfare by Rs 100, because consumers lose more than producers and the government gain. For a small country, protection does not increase national welfare; only a large country can offset the loss through better terms of trade, as the quota case shows.
Example 5 (UPSC 2022, 10 marks): Under Partial equilibrium analysis, discuss the consumption and revenue effects of tariffs.
Paper and question: Paper I, Q5(c)
Approach: Explain the consumption and revenue effects with the partial-equilibrium diagram, their determinants (elasticities) and welfare meaning.
In partial equilibrium, a tariff t on an importable good raises its domestic price from Pw to Pw + t (for a small country).
Consumption effect: the higher price reduces quantity demanded from D₁ to D₂. Consumers lose surplus, and part of this, the triangle d between D₂ and D₁ under the demand curve, is a pure deadweight loss: units valued above their world cost are no longer consumed. The more elastic the demand, the larger the consumption effect.
Revenue effect: the government collects t × imports = t × (D₂ − S₂), the rectangle c. It is a transfer from consumers, not a loss to the nation. It is largest when demand and supply are inelastic, so that imports fall little; a prohibitive tariff yields no revenue.
Diagram: demand and supply with price lines at Pw and Pw + t; mark the fall in consumption D₁ to D₂, triangle d and rectangle c.
Hence revenue tariffs are best placed on goods with inelastic demand, though this conflicts with equity.
Example 6 (UPSC 2022, 20 marks): Distinguish between nominal and effective rates of protection in Standard Trade Model. Suppose
• nominal tariff on imported good j is 40%,
• tariff rate on input i is 40%,
• cost share of imported input i in the total cost of production of commodity j is 0·5%.
Determine the effective rate of protection and show that in this case nominal tariff rate is equal to the effective rate of protection.
Paper and question: Paper I, Q7(b)
Approach: Define nominal and effective protection (Corden), give the ERP formula and its meaning, then compute the ERP for the given data step by step (interpreting 0.5% and also 0.5) and show it equals the nominal rate.
The nominal rate of protection is the tariff on the final good, the percentage by which its domestic price exceeds the world price. The effective rate of protection (ERP), developed by W.M. Corden (1966) and Harry Johnson, is the percentage increase in value added per unit in a domestic industry made possible by the whole tariff structure, i.e. tariffs on both its output and its imported inputs. Since producers care about value added, the ERP measures the true protection of an activity.
Formula: g = (t − a·tᵢ)/(1 − a), where t is the nominal tariff on the final good, tᵢ the tariff on the input and a the share of the input in the cost of the final good at free-trade prices. If t exceeds tᵢ, the ERP exceeds t (tariff escalation gives high protection to processing); if tᵢ exceeds t, the ERP is below t and can be negative.
Step 1: data: t = 0.40, tᵢ = 0.40, a = 0.5% = 0.005.
Step 2: g = (0.40 − 0.005 × 0.40)/(1 − 0.005) = (0.40 − 0.002)/0.995 = 0.398/0.995 = 0.40, i.e. 40%.
Step 3: if the cost share is read as 0.5 (50%), g = (0.40 − 0.5 × 0.40)/(1 − 0.5) = 0.20/0.50 = 0.40, again 40%.
Step 4 (general proof): when t = tᵢ, g = (t − a·t)/(1 − a) = t(1 − a)/(1 − a) = t, whatever the value of a.
In words: the effective rate of protection is 40%, equal to the nominal tariff, because the output and the imported input are taxed at the same rate, so value added is raised in the same proportion as the price. A uniform tariff therefore gives equal nominal and effective protection, which is why trade economists recommend uniform tariffs to avoid hidden distortions; India's tariff escalation, with low duties on raw materials and high duties on finished goods, gives effective protection well above nominal rates to final-stage processing.
Example 7 (UPSC 2020, 15 marks): Many countries subsidize some of their export industries. Use a partial equilibrium model under perfect competition to illustrate the following effects of an export subsidy for a large country:
(i) Welfare effects of an export subsidy
(ii) Which group is winning and which is losing from the subsidy?
Paper and question: Paper I, Q4(a)
Approach: Use the partial-equilibrium export-subsidy diagram for a large exporter: show the domestic price rise and world price fall, then (i) the welfare areas and net loss including the terms-of-trade loss, and (ii) gainers and losers.
An export subsidy s is a payment per unit exported. Exporters will sell abroad only if the domestic price rises to the export price plus s, so the domestic price rises; for a large country, the extra exports also lower the world price.
Diagram: home demand D and supply S; free-trade world price Pw with exports S₁ − D₁; with the subsidy the domestic price rises to Ps and the foreign (world) price falls to Ps − s, below Pw; production rises to S₂ and domestic consumption falls to D₂, so exports rise. Label areas: a (consumer loss between Pw and Ps up to D₂), b (consumption triangle), c (producer gain beyond a and b), d (production triangle) and the subsidy cost rectangle b + c + d + e + f + g, where e + f + g is the part below Pw caused by the fall in the world price.
(i) Welfare effects: consumer surplus falls by a + b; producer surplus rises by a + b + c; the government pays the subsidy, s × exports = b + c + d + e + f + g. Net national welfare change = −(b + d) − (e + f + g): the consumption and production distortions plus the terms-of-trade loss, since the country now sells its exports more cheaply. A small country loses only b + d; a large country loses more.
(ii) Winners and losers: domestic producers of the exported good and their workers gain; domestic consumers of the good lose (they pay more); taxpayers lose (they finance the subsidy); foreign consumers gain from the lower world price; foreign producers competing with the exports lose.
This is why the WTO Agreement on Subsidies and Countervailing Measures prohibits export subsidies on non-agricultural goods, and the 2015 Nairobi decision committed members to eliminate agricultural export subsidies.
Example 8 (UPSC 2019, 15 marks): In what way does the concept of a positive optimal tariff apply to only large countries and not to small countries? Explain.
Paper and question: Paper I, Q7(a)
Approach: Define the optimal tariff, derive t* = 1/(e* − 1), show why it is zero for a small country (infinitely elastic foreign supply) and positive for a large one, with the welfare diagram, and note retaliation.
The optimal tariff is the tariff that maximises a country's national welfare by balancing the terms-of-trade gain against the efficiency loss. Its formula is t* = 1/(e* − 1), where e* is the elasticity of the foreign export supply (or of the foreign offer curve).
Small country: it is a price taker; foreign supply is perfectly elastic (e* infinite), so t* = 0. A tariff cannot lower the world price; the whole tariff falls on domestic consumers, and the only effect is the deadweight loss (b + d). Free trade is optimal.
Large country: its imports are a significant share of world demand, so a tariff reduces world demand and lowers the price foreign exporters receive; part of the tariff is borne by foreigners. The terms-of-trade gain (e) rises with the tariff at first while the deadweight loss rises with its square; the optimal tariff is where the marginal gain equals the marginal loss. Since e* is finite, t* is positive; the less elastic the foreign supply, the higher t*.
Diagram: net welfare against the tariff rate is an inverted U, zero at free trade, rising to a maximum at t*, falling and becoming negative at higher rates up to the prohibitive tariff; in offer-curve terms, the optimal tariff makes the tariff-ridden home offer curve cut the foreign offer curve where it is tangent to the highest home trade indifference curve.
The gain is at the expense of trading partners, so world welfare falls, and partners may retaliate, leaving both worse off (a tariff war); this is why the WTO binds tariffs.
Example 9 (UPSC 2018, 15 marks): A quota on import and an equal-import tariff are equivalent in a competitive market but not under monopoly. Explain.
Paper and question: Paper I, Q6(b)
Approach: Show the equivalence under perfect competition (same price, output, imports, with quota rent equal to revenue), then Bhagwati's non-equivalence with a domestic monopolist (tariff limits price; quota creates monopoly power), with diagrams.
Competitive market: a tariff t raises the domestic price to Pw + t and cuts imports to M. A quota that limits imports to the same M raises the domestic price to exactly the same level, because domestic supply plus M must equal demand. Price, production, consumption and imports are identical; the only difference is that the tariff revenue becomes a quota rent to licence holders (unless licences are auctioned). This is the equivalence of tariffs and quotas.
Monopoly: Jagdish Bhagwati (1965) showed that the equivalence breaks down when the domestic industry is a monopoly. Under a tariff, the monopolist cannot charge more than Pw + t, because consumers could import at that price; it faces a horizontal demand curve at Pw + t and behaves like a competitive firm, producing where MC = Pw + t. Under an equivalent quota, imports are fixed at M, so the monopolist faces the residual demand curve (market demand minus M), with its own downward-sloping marginal revenue curve; it maximises profit where MR = MC, producing less and charging a higher price than under the tariff.
Diagram: domestic demand D, the monopolist's MC, the line at Pw + t; under the tariff output where MC meets Pw + t; under the quota, the residual demand D − M and its MR, with output where MR = MC and a higher price read from D − M.
Hence, with monopoly, a quota is more restrictive and costlier to consumers than an equivalent tariff, which is why economists prefer tariffs to quotas, and why the WTO generally prohibits quantitative restrictions (GATT Article XI).
Example 10 (UPSC 2017, 10 marks): Determine optimum tariff of a country with the help of offer curve.
Paper and question: Paper I, Q5(c)
Approach: Use offer curves and trade indifference curves: show that the optimum tariff makes the home tariff-ridden offer curve cut the foreign offer curve at its tangency with the highest home trade indifference curve; give the elasticity formula.
The optimum tariff is the tariff that maximises the welfare of the tariff-imposing (large) country. In offer-curve analysis, the home country's welfare from trade is shown by its trade indifference curves (Meade), and its trading possibilities are constrained by the foreign offer curve.
Under free trade, equilibrium is at the intersection of the two offer curves, where a home trade indifference curve cuts the foreign offer curve. By imposing a tariff, the home country shifts its offer curve towards its import axis and moves the equilibrium along the foreign offer curve. The best point is where the foreign offer curve is tangent to the highest attainable home trade indifference curve; the optimum tariff is the one that makes the tariff-ridden home offer curve pass through that point.
Diagram: home exports on the horizontal axis and imports on the vertical; the foreign offer curve; home trade indifference curves; the free-trade point E and the optimum point T, where the foreign offer curve touches the highest home trade indifference curve.
The optimum tariff rate is t* = 1/(e − 1), where e is the elasticity of the foreign offer curve; if e is infinite (a small country), t* = 0.
Example 11 (UPSC 2017, 15 marks): "The consumption and production effects of a tariff for a commodity depend on the elasticities of demand and supply respectively." Discuss.
Paper and question: Paper I, Q6(a)
Approach: Show with two diagrams how the production (protective) effect depends on supply elasticity and the consumption effect on demand elasticity, with the deadweight triangles, extreme cases and examples.
A tariff t raises the domestic price of an importable from Pw to Pw + t (small country). The resulting changes in domestic production and consumption are the production and consumption effects, and their size depends on elasticities, so the statement is correct.
Production effect: the rise in domestic output ΔS ≈ es × S × (t/Pw), where es is the price elasticity of supply. The more elastic the supply, the more domestic producers expand and the larger the production deadweight loss, ½ × t × ΔS. If supply is perfectly inelastic, there is no production effect and the tariff merely raises producers' rent.
Consumption effect: the fall in consumption ΔD ≈ ed × D × (t/Pw), where ed is the price elasticity of demand. The more elastic the demand, the larger the fall and the larger the consumption deadweight loss, ½ × t × ΔD. With perfectly inelastic demand there is no consumption effect and consumers simply pay the tariff.
Diagram: two panels with the same tariff; in one, flat supply and demand give large changes in production and consumption, a small revenue rectangle and large triangles; in the other, steep curves give small changes, a large revenue rectangle and small triangles.
Implications: a tariff on goods with elastic supply gives strong protection, while a tariff on goods with inelastic demand and supply, such as crude oil or essential medicines, mainly raises revenue with little deadweight loss but burdens consumers. Together these elasticities also determine the trade effect (the fall in imports) and the revenue effect.
Example 12 (UPSC 2014, 10 marks): Analyse the partial equilibrium effects of a tariff imposed by a large country on its imports in terms of consumers' surplus.
Paper and question: Paper I, Q5(e)
Approach: Show the large-country tariff diagram: domestic price rises by less than the tariff, world price falls; trace the change in consumer surplus and the other areas, and the net effect.
When a large country imposes a tariff t, its reduced import demand lowers the world price from Pw to Pw′, so the domestic price rises only to Pw′ + t, less than Pw + t: foreign exporters bear part of the tariff.
Consumer surplus: consumers pay the higher domestic price, so their surplus falls by the area between the old and new domestic prices up to the demand curve, a + b + c + d. This loss is smaller than for a small country with the same tariff, because the domestic price rises by less.
Of this loss, a goes to producers and c to the government; b and d are deadweight losses. Government revenue also includes e, the fall in the world price times imports, paid by foreigners. Net welfare = e − (b + d), positive for a moderate tariff.
Diagram: domestic demand and supply; world price falls from Pw to Pw′; domestic price Pw′ + t; areas a, b, c, d above Pw and rectangle e between Pw and Pw′ over the new imports.
2. Trade Policy and Developing Countries
Example 13 (UPSC 2024, 15 marks): Discuss the issues (pros and cons) in the debate over import substitution and export promotion strategy for developing countries. Which strategy would you favour and why? Explain.
Paper and question: Paper I, Q7(c)
Approach: Set out the case for and against import substitution (ISI) and export promotion (EP), with Latin American, East Asian and Indian experience, then take a reasoned position.
Import substitution industrialisation (ISI) protects domestic industry with tariffs, quotas and licences so that goods previously imported are produced at home. Export promotion (EP) integrates the economy with world markets and encourages industries that can compete abroad.
ISI, pros: infant-industry protection (List, Hamilton), building an industrial base, saving foreign exchange, and the Prebisch-Singer and Nurkse export pessimism. Cons: high-cost, inefficient industries, small markets that prevent scale economies, anti-export bias through overvalued currencies, rent-seeking under licensing (Krueger, 1974), capital-intensive production with few jobs, and recurring foreign-exchange crises, as in Latin America and India before 1991.
EP, pros: specialisation by comparative advantage, scale economies, competitive discipline, technology through FDI and learning, labour-intensive employment and foreign-exchange earnings; the East Asian economies grew rapidly this way. Cons: exposure to world demand shocks and protectionism, the 'fallacy of composition' if all developing countries export the same goods, and the risk of a race to the bottom on wages.
Position: I favour export promotion combined with selective, time-bound support for new industries. East Asia itself used protection and industrial policy, but made support conditional on export performance; India's own growth accelerated after the 1991 reforms opened the economy. Today global value chains make it costly to protect inputs, so the PLI schemes (2020), which reward incremental production including exports, and investment in infrastructure and skills are the better route than broad import substitution.
Example 14 (UPSC 2022, 20 marks): State the functions of United Nations Conference on Trade and Development (UNCTAD). Do you think that UNCTAD has been successful in extending economic cooperation among the developing countries? Justify your answer.
Paper and question: Paper I, Q8(a)
Approach: State UNCTAD's origin and functions, then assess its record in South-South cooperation (GSP, GSTP, commodity agreements, Common Fund, G-77, research) with successes and limits, and conclude.
The United Nations Conference on Trade and Development (UNCTAD) was set up in 1964 in Geneva as a permanent body of the UN General Assembly, with Raúl Prebisch as its first Secretary-General, to address the trade and development problems of developing countries. The Group of 77 developing countries was formed at its first conference.
Functions: (i) to promote international trade to accelerate development; (ii) to formulate principles and policies on trade, commodities, finance, investment and technology; (iii) to act as a forum for negotiations between developed and developing countries; (iv) research and technical assistance, such as the World Investment Report and the ASYCUDA customs software.
Achievements in cooperation among developing countries: it secured the Generalised System of Preferences (agreed at UNCTAD II, New Delhi, 1968), giving developing-country exports preferential access to rich markets; it hosted negotiations on the Global System of Trade Preferences among developing countries (in force 1989), in which India participates; it promoted the Integrated Programme for Commodities and the Common Fund for Commodities (agreed 1980, operational 1989); it gave the G-77 a common platform and backed the New International Economic Order (1974); and its analysis shaped developing-country positions in GATT and WTO talks.
Limitations: GSP preferences were unilateral, limited and often withdrawn; most commodity agreements collapsed by the 1980s and the Common Fund remained small; the GSTP has had limited coverage and little effect on trade; and with the WTO's creation in 1995, binding trade negotiations moved to the WTO, leaving UNCTAD mainly an advisory and research body.
Hence UNCTAD has been successful as a voice, think tank and source of technical support for the South, but only partly successful in building effective economic cooperation among developing countries.
Example 15 (UPSC 2019, 20 marks): How can controls on foreign trade contribute to the development of developing countries?
Paper and question: Paper I, Q2(c)
Approach: Explain the developmental arguments for trade controls (infant industry, foreign-exchange and BoP, terms of trade, revenue, industrialisation and employment, protection against dumping and volatility), with Indian and East Asian examples, then the costs and conditions for success.
Controls on foreign trade include tariffs, quotas, import licensing, exchange controls, export duties and subsidies. Although free trade maximises static efficiency, developing countries have used controls to promote development.
Contributions: (i) infant-industry protection (Hamilton, List): temporary protection lets new industries gain scale and experience until they can compete, as with Korea's steel and shipbuilding and India's early automobile and pharmaceutical industries; (ii) balance of payments: import and exchange controls conserve scarce foreign exchange for capital goods and essentials, as in India's planning era; (iii) industrialisation and diversification away from primary exports facing declining terms of trade (Prebisch-Singer), reducing vulnerability to commodity price swings; (iv) revenue: customs duties are easy to collect where income taxes are hard to administer; (v) terms of trade: export taxes or restraints by large suppliers can raise export prices; (vi) employment and protection of vulnerable sectors such as small farmers against subsidised imports; (vii) protection against dumping through anti-dumping and safeguard duties; (viii) strategic and security goals, such as food and defence self-reliance.
Conditions and costs: controls help only when temporary, selective and tied to performance; East Asian countries used protection with export targets and competition, whereas long-lasting, indiscriminate controls in India and Latin America created high-cost industries, rent-seeking under the licence raj (Krueger, 1974), anti-export bias and slow growth. Controls also invite retaliation and are limited by WTO rules.
Current practice: India's tariff increases on electronics and solar equipment since 2018, combined with production-linked incentives from 2020, aim to build domestic capacity within value chains.
Hence trade controls can contribute to development as a temporary, targeted tool within an outward-oriented strategy, but become a drag when used as a permanent substitute for competitiveness.
3. Trade Blocs, Customs Unions and Monetary Unions
Example 16 (UPSC 2025, 15 marks): Define the concepts of trade creation and trade diversion. Explain their role in the context of gains from trade bloc.
Paper and question: Paper I, Q6(b)
Approach: Define trade creation and trade diversion (Viner, 1950) with a numerical or diagrammatic illustration, then explain how their balance determines the gains from a bloc and the conditions favouring trade creation.
Jacob Viner (The Customs Union Issue, 1950) showed that a customs union, which removes tariffs among members but keeps a common external tariff, is not necessarily a move towards free trade.
Trade creation occurs when high-cost domestic production is replaced by cheaper imports from a partner after internal tariffs are removed. Trade diversion occurs when imports from a low-cost outside country are replaced by imports from a higher-cost partner, because the partner no longer pays the tariff.
Illustration: suppose India produces a good at ₹100, country A (a partner) at ₹90 and country B (outside) at ₹80, and India's tariff is 50%. Before the union India imports from B at ₹120. After forming a union with A, A's good costs ₹90 while B's still costs ₹120, so India switches to A: consumers gain, but the country now pays ₹90 instead of ₹80 for each unit, and loses revenue of ₹40 per unit, a diversion loss.
Gains from a bloc depend on whether trade creation outweighs trade diversion. Creation is more likely when members' economies are competitive (similar products) but with different costs, when pre-union tariffs were high and the common external tariff is low. Dynamic gains (scale, competition, investment) add to the static ones.
Thus a bloc raises welfare only if trade creation dominates.
Example 17 (UPSC 2021, 20 marks): What are the different categories of trade blocks? Are trade blocks beneficial to less developed economies? Justify your answer.
Paper and question: Paper I, Q7(c)
Approach: Classify trade blocs (Balassa's stages: PTA, FTA, customs union, common market, economic union, monetary union) with examples, then weigh benefits and costs for less developed economies (trade creation and diversion, scale, FDI, bargaining power; small markets, similar products, unequal gains, spaghetti bowl), and conclude.
Categories (Bela Balassa, 1961, stages of integration): (i) preferential trade agreement: lower tariffs on some goods; (ii) free trade area: no tariffs among members, each keeps its own external tariff (SAFTA, 2006; ASEAN Free Trade Area; USMCA); (iii) customs union: free trade plus a common external tariff (Southern African Customs Union, Mercosur); (iv) common market: plus free movement of labour and capital; (v) economic union: plus harmonised economic policies (the EU); (vi) monetary union: a common currency and central bank (the euro area).
Benefits for LDCs: (i) trade creation where partners are lower-cost producers; (ii) larger markets that permit economies of scale and industrialisation that small national markets cannot support; (iii) greater competition and efficiency; (iv) attraction of FDI to serve the regional market; (v) collective bargaining power in multilateral negotiations; (vi) regional value chains, as ASEAN countries built in electronics.
Costs and limits: (i) trade diversion towards higher-cost partners; (ii) LDCs often produce similar primary goods and trade little with each other (intra-SAARC trade is about 5% of members' total trade); (iii) gains concentrate in the more industrialised members (Kenya in the old East African Community), causing tensions and break-ups; (iv) loss of tariff revenue; (v) overlapping agreements create a 'spaghetti bowl' of rules of origin (Bhagwati).
Evidence: ASEAN shows successful integration through openness and value chains, while SAFTA and many African blocs achieved little until recent efforts such as the African Continental Free Trade Area (operational from 2021).
Hence trade blocs benefit LDCs when they are open (low external tariffs), include complementary economies and are backed by infrastructure and trade facilitation; inward-looking blocs among similar poor economies bring few gains.
Example 18 (UPSC 2020, 15 marks): Explain how trade blocks are important in the process of economic globalization. Illustrate your answer with suitable examples.
Paper and question: Paper I, Q7(b)
Approach: Explain how trade blocs act as building blocks of globalisation (deeper integration, value chains, investment, new rules, bargaining), with examples (EU, ASEAN, USMCA, RCEP, CPTPP, India's FTAs), and note the stumbling-block view.
Trade blocs are agreements among groups of countries to reduce barriers among themselves; the number of regional trade agreements notified to the WTO has grown to several hundred since 1990.
Importance for globalisation: (i) deeper and faster liberalisation: blocs cut tariffs and also cover services, investment, standards and competition, which multilateral talks have struggled to achieve, as the EU's single market shows; (ii) regional value chains: the North American agreement (NAFTA, 1994, now USMCA, 2020) integrated car production across the US, Mexico and Canada, and ASEAN and East Asian agreements built electronics networks; (iii) investment: larger, rule-bound markets attract FDI; (iv) laboratories for new rules on digital trade, e-commerce and intellectual property, later taken to the WTO; (v) building blocks: open regionalism can expand membership and converge towards multilateral free trade, as with the EU's enlargement and RCEP (signed 2020) linking ASEAN, China, Japan, Korea, Australia and New Zealand.
India has used FTAs for market access, such as the India-UAE CEPA (2022), the India-Australia ECTA (2022) and the India-EFTA TEPA (2024), though it stayed out of RCEP in 2019.
Bhagwati warned that blocs can be stumbling blocks, diverting trade and creating a 'spaghetti bowl' of rules of origin. They support globalisation when they are open and WTO-consistent (GATT Article XXIV).
Example 19 (UPSC 2015, 20 marks): Distinguish between Monetary union and Economic union. Do the proliferating trading blocks adversely affect the free trade in the world? Give reasons for your answer.
Paper and question: Paper I, Q6(b)
Approach: Distinguish monetary union and economic union (definitions, components, examples, preconditions such as Mundell's optimum currency area), then examine whether proliferating blocs harm world free trade (building versus stumbling blocks) with reasons, and conclude.
Economic union (in Balassa's stages) is a common market (free trade, a common external tariff and free movement of labour and capital) plus harmonisation of national economic policies, such as fiscal, competition, social and regulatory policies, as in the European Union. Monetary union means members share a single currency (or irrevocably fixed exchange rates) and a common monetary policy run by a common central bank, as in the euro area (since 1999, with the European Central Bank). Robert Mundell's optimum currency area theory (1961) says a monetary union works best when labour is mobile, wages flexible, shocks symmetric and fiscal transfers available; the euro crisis of 2010–12 showed the costs when these conditions are weak.
Do proliferating blocs harm free trade? Arguments that they do (stumbling blocks): (i) trade diversion from efficient outsiders (Viner); (ii) the 'spaghetti bowl' of overlapping rules of origin raises compliance costs (Bhagwati); (iii) governments and lobbies divert negotiating energy from the WTO, as the Doha Round stalled while FTAs multiplied; (iv) large blocs gain bargaining power and may raise external barriers.
Arguments that they do not (building blocks): (i) most blocs have lowered barriers overall and created more trade than they diverted; (ii) they liberalise areas the WTO has not, such as services and investment; (iii) open regionalism, as in APEC and ASEAN, extends preferences to others; (iv) competitive liberalisation pushes outsiders to join or negotiate (Baldwin's domino effect).
Hence proliferating blocs are not necessarily harmful to world free trade; they are building blocks when open, comprehensive and consistent with WTO rules, and stumbling blocks when they are discriminatory and replace multilateralism. Strengthening the WTO alongside regional agreements is the best safeguard.
Example 20 (UPSC 2014, 20 marks): "With the Doha Round of multilateral trade talks stalled, regional trade agreements (RTAs) have emerged as an alternative approach to increase trade, spur stronger economic growth and lower unemployment rates in the participating countries." Explain.
Paper and question: Paper I, Q6(a)
Approach: Explain why the Doha Round stalled and how RTAs emerged as an alternative, then the channels through which RTAs raise trade, growth and employment, with evidence and caveats (diversion, spaghetti bowl, exclusion), and conclude.
The Doha Development Round, launched in November 2001, stalled over agriculture (rich countries' subsidies and developing countries' demand for a special safeguard mechanism), non-agricultural market access and services; talks collapsed in July 2008 and the consensus-based single undertaking made progress slow. Meanwhile the number of regional trade agreements (RTAs) grew rapidly, including mega-regional negotiations such as the Trans-Pacific Partnership and RCEP.
How RTAs increase trade: removing tariffs among a smaller group is easier to negotiate; RTAs create trade where partners are efficient producers and lower trade costs through customs cooperation, mutual recognition of standards and investment rules. They also cover 'WTO-plus' areas such as services, investment and competition.
Growth: larger markets allow economies of scale, attract FDI, intensify competition and integrate members into regional value chains, raising productivity, as in the EU single market and the ASEAN electronics networks.
Employment: export-oriented and labour-intensive sectors expand, and FDI creates jobs, as Mexico's manufacturing employment grew under NAFTA, though some import-competing sectors lose jobs and adjustment assistance is needed. For India, agreements with ASEAN (2010), Korea (2010) and Japan (2011) aimed to expand market access.
Caveats: RTAs can divert trade from efficient outsiders; overlapping rules of origin create a 'spaghetti bowl' (Bhagwati); excluded developing countries lose; and India's trade deficits with ASEAN after its FTA show that gains depend on competitiveness and utilisation of preferences.
Hence RTAs are a useful second-best route to liberalisation and growth while the multilateral process is stalled, but they cannot fully replace the WTO's non-discriminatory system.
4. GATT and WTO: Rounds, TRIMs, TRIPS and Domestic Measures
Example 21 (UPSC 2026, 10 marks): Explain the "Single Undertaking" principle used in the Doha Round and its implications for WTO negotiations.
Paper and question: Paper I, Q5(e)
Approach: Define the single undertaking ('nothing is agreed until everything is agreed'), its origin in the Uruguay Round and use in Doha, then its implications (trade-offs and leverage versus deadlock) and the shift to plurilateral and piecemeal deals.
The single undertaking principle means that every item of a negotiating round is part of one indivisible package: 'nothing is agreed until everything is agreed', and all members accept all agreements. It was used in the Uruguay Round (1986–94), which created the WTO, and the Doha Ministerial Declaration (2001) applied it to the Doha Development Agenda.
Implications: (i) it allows cross-issue trade-offs: developing countries could accept concessions in one area (e.g. industrial tariffs) in return for gains in another (agriculture), giving weaker members leverage; (ii) it prevents 'cherry-picking' by powerful members.
(iii) But with over 160 members and consensus decision-making, a deadlock on one issue, such as agricultural subsidies or the special safeguard mechanism in 2008, blocks the whole round, which is why Doha stalled.
WTO members have therefore moved to piecemeal results, such as the Trade Facilitation Agreement (Bali, 2013) and the fisheries subsidies agreement (2022), and to plurilateral initiatives, which India has often resisted as undermining multilateralism.
Example 22 (UPSC 2026, 15 marks): Explain whether the parallel imports violate provisions of TRIPS and affect the pricing policy of a patent holder MNC. Give reasons why all rich nations do not follow this?
Paper and question: Paper I, Q6(c)
Approach: Define parallel imports and exhaustion, show that TRIPS (Article 6, Doha Declaration 2001) leaves the choice to members so they do not violate TRIPS, explain the effect on an MNC's price discrimination, and why many rich countries restrict them.
Parallel imports are genuine patented or branded goods, put on the market abroad by the right-holder, and imported without its permission into another country where it sells at a higher price. Whether this is allowed depends on the doctrine of exhaustion: under international exhaustion, the first authorised sale anywhere ends the right-holder's control; under national (or regional) exhaustion, rights are exhausted only by sale within the country (or region).
TRIPS: parallel imports do not violate TRIPS. Article 6 states that nothing in the agreement shall be used to address the issue of exhaustion, and the Doha Declaration on TRIPS and Public Health (2001) confirmed that each member is free to establish its own exhaustion regime. India's Patents Act permits imports of patented products from a person authorised by the patentee (section 107A(b)).
Effect on MNC pricing: patent-holding firms practise third-degree price discrimination, charging lower prices in poor, price-elastic markets and higher prices in rich ones. Parallel imports allow arbitrage from low-price to high-price markets, eroding the price gap and the firm's profits.
Why rich nations do not all allow them: they host the right-holders and want to protect R&D incentives and revenues; and they want to keep tiered pricing for poor countries viable. The EU therefore applies regional exhaustion within the European Economic Area, though the US Supreme Court adopted international exhaustion for patents in Impression Products v. Lexmark (2017).
Example 23 (UPSC 2025, 20 marks): Explain the role of World Trade Organization (WTO) in the present context. Discuss the merits and demerits of TRIMs and TRIPs.
Paper and question: Paper I, Q8(a)
Approach: Explain the WTO's functions and its present-day role and challenges (dispute settlement crisis, stalled negotiations, rising protectionism, new issues), then the merits and demerits of TRIMs and TRIPS, with India's experience.
The World Trade Organization, set up on 1 January 1995 after the Uruguay Round, administers trade agreements, provides a forum for negotiations, settles disputes, monitors trade policies and helps developing countries. It rests on non-discrimination (most-favoured-nation and national treatment), binding tariffs, transparency and special and differential treatment.
Present role and challenges: it still provides the rules for most world trade and a stable baseline of bound tariffs, but (i) its Appellate Body has been unable to function since December 2019, when the US blocked appointments, weakening enforcement; (ii) the Doha Round has stalled, with only partial outcomes such as the Trade Facilitation Agreement (2013, in force 2017) and the fisheries subsidies agreement (2022); (iii) unilateral tariffs, US-China trade conflict and industrial subsidies test its rules. Its role today is to preserve a rules-based system and reform itself.
TRIMs, merits: by banning investment measures inconsistent with national treatment and the prohibition of quantitative restrictions (local content, trade-balancing and foreign-exchange balancing requirements), it reduces distortions and makes FDI regimes more predictable. Demerits: it removes tools developing countries used to build linkages and domestic industry; India had to drop such conditions in its automobile policy after a WTO ruling in 2001.
TRIPS, merits: minimum standards for patents (20 years), copyrights and trademarks encourage innovation and technology transfer through FDI. Demerits: stronger patents raise prices of medicines and seeds in poor countries, favour rich-country right-holders and may slow imitation-based learning; flexibilities such as compulsory licensing (India's Natco case, 2012), the Doha Declaration (2001) and section 3(d) of India's Patents Act limit these costs.
Hence the WTO remains essential, but needs dispute-settlement reform and a fairer balance between innovation and development in TRIMs and TRIPS.
Example 24 (UPSC 2018, 20 marks): What is Doha Development Agenda? Explain how it negotiated TRIPS and TRIMS among nations.
Paper and question: Paper I, Q6(c)
Approach: Explain the Doha Development Agenda (launch, mandate, key issues, single undertaking, progress and stalemate), then how TRIPS (public health declaration, paragraph 6 system, GI extension, CBD link) and TRIMs (review, development concerns) were negotiated.
The Doha Development Agenda (DDA) is the round of WTO negotiations launched at the Fourth Ministerial Conference in Doha in November 2001. Its mandate covered agricultural subsidies and market access, non-agricultural market access, services, rules, trade facilitation and implementation issues, with development at the centre. It was to be a single undertaking.
Progress: after setbacks at Cancun (2003), talks collapsed in July 2008 over the special safeguard mechanism for developing-country farmers. Later results came piecemeal: the Bali package (2013) with the Trade Facilitation Agreement and an interim peace clause on public stockholding, and the Nairobi decision (2015) eliminating agricultural export subsidies.
TRIPS in Doha: (i) the Declaration on the TRIPS Agreement and Public Health (2001) affirmed that TRIPS should be interpreted to protect public health, that members may grant compulsory licences and may set their own exhaustion regime; (ii) the 'paragraph 6' problem of countries without manufacturing capacity was addressed by the waiver of 2003, made a permanent amendment (Article 31bis) in force from 2017, allowing exports of medicines under compulsory licence; (iii) developing countries, including India, sought extension of higher protection for geographical indications beyond wines and spirits and disclosure of origin of genetic resources and traditional knowledge; these remain unresolved.
TRIMs in Doha: the TRIMs agreement had required phasing out local-content and trade-balancing measures by 2000 for developing countries; at Doha several members sought extensions and flexibility to use TRIMs for development, while developed countries pushed for broader investment rules (a Singapore issue) that were dropped from the agenda in 2004 after opposition led by developing countries including India.
Thus the DDA produced important TRIPS flexibilities for public health but little else on TRIPS and TRIMs, reflecting the North-South divide that stalled the round.
Example 25 (UPSC 2017, 10 marks): What are the implications of trade in higher education under GATS for India?
Paper and question: Paper I, Q5(e)
Approach: Explain the four GATS modes as applied to higher education, then opportunities and risks for India, with recent policy (NEP 2020, foreign campuses).
The General Agreement on Trade in Services (GATS, 1995) covers education under four modes: cross-border supply (online courses), consumption abroad (Indian students studying overseas), commercial presence (foreign universities opening campuses) and presence of natural persons (foreign teachers). Countries choose which sectors to commit; India has made no binding GATS commitments in education.
Opportunities for India: more capacity and choice for a very large student population; competition and higher quality; access to foreign curricula, research collaboration and faculty; reduced outflow of foreign exchange spent by Indian students abroad; and the chance for Indian institutions to export education.
Risks: commercialisation and high fees that exclude poorer students; entry of low-quality providers; weaker regulatory autonomy once commitments are bound; urban concentration; and pressure on public institutions.
India is opening selectively without GATS commitments: NEP 2020 encourages internationalisation, UGC regulations of 2023 allow foreign campuses, and Deakin and Wollongong opened campuses in GIFT City in 2024.
Example 26 (UPSC 2017, 20 marks): Do you agree with the view that the honeymoon with free trade under W.T.O. is at an end? Give reasons for your answer.
Paper and question: Paper I, Q6(c)
Approach: Take a balanced view: list the signs that the post-1995 free-trade consensus has weakened (stalled Doha, rise of RTAs, Brexit and US withdrawal from TPP in 2016–17, protectionism, anti-globalisation backlash), then why it is not over (rules, trade still large, new agreements, dispute settlement), and conclude.
The creation of the WTO in 1995 and China's accession in 2001 marked a 'honeymoon' of trade liberalisation: tariffs fell, trade grew roughly twice as fast as world GDP and global value chains spread. By 2017 there were strong signs that this phase was ending, though the evidence is mixed.
Signs that the honeymoon is over: (i) the Doha Round stalled after 2008 and the Nairobi Ministerial (2015) could not reaffirm its mandate; (ii) after the 2008 crisis world trade growth slowed to about the pace of GDP ('slowbalisation'), and the G-20 countries introduced many new trade restrictions; (iii) political backlash against globalisation over job losses and inequality, seen in the Brexit referendum (June 2016) and the US withdrawal from the Trans-Pacific Partnership (January 2017); (iv) the US began blocking appointments to the WTO Appellate Body.
Why it is not entirely over: (i) WTO rules and bound tariffs still govern most world trade and prevent a return to the 1930s; (ii) the Trade Facilitation Agreement (2013) entered into force in February 2017, and the Nairobi package abolished agricultural export subsidies; (iii) mega-regional agreements such as RCEP and the CPTPP, though regional, continued liberalisation; (iv) developing countries, including India and China, remained committed to an open multilateral system.
Later developments (after 2017) reinforced the trend: the US-China tariff war from 2018, the Appellate Body's paralysis since December 2019 and the use of tariffs for strategic aims, alongside partial successes such as the 2022 fisheries agreement.
Hence the honeymoon of unquestioned free trade under the WTO has ended, but the marriage continues: the task now is to reform the WTO, restore dispute settlement and address the distributional concerns that fuelled the backlash.
Example 27 (UPSC 2016, 15 marks): What is the stalemate in the WTO about subsidies in less-developed economies? Discuss.
Paper and question: Paper I, Q6(c)
Approach: Explain the Agreement on Agriculture's subsidy rules (boxes, AMS, de minimis), the conflict over public stockholding for food security and MSP (external reference price of 1986–88), the Bali peace clause and the stalemate, with India's position.
The WTO Agreement on Agriculture (1995) classifies domestic support into boxes: the Amber Box (trade-distorting support such as market price support and input subsidies, limited by the Aggregate Measurement of Support), the Green Box (minimally distorting support such as research, extension and decoupled income support, not limited) and the Blue Box (production-limiting payments). Developing countries may give Amber Box support up to a de minimis 10% of the value of production.
The stalemate: India and other developing countries buy food grains at administered minimum support prices for public stocks and distribution under the National Food Security Act, 2013. Under the rules, market price support is calculated as (administered price − fixed external reference price of 1986–88) × eligible production. Because the reference price is outdated and ignores inflation, support for rice and wheat can appear to exceed the 10% limit. Developing countries (the G-33) want public stockholding for food security exempted or the calculation updated; exporters fear that releases from such stocks distort trade.
Peace clause: the Bali Ministerial (2013) agreed an interim peace clause shielding such programmes from legal challenge until a permanent solution; in November 2014 the General Council made it indefinite. India became the first country to invoke it, for rice, in 2020 (for marketing year 2018–19). No permanent solution has been agreed at later ministerials.
The stalemate thus reflects a clash between food security and trade-distortion concerns.
Example 28 (UPSC 2014, 10 marks): Explain the Trade Related Investment Measures (TRIMs) of World Trade Organisation (WTO). What are the major debates relating to it?
Paper and question: Paper I, Q8(c)
Approach: Explain what TRIMs are, the illustrative list of prohibited measures, the transition periods, and the debates (development policy space, scope expansion, India's experience).
The Agreement on Trade-Related Investment Measures (TRIMs), part of the Uruguay Round results in force from 1995, prohibits investment measures that are inconsistent with GATT Article III (national treatment) and Article XI (prohibition of quantitative restrictions). Its illustrative list includes local content requirements, trade-balancing requirements linking imports to exports, and foreign-exchange balancing and export restrictions.
Developing countries were given five years, until 2000, to phase them out.
Debates: (i) policy space: developing countries argue that such measures helped build linkages and domestic industries, as in Korea and Brazil, and that TRIMs removes these tools; (ii) developed countries sought broader investment rules (investment protection, performance requirements), which developing countries including India resisted, and the issue was dropped from the Doha agenda in 2004.
(iii) Enforcement: India's automobile policy with indigenisation and trade-balancing conditions was found inconsistent by a WTO panel in 2001; (iv) newer disputes, such as the US challenge to India's domestic content requirements in the National Solar Mission (ruled against India in 2016), show continuing tension with green industrial policy.
Mains points
- Tariff answers are marked on the diagram: label consumer-surplus loss (a + b + c + d), producer gain (a), revenue (c) and deadweight triangles (b and d), and add the terms-of-trade gain (e) for a large country.
- Distinguish small and large countries in every tariff, quota, subsidy and optimum-tariff question; the optimum tariff t* = 1/(e* − 1) is positive only when foreign export supply is less than infinitely elastic.
- Know the non-equivalence of tariffs and quotas (Bhagwati, 1965) and the effective rate of protection formula g = (t − a·tᵢ)/(1 − a).
- WTO questions need dates and specifics: Uruguay Round (1986–94), WTO 1995, Doha 2001, Bali 2013 peace clause, Nairobi 2015, MC12 2022 fisheries agreement, the Appellate Body paralysis since 2019, and India's positions.
- For trade blocs, use Viner's trade creation and diversion, Balassa's stages and Bhagwati's 'spaghetti bowl', with examples such as RCEP, the EU and India's recent FTAs.
Did you know?
- The US Smoot-Hawley Tariff Act of 1930, signed despite a petition from over a thousand economists, provoked retaliation and is often cited as having deepened the collapse of world trade in the Great Depression.
Economics Optional: All chapters
- Exam Pattern, Syllabus and Strategy
- Price Determination and Theories of Distribution
- Market Structures
- Welfare Economics
- Theories of Employment, Income and Interest
- Money and Monetary Management
- Public Finance
- Theories of International Trade
- Trade Policy, Protection and the WTO
- Balance of Payments and Exchange Rates
- Theories of Growth
- Economic Development
- Indian Economy in the Pre-Independence Era
- Planning in India
- Agriculture before Liberalisation
- Industry before Liberalisation
- National Income, Poverty and Inequality
- Agriculture after Liberalisation
- Industry after Liberalisation
- External Sector after Liberalisation
- Public Finance and Fiscal Federalism in India
- Monetary System and the RBI
- Employment, Wages and Poverty Alleviation