
Economics Optional · UPSC Notes
Industry after Liberalisation — UPSC Economics Optional Notes
Free, exam-focused notes for UPSC Prelims and Mains, with Prelims tips and Mains points for every topic. 4 topics.
Open in the interactive reader: bookmarks, progress tracking and read-aloud.
New Industrial Policy 1991 and the Strategy of Industrialisation
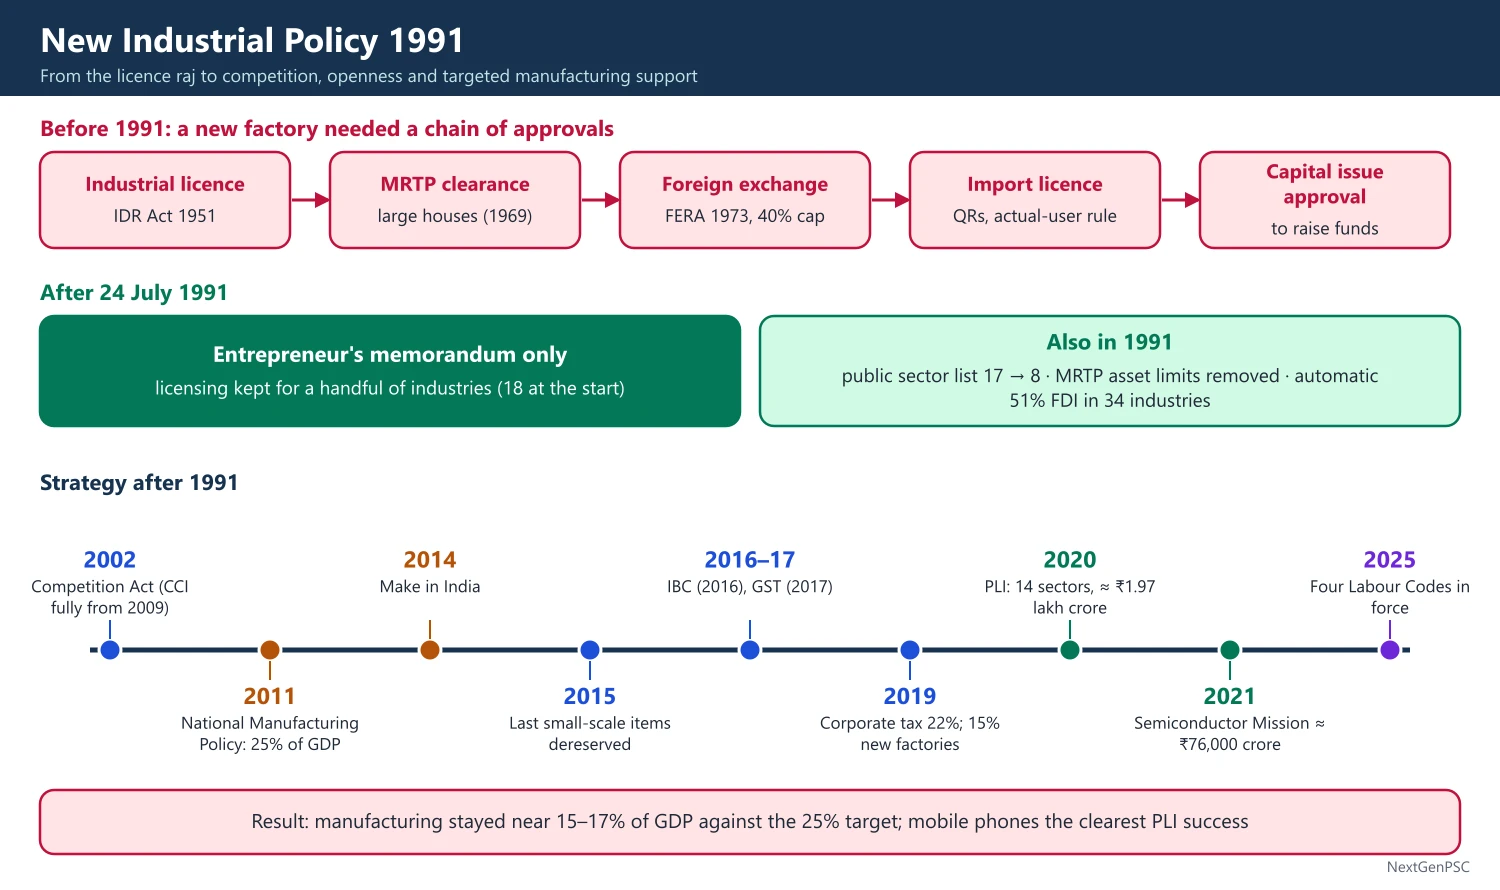
The New Industrial Policy of 24 July 1991 ended the licence raj: it abolished industrial licensing for all but a few industries, cut the list reserved for the public sector, removed MRTP asset limits and opened the door to foreign investment. Strategy shifted from import substitution to competition and openness, and later to targeted manufacturing support through Make in India (2014) and PLI schemes (2020).
In simple words
Before 1991, a firm needed government permission (a licence) to start, expand or change products, which slowed industry; this was the licence raj.
Imagine needing a permit to add a table to your restaurant: you would grow slowly and customers would wait.
The 1991 policy removed most permits and let private and foreign firms compete, while recent schemes pay incentives to boost factory output and exports.
UPSC asks you to evaluate 1991 reforms and India's manufacturing strategy.
1. Pre-1991 Industrial Strategy
Industrial Policy Resolution 1948: declared a mixed economy, reserving arms, atomic energy and railways for the state.
Industries (Development and Regulation) Act, 1951: the legal basis of industrial licensing for capacity, location and products.
Industrial Policy Resolution 1956: divided industries into Schedule A (17 industries exclusively for the state), Schedule B (12 industries with progressive state ownership) and Schedule C (the rest for the private sector); it gave the public sector the 'commanding heights'.
Mahalanobis strategy: the Second Plan (1956–61) model allocated investment to capital goods (heavy industry) to raise long-run growth, assuming a closed economy and export pessimism.
Import substitution industrialisation (ISI): high tariffs, quantitative restrictions and the 'actual user' policy protected domestic industry, in line with Prebisch and Singer's export pessimism.
Controls added: MRTP Act 1969 (limits on large houses), FERA 1973 (40% foreign equity cap), reservation of products for small-scale industry (from 1967; peaking at over 800 items), and price and distribution controls.
Committee critiques: the Hazari Committee (1967) and the Industrial Licensing Policy Inquiry (Dutt) Committee (1969) found licensing favoured large business houses and created pre-emption of capacity.
Stagnation (1965–80): industrial growth slowed from about 7% a year in 1951–65 to about 4%; Isher Ahluwalia (Industrial Growth in India, 1985) linked it to falling public investment, controls and low productivity growth.
Bhagwati and Desai (1970): India: Planning for Industrialization argued that controls caused inefficiency, rent-seeking and high costs.
1980s partial liberalisation: broad-banding of licences, delicensing of some industries and easier imports of capital goods raised industrial growth to about 7–8%.
2. The New Industrial Policy, 1991
Licensing: abolished for all industries except 18 at the start; the list has since shrunk to a handful (such as alcoholic drinks, tobacco products, defence and aerospace electronics, industrial explosives and hazardous chemicals).
Public sector reservation: cut from 17 to 8 industries in 1991 and later to only atomic energy and railway operations.
MRTP: asset thresholds removed, ending pre-entry scrutiny of big firms; the MRTP Act was replaced by the Competition Act, 2002, and the Competition Commission of India became fully operational in 2009.
Foreign investment: automatic approval for up to 51% foreign equity in 34 high-priority industries; FERA was later replaced by FEMA, 1999.
Foreign technology: automatic approval for technology agreements within set limits.
Public sector reform: disinvestment of part of government equity, and referral of sick PSUs to the BIFR.
Location: no approval needed for locating industries except in large cities, subject to environmental rules.
Context: the 1991 balance of payments crisis, with reserves enough for about two weeks of imports, and an IMF programme pushed the reforms (Manmohan Singh as Finance Minister, P.V. Narasimha Rao as Prime Minister).
3. Strategy after 1991
Small-scale reservation: gradually removed, with the last items dereserved in 2015; the MSMED Act, 2006 defined micro, small and medium enterprises.
MSME definition: revised in 2020 to a composite criterion of investment and turnover, and raised from 1 April 2025 (micro: up to ₹2.5 crore investment and ₹10 crore turnover; small: ₹25 crore and ₹100 crore; medium: ₹125 crore and ₹500 crore).
National Manufacturing Policy (2011): targeted a 25% manufacturing share of GDP and 100 million jobs by 2022 through National Investment and Manufacturing Zones.
Make in India (September 2014): aimed to raise manufacturing to 25% of GDP; the share stayed near 15–17%, so the target was not met.
PLI schemes (2020–21): production-linked incentives for 14 sectors with an outlay of about ₹1.97 lakh crore (mobiles and electronics, pharmaceuticals, autos, textiles, solar modules, specialty steel, food processing and others), paying a share of incremental sales.
Results of PLI: mobile phone production and exports rose sharply, with smartphones among India's top export items by 2024–25, mostly through Apple's suppliers and Samsung; results in other sectors were uneven.
India Semiconductor Mission (December 2021): about ₹76,000 crore for chip and display fabs and assembly units; several assembly and testing plants were approved from 2023.
Business environment: the Insolvency and Bankruptcy Code (2016), GST (2017), corporate tax cut (September 2019: 22% base rate, 15% for new manufacturing firms), the Jan Vishwas Act (2023) decriminalising minor offences and the four Labour Codes in force from 21 November 2025.
Infrastructure: industrial corridors (Delhi-Mumbai Industrial Corridor), the PM Gati Shakti National Master Plan (2021) and the National Logistics Policy (2022).
4. Outcomes and Assessment
Positive: faster growth in sectors like autos, pharmaceuticals, telecom and IT-enabled industries; greater competition, better quality and lower prices; India became a global hub for generic drugs and small cars.
Weak spots: manufacturing's share of GDP and employment stayed low; growth was capital- and skill-intensive; India did not capture labour-intensive assembly as China did.
Missing middle: firm size distribution has many tiny firms and few mid-sized ones, linked to labour laws, credit access and size-based regulation (Hsieh and Klenow, 2009, found large misallocation of capital and labour in India).
Premature deindustrialisation: Rodrik (2016) showed that manufacturing employment shares are peaking at lower income levels in developing countries; India fits this pattern.
Twin balance sheet problem: after the 2003–08 investment boom, stressed corporate debts and bank NPAs slowed industrial investment in the 2010s (Economic Survey 2016–17).
5. Diagrams to Draw
ISI vs EOI under protection: draw domestic D and S with world price Pw; a tariff raises the domestic price to Pw(1 + t), increasing domestic output and reducing imports; mark the efficiency loss triangles to show the cost of ISI.
Manufacturing share chart: draw a line chart of manufacturing share of GDP from 1950–51 to 2024–25 for India (rising to about 16–17% then flat) and a comparison line for China or Korea peaking near 30%.
Licence raj flow: draw a flowchart of a pre-1991 firm's approvals (industrial licence, MRTP clearance, foreign exchange, import licence, capital issues) versus post-1991 entrepreneur memorandum.
6. Theory and Debates
Big push and balanced growth: Rosenstein-Rodan (1943) and Nurkse supported planned industrialisation; Hirschman (1958) favoured unbalanced growth through linkages, used to justify key sectors.
Infant industry argument: List and Hamilton supported temporary protection; critics say Indian protection was too long and too broad.
Developmental state: East Asian success combined export discipline with state support (Amsden, Wade); PLI is seen as a modern version, but critics warn of rent-seeking and fiscal cost.
Services vs manufacturing debate: some (e.g. Raghuram Rajan and Rohit Lamba, Breaking the Mould, 2023) argue India should focus on high-skill services; others argue labour-intensive manufacturing is needed for jobs.
7. Using It in the Exam
10-mark answer: list the main features of NIP 1991 and one result.
15/20-mark answer: contrast pre- and post-1991 strategy, assess outcomes with data, and discuss Make in India, PLI and premature deindustrialisation.
Keywords: licence raj, IPR 1956, ISI, NIP 1991, delicensing, MRTP to Competition Act, PLI, missing middle, premature deindustrialisation.
Quotable line: Manmohan Singh's 1991 Budget speech quoted Victor Hugo that no power on earth can stop an idea whose time has come.
| Aspect | Before 1991 | After 1991 |
|---|---|---|
| Licensing | Required for most industries (IDRA 1951) | Only a few industries |
| Public sector reservation | 17 industries (IPR 1956) | 8 in 1991; now atomic energy and railway operations |
| Big business | MRTP asset limits | Competition Act 2002, CCI |
| Foreign investment | FERA 1973, 40% cap | Automatic route; FEMA 1999; sectoral caps |
| Small industry | Reservation of over 800 items | Dereserved fully by 2015 |
| Trade strategy | Import substitution | Openness, then PLI-led targeted support |
Mains points
- Begin with the pre-1991 regime (IPR 1956, IDRA 1951, MRTP, FERA) to show what NIP 1991 changed.
- List NIP 1991 features precisely: delicensing, de-reservation, MRTP reform, FDI, technology, PSU reform.
- Assess outcomes with both successes (autos, pharma, telecom) and failures (manufacturing share, jobs).
- Bring in PLI, semiconductor mission and labour codes for current relevance.
- Use premature deindustrialisation and missing middle as analytical tools.
- Common mistake: claiming manufacturing share rose sharply after 1991; it stayed near 15–17%.
Did you know?
- Memory trick for NIP 1991's pillars: 'LPG' — Liberalisation, Privatisation, Globalisation.
- Under the licence raj, a firm could be penalised for producing more than its licensed capacity.
Privatisation and Disinvestment
Disinvestment means selling part of government equity in public sector enterprises; privatisation transfers management control to private owners. India began minority stake sales in 1991–92, carried out strategic sales in 1999–2004 and again with Air India (2022), and set out a New Public Sector Enterprise Policy (2021). The Budget 2026–27 targets ₹80,000 crore from disinvestment and asset monetisation.
In simple words
Disinvestment is when the government sells some shares of a company it owns, like ONGC or LIC.
It is like a family selling a part of its shop to an investor; if it sells most and hands over control, that is privatisation.
The aim is to raise money, improve efficiency and let the state focus on core duties, but critics fear job losses and selling assets cheaply.
UPSC asks about the rationale, history, methods and results of disinvestment.
1. Concepts and Definitions
Disinvestment: sale of government equity in a CPSE; minority disinvestment keeps government control (holding over 51%), while strategic disinvestment transfers management control with a block of shares.
Privatisation: a broader term covering transfer of ownership, management or activities to the private sector, including contracting out, PPPs and asset leasing.
Asset monetisation: leasing brownfield public assets (roads, transmission lines, airports, pipelines) to private operators for upfront or periodic payments without selling ownership.
CPSE classification: Maharatna, Navratna and Miniratna status gives boards more financial autonomy.
Methods: initial public offer, offer for sale (OFS), strategic sale, buyback, cross-holding sales, exchange traded funds (CPSE ETF 2014, Bharat 22 ETF 2017).
2. Rationale for Privatisation
Efficiency: private owners face market discipline and profit motive; public firms suffer principal-agent problems, political interference and soft budget constraints (Kornai).
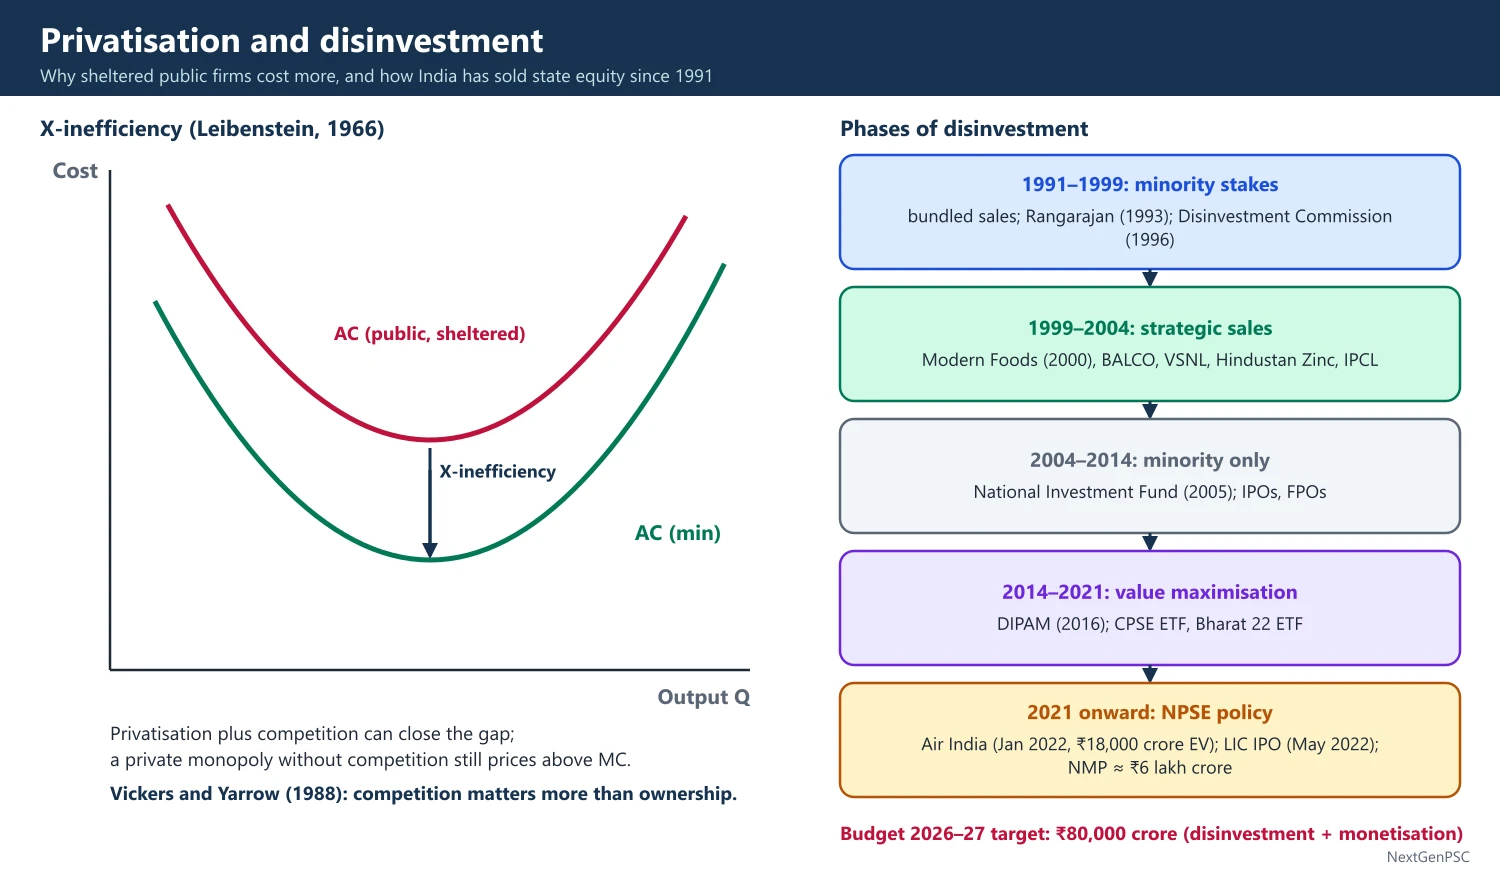
X-inefficiency: Leibenstein (1966) argued that firms sheltered from competition do not minimise costs.
Property rights theory: Alchian and Demsetz argued that clear residual claims improve monitoring and incentives.
Fiscal: proceeds reduce the fiscal deficit or fund capital spending; loss-making units drain the budget (Air India received large bailouts before sale).
Role of the state: the state should focus on public goods, regulation and social sectors rather than running hotels, airlines or bakeries.
Capital market depth: listings broaden share ownership and improve governance through disclosure.
3. History of Disinvestment in India
1991–92: minority stakes in 31 CPSEs sold in bundles to financial institutions, often undervalued.
Rangarajan Committee (1993): recommended disinvestment up to 49% in industries reserved for the public sector and up to 74% in others.
Disinvestment Commission (1996): chaired by G.V. Ramakrishna, it classified CPSEs as core and non-core and recommended strategic sales for non-core units.
Strategic sales phase (1999–2004): the Department (later Ministry) of Disinvestment, under Arun Shourie from 2001, sold control of Modern Food Industries (2000, the first), BALCO (2001), VSNL (2002), Hindustan Zinc (2002), IPCL (2002) and several ITDC hotels; Maruti Udyog stake sales followed.
2004–2014: strategic sales paused; the National Investment Fund (2005) was created to hold proceeds; minority stake sales through IPOs and FPOs continued.
DIPAM (2016): the Department of Disinvestment was renamed the Department of Investment and Public Asset Management, shifting focus to value maximisation.
Air India: sold to Talace (a Tata Sons company) for an enterprise value of ₹18,000 crore; the deal was completed on 27 January 2022.
Other deals: Neelachal Ispat Nigam to Tata Steel (2022); the LIC IPO (May 2022) raised about ₹21,000 crore for a 3.5% stake, India's largest IPO at the time.
Stalled deals: the BPCL strategic sale was called off in 2022 for lack of bidders; Shipping Corporation, Concor and IDBI Bank sales moved slowly.
4. New PSE Policy and Asset Monetisation
New Public Sector Enterprise Policy (Budget 2021–22): four strategic sectors where only a bare minimum CPSE presence will remain: atomic energy, space and defence; transport and telecommunications; power, petroleum, coal and minerals; and banking, insurance and financial services; CPSEs in other sectors to be privatised or closed.
National Monetisation Pipeline (August 2021): about ₹6 lakh crore of brownfield assets over 2021–22 to 2024–25, led by roads, railways and power.
Second asset monetisation plan: announced in Budget 2025–26 with a target of about ₹10 lakh crore for 2025–30.
Budget 2026–27: set a combined target of ₹80,000 crore from disinvestment and asset monetisation (miscellaneous capital receipts), against a revised estimate of about ₹34,000 crore for 2025–26.
Track record: actual disinvestment receipts fell far short of budget targets in most years after 2019–20, showing execution and market risks.
5. Diagrams to Draw
X-inefficiency diagram: draw an average cost curve AC(min) and a higher actual cost curve AC(public) above it; label the gap as X-inefficiency that privatisation plus competition can remove.
Monopoly vs competition: draw a monopoly with MR, MC and demand; show that privatising a monopoly without competition keeps price above MC and deadweight loss, so regulation or competition is needed.
Receipts chart: draw bars of budgeted vs actual disinvestment receipts for recent years to show the gap.
6. Theory and Debates
Ownership vs competition: Vickers and Yarrow (Privatization: An Economic Analysis, 1988) argued that competition and regulation matter more than ownership; India's telecom shows gains from competition even with public firms present.
Selling the family silver: critics, echoing Harold Macmillan's 1985 criticism of Thatcher's privatisations, argue that using one-time sale proceeds to fund current spending is poor fiscal practice.
Valuation and timing: selling in weak markets or to captive buyers (LIC buying stakes in other CPSEs) undervalues assets and does not change efficiency.
Social objectives: public firms serve remote areas, keep prices stable and provide employment and reservation; privatisation can reduce these.
Evidence: studies of 1999–2004 strategic sales (e.g. Gupta, 2005; later NCAER and DIPAM reviews) found improved profitability and investment in units such as BALCO, Hindustan Zinc and Maruti after privatisation, though results vary by case.
7. Examples and Applications
Maruti Suzuki: began as a government joint venture with Suzuki (1982); government exit by 2007 coincided with strong growth, a success case.
Hindustan Zinc: after sale to Sterlite (Vedanta) in 2002, output and profits rose sharply.
UK: Thatcher's privatisations of British Telecom (1984) and British Gas (1986) are the classic international case; results were mixed where monopolies remained.
Russia: the 1990s voucher privatisation led to concentration of assets among oligarchs, a warning about weak institutions.
8. Using It in the Exam
10-mark answer: define disinvestment vs privatisation, give the rationale and two examples with year.
15/20-mark answer: trace phases (1991, Rangarajan 1993, Disinvestment Commission 1996, strategic sales 1999–2004, DIPAM 2016, NPSEP 2021, Air India 2022), assess with theory and evidence, and conclude on competition and regulation.
Keywords: minority vs strategic disinvestment, soft budget constraint, principal-agent, X-inefficiency, NPSEP 2021, NMP, family silver critique.
Quotable line: Vickers and Yarrow's view that competition matters more than ownership for efficiency (paraphrased).
| Period | Approach | Examples / institutions |
|---|---|---|
| 1991–1999 | Minority stake sales | Bundled sales; Rangarajan Committee 1993; Disinvestment Commission 1996 |
| 1999–2004 | Strategic sales | Modern Foods, BALCO, VSNL, Hindustan Zinc, IPCL |
| 2004–2014 | Minority sales; no strategic sales | National Investment Fund 2005; IPOs and FPOs |
| 2014–2021 | Value maximisation; ETFs | DIPAM 2016; CPSE ETF, Bharat 22 ETF |
| 2021 onward | NPSEP; strategic sales; monetisation | Air India 2022; LIC IPO 2022; NMP 2021; ₹80,000 crore target in 2026–27 |
Mains points
- Define and distinguish disinvestment, strategic sale, privatisation and asset monetisation.
- Use theory (principal-agent, soft budget constraint, X-inefficiency) to justify the rationale.
- Present the phases with committees and key deals and years.
- Assess outcomes with evidence (BALCO, Hindustan Zinc, Maruti, Air India) and the target-vs-actual gap.
- Discuss the Vickers-Yarrow point that competition and regulation matter more than ownership.
- Common mistake: treating disinvestment proceeds as a solution to fiscal deficits; they are one-time receipts.
Did you know?
- Air India returned to the Tata group 69 years after it was nationalised in 1953.
Foreign Direct Investment and Multinationals in India
Foreign direct investment is investment that gives a lasting interest and control (10% or more of equity), unlike portfolio investment. India moved from the restrictive FERA regime to the automatic route under FEMA, with most sectors now open to 100% FDI. Gross FDI inflows reached about 94.5 billion US dollars in 2025–26 (RBI), though net FDI was much lower because of repatriation and outward investment.
In simple words
FDI is when a foreign company sets up or buys a business in India and helps run it, like Suzuki with Maruti or Samsung's phone factory in Noida.
It is different from a foreigner buying a few shares on the stock market, which is portfolio investment.
FDI brings money, technology, jobs and exports, but critics worry about profits going abroad and local firms being crowded out.
UPSC asks about FDI policy, trends and the role of multinationals.
1. Concepts and Definitions
FDI: cross-border investment with a lasting interest and significant influence; the IMF and OECD use a 10% equity threshold; India adopted the same threshold on the advice of the Arvind Mayaram Committee (2014).
FPI: portfolio investment below 10% in listed firms, more liquid and volatile ('hot money').
Forms of FDI: greenfield (new facilities), brownfield (acquisition or expansion), joint ventures, and reinvested earnings and intra-company loans.
Horizontal vs vertical FDI: horizontal FDI replicates production to serve local markets (market-seeking); vertical FDI splits stages of production across countries to cut costs (efficiency-seeking).
Multinational corporation: a firm that owns and controls production in more than one country; UNCTAD calls them transnational corporations.
2. Theories of FDI and MNCs
Hymer (1960, published 1976): MNCs exist because they have firm-specific advantages (technology, brands, management) that offset the costs of operating abroad; FDI is linked to market power.
Vernon's product life cycle (1966): products are first made in the innovating country, then production moves to other developed and later developing countries as the product matures and standardises.
Internalisation theory: Buckley and Casson (1976) argued that firms internalise markets for knowledge when licensing is risky.
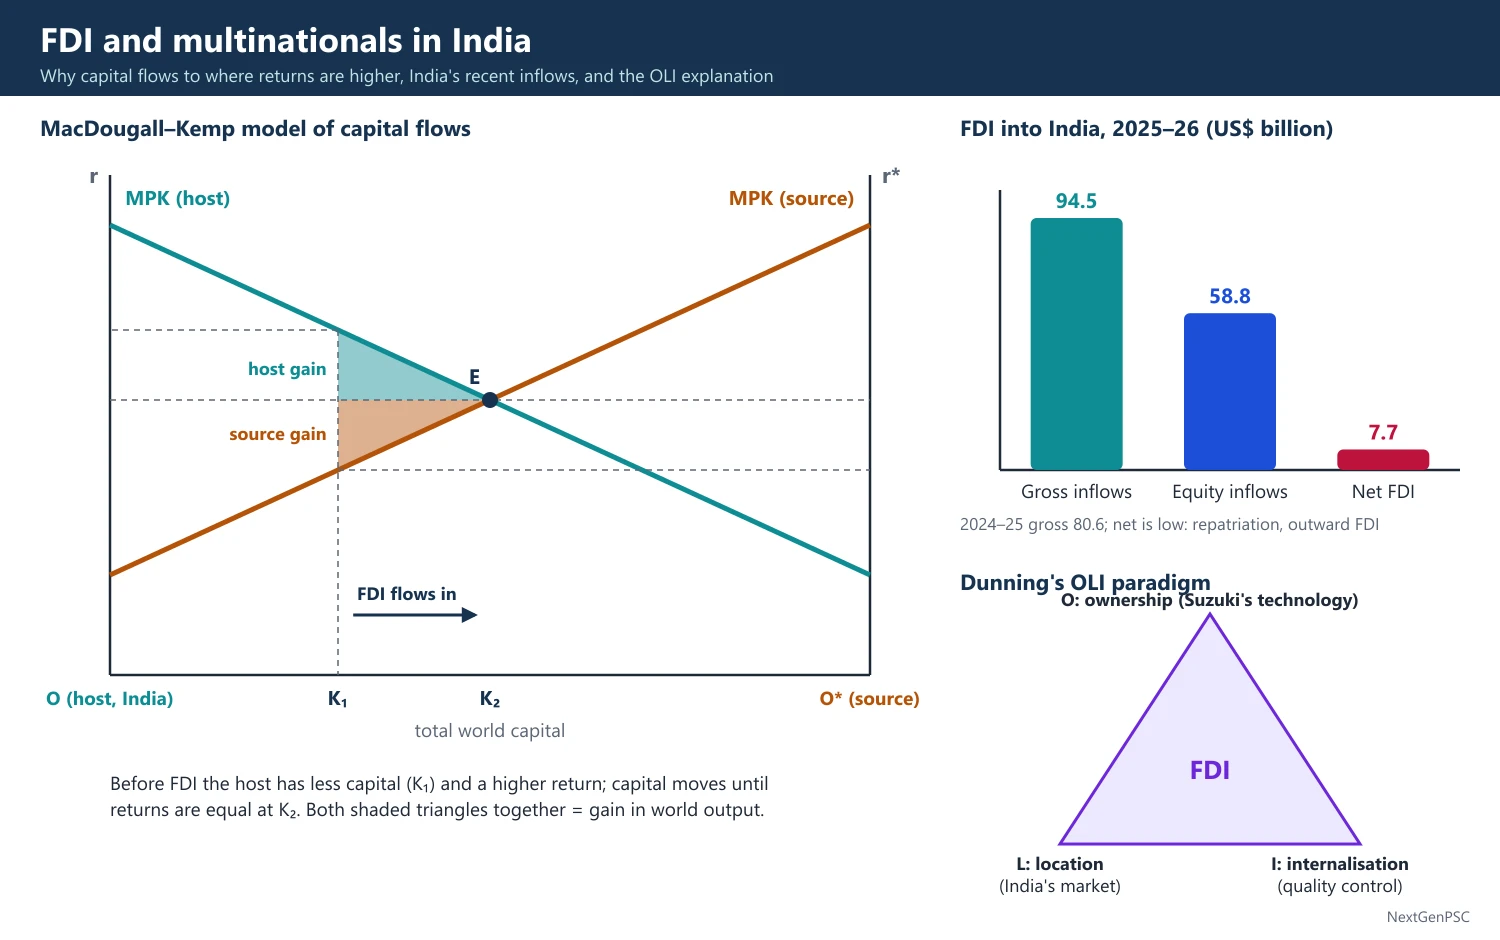
Dunning's eclectic (OLI) paradigm: FDI occurs when a firm has Ownership advantages, the host has Location advantages and the firm gains from Internalisation.
Kojima (1970s): trade-creating FDI flows from industries where the home country is losing comparative advantage (Japanese model).
Dependency critique: Singer, Hymer and dependency writers argued that MNCs extract surplus, transfer outdated technology and use transfer pricing to shift profits.
3. India's FDI Policy Evolution
FERA 1973: limited foreign equity to 40% in most firms; IBM and Coca-Cola left India in 1977–78.
1991: automatic approval up to 51% in 34 high-priority industries; the Foreign Investment Promotion Board (FIPB) handled other proposals.
FEMA 1999: replaced FERA, moving from 'regulation' to 'management' of foreign exchange.
Routes: the automatic route needs only post-investment reporting to the RBI; the government route needs approval from the concerned ministry after the FIPB was abolished in 2017 (Foreign Investment Facilitation Portal).
Press Note 3 (April 2020): FDI from countries sharing a land border with India (mainly China) requires government approval.
Sector caps (examples): defence 74% automatic, beyond with approval (2020); telecom 100% automatic (2021); single-brand retail 100% automatic; multi-brand retail 51% with approval; e-commerce 100% only in the marketplace model; space liberalised in 2024; insurance raised to 100% by the Sabka Bima Sabki Raksha (Amendment of Insurance Laws) Act, 2025 (December 2025).
Prohibited sectors: lottery, gambling and betting, chit funds, nidhi companies, real estate business (other than construction development), tobacco manufacturing, atomic energy and railway operations (with exceptions).
Investment treaties: India terminated its older bilateral investment treaties after 2016 and adopted a Model BIT (2015) with narrower investor protection; new treaties include India-UAE (2024); the India-EFTA Trade and Economic Partnership Agreement came into force on 1 October 2025 with an investment commitment of 100 billion US dollars over 15 years.
Tax certainty: the Taxation Laws (Amendment) Act, 2021 withdrew the retrospective tax used in the Vodafone and Cairn cases.
4. Trends and Sources
Growth: FDI inflows rose from under 1 billion US dollars a year in the early 1990s to over 80 billion dollars a year in the 2020s.
2025–26: gross FDI inflows were about 94.5 billion US dollars (up from 80.6 billion in 2024–25) and FDI equity inflows about 58.8 billion dollars (DPIIT and RBI data).
Net FDI: after repatriation by foreign investors and outward FDI by Indian firms, net FDI was only about 7.7 billion US dollars in 2025–26 (RBI), a concern for financing the current account deficit.
Sources: Singapore (about 19.8 billion dollars of equity in 2025–26), Mauritius and the US lead, partly because of treaty routing; the India-Mauritius tax treaty was amended in 2016 to tax capital gains at source.
Sectors and states: services, computer software and hardware (about 13.9 billion dollars in 2025–26), trading, autos and non-conventional energy; Maharashtra, Karnataka, Gujarat and Delhi attract the most.
5. Benefits and Costs of FDI and MNCs
Benefits: fills the saving-investment and foreign exchange gaps (two-gap model, Chenery and Strout, 1966), brings technology and management, raises productivity through spillovers, creates jobs and links to global value chains.
Spillovers: horizontal (to competitors through demonstration and labour mobility) and vertical (backward linkages to suppliers, e.g. Maruti's vendor network); evidence for India shows stronger backward spillovers than horizontal ones.
Costs: profit and royalty outflows, transfer pricing and tax avoidance, crowding out of local firms, market concentration, and footloose investment that leaves when incentives end.
Policy issues: e-commerce rules on inventory and discounts, data localisation, and screening of Chinese investment.
6. Diagrams to Draw
MacDougall-Kemp model: draw two countries' marginal product of capital curves facing each other on a horizontal axis measuring total capital; before FDI, capital is at K1 with a higher return in the host; after capital moves to equalise returns at K2, show the world output gain triangle, the host's gain and the home's gain.
FDI trend chart: draw bars of gross FDI inflows (2014–15 to 2025–26) with a line showing net FDI, to highlight the widening gap.
OLI triangle: draw a triangle with O, L and I at the corners and FDI in the middle, with examples (O: Suzuki's technology; L: India's market; I: control of quality).
7. Examples and Debates
Maruti Suzuki (1982): the joint venture modernised India's car industry and built a large component supplier base.
Electronics: Apple's suppliers (Foxconn, Pegatron, Tata Electronics) and Samsung expanded smartphone production under PLI, making phones a leading export.
Walmart-Flipkart (2018): a 16 billion dollar acquisition that raised questions about e-commerce rules and small traders.
Debate: Jagdish Bhagwati argued that FDI is beneficial under export promotion and harmful under import substitution (the 'Bhagwati hypothesis'); critics stress tax avoidance and market power.
China comparison: China attracted far larger FDI for export manufacturing in the 1990s–2000s through special economic zones; India's SEZ Act, 2005 had smaller effects.
8. Using It in the Exam
10-mark answer: define FDI vs FPI, give India's route system and latest inflow figures with year.
15/20-mark answer: add theories (Hymer, Vernon, Dunning), policy evolution (FERA to FEMA, Press Note 3, insurance 100%), trends including net FDI, and a balanced view of MNCs with examples.
Keywords: lasting interest, automatic route, OLI paradigm, spillovers, two-gap model, transfer pricing, net FDI, Press Note 3.
Quotable line: Dunning's eclectic paradigm explains FDI by ownership, location and internalisation advantages (paraphrased).
| Theory | Author (year) | Core idea |
|---|---|---|
| Monopolistic advantage | Hymer (1960) | Firm-specific advantages offset costs of operating abroad |
| Product life cycle | Vernon (1966) | Production moves abroad as products mature |
| Internalisation | Buckley and Casson (1976) | Firms internalise knowledge markets |
| Eclectic (OLI) | Dunning (1977) | Ownership, Location and Internalisation advantages together |
| Macroeconomic approach | Kojima (1970s) | FDI from sectors losing comparative advantage creates trade |
Mains points
- Define FDI with the 10% threshold and contrast it with FPI.
- Use at least one theory (Dunning's OLI is the most rewarded) to frame the answer.
- Give policy milestones: FERA 1973, NIP 1991, FEMA 1999, FIPB abolition 2017, Press Note 3 2020, insurance 100% 2025.
- Quote both gross and net FDI for 2025–26 and explain the gap.
- Balance benefits (technology, spillovers, exports) with costs (transfer pricing, crowding out).
- Common mistake: counting all foreign inflows as FDI; FPI and ECBs are separate.
Did you know?
- Coca-Cola left India in 1977 rather than dilute its equity and share its formula under FERA, and returned in 1993 after liberalisation.
- Memory trick for Dunning: 'OLI' — Own it, Locate it, Internalise it.
UPSC Previous Year Questions: Industry after Liberalisation
UPSC asked 39 question parts worth 565 marks on industry after liberalisation in Paper II from 2014 to 2026. The most-asked area is the New Industrial Policy 1991 and the strategy of industrialisation (20 parts), followed by FDI and multinationals (12 parts) and privatisation and disinvestment (7 parts). Every question below has a model answer written to the UPSC word limit.
In simple words
Read the question and write your own answer in the time UPSC allows: about 7 minutes for 10 marks and 11 minutes for 15 or 20 marks.
Then compare it with the model answer: did you contrast the pre- and post-1991 policy, give data with year and source, name committees and schemes correctly and end with a balanced view?
Note the facts you missed (IPR 1956, NIP 1991, Rangarajan Committee, NPSEP 2021, PLI, Press Note 3, FDI data) and revise them in this chapter's notes before the next question.
1. New Industrial Policy 1991 and the Strategy of Industrialisation
Example 1 (UPSC 2026, 20 marks): Trace the trajectory of India's industrial policy from the Nehruvian model of 'Mahalanobis Strategy' to the liberalization era. How has the focus shifted regarding the role of the State and heavy industries?
Paper and question: Paper II, Q3(a)
Approach: Trace the phases chronologically (Mahalanobis and IPR 1956, controls of 1965–80, 1980s liberalisation, NIP 1991, Make in India and PLI), then contrast the role of the state and of heavy industry then and now.
Nehruvian phase: the Second Plan (1956–61) adopted P.C. Mahalanobis's four-sector model, which allocated a high share of investment to capital goods, on the logic that a higher share λ of investment in the capital goods sector raises the long-run growth rate. The Industrial Policy Resolution 1956 reserved 17 industries for the state (Schedule A), gave the public sector the 'commanding heights', and relied on licensing under the IDR Act, 1951, import substitution and protection.
Control phase (1965–80): the MRTP Act (1969), FERA (1973), bank nationalisation and small-scale reservation tightened controls; industrial growth slowed from about 7% in 1951–65 to about 4%, which Isher Ahluwalia (1985) linked to controls and falling public investment.
Partial liberalisation (1980s): broad-banding of licences, delicensing of some industries and easier capital goods imports raised growth.
Liberalisation (1991 onward): the New Industrial Policy (July 1991) abolished licensing for all but 18 industries, cut public sector reservation from 17 to 8 (now only atomic energy and railway operations), removed MRTP pre-entry approvals and opened FDI. Later came Make in India (2014) and PLI schemes (2020–21).
Shift in the role of the state: from owner and producer to facilitator, regulator and strategic investor. Public investment now goes mainly into infrastructure (roads, railways, PM Gati Shakti, 2021), while the New Public Sector Enterprise Policy (2021) keeps CPSEs only in strategic sectors.
Shift regarding heavy industry: steel, machinery and petrochemicals are now led by private firms (Tata, JSW, Reliance), and the state supports frontier industries through incentives rather than ownership: PLI, the India Semiconductor Mission (2021) and the National Green Hydrogen Mission (2023).
Thus India has moved from state-led heavy industrialisation to market-led growth with a selective, incentive-based industrial policy.
Example 2 (UPSC 2026, 20 marks): Critically examine the impact of the New Economic Policy on the Indian corporate sector. Discuss its effects on privatization, the surge in FDI, and the domestic industry with the entry of multinational corporations.
Paper and question: Paper II, Q6(a)
Approach: Critically examine the NEP's effects on the corporate sector under the three heads asked (privatisation, FDI surge, MNC entry and domestic industry), giving examples and evidence on both sides, then conclude.
The New Economic Policy of 1991 combined delicensing, trade liberalisation, financial reform, disinvestment and an open door to foreign investment. It transformed the Indian corporate sector from a protected, licence-bound one into a competitive, globally linked one.
Privatisation: public sector reservation was cut, and private firms entered telecom, aviation, banking, insurance, power and steel. Disinvestment moved from minority sales (1991–92) to strategic sales (BALCO, Hindustan Zinc, VSNL, 1999–2004) and Air India's sale to the Tata group (2022). Privatised units such as Hindustan Zinc and Maruti showed higher profitability and investment. But strategic sales stalled after 2004 and again after the BPCL sale was dropped (2022), so the state remains a large owner.
Surge in FDI: inflows rose from under USD 1 billion a year in the early 1990s to over USD 80 billion a year in the 2020s (gross inflows about USD 94.5 billion in 2025–26). FDI brought capital, technology and management, as in automobiles and electronics. However, net FDI was only about USD 7.7 billion in 2025–26 because of repatriation, and much FDI is acquisition rather than new capacity.
MNC entry and domestic industry: competition forced restructuring: firms such as Bajaj Auto, Tata Motors, Asian Paints and Mahindra upgraded and grew, and some Indian firms became multinationals (Tata–Corus 2007, Tata–JLR 2008). Others sold out, such as Parle's Thums Up to Coca-Cola (1993), and the 'Bombay Club' of industrialists (1993) demanded a level playing field.
Critics also note rising concentration and weak job creation.
On balance, the NEP made the corporate sector more efficient, larger and outward-looking, but its gains were uneven and depend on competition policy (the Competition Act, 2002) to prevent dominance.
Example 3 (UPSC 2026, 15 marks): The economic reforms marked a paradigm shift in India's industrial strategy. In this context, discuss deregulation, delicensing, and their impact on industrial efficiency.
Paper and question: Paper II, Q7(c)
Approach: Define deregulation and delicensing with the 1991 measures, explain the channels to efficiency, then assess the impact with productivity evidence and limits.
Delicensing means removing the requirement of a government licence to set up, expand or relocate a unit; deregulation is the wider removal of controls on prices, capacity, imports, foreign exchange and entry. Together they marked a paradigm shift from a state-directed to a market-driven industrial strategy in 1991.
Measures: the New Industrial Policy (July 1991) abolished licensing for all but 18 industries (now a handful), removed MRTP pre-entry approval for large houses, dereserved most public sector industries and allowed automatic approval of FDI and technology agreements; later, price and distribution controls on steel, cement and other goods were removed and import licensing was dismantled.
Channels to efficiency: free entry and import competition reduce X-inefficiency; firms choose scale, technology and location freely; cheaper imported inputs and capital goods raise productivity; and inefficient firms lose market share.
Evidence: Topalova and Khandelwal (2011) found that tariff cuts after 1991 raised firm productivity, especially through cheaper inputs; Aghion, Burgess, Redding and Zilibotti (2008) found delicensing raised output more in states with pro-employer labour laws. However, aggregate total factor productivity gains were moderate, and exit remained hard until the IBC (2016).
Deregulation thus improved efficiency, but rigid factor markets and weak infrastructure limited the gains.
Example 4 (UPSC 2025, 20 marks): What are the causes of industrial backwardness in India? Critically evaluate the role of the New Industrial Policy, announced in July 1991, towards correcting such backwardness.
Paper and question: Paper II, Q6(a)
Approach: List the causes of industrial backwardness (historical, structural, policy, infrastructure, factor markets), then critically evaluate how far the NIP 1991 corrected each, ending with what remains.
India's industry remains backward relative to its potential: manufacturing has stayed at about 15–17% of GDP for four decades, against about 30% at the peak in China and Korea, and most firms are small and informal.
Causes: (1) Colonial legacy: de-industrialisation and a weak capital goods base at independence. (2) Policy: licensing, MRTP restrictions, small-scale reservation and import substitution until 1991 created a high-cost, low-scale industry with little export discipline. (3) Inefficient public enterprises with soft budget constraints. (4) Infrastructure deficits in power, ports and logistics. (5) Rigid factor markets: labour laws discouraging larger units and difficult land acquisition. (6) Low technology and R&D spending (under 1% of GDP). (7) Shortage of skills and credit for small firms.
Role of the NIP 1991: it attacked the policy causes directly: licensing was abolished for all but 18 industries, public sector reservation cut from 17 to 8, MRTP pre-entry approval removed, FDI up to 51% allowed automatically in priority industries, and PSU reform through disinvestment begun. Trade reform cut tariffs. Industrial growth rose in the mid-1990s and 2003–08, firms modernised and new sectors such as telecom, autos and pharmaceuticals became globally competitive.
Critical evaluation: the NIP did not address factor markets, infrastructure or exit; labour reforms came only with the Labour Codes (in force from November 2025), and the IBC only in 2016. Small-scale reservation lasted until 2015. The share of manufacturing did not rise, growth became capital-intensive, and services led the economy. Regional disparities widened as investment flowed to better-endowed states.
Thus the NIP removed the policy barriers but not the structural ones; later measures such as GST, IBC, PLI and PM Gati Shakti try to complete the agenda.
Example 5 (UPSC 2022, 20 marks): Do you subscribe to the view that private sector is a key driver to economic development of India? Give reasons in support of your answer.
Paper and question: Paper II, Q4(a)
Approach: Take a position (yes, with the state as complement), support it with the private sector's share in output, investment, jobs and exports and examples, and acknowledge the limits that need public action.
I subscribe to the view, with a qualification: since 1991 the private sector has become the main engine of India's growth, while the state's role is to provide public goods, regulation and a level playing field.
Reasons in support: (1) Output: private enterprises, including households, produce the large majority of GDP, and the share of the public sector has declined since 1991. (2) Investment: private corporations and households account for most of gross fixed capital formation, so growth cycles follow private investment, as in the boom of 2003–08. (3) Employment: over 90% of workers are in private, mostly informal, enterprises and farms. (4) Exports and innovation: IT services (TCS, Infosys), pharmaceuticals (generic exports to over 200 countries), automobiles and now electronics are private-led. (5) Efficiency: competition after 1991 transformed telecom, aviation and banking; private banks and fintech drove financial inclusion through UPI-based services. (6) Startups: India has one of the world's largest startup ecosystems.
Qualifications: private investment as a share of GDP fell after 2011–12 due to the twin balance sheet problem, and public capital expenditure carried growth after 2020. Market failures in infrastructure, research, health, education and regional development need public action. Private dominance can also lead to concentration, crony capitalism and environmental costs, and much private employment is informal and low-paid.
Hence the private sector is the key driver, but it works best alongside an effective state that invests in infrastructure and human capital and enforces competition, as the Economic Survey 2019–20 emphasised in its discussion of wealth creation and pro-business versus pro-market policy.
Example 6 (UPSC 2020, 15 marks): Critically examine the new manufacturing policy, 2011 for fostering industrial growth in India.
Paper and question: Paper II, Q3(b)
Approach: Set out the objectives and instruments of the National Manufacturing Policy 2011 (NIMZs, targets), then critically examine its design and outcomes against its targets.
The National Manufacturing Policy (NMP), approved in October–November 2011, aimed to make manufacturing the engine of growth and jobs.
Objectives: raise manufacturing growth to 12–14% a year, lift its share of GDP from about 16% to 25% by 2022, create 100 million additional jobs, deepen domestic value addition and skills, and make growth environmentally sustainable.
Instruments: (1) National Investment and Manufacturing Zones (NIMZs) of at least 5,000 hectares as integrated industrial townships with world-class infrastructure, single-window clearance and self-regulation; (2) rationalised business regulation and exit procedures; (3) support for MSMEs, technology acquisition, green manufacturing and skill development; (4) special focus on employment-intensive industries and strategic sectors.
Critical examination: the policy rightly identified scale, infrastructure and regulation as constraints, and NIMZs linked with the Delhi-Mumbai Industrial Corridor were a sensible model. But outcomes fell well short: the manufacturing share stayed near 15–17% of GDP, manufacturing growth averaged far below 12–14%, and manufacturing employment did not rise by anything like 100 million. Most NIMZs were slow to take off because of land acquisition problems, weak state capacity and a policy that depended on states.
The NMP's goals were carried forward by Make in India (2014) and the PLI schemes, but its experience shows that zones and targets cannot substitute for broader reforms in land, labour, logistics and skills.
Example 7 (UPSC 2019, 10 marks): Evaluate the Competition Act, 2002, relative to the Monopolies and Restrictive Trade Practices Act.
Paper and question: Paper II, Q1(e)
Approach: Contrast the MRTP Act (structure-based, size control) with the Competition Act (conduct-based, effects test) on philosophy, scope, institutions and remedies, and evaluate briefly.
The MRTP Act, 1969, based on the Monopolies Inquiry Commission (1965), sought to prevent concentration of economic power. It treated size itself as suspect: large houses with assets above a threshold needed approval to expand or merge.
The Competition Act, 2002, recommended by the Raghavan Committee (2000), replaced it in the liberalised economy. Its philosophy is to protect competition, not to restrict size. It prohibits anti-competitive agreements such as cartels (Section 3), abuse of dominant position (Section 4), and regulates combinations above asset or turnover thresholds (Sections 5–6). The Competition Commission of India can impose penalties of up to 10% of turnover.
Evaluation: the new Act is better suited to an open economy: it uses an effects-based 'rule of reason' rather than size limits, covers mergers and cartels, and has stronger penalties. Its weaknesses are slow litigation and new challenges from digital platforms, partly met by the Competition (Amendment) Act, 2023, which added a deal-value threshold and settlement and commitment procedures.
Example 8 (UPSC 2019, 15 marks): How does the strategy of industrialisation under the New Economic Policy promote productivity growth in manufacturing industries in India? Explain.
Paper and question: Paper II, Q8(b)
Approach: Explain the NEP's strategy elements and the channels by which each raises manufacturing productivity (competition, imports, scale, FDI, exit), support with studies, and note limits.
The strategy of industrialisation under the New Economic Policy (1991) replaced import substitution and state direction with competition, openness and private initiative. It promotes productivity growth (total factor productivity, TFP) through several channels.
(1) Domestic competition: delicensing and the removal of MRTP entry barriers let new firms enter and efficient firms expand, reducing X-inefficiency. (2) Import competition and cheaper inputs: tariffs fell from peaks above 300% to low levels, forcing firms to cut costs and giving access to better intermediate goods; Topalova and Khandelwal (2011) found input tariff cuts raised firm productivity. (3) Technology and FDI: automatic approval of technology agreements and FDI brought modern techniques, with spillovers to suppliers, as in Maruti's vendor network. (4) Scale economies: firms can choose efficient plant size without capacity licensing. (5) Reallocation: resources move from weak to strong firms, helped later by the IBC (2016).
Evidence and limits: studies by B.N. Goldar and others show TFP gains in organised manufacturing in some periods after 1991, but they are modest and uneven. Rigid labour laws, poor infrastructure and the dominance of tiny informal firms limited the gains, and Aghion and others (2008) found the effects depended on state labour regulation.
The strategy thus raised productivity, but complementary reforms in factor markets were needed to make the gains widespread.
Example 9 (UPSC 2018, 10 marks): Elaborate on the phenomenon of 'missing middle' in Indian manufacturing sector.
Paper and question: Paper II, Q1(e)
Approach: Define the missing middle with evidence on India's firm-size distribution, explain its causes and consequences briefly, and suggest remedies.
The missing middle refers to the unusual size distribution of Indian manufacturing: a very large number of tiny, mostly informal units and a small number of large firms, with relatively few medium-sized firms in between. Studies such as Mazumdar and Sarkar (2008) documented this dualism.
Evidence: the vast majority of manufacturing enterprises employ fewer than 10 workers, yet they account for a small share of output, while large factories dominate output but employ relatively few. Hsieh and Olken (2014) argued that what is really missing is growth: small firms rarely become large. The Economic Survey 2018–19 called such firms 'dwarfs' that stay small for decades.
Causes: labour laws whose obligations rise sharply above size thresholds (for example, 100 workers under the Industrial Disputes Act), size-based incentives and past small-scale reservation, poor access to credit, and weak infrastructure and contract enforcement.
Consequences: low productivity, informal jobs and weak exports. Remedies include the Labour Codes, the revised MSME definition (2020), credit guarantees and cluster development.
Example 10 (UPSC 2018, 20 marks): Comment on the new initiatives taken by the government to facilitate investment and ease of doing business.
Paper and question: Paper II, Q4(a)
Approach: Comment on the main initiatives up to 2018 (GST, IBC, FDI liberalisation, single-window, state reform rankings, Startup India, infrastructure), with outcomes such as the Doing Business rank, and give a balanced judgement.
Ease of doing business means the cost, time and certainty involved in starting and running a firm. After 2014 the government made it a central goal of Make in India.
Initiatives: (1) Tax reform: GST from 1 July 2017 created a common national market; the Income Computation and Disclosure Standards and faceless processes came later. (2) Insolvency and Bankruptcy Code (2016): time-bound resolution of distressed firms, easing exit and creditor rights. (3) FDI liberalisation: most sectors moved to the automatic route, defence, railways, insurance and civil aviation caps were raised, and the FIPB was abolished in 2017. (4) Single-window and online clearances: online incorporation (SPICe), e-Biz portal, self-certification under labour laws and Shram Suvidha portal. (5) Competitive federalism: DPIIT's Business Reform Action Plan ranks states on reforms. (6) Commercial Courts Act (2015) for faster contract enforcement. (7) Startup India (2016) and Stand-Up India for new entrepreneurs. (8) Infrastructure: Bharatmala, Sagarmala and dedicated freight corridors.
Comment: these steps produced visible gains: India's rank in the World Bank's Doing Business report rose from 142 (2015) to 100 (2018) and later 63 (2020). However, the rankings measured a few indicators in Delhi and Mumbai, and on-the-ground problems remained: land acquisition, contract enforcement, frequent changes in tax and trade rules, and state-level inspections. Private investment did not revive quickly, showing that procedural ease is not enough without demand, credit and policy stability.
The initiatives are a sound foundation, but deeper reform in factor markets, judiciary and regulatory predictability is needed to turn ease of doing business into higher investment.
Example 11 (UPSC 2018, 10 marks): How can the organised manufacturing sector be revived as an engine of inclusive growth?
Paper and question: Paper II, Q5(e)
Approach: Explain why organised manufacturing matters for inclusive growth and why it has stagnated, then propose specific measures to revive it with an emphasis on labour-intensive jobs.
Organised manufacturing offers formal jobs with higher productivity, social security and skills, so it can absorb workers leaving agriculture and make growth inclusive. Yet it employs a small share of the workforce and its output share has stagnated.
Measures for revival: (1) Focus on labour-intensive sectors where India has comparative advantage: apparel, footwear, leather, toys, furniture and food processing, as the Economic Survey 2016–17 suggested for apparel and leather. (2) Labour law reform with social security, so firms can grow beyond size thresholds; the four Labour Codes move in this direction. (3) Credit for MSMEs through credit guarantees and timely payments (TReDS). (4) Infrastructure: power, logistics, industrial corridors and plug-and-play parks to cut costs. (5) Export orientation through trade agreements and competitive tariffs on inputs. (6) Skills through apprenticeships linked to industry. (7) Easier land access through land banks.
Such measures can turn organised manufacturing into an engine of jobs rather than only of capital-intensive output.
Example 12 (UPSC 2017, 20 marks): What is the broad trend of the manufacturing sector's relative share in GDP in India over the last four decades? How do you view its performance and what actions does the government contemplate in this matter?
Paper and question: Paper II, Q3(c)
Approach: Describe the trend of manufacturing's share in GDP since the late 1970s with a line diagram, evaluate the performance (stagnation, premature deindustrialisation, causes), then list the government's actions (NMP 2011, Make in India and related measures).
Trend: the share of manufacturing in India's GDP has been remarkably flat for four decades. It was about 16% around 1980, rose slightly to about 17% in the mid-1990s, stayed at 15–16% in the 2000s and was about 17% in 2011–12 in the new series, before drifting down to around 16% by 2016–17 (CSO). Meanwhile, the share of agriculture fell sharply and services rose to over half of GDP.
Diagram: years 1980–81 to 2016–17 on the x-axis and share of GDP (%) on the y-axis; draw a nearly flat manufacturing line near 15–17%, a falling agriculture line and a rising services line crossing 50%; add a dashed line for China's manufacturing share near 30% for comparison.
Assessment of performance: the record is weak. Unlike East Asian economies, where manufacturing absorbed labour from agriculture, India moved directly from agriculture to services, a pattern Dani Rodrik (2016) calls premature deindustrialisation. Organised manufacturing became capital-intensive, so it created few jobs; most manufacturing workers are in tiny informal units, the 'missing middle'. Causes include rigid labour laws, poor infrastructure and logistics, costly land and credit, an inverted duty structure that taxed inputs more than final goods, and competition from China. Bright spots are automobiles, pharmaceuticals, chemicals and engineering goods.
Government actions: (1) The National Manufacturing Policy (2011): a 25% share of GDP and 100 million jobs by 2022 through National Investment and Manufacturing Zones. (2) Make in India (September 2014) for 25 sectors, with FDI liberalisation and investor facilitation. (3) Ease of doing business reforms, the IBC (2016) and GST (2017). (4) Industrial corridors, Bharatmala and Sagarmala. (5) Skill India (2015) and Startup India (2016). (6) Plans to consolidate labour laws into codes and to correct the inverted duty structure.
Manufacturing can rise only if these measures are backed by a stable trade policy, labour-intensive export sectors and better infrastructure.
Example 13 (UPSC 2017, 10 marks): "Though economic liberalisation in India in the mid 90s aimed at industrial growth, actually the services sector led the economy." Elucidate.
Paper and question: Paper II, Q5(d)
Approach: Show with data that services, not industry, led growth after liberalisation, and explain why (skills, telecom and IT reforms, fewer controls, demand) while industry was held back.
The 1991 reforms (delicensing, trade and FDI liberalisation) were aimed mainly at industry, yet the services sector became the engine of growth. Its share in GDP rose from about 44% in 1990–91 to over half by the 2010s, and it grew faster than industry in most years, while manufacturing stayed at 15–17% of GDP.
Reasons: (1) India's pool of English-speaking engineers and graduates gave it a comparative advantage in skill-intensive services such as IT and business process outsourcing; software exports grew rapidly after the Y2K demand of the late 1990s. (2) Telecom reform (New Telecom Policy 1999) and cheap communications made services tradable. (3) Services faced fewer controls: no licensing, no small-scale reservation and lighter labour law burdens than factories. (4) Industry was held back by poor infrastructure, rigid labour laws, land problems and Chinese competition.
Eichengreen and Gupta (2011) describe this as a second wave of modern services growth, but services created fewer jobs for low-skilled workers than manufacturing could.
Example 14 (UPSC 2016, 10 marks): Write short notes on "Skill India" and "Make in India".
Paper and question: Paper II, Q5(e)
Approach: Write two short notes: for each give launch year, objectives, main components and an assessment in a line or two.
Make in India (launched 25 September 2014) aims to make India a global manufacturing hub. Its targets were manufacturing growth of 12–14% a year, a 25% share of GDP and 100 million additional jobs by 2022. It rests on four pillars: new processes (ease of doing business), new infrastructure (industrial corridors, smart cities), new sectors (FDI opened in defence, railways, insurance) and a new mindset of government as facilitator. It improved India's investment image and FDI inflows, but the manufacturing share did not rise as targeted.
Skill India (launched 15 July 2015) aims to skill large numbers of young people for employment. Its components include the National Skill Development Mission, Pradhan Mantri Kaushal Vikas Yojana (PMKVY) for short-term training with certification, and the National Skill Development Corporation (2008). Placement rates after training have been modest, so linking courses to industry demand is the key challenge.
The two are complementary: Make in India creates demand for skilled workers, and Skill India supplies them.
Example 15 (UPSC 2015, 10 marks): Why did the socialist order fail and the country had to resort to the market economy system? Give reasons.
Paper and question: Paper II, Q1(e)
Approach: Explain the economic reasons the state-led 'socialist' model failed (slow growth, controls, PSU losses, fiscal and BoP crisis) and the external triggers that pushed India to markets in 1991.
India's post-independence model combined central planning, a dominant public sector, licensing and import substitution under a 'socialistic pattern of society' (Avadi, 1955). By 1991 it had to give way to a market economy.
Reasons for failure: (1) Slow growth: GDP grew at about 3.5% a year from 1950 to 1980, the 'Hindu rate of growth' (Raj Krishna's phrase). (2) The licence-permit raj created rent-seeking, delays and protected monopolies. (3) Public enterprises earned low returns and suffered soft budget constraints and political interference. (4) Import substitution shut out technology and competition, so exports stagnated. (5) Fiscal profligacy in the 1980s raised the fiscal deficit to about 8% of GDP.
Triggers: the 1990 Gulf War raised oil prices and cut remittances; reserves fell to about two weeks of imports in mid-1991, India pledged gold and turned to the IMF. The collapse of the Soviet Union and East Asia's market-led success also discredited the old model.
Hence India adopted liberalisation, privatisation and globalisation in July 1991.
Example 16 (UPSC 2015, 10 marks): Discuss the recent initiatives for augmenting power generation in India.
Paper and question: Paper II, Q5(b)
Approach: List the main initiatives of 2014–15 for power generation (renewables target, coal reforms, UDAY, transmission and distribution schemes, efficiency) with years, and note the challenges briefly.
Power shortages and stressed distribution companies limited India's growth, so the government launched several initiatives around 2014–15.
(1) Renewable energy: the target was raised in 2015 to 175 GW by 2022 (100 GW solar, 60 GW wind, 10 GW biomass, 5 GW small hydro), with solar parks and competitive bidding that cut tariffs. (2) Coal supply: after the Supreme Court cancelled coal block allocations (2014), the Coal Mines (Special Provisions) Act, 2015 enabled transparent e-auctions. (3) Distribution reform: UDAY (November 2015) let states take over 75% of discom debt and set targets for cutting losses, which make generation viable. (4) Rural electrification: Deendayal Upadhyaya Gram Jyoti Yojana (December 2014) with separate agricultural feeders, and the Integrated Power Development Scheme for urban networks. (5) Transmission: Green Energy Corridors to evacuate renewable power. (6) Demand-side efficiency: UJALA (2015) LED distribution.
Capacity grew quickly, but discom finances, land for projects and grid integration of renewables remained challenges.
Example 17 (UPSC 2015, 15 marks): Explain the recent policy initiatives for enhancing crude oil and natural gas production in India.
Paper and question: Paper II, Q8(a)
Approach: Set the context of import dependence, then explain the policy initiatives up to 2015 (NELP, gas pricing reform, Discovered Small Fields, HELP announced, CBM and shale, enhanced recovery), and assess briefly.
India imports about four-fifths of its crude oil and a large part of its natural gas, so raising domestic output is vital for energy security and the current account. The government has taken several initiatives.
(1) New Exploration Licensing Policy (NELP, 1999): blocks offered through open bidding on a production-sharing basis, with fiscal incentives and equal treatment of private and foreign firms; it led to discoveries such as KG-D6. (2) Gas pricing reform: in October 2014 a new formula linked domestic gas prices to international hub prices, revised every six months, to improve incentives without excessive cost to users. (3) Discovered Small Fields policy (2015): marginal fields of ONGC and Oil India offered to private firms under revenue sharing with pricing and marketing freedom. (4) Approval in principle for a new licensing system replacing production sharing with revenue sharing, uniform licences for all hydrocarbons and an open acreage system; it was adopted as HELP in March 2016. (5) Policies for coal bed methane (CBM) and shale gas (2013). (6) Enhanced oil recovery from ageing fields and a National Data Repository for seismic data. (7) A target, set in 2015, to cut import dependence by 10% by 2022.
These policies improved incentives, but domestic output stayed flat because of ageing fields, geological risk and slow approvals, so import dependence actually rose.
Example 18 (UPSC 2015, 15 marks): What are the main components of the National Manufacturing Policy, 2014? Discuss.
Paper and question: Paper II, Q8(b)
Approach: Note that the manufacturing policy in force was the National Manufacturing Policy announced in 2011 (taken forward by Make in India in 2014), then discuss its components and assess them.
The National Manufacturing Policy was notified in November 2011; in 2014 the government carried its goals forward through Make in India, so the policy in force in 2014–15 was the NMP. It sought to make manufacturing the engine of growth and jobs.
Main components: (1) Targets: manufacturing growth of 12–14% a year, a 25% share of GDP and 100 million additional jobs by 2022. (2) National Investment and Manufacturing Zones (NIMZs): large integrated industrial townships of at least 5,000 hectares with infrastructure, single-window clearance and simplified regulation; several were planned along the Delhi-Mumbai Industrial Corridor. (3) Business regulation: rationalised approvals, self-certification and third-party audits, and simpler exit rules for closing units. (4) Labour: a job-loss policy to protect workers while giving flexibility. (5) Finance and incentives for MSMEs, technology acquisition and a Technology Acquisition and Development Fund. (6) Skill development through industrial training institutes and industry partnerships. (7) Green manufacturing: incentives for clean technologies and water and energy efficiency. (8) Focus sectors: employment-intensive industries, capital goods, strategic industries and those with competitive advantage.
The components were well designed, but implementation depended on states, land acquisition and labour reform, and the manufacturing share stayed near 15–17% of GDP.
Example 19 (UPSC 2014, 10 marks): While Indian economic growth in recent years is services-led growth and Chinese model is manufacturing-led growth, show the implications of the two models for long-term sustainable development.
Paper and question: Paper II, Q5(b)
Approach: Contrast India's services-led and China's manufacturing-led models briefly, then show the implications of each for jobs, inclusion, external balance, environment and long-run sustainability.
India's growth since the 1990s has been led by services (over half of GDP), while China's has been led by export-oriented manufacturing (around 30% of GDP or more) and very high investment.
Implications of China's model: it absorbed hundreds of millions of rural workers into factories, cut poverty rapidly and built huge export surpluses and reserves. But it relied on investment above 40% of GDP, causing overcapacity, debt, heavy pollution and dependence on foreign demand; it is now rebalancing towards consumption and services.
Implications of India's model: services are less energy- and pollution-intensive and draw on India's skilled workforce, giving high productivity and exports in IT. But skill-intensive services employ few low-skilled workers, so about half the workforce stayed in agriculture and informal work, and Rodrik's premature deindustrialisation limits mass job creation. Weak manufacturing also means a persistent merchandise trade deficit.
For long-term sustainable development, India needs a balance: labour-intensive manufacturing for jobs alongside services, with cleaner technology than China used.
Example 20 (UPSC 2014, 10 marks): Second generation economic reforms are crucial for raising the growth rate of economy. Throw light on these dimensions.
Paper and question: Paper II, Q5(e)
Approach: Distinguish first- and second-generation reforms, then throw light on the main dimensions of the latter (factor markets, public sector, finance, fiscal, governance, agriculture, social sector) and why they raise growth.
First-generation reforms (1991 onward) removed controls: delicensing, trade and exchange rate liberalisation, and opening to FDI; they could be done by executive decision. Second-generation reforms deal with institutions and markets that need legislation, Centre-state cooperation and political consensus.
Dimensions: (1) Factor markets: labour law reform for flexibility with social security, and land acquisition and land records reform. (2) Public sector: disinvestment and better governance of PSUs and public banks. (3) Financial sector: insolvency law, bond market development and bank recapitalisation. (4) Fiscal: a unified Goods and Services Tax, subsidy reform through direct benefit transfer and fiscal discipline under the FRBM Act. (5) Agriculture: market (APMC) reform, contract farming and land leasing. (6) Governance and judiciary: faster contract enforcement and regulatory clarity. (7) Human capital: quality of education, health and skills.
They are crucial because the easy gains of delicensing are exhausted; raising investment and productivity now depends on efficient factor markets and institutions.
2. Privatisation and Disinvestment
Example 21 (UPSC 2025, 10 marks): Justify the importance of 'Disinvestment Policy' of India.
Paper and question: Paper II, Q5(d)
Approach: Define disinvestment and justify the policy on efficiency, fiscal, market and role-of-state grounds, with Indian examples, adding a one-line caution.
Disinvestment is the sale of government equity in public sector enterprises, either as minority stakes (control retained) or as strategic sales transferring management control. India began it in 1991–92.
Importance: (1) Efficiency: private owners face market discipline, while public firms suffer principal-agent problems, political interference and soft budget constraints (Kornai); privatised units such as BALCO, Hindustan Zinc and Maruti improved profitability and investment. (2) Fiscal: proceeds cut borrowing or fund capital spending, and selling loss-makers ends recurring bailouts, as with Air India, sold to the Tata group in 2022. (3) Capital markets: listing CPSEs, such as the LIC IPO (2022), deepens markets and improves transparency and governance. (4) Role of the state: the government should focus on public goods and regulation rather than run hotels or airlines; the New Public Sector Enterprise Policy (2021) limits CPSEs to four strategic sectors. (5) Unlocking value of idle assets.
However, sales must be at fair value and accompanied by competition and regulation, or the gains may be lost.
Example 22 (UPSC 2023, 10 marks): Examine the salient features of the Action Plan for Disinvestment, 2009.
Paper and question: Paper II, Q5(b)
Approach: Give the context of the 2009 decision and list its salient features (listing of profitable CPSEs, 10% public float, 51% government holding, NIF use), with a line of assessment.
After strategic sales stopped in 2004, the UPA government approved an Action Plan for Disinvestment in November 2009 based on the idea of 'people's ownership' of public enterprises, that is, wider public shareholding while the government keeps control.
Salient features: (1) Listed profitable CPSEs not meeting the mandatory public shareholding of at least 10% were to be brought to that level through follow-on public offers. (2) Unlisted CPSEs with a three-year record of net profit and positive net worth were to be listed through initial public offers. (3) The government would retain at least 51% equity and management control; there would be no strategic sales. (4) Proceeds would go to the National Investment Fund (2005); for 2009–12 they could be used fully for social sector schemes such as MGNREGA, education and health.
The plan raised funds through issues such as NTPC, NHPC, Coal India (2010) and Oil India, but by avoiding strategic sales it did little to improve efficiency.
Example 23 (UPSC 2022, 20 marks): What are the various methods of privatisation? Point out the methods adopted by the government for disinvestment in India. Comment on the proceeds from disinvestment in India.
Paper and question: Paper II, Q8(a)
Approach: Classify the methods of privatisation in general, then list the methods India has used with examples, and comment on the proceeds (targets versus achievement, volatility, use) with figures.
Privatisation in the broad sense is any reduction of the state's role in ownership, management or provision of goods and services. It can be ownership change, organisational change or operational change.
Methods: (1) Ownership transfer: share issue privatisation (sale to the public through stock markets), asset sale or trade sale to a strategic buyer, voucher or mass privatisation, and management or employee buyouts. (2) Without full ownership transfer: leasing, management contracts, franchising and contracting out, and public-private partnerships. (3) Liquidation or closure of unviable units.
Methods used in India: (1) Minority stake sales: bundles of shares sold to financial institutions (1991–92), later IPOs and follow-on offers (Coal India 2010, LIC 2022). (2) Offer for Sale through stock exchanges (from 2012). (3) Strategic sales: Modern Food (2000), BALCO (2001), VSNL and Hindustan Zinc (2002), and Air India (2022). (4) Exchange traded funds: CPSE ETF (2014) and Bharat 22 ETF (2017). (5) Buybacks by CPSEs and cross-holdings, such as ONGC's purchase of HPCL (2018).
Comment on proceeds: receipts were small in the 1990s, rose with the strategic sales of 1999–2004, and peaked at about ₹1 lakh crore in 2017–18 and about ₹85,000 crore in 2018–19. Since then, targets have usually been missed: 2020–21 and 2021–22 fell far short, and 2022–23 raised about ₹35,000 crore including the LIC IPO. Much of the money came from cross-holdings and buybacks, which only move funds within the public sector. Proceeds have been used mainly to finance the fiscal deficit rather than to build assets.
Disinvestment proceeds are thus volatile and market-dependent; the stress should shift from revenue to efficiency through genuine strategic sales.
Example 24 (UPSC 2021, 15 marks): Critically discuss the strategies formulated by the Government of India to increase private sector participation in public enterprises.
Paper and question: Paper II, Q7(b)
Approach: Lay out the strategies used (disinvestment phases, strategic sales, NPSEP 2021, asset monetisation, PPPs, opening reserved sectors), then critically assess their results and limits.
Since 1991 the government has used several strategies to bring private participation into public enterprises.
Strategies: (1) Minority disinvestment following the Rangarajan Committee (1993), which suggested up to 49% sale in reserved sectors and up to 74% in others. (2) Strategic sales of non-core units, as recommended by the Disinvestment Commission (1996): BALCO, VSNL, Hindustan Zinc and others in 1999–2004, and later Air India (2022). (3) The New Public Sector Enterprise Policy (Budget 2021–22): only a bare minimum presence in four strategic sectors, with others to be privatised, merged or closed; it also announced privatisation of two public sector banks and one general insurer. (4) Asset monetisation: the National Monetisation Pipeline (2021) of about ₹6 lakh crore for leasing roads, railway assets, transmission lines and pipelines. (5) Opening sectors such as coal mining (commercial mining from 2020), defence production and space to private firms.
Critical assessment: strategic sales improved performance in several cases, and asset monetisation recycles capital into new infrastructure. But progress has been slow: the BPCL sale was dropped in 2022, the bank privatisations have not happened, and targets are routinely missed. Valuation disputes, employee and political resistance, legal challenges and weak markets slow deals.
Private participation will rise only with a clear political commitment, independent valuation, transparent bidding and a strong regulator for monopoly assets.
Example 25 (UPSC 2020, 15 marks): Critically examine the strategy of disinvestment in improving the growth of the manufacturing sector.
Paper and question: Paper II, Q8(b)
Approach: Explain the channels through which disinvestment could raise manufacturing growth (efficiency, investment, technology, fiscal space), then critically examine the evidence and limits, with an X-inefficiency diagram.
Disinvestment can promote manufacturing growth if it improves the efficiency and investment of public manufacturing enterprises and frees public resources for infrastructure.
Channels: (1) Removal of X-inefficiency (Leibenstein): private owners cut excess costs and overstaffing. (2) New investment and technology from strategic buyers. (3) Hard budget constraints replace bailouts. (4) Proceeds can fund infrastructure that lowers costs for all manufacturers.
Diagram: output on the x-axis and cost per unit on the y-axis; draw the minimum feasible average cost curve AC(min) and a higher actual cost curve AC(public) above it; label the vertical gap as X-inefficiency that privatisation plus competition can remove.
Evidence: privatised manufacturing units such as BALCO, Hindustan Zinc (with Vedanta) and Maruti Udyog expanded capacity and profits after the change in control. Neelachal Ispat, sold to Tata Steel in 2022, was revived after years of losses.
Limits: most disinvestment has been minority stake sales that leave management unchanged, so efficiency barely improves; proceeds have financed the fiscal deficit rather than manufacturing; and public manufacturing is now a small share of total output, so even full privatisation would hardly move overall growth. Vickers and Yarrow (1988) argued that competition and regulation matter more than ownership.
Disinvestment is therefore a supporting, not a central, strategy for manufacturing growth, which depends more on infrastructure, factor markets and trade policy.
Example 26 (UPSC 2019, 20 marks): Discuss the disinvestment policy adopted by the Government of India as a part of structural adjustment programme of the IMF and the World Bank. Examine the impact of such a policy on industrial growth in India.
Paper and question: Paper II, Q6(a)
Approach: Explain the 1991 crisis and the IMF–World Bank adjustment framework in which disinvestment began, trace the policy's phases, then examine its impact on industrial growth with evidence and a balanced conclusion.
In 1991 India faced a balance of payments crisis and borrowed from the IMF (stand-by arrangement) and the World Bank (structural adjustment loan). The structural adjustment programme that accompanied this support stressed fiscal correction, liberalisation and public sector reform, and disinvestment became part of it.
The policy: (1) 1991–92: sale of up to 20% of equity in selected CPSEs, in bundles, to financial institutions, mainly to raise revenue. (2) The Rangarajan Committee (1993) recommended disinvestment up to 49% in reserved industries and up to 74% in others. (3) The Disinvestment Commission (1996) classified CPSEs into core and non-core and recommended strategic sales. (4) 1999–2004: strategic sales of BALCO, VSNL, Hindustan Zinc, IPCL and others under a separate disinvestment ministry. (5) 2004–14: minority sales with at least 51% government ownership and the National Investment Fund (2005), formalised in the Action Plan of 2009.
Impact on industrial growth: (1) Positive: privatised units such as BALCO, Hindustan Zinc and Maruti expanded capacity and output; fiscal correction partly financed by disinvestment helped macroeconomic stability, which supported the industrial boom of 2003–08. (2) Limited: most sales were minority stakes that did not change management, so efficiency gains in the bulk of CPSEs were small. Proceeds went mainly to the budget, not to industrial investment. Industrial growth after 1991 was driven far more by delicensing, trade reform and private investment than by disinvestment.
Critics argue that selling profitable PSUs to meet fiscal targets meant 'selling the family silver', and that IMF conditions placed revenue above efficiency.
On balance, disinvestment had a modest positive effect on industrial growth, mainly where it transferred control; its larger contribution was to fiscal adjustment.
Example 27 (UPSC 2017, 15 marks): Critically examine the Disinvestment Policy of the Government of India.
Paper and question: Paper II, Q4(c)
Approach: Outline the objectives and phases of the policy up to 2017, then weigh its achievements against its weaknesses (fiscal motive, minority sales, valuation, cross-holdings), and give a reasoned verdict.
Disinvestment aims to improve efficiency of public enterprises, broaden public ownership, raise resources and reduce the state's role in non-strategic sectors.
Phases: minority sales to institutions (1991–92); the Rangarajan Committee (1993) and the Disinvestment Commission (1996); strategic sales of BALCO, VSNL, Hindustan Zinc and others (1999–2004); minority sales retaining 51% under the 2009 Action Plan; and after 2014, offers for sale, the CPSE ETF (2014), renaming of the department as DIPAM (2016) and approval of strategic sales in 2016–17 on NITI Aayog's advice.
Achievements: strategic sales improved efficiency in privatised units; listing improved transparency and corporate governance of CPSEs; receipts reached a record of about ₹1 lakh crore in 2017–18.
Weaknesses: (1) The fiscal motive dominated: proceeds were used to meet deficit targets, not to restructure firms. (2) Minority sales did not change management. (3) Timing and valuation were poor in weak markets, and LIC and other public institutions were often made to buy, so the state simply moved money between its pockets; ONGC's purchase of HPCL (2018) was a similar case. (4) Strategic sales stopped for a decade after 2004 because of political resistance and court cases. (5) Lack of transparency drew criticism in some early sales, such as Centaur Hotel.
The policy is sound in principle but has been driven by revenue needs; it should focus on transferring control in non-strategic sectors with competitive, transparent sales.
3. Foreign Direct Investment and Multinationals in India
Example 28 (UPSC 2024, 10 marks): Comment on FDI in Multi-brand Retail sector in India.
Paper and question: Paper II, Q5(d)
Approach: State the current policy (51% with approval and its conditions), give the arguments for and against, and comment on why it has had little uptake.
Multi-brand retail means stores selling many brands, such as supermarkets. Since September 2012, India allows up to 51% FDI in it through the government route, with conditions: a minimum investment of USD 100 million, at least 50% of it in back-end infrastructure (cold chains, warehousing), at least 30% sourcing from Indian small industries, stores only in cities with over 10 lakh population, and permission of the state government.
For: investment in supply chains could cut wastage and middlemen, raise farmers' price share, lower consumer prices and create organised jobs, as in China and Thailand.
Against: it may displace millions of small kirana stores and traders, give large firms buying power over farmers and suppliers, and increase imports of cheap goods.
Comment: uptake has been almost nil because the conditions are strict, several states have not agreed, and the policy has been politically uncertain. Global retailers instead entered through wholesale cash-and-carry, single-brand retail and e-commerce marketplaces (Walmart–Flipkart, 2018). A calibrated opening with safeguards for small traders could still bring back-end investment.
Example 29 (UPSC 2024, 20 marks): Evaluate the policy of Government of India with regard to foreign investment in the country. Do you feel that there is a need for control of their activities?
Paper and question: Paper II, Q6(a)
Approach: Evaluate the foreign investment policy (evolution, routes and caps, FPI regime, recent changes, results with data), then argue for a calibrated regulation of foreign investors' activities rather than blanket control.
Evolution of policy: India moved from the restrictive FERA (1973), which generally limited foreign equity to 40%, to automatic approval of up to 51% in 34 priority industries in 1991, and to FEMA (1999), which treats foreign exchange as a matter of management rather than control. Today most sectors are on the automatic route; a few need government approval; and the FIPB was abolished in 2017. Caps have been raised steadily: telecom 100% (2021), defence 74% automatic (2020), and insurance 100% (December 2025). Portfolio investment by foreign portfolio investors (FPIs) is regulated by SEBI, with debt limits set by the RBI.
Recent features: Press Note 3 (April 2020) requires approval for investment from countries sharing a land border with India; production-linked incentives (2020–21) attract export-oriented FDI.
Results: gross FDI inflows grew from under USD 1 billion a year in the early 1990s to about USD 94.5 billion in 2025–26, and cumulative inflows since 2000 crossed USD 1 trillion in 2024. But net FDI fell to about USD 7.7 billion in 2025–26 because of repatriation and outward investment.
Need for control? Blanket control would deter investment, but calibrated regulation of activities is needed in some areas: (1) transfer pricing and tax avoidance, handled by the CBDT and the General Anti-Avoidance Rule (2017); (2) anti-competitive conduct and acquisitions, handled by the CCI; (3) national security screening, as under Press Note 3; (4) data protection, under the Digital Personal Data Protection Act, 2023; (5) volatile portfolio flows, through macroprudential limits.
So India should keep an open policy but strengthen sector regulators and tax and competition enforcement, rather than return to licensing of foreign investment.
Example 30 (UPSC 2022, 10 marks): Do you think that flow of Foreign Direct Investment (FDI) would always be good for the growth of Indian economy? Critically analyse.
Paper and question: Paper II, Q5(d)
Approach: Answer 'not always': give the growth benefits of FDI briefly, then the conditions under which it can harm (type, sector, profit repatriation, crowding out, volatility), and conclude with what makes FDI beneficial.
Foreign Direct Investment is investment that gives a lasting interest and control, conventionally 10% or more of equity. It usually supports growth by adding capital, technology, management, export links and jobs, as seen in India's automobile and electronics industries.
However, FDI is not always good. (1) Type matters: much FDI is the acquisition of existing firms (brownfield), which adds little new capacity. (2) Profit repatriation and royalty payments can exceed fresh inflows over time; India's net FDI fell to about USD 7.7 billion in 2025–26 against gross inflows of about USD 94.5 billion. (3) Large MNCs can crowd out domestic firms and raise market concentration. (4) Transfer pricing and treaty shopping through tax havens erode the tax base. (5) FDI in capital-intensive sectors may create few jobs, and FDI attracted by weak environmental rules can be harmful. (6) Some FDI raises security concerns, which led to Press Note 3 (2020).
FDI is beneficial when it is greenfield, export-oriented, linked to local suppliers and regulated by strong tax and competition institutions.
Example 31 (UPSC 2021, 15 marks): Examine how the domestic companies are competing with the MNCs in the post-liberalisation era.
Paper and question: Paper II, Q3(b)
Approach: Describe the competitive pressure after 1991 and examine the strategies by which Indian firms competed (restructuring, frugal innovation, distribution, scale, acquisitions abroad, alliances), with examples of success and failure.
After 1991, delicensing, tariff cuts and FDI liberalisation brought multinational corporations (MNCs) with superior technology, brands and finance into Indian markets. Domestic firms that had grown under protection had to compete or exit; the 'Bombay Club' (1993) of industrialists even sought a level playing field.
How domestic firms competed: (1) Restructuring and focus: groups such as Tata and Mahindra divested non-core businesses and modernised plants. (2) Frugal innovation and products for Indian needs: Tata Motors' Indica and Ace, Mahindra tractors and SUVs, and low-cost generic medicines. (3) Distribution reach and local knowledge: Asian Paints, Dabur and Hero used deep rural networks. (4) Scale and cost leadership in IT services, where TCS and Infosys compete globally. (5) Acquisitions abroad: Tata Steel–Corus (2007), Tata Motors–JLR (2008), Bharti–Zain Africa (2010). (6) Alliances and later independence, as Hero split from Honda in 2011. (7) Digital disruption: Reliance Jio (2016) reshaped telecom.
Failures: some firms sold out, such as Parle's soft drinks to Coca-Cola (1993) and Ranbaxy to Daiichi Sankyo (2008), and MNCs dominate segments such as cars and personal care.
Overall, Indian firms competed successfully where they combined local insight, cost advantage and scale.
Example 32 (UPSC 2021, 20 marks): Analyse the sectoral inflows of FDI in India during the post-liberalisation period.
Paper and question: Paper II, Q7(a)
Approach: Trace the sectoral composition of FDI inflows across three phases (1990s, 2000s, 2010s onward) with data from DPIIT, explain the reasons for the shifts, and note the gaps (manufacturing share, concentration), with a bar diagram.
FDI inflows into India rose from about USD 0.1 billion in 1990–91 to about USD 82 billion in 2020–21 (gross, RBI), and their sectoral pattern changed with policy and comparative advantage.
1990s: FDI was small and went mainly to infrastructure and manufacturing opened by the 1991 policy: power, telecom, transport equipment (Suzuki, Hyundai, Ford), chemicals, food processing and electrical equipment. Much of it was market-seeking, attracted by a large protected domestic market.
2000s: the services sector (financial and non-financial services) became the largest recipient, followed by computer software and hardware, telecommunications, construction and real estate (opened in 2005), housing and power. India's IT boom and opening of construction drove this shift.
2010s onward: services, computer software and hardware, trading (including e-commerce, as in Walmart–Flipkart, 2018), automobiles, telecom and chemicals led. In 2020–21, computer software and hardware was the top sector, with large inflows into Reliance Jio Platforms from Facebook and Google. Cumulatively since April 2000, services and computer software and hardware each account for roughly 15–16% of equity inflows.
Diagram: grouped bar chart of FDI equity share by sector for three periods (1991–2000, 2000–2010, 2010–2021); bars for services and computer software rising over time, manufacturing sectors (autos, chemicals, drugs) stable or falling, construction peaking in the 2000s.
Assessment: FDI has followed India's comparative advantage in services and its large consumer market, but manufacturing has received a modest share, and export-oriented FDI has been limited compared with China and Vietnam. Inflows are also concentrated in a few states (Maharashtra, Karnataka, Gujarat, Delhi). PLI schemes since 2020 aim to shift FDI towards electronics and other manufacturing.
Example 33 (UPSC 2020, 10 marks): Evaluate the role of FDI in contributing economic growth of India.
Paper and question: Paper II, Q5(a)
Approach: Explain the channels through which FDI contributes to growth (capital, technology, exports, jobs, competition), give Indian evidence and scale, and evaluate the limits.
FDI contributes to growth by filling the savings–investment and foreign exchange gaps (the two-gap model of Chenery and Strout, 1966) and, more importantly, by bringing technology, management and market access that raise productivity.
Role in India: (1) Capital: gross FDI inflows rose to about USD 74 billion in 2019–20, a stable source for financing the current account deficit. (2) Technology and spillovers: Maruti Suzuki (1982) built a large domestic component industry. (3) Sectors such as telecom, IT, pharmaceuticals and retail expanded with foreign capital.
Limits: FDI is only about 1.5–2% of GDP, a small part of total investment, which is financed mainly by domestic savings; much of it is acquisitions or comes through Mauritius and Singapore; its share in manufacturing exports is lower than in East Asia; and profit repatriation reduces net inflows.
So FDI has been a useful complement to domestic investment, strongest in autos, telecom and services, but not the main driver of India's growth.
Example 34 (UPSC 2019, 10 marks): Has India been able to exploit the potential of foreign direct investment (FDI) for export oriented production? Give reasons for your answer.
Paper and question: Paper II, Q5(b)
Approach: Answer largely no (as of 2019): explain why India's FDI has been market-seeking rather than export-platform, with contrasts to China, then note exceptions and later improvement.
Largely no. Unlike China and Vietnam, where foreign firms account for a large share of manufactured exports, most FDI in India has been market-seeking, aimed at selling to India's large domestic market, not at export production.
Reasons: (1) Inadequate infrastructure, ports and logistics raise export costs. (2) Rigid labour laws and land problems discourage the large, labour-intensive plants that export platforms need. (3) An inverted duty structure and high tariffs on inputs hurt integration into global value chains. (4) SEZs (2005 Act) attracted mostly IT services and lost appeal after the Minimum Alternate Tax was applied to them (2011). (5) Policy uncertainty, as with retrospective taxation (2012).
Exceptions: Hyundai and Suzuki export cars, and IT and pharmaceutical MNCs export services and generics.
India's under-use of FDI for exports was a key gap in 2019; later, PLI schemes drew Apple's suppliers and Samsung, making smartphones a leading export, showing the potential when policy targets it.
Example 35 (UPSC 2018, 15 marks): Why should FDI be preferred over FPI? Comment on government's initiatives in this respect.
Paper and question: Paper II, Q8(c)
Approach: Distinguish FDI from FPI, give reasons to prefer FDI (stability, technology, control, sudden-stop risk), then comment on the government's initiatives to attract FDI and manage FPI.
FDI is investment with a lasting interest and control, conventionally 10% or more of a firm's equity; FPI (foreign portfolio investment) is investment in shares and bonds below that threshold, held for financial return and easily sold.
Why FDI is preferred: (1) Stability: FDI is tied to plants and long-term operations, while FPI is 'hot money' that can reverse suddenly, as in the 2013 taper tantrum, when FPI outflows pushed the rupee down sharply. (2) FDI brings technology, management, skills and market access; FPI brings only finance. (3) FDI adds directly to productive capacity and jobs; FPI mainly raises asset prices. (4) FDI is a safer way to finance the current account deficit and reduces the risk of a sudden stop. (5) FPI volatility complicates monetary and exchange rate management.
Government initiatives: on FDI, most sectors were moved to the automatic route; caps were raised in defence, insurance, civil aviation and single-brand retail; the FIPB was abolished in 2017; Make in India (2014) and Invest India provide facilitation; and ease of doing business reforms followed. On FPI, SEBI consolidated FIIs and QFIs into a single FPI regime (2014) and the RBI manages debt limits and uses reserves to smooth volatility.
These initiatives correctly favour FDI while keeping FPI open but managed, since FPI also deepens capital markets.
Example 36 (UPSC 2017, 20 marks): What developmental role can FDI play in a backward economy? What policy has India been following to attract FDI and what safeguards should the country adopt?
Paper and question: Paper II, Q7(a)
Approach: Explain FDI's developmental role in a backward economy using theory (two-gap model, technology, linkages, human capital), then describe India's FDI policy to attract it, and list safeguards.
Developmental role: a backward economy suffers from low savings, scarce foreign exchange, weak technology and poor skills. FDI can help in several ways. (1) It fills the savings and foreign exchange gaps of the two-gap model (Chenery and Strout, 1966) without adding to external debt. (2) It transfers technology and managerial know-how, and generates spillovers to local firms through demonstration, labour turnover and supplier linkages, in Hirschman's sense of backward linkages. (3) It trains workers and raises human capital. (4) It gives access to global markets and value chains, as in East Asia. (5) It increases competition and efficiency. (6) It adds to tax revenue and employment.
India's policy: since 1991 India has moved from case-by-case approval to an open regime: automatic approval of up to 51% in priority industries (1991), FEMA (1999), most sectors on the automatic route with sectoral caps, and steady liberalisation after 2014 in defence, railways, insurance, civil aviation and single-brand retail. Make in India (2014), Invest India, SEZs, investment promotion by states and the abolition of the FIPB (2017) aim to attract FDI.
Safeguards: (1) Screening in sensitive sectors such as defence, telecom and media for national security. (2) Competition law (CCI) to prevent dominance and anti-competitive acquisitions. (3) Transfer pricing rules and anti-avoidance provisions against tax base erosion, and renegotiated tax treaties (India–Mauritius, 2016). (4) Environmental and labour standards. (5) Encourage greenfield and export-oriented FDI and local supplier development. (6) Watch profit repatriation and maintain adequate reserves.
With such safeguards, FDI can be a powerful complement to domestic effort in development.
Example 37 (UPSC 2016, 15 marks): Critically examine the major changes in FDI policies of the Government of India since 1991.
Paper and question: Paper II, Q7(c)
Approach: Trace the major changes in FDI policy from 1991 to 2016 (approval system, routes, FEMA, sectoral caps, FIPB, Make in India liberalisation), then critically assess outcomes and concerns.
Major changes: (1) 1991: the New Industrial Policy allowed automatic approval of FDI up to 51% in 34 high-priority industries, ending FERA's general 40% limit, and set up the FIPB for other proposals. (2) 1996–2000: automatic approval was extended to more sectors and higher limits, and FEMA (1999, in force 2000) replaced FERA. (3) 2000s: caps were raised in telecom (to 74% in 2005), aviation, banking and retail; FDI in construction (2005) and single-brand retail (51% in 2006, 100% in 2012) was opened; multi-brand retail at 51% (2012). (4) 2014–16: under Make in India, defence (49%, and beyond on approval), railways infrastructure (100%), insurance and pensions (49%) were liberalised, and in June 2016 a large package raised most caps further; the FIPB's role shrank and it was abolished in 2017.
Critical assessment: FDI inflows rose from under USD 1 billion a year in the early 1990s to about USD 55 billion in 2015–16 (gross), and helped autos, telecom and IT. But concerns remained: a large share came through Mauritius, raising tax-avoidance issues (the treaty was amended in 2016); much FDI was acquisition rather than greenfield; manufacturing and exports received a modest share; and frequent changes in caps and conditions created uncertainty.
Overall, the policy moved steadily from control to facilitation, though the quality of FDI still needs attention.
Example 38 (UPSC 2015, 15 marks): There is a need for an 'apex agency' to monitor and to regulate the entry and functioning of transnational corporations in the context of India's broader national interest. Give arguments in support of your answer.
Paper and question: Paper II, Q7(b)
Approach: Support the idea with arguments (transfer pricing, dominance, security, data, fragmented regulation), describe what such an agency would do without blocking investment, and note the counter-argument.
Transnational corporations (TNCs) bring capital and technology, but their size and global structure give them power that can conflict with national interest. A single apex agency to monitor their entry and functioning can be justified.
Arguments in support: (1) Transfer pricing and profit shifting through tax havens erode India's tax base, as the Vodafone (2012) and other disputes showed. (2) Market dominance: TNCs can acquire domestic leaders and squeeze competitors, as concerns over e-commerce and soft drinks showed. (3) National security in sensitive sectors such as telecom, defence, ports and data. (4) Outflows of profits, royalties and technical fees can exceed fresh inflows. (5) Compliance with environmental and labour standards, after tragedies such as Bhopal (1984). (6) Today oversight is fragmented among DPIIT, the FIPB, RBI, SEBI, CCI, CBDT and sector regulators, so no one sees the whole picture of a TNC's activities. (7) Restrictive clauses in technology agreements can limit exports or local R&D.
What it should do: maintain a database of TNC activities, coordinate screening and post-entry monitoring across regulators, track transfer pricing and repatriation, and report to Parliament, without reintroducing case-by-case licensing.
Counter-argument: another layer of bureaucracy could deter investment, as the abolition of the FIPB in 2017 recognised. Hence the agency should be a coordinating and monitoring body, not a gatekeeper.
Example 39 (UPSC 2014, 15 marks): Write for and against FDI in retail trade of India.
Paper and question: Paper II, Q8(c)
Approach: Explain the policy position as of 2014 (single-brand and multi-brand rules), then set out the arguments for and against FDI in retail in parallel, and close with a balanced view.
Retail trade is India's second-largest employer after agriculture, but it is dominated by small unorganised shops. By 2012, India allowed 100% FDI in single-brand retail (with 30% local sourcing for stakes above 51%) and up to 51% in multi-brand retail with government approval, minimum investment of USD 100 million, 50% in back-end infrastructure, and state consent.
For: (1) Investment in cold chains, warehousing and logistics could cut post-harvest losses, which are large for fruits and vegetables. (2) Direct sourcing from farmers could cut layers of middlemen and raise farmers' share of the consumer price. (3) Consumers gain from lower prices, quality and choice. (4) Organised retail creates formal jobs and expands the tax base. (5) Sourcing from Indian small industries could link them to global supply chains, as Walmart and IKEA sourcing shows.
Against: (1) It may displace millions of kirana shops and small traders who have few alternative jobs. (2) Large retailers can gain monopsony power over farmers and suppliers and predatory pricing can kill competition. (3) Profits are repatriated and imports of cheap goods, especially from China, may rise. (4) Regulation of large retailers is weak and several states opposed it, making policy uncertain.
A phased opening with strict back-end, sourcing and competition safeguards, and support for kiranas to modernise, is a sensible middle path.
Mains points
- Industrial policy questions reward a clear before-and-after: IPR 1956 and the licence raj versus the NIP 1991 (delicensing, dereservation, MRTP changes, FDI, PSU reform), followed by Make in India (2014) and PLI (2020–21).
- Examiners look for evidence on outcomes: the manufacturing share stuck at about 15–17% of GDP, services-led growth, the missing middle and premature deindustrialisation (Rodrik), and productivity studies such as Aghion and others (2008) and Topalova and Khandelwal (2011).
- Disinvestment answers should trace the phases with committees and years: Rangarajan (1993), Disinvestment Commission (1996), strategic sales 1999–2004, Action Plan 2009, DIPAM (2016), NPSEP 2021 and Air India (2022), and argue that competition matters more than ownership.
- FDI answers need policy evolution (FERA to FEMA, automatic route, FIPB abolished 2017, Press Note 3 of 2020, insurance 100% in 2025), current inflow data with the gross versus net distinction, and a balanced view of MNCs with Indian examples.
- Directive words matter: 'critically examine' needs both sides and a verdict; 'comment' needs your own judgement; short notes need definitions, dates and outcomes.
Did you know?
- Modern Food Industries, a bread maker sold to Hindustan Lever in 2000, was the first central public sector enterprise to be privatised through a strategic sale.
Economics Optional: All chapters
- Exam Pattern, Syllabus and Strategy
- Price Determination and Theories of Distribution
- Market Structures
- Welfare Economics
- Theories of Employment, Income and Interest
- Money and Monetary Management
- Public Finance
- Theories of International Trade
- Trade Policy, Protection and the WTO
- Balance of Payments and Exchange Rates
- Theories of Growth
- Economic Development
- Indian Economy in the Pre-Independence Era
- Planning in India
- Agriculture before Liberalisation
- Industry before Liberalisation
- National Income, Poverty and Inequality
- Agriculture after Liberalisation
- Industry after Liberalisation
- External Sector after Liberalisation
- Public Finance and Fiscal Federalism in India
- Monetary System and the RBI
- Employment, Wages and Poverty Alleviation