
Economics Optional · UPSC Notes
Economic Development — UPSC Economics Optional Notes
Free, exam-focused notes for UPSC Prelims and Mains, with Prelims tips and Mains points for every topic. 6 topics.
Open in the interactive reader: bookmarks, progress tracking and read-aloud.
Myrdal, Kuznets and Structural Change; Role of Agriculture
Gunnar Myrdal (1957) argued that market forces widen, not narrow, gaps between regions through circular and cumulative causation, with backwash effects outweighing spread effects. Simon Kuznets documented structural change: as income rises the shares of agriculture in output and employment fall and those of industry and services rise, while inequality first rises and then falls (the inverted U). Agriculture supports development through food, labour, capital, foreign exchange and markets.
In simple words
Myrdal said rich regions keep getting richer because money, skilled people and trade flow towards them; poor regions fall behind unless the state steps in. This is cumulative causation.
Kuznets showed that as countries develop, people move from farms to factories and offices, like children growing taller in a set pattern.
Agriculture matters because it feeds workers and supplies savings and markets for industry.
UPSC asks you to explain backwash effects, the Kuznets curve and agriculture's contributions with Indian data.
1. Myrdal: Circular and Cumulative Causation
Source: Gunnar Myrdal, Economic Theory and Under-developed Regions (1957), and Asian Drama: An Inquiry into the Poverty of Nations (1968); Myrdal shared the 1974 Nobel with Friedrich Hayek.
Core idea: a change does not call forth countervailing forces that restore equilibrium, as neo-classical theory assumes; instead it sets off supporting changes that push the system further in the same direction.
Backwash effects: a growing region draws labour, capital and trade away from lagging regions; migration takes away the young and skilled, capital moves to where returns are higher, and the industries of the growing region out-compete the crafts of the lagging region.
Spread effects: centrifugal effects from the growing centre to other regions through demand for agricultural products and raw materials and diffusion of technology.
Result: in poor countries backwash effects are strong and spread effects weak, so regional and international inequalities widen; in rich countries, with better transport and education, spread effects are stronger.
International version: free trade and capital movements tend to benefit industrial countries and harm primary producers, close to the Prebisch-Singer argument.
Policy: state intervention, planning and land reform are needed; in Asian Drama Myrdal described South Asian states, including India, as 'soft states' that pass laws but fail to enforce them.
Comparison with Hirschman: Hirschman's 'trickling-down' and 'polarisation' effects correspond to Myrdal's spread and backwash; Hirschman was more optimistic that trickle-down would win in time.
2. Kuznets: Modern Economic Growth and Structural Change
Source: Simon Kuznets, Modern Economic Growth: Rate, Structure and Spread (1966) and Economic Growth of Nations (1971); Nobel 1971 for his empirically founded interpretation of growth.
Six characteristics of modern economic growth (Kuznets, Nobel lecture 1971): high rates of growth of per capita product and population; high rate of rise in productivity; high rate of structural transformation; rapid changes in social structure and ideology (urbanisation, secularisation); international spread through transport and communication; but limited spread, leaving three-quarters of the world behind.
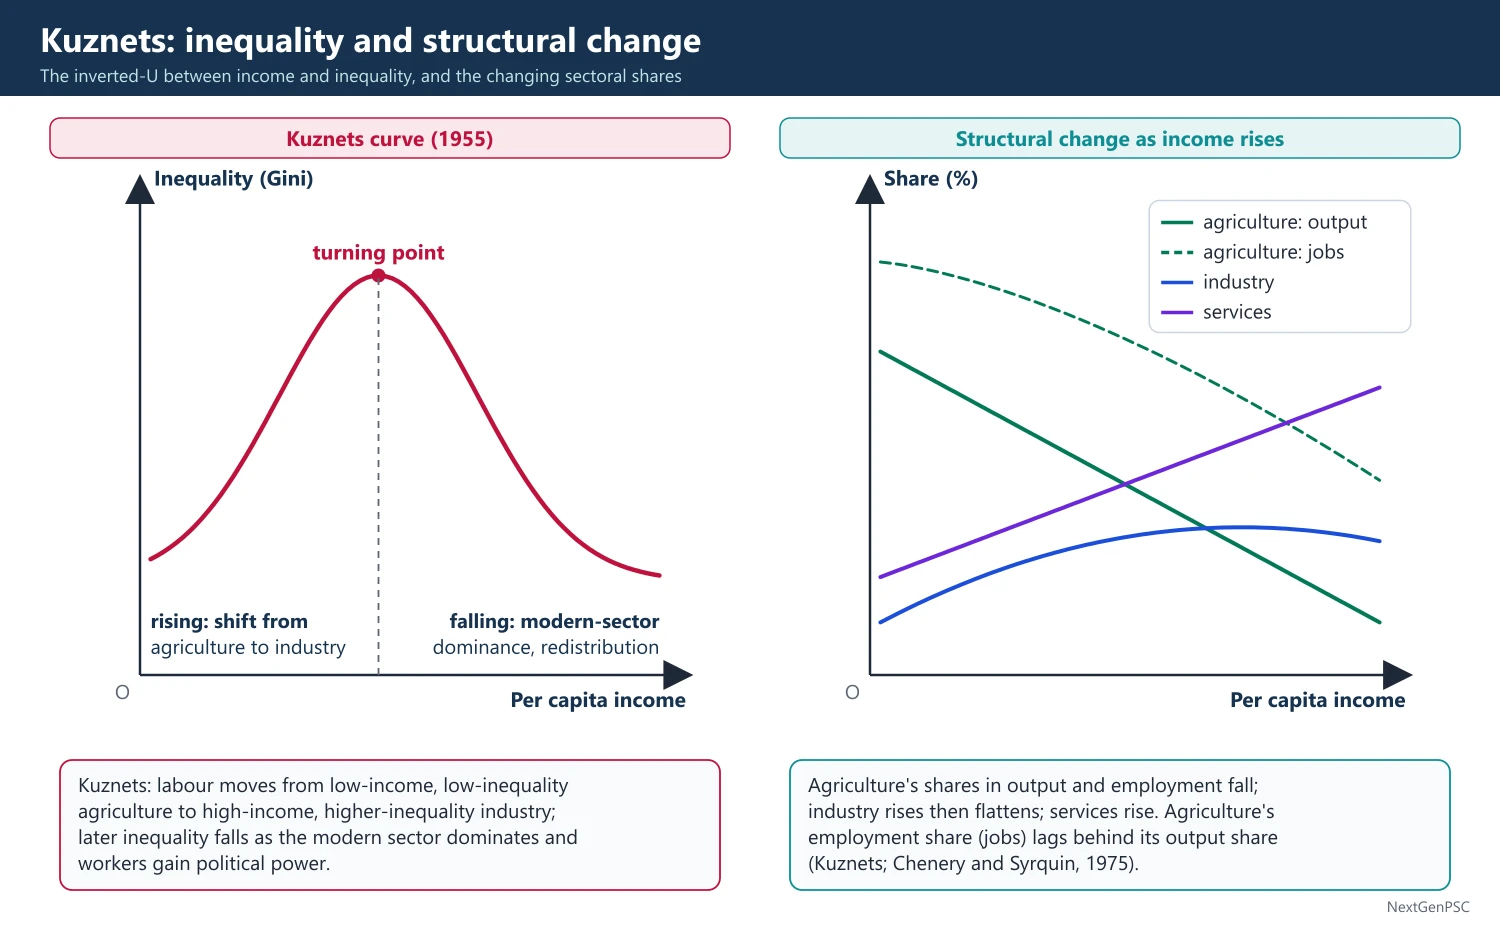
Sectoral shifts: the share of agriculture (A sector) in output and labour falls; the share of industry (I sector) rises and later stabilises; services (S sector) rise; the labour share of agriculture falls more slowly than its output share, so agricultural labour productivity lags.
Chenery and Syrquin, Patterns of Development, 1950–1970 (1975): cross-country regressions confirm the structural pattern: rising industry, rising saving and investment, urbanisation and demographic transition as income rises.
Kuznets curve: in 'Economic Growth and Income Inequality', American Economic Review (1955), Kuznets suggested that inequality first rises as labour moves from low-income, low-inequality agriculture to high-income, higher-inequality industry, and then falls as the modern sector dominates and workers gain political power.
Evidence on the curve: early cross-section data (Ahluwalia 1976) seemed to support it; later panel studies (Deininger and Squire 1998) found it does not hold within most countries; Piketty (Capital in the Twenty-First Century, 2013) showed rising inequality in rich countries since 1980, so the curve is now treated as debated.
Premature deindustrialisation: Dani Rodrik (Journal of Economic Growth, 2016) showed that today's developing countries reach peak manufacturing shares at lower incomes than early industrialisers; India's services-led growth is the leading example.
3. Role of Agriculture in Development
Kuznets's four contributions (1961): product contribution (food and raw materials), factor contribution (labour and capital transferred to other sectors), market contribution (demand for industrial goods and inputs) and foreign-exchange contribution (exports or import saving).
Johnston and Mellor, 'The Role of Agriculture in Economic Development', American Economic Review (1961): five roles: (1) supply food for a growing population and urban workers; (2) earn foreign exchange; (3) release labour to industry; (4) provide capital through taxes, savings and terms of trade; (5) raise farm incomes that form a market for industrial goods.
Food and wages: rising food output keeps the real wage of industrial workers from rising too early (Lewis, Ranis-Fei); food shortages raise wage costs and choke industry.
Transforming traditional agriculture: T. W. Schultz (1964) argued that poor farmers are 'poor but efficient'; growth needs new inputs (high-yielding seeds, fertiliser) and human capital, not exhortation.
Agricultural growth and poverty: studies (World Bank, World Development Report 2008: Agriculture for Development) found that GDP growth originating in agriculture reduces poverty much more than growth in other sectors.
Mellor's model (1976): John Mellor's The New Economics of Growth argued for an agriculture-led, employment-oriented strategy for India, with rising farm incomes creating demand for labour-intensive rural goods.
4. Diagrams to Draw
Kuznets curve: x-axis per capita income, y-axis a measure of inequality (Gini); draw an inverted U; label the rising part 'shift from agriculture to industry' and the falling part 'modern sector dominance, redistribution'.
Structural change chart: x-axis per capita income (or time); three lines: agriculture's share falling, industry's share rising then flattening (an inverted U), services rising; show employment share of agriculture lagging behind its output share.
Myrdal's cumulative causation: a circular flow chart: initial advantage → more investment → more jobs → in-migration of skilled labour → larger market → higher tax base and better services → further investment; draw the opposite circle for a lagging region.
5. Examples and Applications
India's structural change: agriculture's share of GVA fell from over 50% in 1950–51 to about 16–18% in recent years (NSO, base 2011–12), while its share of employment was about 46% in 2023–24 (PLFS), the biggest gap between output and labour shares among large economies.
Services-led path: services contribute over half of India's GVA, while manufacturing has stayed at roughly 15–17% of GVA for decades, far short of the 25% goal of the National Manufacturing Policy (2011).
Regional backwash in India: the gap between richer southern and western states and poorer states such as Bihar and Uttar Pradesh widened after 1991, a pattern consistent with cumulative causation; the Finance Commission's equalisation transfers and the Aspirational Districts Programme (2018) are corrective tools.
Agriculture's market role in India: rural demand (tractors, two-wheelers, FMCG) still drives a large share of consumer demand, so good monsoons lift industrial sales.
World: China's agricultural reforms of 1978 (household responsibility system) raised farm incomes and released labour before its manufacturing boom.
6. Theory and Debates
Engel's law: as income rises the share of spending on food falls (Ernst Engel, 1857), a demand-side reason why agriculture's share of output declines.
Baumol's cost disease (1967): productivity grows slowly in many services, so their relative price and share of spending rise as incomes grow, another source of the rising services share.
Lewis and Kuznets together: the transfer of labour from low-productivity agriculture to high-productivity modern sectors is the common engine of structural change; McMillan and Rodrik (2011) showed that in parts of Africa and Latin America labour moved the wrong way, into lower-productivity informal work, after 1990.
Convergence versus cumulative causation: the Solow model predicts that poorer regions catch up as capital flows to them; most studies of Indian states find divergence in per capita income since the 1990s, supporting Myrdal, though some find conditional convergence (debated).
Agriculture-first versus industry-first: Mellor and Johnston favoured agriculture-led growth, Mahalanobis favoured heavy industry; India's food crisis of 1965–67 forced a shift to the Green Revolution strategy.
7. Using It in the Exam
10 marks: define backwash and spread effects, or state the inverted-U hypothesis with one line of evidence.
15 marks: Kuznets's structural pattern with India's output and employment shares (with year and source).
20 marks: Myrdal and Kuznets compared, the role of agriculture (Johnston-Mellor's five roles), premature deindustrialisation and Indian evidence.
Keywords: circular and cumulative causation, backwash, spread, soft state, structural transformation, inverted U, product and factor contribution.
Attributed idea: Myrdal argued that the play of market forces normally tends to increase, rather than decrease, inequalities between regions (paraphrase of Economic Theory and Under-developed Regions).
| Contribution (Kuznets 1961) | Mechanism | Indian illustration |
|---|---|---|
| Product | Food and raw materials for industry and towns | Green Revolution ended food imports under PL-480 |
| Factor | Labour and capital moved to other sectors | Land revenue, rural savings in banks, migration to cities |
| Market | Farm households buy industrial goods and inputs | Tractor, fertiliser and two-wheeler demand tied to monsoon |
| Foreign exchange | Exports earn and import substitution saves foreign exchange | Rice, marine products, spices and sugar exports |
Mains points
- Distinguish backwash and spread effects clearly and link them to regional inequality in India.
- Quote Kuznets's characteristics of modern economic growth and the structural pattern with Indian NSO and PLFS figures, each with its year.
- Treat the Kuznets curve as a hypothesis whose evidence is debated; mention Deininger-Squire and Piketty.
- For agriculture questions, list Johnston-Mellor's five roles or Kuznets's four contributions and illustrate each from India.
- Bring in premature deindustrialisation (Rodrik 2016) to discuss India's services-led growth.
- Common mistake: using 'Kuznets curve' for the environmental Kuznets curve without saying it is a separate, later idea (Grossman and Krueger).
Did you know?
- Simon Kuznets also built the first official US national income estimates in the 1930s and warned that national income is not a measure of welfare.
Trade, Foreign Investment and Multinationals in Development
Trade can be an engine of growth (Robertson, Nurkse) by widening markets, transferring technology and easing the foreign-exchange constraint, but Prebisch-Singer and dependency theorists warned that primary exporters face declining terms of trade. The debate between import substitution and export promotion was largely settled by East Asia in favour of outward orientation. Foreign direct investment and multinationals bring capital, technology and market access, with risks of transfer pricing, crowding out and profit repatriation.
In simple words
Trade lets a poor country sell what it makes well and buy machines it cannot make, so it can grow faster than with only its own small market. This is trade as an engine of growth.
Foreign companies opening factories are like a skilled cook joining a village kitchen: they bring recipes, jobs and customers, but they also take a share of the profits.
The balance between gains and risks matters for India's growth and jobs.
UPSC asks about import substitution versus export promotion, FDI's benefits and costs, and multinationals.
1. Trade and Development: Concepts
Trade as an engine of growth: D. H. Robertson's phrase, used by Nurkse (1959 Wicksell lectures) to describe how 19th-century exports of primary goods from the 'regions of recent settlement' (USA, Canada, Australia) were pulled by British industrial demand; Nurkse doubted that 20th-century demand for primary goods would grow fast enough to play the same role.
Static gains: specialisation according to comparative advantage (Ricardo, Heckscher-Ohlin) raises real income for given resources.
Dynamic gains: larger markets allow economies of scale; imports of capital goods embody new technology; competition raises efficiency; exports ease the foreign-exchange constraint on growth.
Vent for surplus (Hla Myint, 1958, reviving Adam Smith): trade gives an outlet for the output of land and labour that were idle, so exports rise without reducing domestic production; it fits 19th-century Burma and West Africa.
Trade as a 'handmaiden' of growth: Irving Kravis (1970) argued that trade supported but did not cause 19th-century growth; domestic factors mattered most.
2. Pessimism about Trade
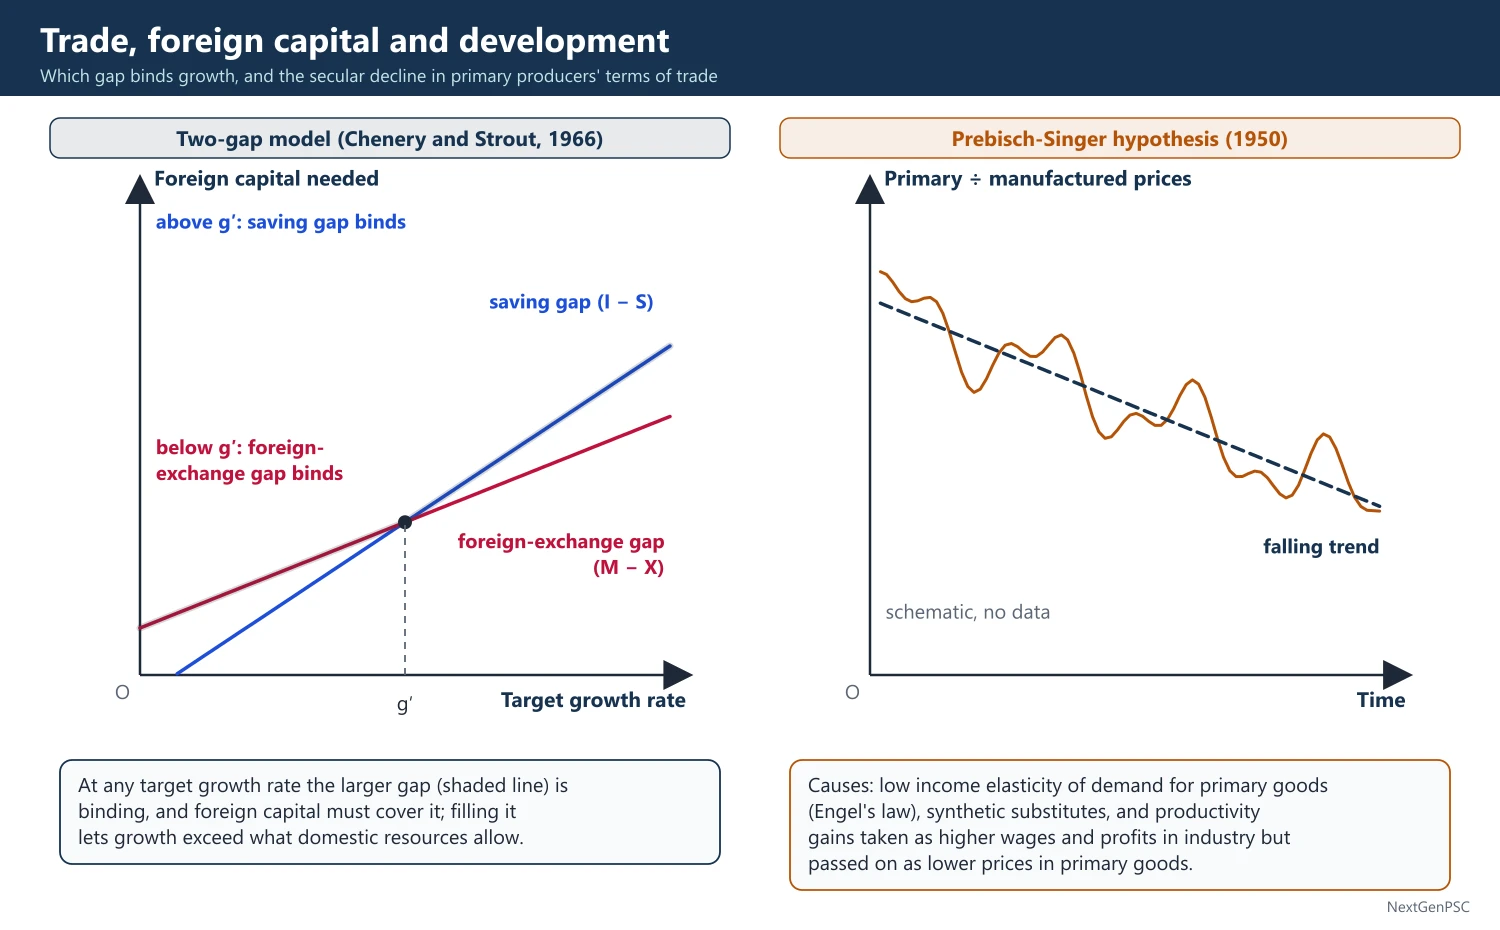
Prebisch-Singer hypothesis (1950): Raúl Prebisch (ECLA report) and Hans Singer argued that the terms of trade of primary producers decline over time because income elasticity of demand for primary goods is low (Engel's law), synthetic substitutes appear, and productivity gains in industry are taken as higher wages and profits while in primary goods they are passed on as lower prices.
Immiserising growth (Bhagwati, 1958): export-biased growth in a large country with inelastic foreign demand can worsen its terms of trade so much that welfare falls.
Dependency theory: Andre Gunder Frank (development of underdevelopment), Samir Amin and others argued that the periphery is kept poor by its links with the centre; Immanuel Wallerstein's world-systems theory extended this.
Evidence: long-run studies (Grilli and Yang, 1988) found a decline in the relative price of primary commodities of roughly 0.5–0.6% a year over the 20th century, with large fluctuations; the trend is debated because of commodity booms such as 2003–2011.
3. Import Substitution versus Export Promotion
Import-substituting industrialisation (ISI): protect domestic industry by tariffs, quotas and overvalued exchange rates so that it replaces imports; easy stage (consumer goods) then hard stage (intermediate and capital goods); followed by Latin America and India (1950s–1980s).
Criticisms of ISI: Little, Scitovsky and Scott, Industry and Trade in Some Developing Countries (1970), Bhagwati and Krueger (NBER studies, 1970s) showed high effective rates of protection, inefficient high-cost industries, anti-export bias, capital-intensive production that created few jobs and recurring foreign-exchange crises.
Rent seeking: Anne Krueger, 'The Political Economy of the Rent-Seeking Society', American Economic Review (1974), using India and Turkey, showed that import licences create rents and resources are wasted competing for them.
Export promotion (outward orientation): neutral incentives or incentives favouring exports, realistic exchange rates, duty-free access to imported inputs; South Korea, Taiwan, Hong Kong and Singapore grew fast from the 1960s.
Debated nuance: Amsden (Asia's Next Giant, 1989) and Wade (Governing the Market, 1990) showed that East Asian states also used selective industrial policy, directed credit and protection, but disciplined firms through export targets; so the lesson is 'export discipline', not pure laissez-faire.
4. Foreign Direct Investment
Definition: investment that gives a lasting interest and control, conventionally 10% or more of equity (IMF and OECD benchmark, also used by India since 2020 for listed companies), as distinct from portfolio investment.
Two-gap model (Chenery and Strout, 1966): growth may be limited by a saving gap (I − S) or a foreign-exchange gap (M − X); foreign capital fills the binding gap, raising growth above what domestic resources allow.
Theories of FDI: Stephen Hymer (1960 thesis) said firms go abroad to exploit firm-specific advantages that overcome the costs of being foreign; Raymond Vernon's product life cycle (1966) said production moves abroad as products mature; John Dunning's eclectic or OLI paradigm (1977, 1979): FDI occurs when a firm has Ownership advantages, the host has Location advantages, and Internalisation is better than licensing.
Benefits to host: capital, technology and managerial know-how, employment, exports through global value chains, competition, and spillovers to local suppliers (backward linkages).
Costs and risks: profit and royalty repatriation, transfer pricing to shift profits to low-tax jurisdictions, crowding out of domestic firms, restrictive clauses on exports, enclave development, and loss of policy space; Singer (1950) argued that foreign investment in primary exports created enclaves with few linkages.
5. Multinational Corporations (MNCs)
Meaning: firms that own or control production in more than one country; UNCTAD's World Investment Report tracks them.
Positive view: MNCs integrate developing countries into global value chains; Apple's suppliers in India and Suzuki's joint venture in Maruti Udyog (agreement signed 1982) built supplier networks and raised quality standards.
Critical view: dependency theorists see MNCs as channels of surplus extraction; Paul Streeten and Sanjaya Lall analysed transfer pricing and technology dependence; MNCs may lobby for favourable policies.
Regulation: host countries use performance requirements, local content rules (restricted under the WTO's TRIMs Agreement, 1995), competition law, transfer-pricing rules and, since 2021, the OECD/G20 global minimum corporate tax of 15% (Pillar Two).
6. Diagrams to Draw
Two-gap diagram: x-axis growth rate, y-axis foreign capital needed; draw two upward-sloping lines, one for the saving gap and one for the foreign-exchange gap; at any target growth rate the higher line is binding, and foreign capital must cover it.
Terms of trade trend: x-axis time, y-axis the ratio of primary commodity prices to manufactured goods prices; draw a fluctuating line with a gently falling trend to illustrate Prebisch-Singer.
Immiserising growth: draw a production possibility curve shifting outward biased towards the export good; show the terms-of-trade line becoming flatter and the new consumption point on a lower community indifference curve.
7. Examples and Applications
India's ISI phase and its end: licence-permit raj, high tariffs (peak rates above 300% in some items in the late 1980s) and the 1991 crisis led to liberalisation, rupee devaluation and the opening of FDI.
FDI in India today: gross FDI inflows reached a record of about US 94.5 billion dollars in 2025–26, up from about 80.6 billion in 2024–25, but net FDI was only about 7.7 billion because of high repatriation and Indian firms' outward investment (RBI data, May 2026).
Press Note 3 (2020): FDI from countries sharing a land border with India (mainly China) requires government approval.
Electronics and PLI: India became a major exporter of smartphones after the PLI scheme (2020), with MNC contract manufacturers such as Foxconn; domestic value addition remains a debated point.
East Asia: Singapore relied heavily on MNCs; South Korea relied more on domestic chaebol and licensing; both grew fast, showing different routes to technology.
India's export share: India accounts for under 2% of world merchandise exports but about 4–5% of world commercial services exports in recent years (WTO data), reflecting its services-led trade pattern.
Special economic zones: China's SEZs (Shenzhen from 1980) attracted export-oriented FDI; India's SEZ Act (2005) had more modest results, partly because of land acquisition disputes and the later withdrawal of tax holidays.
Global value chains: the World Bank's World Development Report 2020: Trading for Development in the Age of Global Value Chains found that moving from commodity exports to basic manufacturing within GVCs is associated with large gains in income growth.
8. Using It in the Exam
10 marks: define trade as an engine of growth or state Prebisch-Singer with reasons.
15 marks: compare ISI and export promotion with India and South Korea.
20 marks: FDI theories (Hymer, Vernon, Dunning), benefits and costs, MNC regulation, India's FDI data with year.
Keywords: engine of growth, vent for surplus, secular decline in terms of trade, anti-export bias, rent seeking, two-gap model, OLI paradigm, transfer pricing, global value chains.
| Feature | Import substitution | Export promotion |
|---|---|---|
| Trade regime | High tariffs, quotas, licences | Low or neutral protection, duty-free inputs for exporters |
| Exchange rate | Often overvalued | Realistic or undervalued |
| Market for industry | Small domestic market | World market |
| Typical cases | India 1956–1990, Latin America | South Korea, Taiwan from the 1960s, China from 1978 |
| Main risks | Inefficiency, rent seeking, BoP crises | Dependence on world demand, protectionism abroad |
Mains points
- Begin with static and dynamic gains from trade, then balance with Prebisch-Singer and immiserising growth.
- Cite the empirical studies on ISI (Little-Scitovsky-Scott, Bhagwati-Krueger) and Krueger's rent-seeking paper with India as the case.
- Present the East Asian lesson with nuance: outward orientation plus active, disciplined industrial policy (Amsden, Wade).
- Use Dunning's OLI paradigm for any question on why MNCs invest abroad.
- Give India's latest gross and net FDI figures with year and source, and explain the gap between them.
- Common mistake: equating FDI with all foreign capital; distinguish FDI, FPI and external commercial borrowing.
Did you know?
- Memory trick for Dunning: OLI = 'Own it, Locate it, Internalise it'.
Planning, Tinbergen, Market versus Planning and Public-Private Partnership
Jan Tinbergen (Nobel 1969) gave the rule that a policymaker needs at least as many independent instruments as targets, and proposed planning in stages (macro, middle and micro). The socialist calculation debate (Mises, Hayek versus Lange, Lerner) and the experience of market failure and government failure led to a mixed view: markets allocate, the state plans infrastructure and corrects failures. Public-private partnerships combine public purpose with private finance and efficiency.
In simple words
Planning means the government sets goals and decides how to use resources to reach them, instead of leaving everything to markets.
Tinbergen's rule is like driving: to control both speed and direction you need both the accelerator and the steering wheel; one tool cannot hit two targets.
Public-private partnership is like a city hiring a private firm to build and run a road while the city keeps ownership and rules.
UPSC asks about Tinbergen's rule, the market versus planning debate and PPP models in India.
1. Concepts and Definitions
Economic planning: deliberate direction of economic activity by a central authority to achieve defined targets over a period; Dickinson (1939) defined it as the making of major economic decisions by the conscious decision of a determinate authority on the basis of a comprehensive survey of the economy (paraphrase).
Imperative (directive) planning: targets are binding on producers, as in the Soviet Union (Gosplan, first Five-Year Plan 1928).
Indicative planning: the plan sets targets and coordinates expectations, while private firms are guided by incentives, not commands; France's Commissariat général du Plan under Jean Monnet (from 1946) is the classic case.
Market failure: public goods, externalities, natural monopoly, information asymmetry (Akerlof 1970) and coordination failures justify state action.
Government failure: rent seeking (Krueger 1974), regulatory capture (Stigler 1971), information and incentive problems and political business cycles; public choice theory (Buchanan and Tullock, The Calculus of Consent, 1962) analyses them.
2. Tinbergen's Contribution
Source: Jan Tinbergen, On the Theory of Economic Policy (1952) and Economic Policy: Principles and Design (1956); he shared the first Nobel in economics (1969) with Ragnar Frisch.
Targets and instruments: targets are the values of variables the policymaker wants (full employment, price stability, external balance); instruments are variables under the policymaker's control (tax rates, money supply, exchange rate).
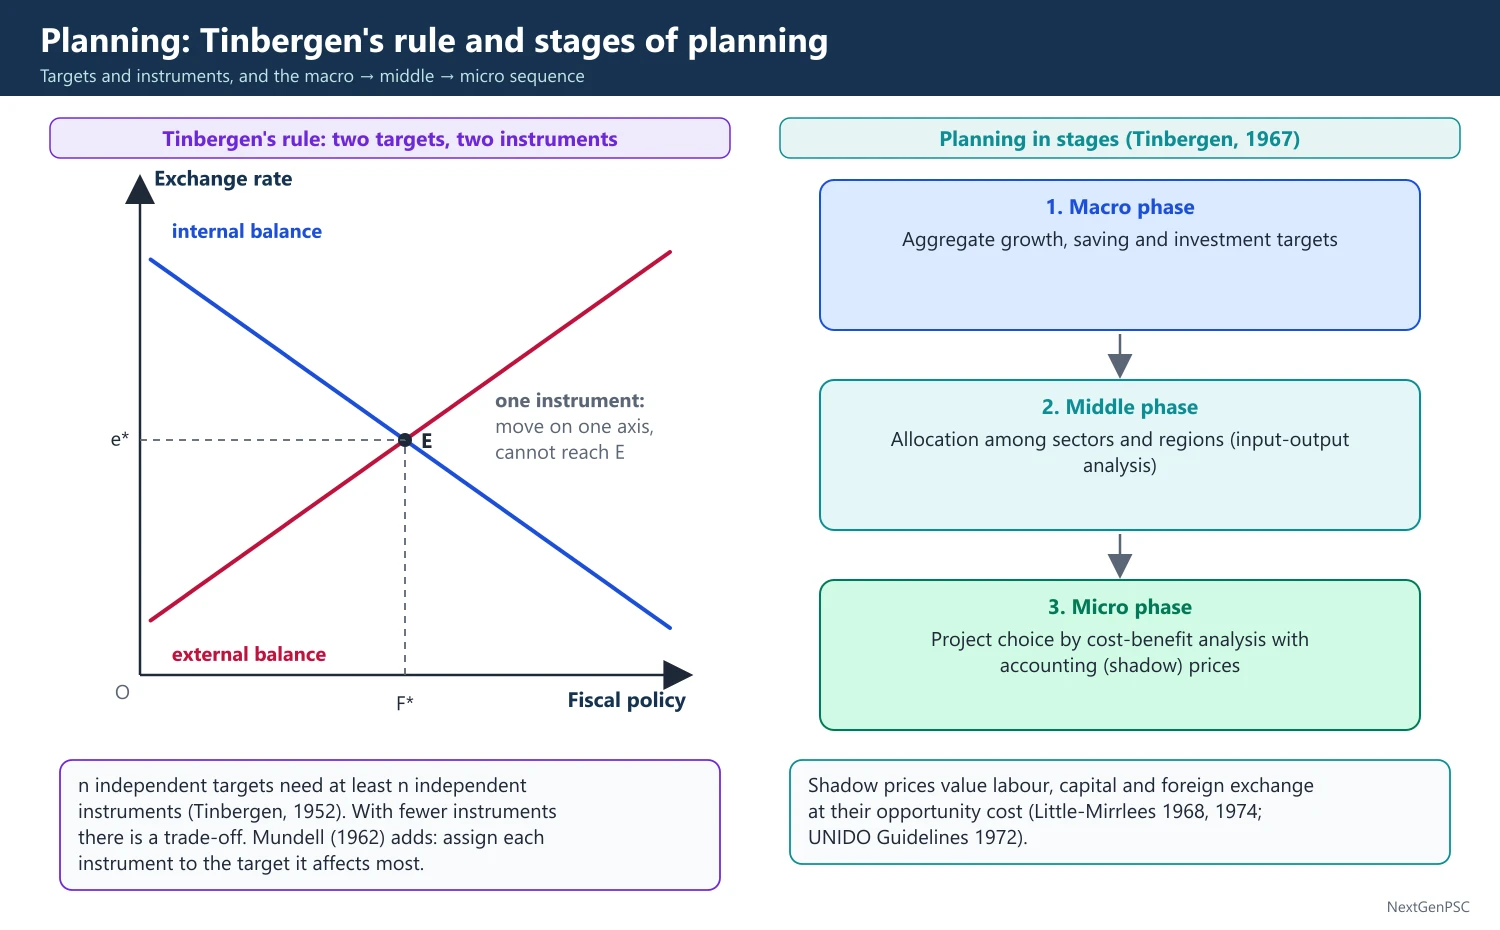
Tinbergen's rule: to achieve n independent targets the policymaker needs at least n independent instruments; with fewer instruments than targets there is a trade-off and a welfare function is needed to choose.
Simple illustration: with two targets (internal and external balance) and only one instrument (fiscal policy) both cannot be met; adding the exchange rate (Swan, 1955; Meade, 1951) gives two instruments for two targets.
Mundell's assignment rule (1962): complements Tinbergen: assign each instrument to the target on which it has the greatest relative effect (monetary policy to external balance, fiscal policy to internal balance under fixed rates), the principle of effective market classification.
Planning in stages (Tinbergen, Development Planning, 1967): the macro phase sets aggregate growth, saving and investment; the middle phase allocates among sectors and regions (using input-output analysis); the micro phase selects projects using cost-benefit analysis with accounting (shadow) prices.
Shadow or accounting prices: Tinbergen argued that in developing countries market prices of labour, capital and foreign exchange misrepresent scarcity, so planners should value them at their opportunity cost; this was developed by Little and Mirrlees (OECD Manual, 1968, 1974) and UNIDO Guidelines (Dasgupta, Marglin and Sen, 1972).
Tinbergen and sustainable, equitable development: he chaired the UN Committee for Development Planning in the 1960s and coordinated Reshaping the International Order (RIO report to the Club of Rome, 1976), which argued for a fairer world economic order and attention to environment and resources.
Tinbergen norm: he is often quoted for the view that the ratio of highest to lowest incomes within an organisation should not exceed about 5:1; its exact form is debated.
3. Market versus Planning
The socialist calculation debate: Ludwig von Mises (1920) argued that without market prices for capital goods rational economic calculation is impossible under socialism.
Lange-Lerner reply: Oskar Lange, 'On the Economic Theory of Socialism' (1936–37), proposed market socialism: a central planning board sets prices by trial and error, adjusting to excess demand, and managers follow rules (price = marginal cost).
Hayek's rejoinder: Friedrich Hayek, 'The Use of Knowledge in Society', American Economic Review (1945): knowledge is dispersed among millions of people; the price system communicates it; no central planner can gather it.
Case for planning in developing countries: missing markets, coordination failures (Big Push), long gestation of infrastructure, externalities and the need to mobilise saving; Mahalanobis, Lewis and Myrdal took this view in the 1950s.
Case for markets: efficiency, incentives, innovation; failures of central planning in the Soviet Union and the licence raj in India; the East Asian experience showed a 'market-friendly' state (World Bank, The East Asian Miracle, 1993).
Synthesis: Stiglitz and others argue that markets and governments are complements; the issue is the right mix and state capacity; Joseph Stiglitz shared the 2001 Nobel for information asymmetry, which shows markets are rarely Pareto efficient.
4. Public-Private Partnership (PPP)
Definition: a long-term contract between a public authority and a private entity to provide a public asset or service, with the private party bearing significant risk and management responsibility and its remuneration linked to performance.
Models: BOT (build-operate-transfer), BOOT (build-own-operate-transfer), DBFOT (design-build-finance-operate-transfer), TOT (toll-operate-transfer), HAM (hybrid annuity model, adopted for national highways in 2016, with 40% of cost paid by government during construction and the rest as annuities), O and M contracts, and management contracts.
Rationale: private finance and efficiency, risk transfer, whole-life costing, faster delivery; but PPP is not free money, since users or taxpayers ultimately pay.
Problems: aggressive bidding, renegotiation, contractual disputes, land acquisition delays, and stressed assets in banks after the 2008–2012 infrastructure boom.
Kelkar Committee on revisiting and revitalising the PPP model (2015): recommended better risk allocation, an independent regulator, an Infrastructure PPP Adjudication Tribunal, amending the Prevention of Corruption Act so honest decisions are not penalised, and avoiding PPP for very small projects.
Support schemes: Viability Gap Funding (2006, up to 20% of project cost from the Centre and up to 20% more from the sponsoring authority; revised later), India Infrastructure Project Development Fund, National Infrastructure Pipeline (2019, about ₹111 lakh crore for 2020–25) and the National Monetisation Pipeline (2021, about ₹6 lakh crore over 2022–25).
5. Diagrams to Draw
Tinbergen's rule: draw two lines in instrument space (fiscal policy on x-axis, exchange rate on y-axis), one for internal balance and one for external balance; their single intersection gives the values of both instruments that achieve both targets; with one instrument you can only move along one axis.
Swan diagram: x-axis domestic absorption, y-axis real exchange rate; internal balance line sloping down, external balance line sloping up; four zones of unemployment or inflation and deficit or surplus.
Planning in stages: a flow chart from macro targets (growth, saving) to sectoral allocation (input-output table) to project choice (cost-benefit with shadow prices).
6. Examples and Applications
India: moved from imperative-style public sector planning (Second Plan) to indicative planning after 1991 (Eighth Plan, 1992–97) and replaced the Planning Commission with NITI Aayog on 1 January 2015.
PPP successes in India: airports at Delhi and Mumbai (2006), major ports and national highways; troubled cases include the Delhi Airport Metro Express Line, operated by a private concessionaire until it exited in 2013, later the subject of an arbitration award.
World: UK's Private Finance Initiative (from 1992) was abolished for new projects in 2018 after concerns over cost and value for money.
Entrepreneurial state: Mariana Mazzucato, The Entrepreneurial State (2013), argued that the state has funded high-risk innovation (the internet, GPS) that markets then commercialised, a modern case for strategic planning.
Dabhol power project (1990s): the Enron-led project in Maharashtra, with a guaranteed return and dollar-denominated tariffs, became a case study in poor risk allocation in private infrastructure deals.
NITI Aayog's role: it works as a policy think tank and promotes cooperative federalism; it does not allocate funds as the Planning Commission did, and its long-term vision is framed around Viksit Bharat by 2047.
7. Using It in the Exam
10 marks: state Tinbergen's rule with a two-target example.
15 marks: planning in stages plus shadow prices, or the market versus planning debate with Hayek and Lange.
20 marks: case for and against planning, Tinbergen's framework, PPP models and India's experience (Kelkar Committee, HAM).
Keywords: targets and instruments, assignment rule, indicative planning, socialist calculation, dispersed knowledge, government failure, viability gap funding, risk allocation.
| Model | Who finances | Who bears traffic or demand risk | Example |
|---|---|---|---|
| BOT (toll) | Private concessionaire | Private | Many national highway projects of the 2000s |
| BOT (annuity) | Private, repaid by fixed annuities | Government | Highway projects where traffic is low |
| HAM (2016) | 40% government during construction, 60% private | Government | Most NHAI awards after 2016 |
| TOT | Private pays upfront for operating rights | Private | NHAI TOT bundles from 2018 |
| DBFOT | Private | Private or shared | Airports at Delhi and Mumbai (2006) |
Mains points
- State Tinbergen's rule precisely (n independent instruments for n targets) and illustrate with internal and external balance.
- Add Mundell's assignment rule to show how instruments are paired with targets.
- Explain planning in stages and the role of shadow prices in project appraisal (Little-Mirrlees, UNIDO).
- Present the market versus planning debate through Mises, Lange and Hayek, then the modern complementary view.
- For PPP, give models, risk allocation, the Kelkar Committee recommendations and India's HAM experience.
- Common mistake: treating indicative planning as 'no planning'; it coordinates expectations and public investment.
Did you know?
- Tinbergen trained as a physicist; his 1936 model of the Dutch economy is often called the first macro-econometric model of a whole economy.
Measuring Development: Human Development Indices and the Basic Needs Approach
GNP per capita measures command over goods, not well-being. The basic needs approach (ILO 1976; Streeten 1981) and the PQLI (Morris 1979) shifted attention to food, health, education and shelter. Mahbub ul Haq and Amartya Sen's Human Development Index (UNDP 1990) combines health, education and income on Sen's capability approach; it is complemented by the IHDI, GDI, GII and the Multidimensional Poverty Index.
In simple words
Income alone does not tell us whether people live long, read and write, or have real choices; the Human Development Index adds health and education to income.
It is like judging a school not only by its fees but by how healthy and well-taught its students are.
These measures guide where governments spend, for example on nutrition or schooling.
UPSC asks how the HDI is built, its criticisms, the basic needs approach and India's MPI data.
1. Concepts and Definitions
Growth versus development: growth is a rise in real output per head; development is a broader improvement in living standards, capabilities, equity and freedom (Dudley Seers, 'The Meaning of Development', 1969, asked what has happened to poverty, unemployment and inequality).
Limits of GNP per capita: ignores distribution, non-market work (much of it done by women), leisure, environmental damage and the composition of output; Kuznets himself warned against reading welfare from national income.
Capability approach (Amartya Sen): development is the expansion of capabilities, the real freedoms people have to achieve valued functionings (being nourished, literate, mobile, taking part in community life); Commodities and Capabilities (1985) and Development as Freedom (1999); Sen received the 1998 Nobel.
Human development (Mahbub ul Haq): 'the basic purpose of development is to enlarge people's choices' (opening line of the first Human Development Report, UNDP, 1990, which Haq led).
2. Basic Needs Approach and PQLI
Origins: the ILO World Employment Conference (1976) adopted a basic needs strategy: minimum private consumption (food, clothing, shelter) and essential public services (safe water, sanitation, health, education, transport).
Paul Streeten and others, First Things First: Meeting Basic Human Needs in Developing Countries (World Bank, 1981): argued that targeting basic needs directly reduces poverty faster than waiting for growth to trickle down.
India's version: the Minimum Needs Programme of the Fifth Plan (1974–79) covered elementary education, rural health, rural water supply, roads, electrification, housing for landless labourers and nutrition.
Physical Quality of Life Index (PQLI): developed by Morris David Morris for the Overseas Development Council (1979); a simple average of literacy rate, infant mortality and life expectancy at age one, each scaled 0–100.
Criticisms of basic needs: hard to define needs objectively, risk of paternalism, neglect of growth and incentives, and that needs are means, not ends (Sen's capability critique).
3. The Human Development Index Step by Step
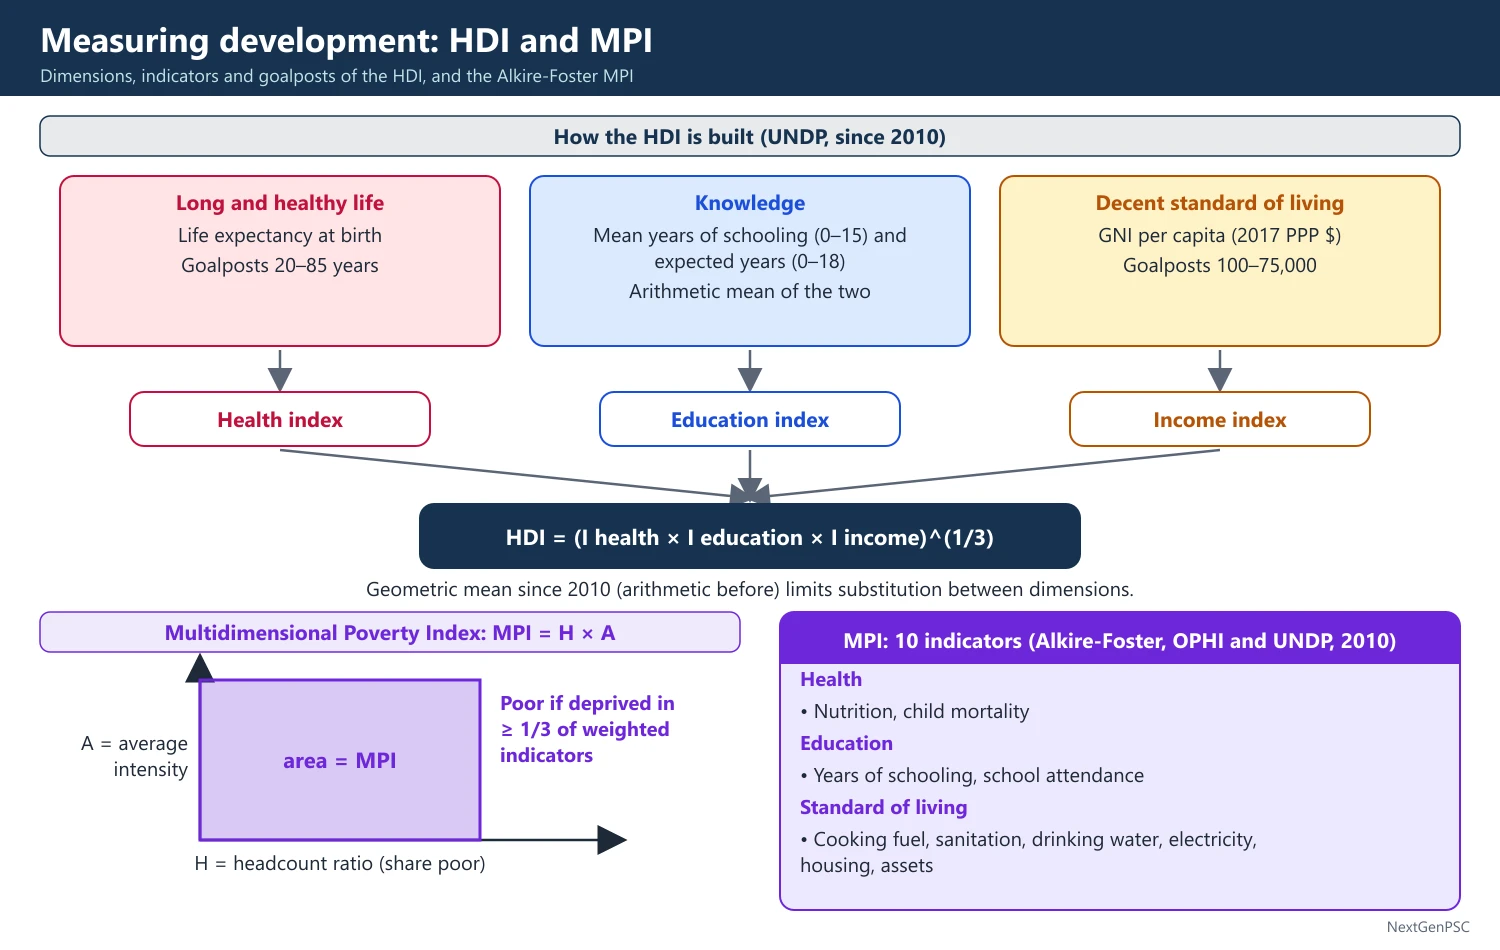
Dimensions and indicators (since 2010): a long and healthy life (life expectancy at birth); knowledge (mean years of schooling for adults aged 25 and above and expected years of schooling for children of school-entry age); a decent standard of living (GNI per capita in 2017 PPP dollars, as used in recent reports).
Goalposts: life expectancy 20 to 85 years; expected years of schooling 0 to 18; mean years of schooling 0 to 15; GNI per capita 100 to 75,000 PPP dollars.
Dimension index: (actual value − minimum) / (maximum − minimum); the income index uses natural logarithms of income because each extra dollar adds less to capability.
Education index: the arithmetic mean of the two schooling indices.
Aggregation: HDI = (I_health × I_education × I_income)^(1/3), a geometric mean (since the 2010 report; before that an arithmetic mean), which limits substitution between dimensions.
Categories: very high (0.800 and above), high (0.700–0.799), medium (0.550–0.699), low (below 0.550).
Family of indices: Inequality-adjusted HDI (IHDI, 2010) discounts each dimension by its inequality using the Atkinson measure; Gender Development Index (GDI, revised 2014) is the ratio of female to male HDI; Gender Inequality Index (GII, 2010) covers reproductive health, empowerment and labour market; Planetary pressures-adjusted HDI (PHDI, 2020) adjusts for carbon emissions and material footprint.
Multidimensional Poverty Index (MPI, 2010): developed by Sabina Alkire and James Foster at OPHI with UNDP; ten indicators in health (nutrition, child mortality), education (years of schooling, school attendance) and standard of living (cooking fuel, sanitation, drinking water, electricity, housing, assets); a person is poor if deprived in at least one-third of weighted indicators; MPI = H × A (headcount × intensity).
4. Criticisms of the HDI
Equal weights are arbitrary; indicators are crude (schooling years ignore quality); income enters twice in a sense because health and education correlate with it; it ignores freedom, security, environment and distribution (partly fixed by IHDI and PHDI).
The geometric mean penalises unbalanced performance but makes the trade-off between life expectancy and income depend on income level, which Ravallion (2010) argued values extra years of life in poor countries very low.
Data revisions and changes in method make comparisons of rank across years unreliable; compare HDI values over time from the same report.
5. Diagrams to Draw
HDI construction chart: three boxes (health, education, income) with their indicators below, arrows to dimension indices, then to the geometric mean, then to the HDI value.
Income versus HDI scatter: x-axis log GNI per capita, y-axis HDI; draw a rising concave band of countries; mark Kerala-like cases above the band (high HDI for income) and oil-rich cases below it.
MPI as H × A: a rectangle whose width is the headcount ratio H and height is the average intensity A; its area is the MPI.
6. Examples and Applications
India in the Human Development Report 2025 (UNDP, May 2025): HDI value 0.685 for 2023, rank 130 of 193, in the medium category; inequality reduces India's HDI by about 30.7%, one of the larger losses in the region.
National MPI (NITI Aayog): the 2023 report (based on NFHS-4 and NFHS-5) estimated that the share of multidimensionally poor fell from 24.85% in 2015–16 to 14.96% in 2019–21, about 13.5 crore people moving out; a January 2024 discussion paper estimated 29.17% in 2013–14 falling to 11.28% in 2022–23, about 24.82 crore people moving out (the 2022–23 figure is a projection).
World Bank (June 2025): with the new 3.00 dollar a day (2021 PPP) line, India's extreme poverty was estimated at about 5.3% in 2022–23, down from about 27% in 2011–12, using HCES 2022–23.
Kerala: high life expectancy and literacy at modest income levels, the classic case for public action (Drèze and Sen, India: Development and Participation, 2002; An Uncertain Glory, 2013).
Bhutan's Gross National Happiness: a policy index with nine domains, an alternative to income-based measures.
Stiglitz-Sen-Fitoussi Commission (2009): recommended moving from measuring production to measuring well-being and sustainability.
7. Other Measures and Indices
SDG India Index (NITI Aayog, since 2018): scores states on the 17 Sustainable Development Goals; the 2023–24 edition put the national score at 71, up from 66 in 2020–21, with Kerala and Uttarakhand at the top.
Inequality measures: the Gini coefficient (0 to 1, from the Lorenz curve) and the Palma ratio (income share of the top 10% divided by that of the bottom 40%, proposed by José Gabriel Palma, 2011) complement development indices.
Social Progress Index (2013): built by the Social Progress Imperative with Michael Porter, it uses only social and environmental outcomes and leaves out income entirely.
World Happiness Report (since 2012): ranks countries by self-reported life evaluations, explained by income, social support, healthy life expectancy, freedom, generosity and perceived corruption.
Green national accounts: environmentally adjusted net domestic product subtracts depletion of natural capital and pollution damage from NDP, linking development measurement to sustainability.
8. Using It in the Exam
10 marks: HDI dimensions, indicators, goalposts and the geometric mean.
15 marks: HDI versus PQLI versus MPI, with criticisms.
20 marks: from GNP to capabilities: basic needs, HDI family, MPI, India's latest data (HDR 2025, NITI MPI 2023 and 2024 paper) and what they imply for policy.
Keywords: capabilities and functionings, enlarging choices, goalposts, geometric mean, IHDI, GII, H × A, Alkire-Foster method, basic needs.
| Measure | Author or agency, year | Components | Aggregation |
|---|---|---|---|
| PQLI | Morris D. Morris, ODC, 1979 | Literacy, infant mortality, life expectancy at age one | Simple average, 0–100 |
| HDI | UNDP (Haq, Sen), 1990; revised 2010 | Life expectancy, schooling (mean and expected), GNI per capita | Geometric mean since 2010 |
| IHDI | UNDP, 2010 | HDI dimensions adjusted for inequality | Atkinson-adjusted geometric mean |
| MPI | OPHI (Alkire-Foster) and UNDP, 2010 | Ten indicators in health, education, living standards | H × A with one-third cut-off |
Mains points
- Start from the limits of GNP per capita and Sen's capability approach; this frames every answer on development measurement.
- Give the HDI method exactly: indicators, goalposts, log income, geometric mean since 2010.
- Use the HDI family (IHDI, GDI, GII, PHDI) to answer criticisms about distribution, gender and environment.
- For poverty questions, explain the MPI as H × A and quote NITI Aayog's 2023 and 2024 estimates with years, noting that 2022–23 is a projection.
- Contrast basic needs (inputs and goods) with capabilities (freedoms) to show conceptual depth.
- Common mistake: quoting an HDI rank without the report year; ranks are not comparable across reports.
Did you know?
- Mahbub ul Haq once said that Sen first called the HDI a 'vulgar' measure, too crude to capture capabilities, before agreeing it was needed to compete with GNP (an often-told story).
Development and Environmental Sustainability
Sustainable development is development that meets the needs of the present without compromising the ability of future generations to meet their own needs (Brundtland Report, 1987). Economics frames it through the optimal use of non-renewable resources (Hotelling rule), harvesting of renewable resources within regenerative capacity, correcting externalities (Pigou, Coase), and intergenerational equity (Hartwick rule, discounting debate).
In simple words
Sustainable development means using nature so that our grandchildren can enjoy as much as we do; think of living on the interest of a bank deposit instead of spending the deposit itself.
Coal and oil run out, so they are non-renewable; fish and forests regrow, but only if we do not take too much.
Pollution is a cost polluters push on others, so taxes or permits are needed.
UPSC asks about resource-use rules, intergenerational equity and India's climate policy.
1. Concepts and Definitions
Sustainable development: defined in Our Common Future, report of the World Commission on Environment and Development chaired by Gro Harlem Brundtland (1987); adopted at the Rio Earth Summit (1992, Agenda 21) and in the UN Sustainable Development Goals (17 goals, 2015–2030).
Renewable resources: stocks that regenerate (fisheries, forests, groundwater, soil fertility); sustainable if harvest does not exceed regeneration.
Non-renewable (exhaustible) resources: fixed stocks that are depleted by use (coal, oil, gas, minerals); the question is the optimal rate of extraction over time.
Environmental degradation: depletion of natural capital and pollution of air, water and land; the economic cause is that environmental services are unpriced public goods or open-access commons.
Natural capital: the stock of natural assets yielding flows of services; sustainability can be defined as non-declining total capital or non-declining natural capital.
Intergenerational equity: fairness between present and future generations in the use of resources and the burden of environmental damage.
2. Non-renewable Resources: Hotelling and Hartwick
Hotelling rule (Harold Hotelling, 'The Economics of Exhaustible Resources', Journal of Political Economy, 1931): in a competitive market, the net price of an exhaustible resource (price minus marginal extraction cost, the scarcity rent or royalty) rises at the rate of interest: (dP/dt)/P = r.
Logic: a resource owner is indifferent between extracting now and investing the proceeds at r, or leaving it in the ground; equilibrium requires the resource to appreciate at r; a monopolist extracts more slowly (Hotelling noted the monopolist as 'conservationist's friend').
Limits: actual resource prices have not followed the rule closely because of new discoveries, technology, cartels (OPEC) and uncertainty.
Hartwick rule (John Hartwick, American Economic Review, 1977): if the rents from exhaustible resources are invested in reproducible capital, consumption can be held constant over time; Norway's Government Pension Fund Global is the standard illustration.
Solow (1974, 1986): with sufficient substitutability between natural and produced capital, sustainability means maintaining the total value of capital.
3. Renewable Resources
Logistic growth: the growth of a fish stock G(S) is low at low and at near-carrying-capacity stocks, highest in between; maximum sustainable yield (MSY) is the harvest equal to that peak growth.
Open access (Scott Gordon, 1954): fishermen enter until total revenue equals total cost, so rents are dissipated and the stock is pushed below the economically efficient level, sometimes to collapse (Canadian cod, 1992).
Tragedy of the commons (Garrett Hardin, Science, 1968): each user gains the full benefit of extra use but bears only a fraction of the cost.
Elinor Ostrom (Governing the Commons, 1990; Nobel 2009): showed that communities often manage commons well through local rules, monitoring and graduated sanctions; examples include Indian van panchayats and joint forest management.
4. Externalities and Policy Instruments
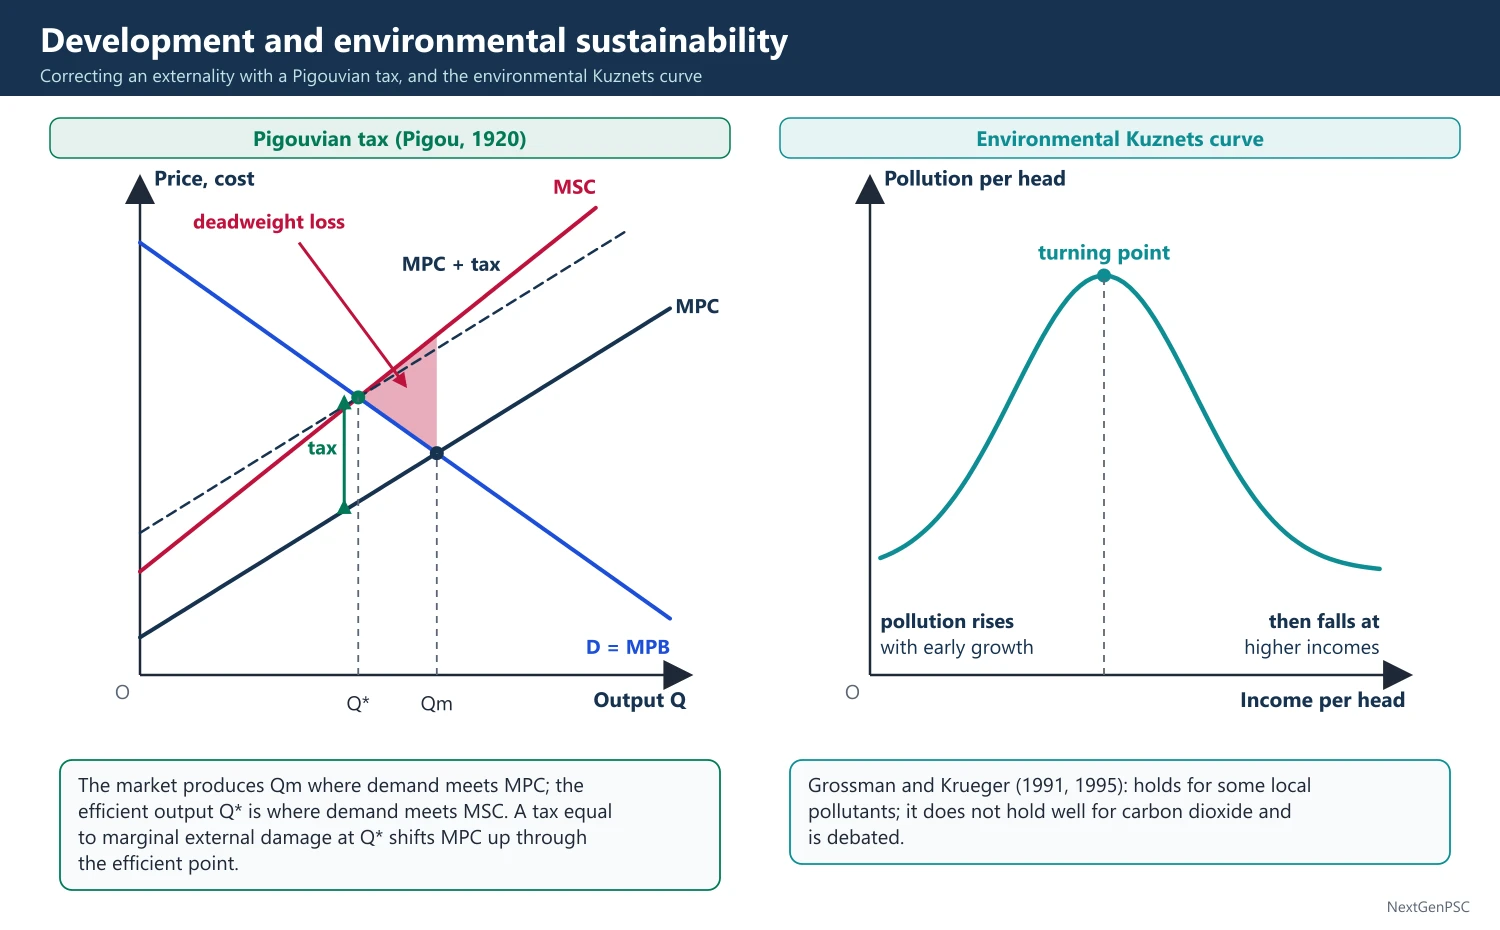
Pigouvian tax (Pigou, The Economics of Welfare, 1920): a tax equal to marginal external damage at the efficient output makes the polluter internalise the cost.
Coase theorem (Ronald Coase, 'The Problem of Social Cost', 1960): if property rights are well defined and transaction costs are low, bargaining leads to the efficient outcome regardless of who holds the rights; with many parties transaction costs are high, so it rarely applies to air pollution.
Tradable permits (Dales, 1968): cap the total quantity and let firms trade permits; the market sets the price; examples are the US sulphur dioxide programme (1990) and the EU Emissions Trading System (2005).
Command and control: standards and bans; simpler to monitor but less cost-effective.
Environmental Kuznets curve (Grossman and Krueger, 1991, 1995): some local pollutants first rise and then fall with income, an inverted U; it does not hold well for carbon dioxide and is debated.
5. Intergenerational Equity and Discounting
Social discount rate (Ramsey formula): r = δ + ηg, where δ is pure time preference, η the elasticity of marginal utility and g the growth rate of consumption.
Stern Review (2006): used δ = 0.1% and η = 1, giving a low discount rate of about 1.4% and justifying strong, early climate action; William Nordhaus (DICE model; Nobel 2018) used market-based rates around 4–5% and favoured a gradual 'climate policy ramp'; the choice of δ is an ethical debate.
Weak versus strong sustainability: weak (Solow, Hartwick) allows natural capital to be replaced by produced capital; strong (Herman Daly, Pearce in parts) holds that critical natural capital (ozone layer, biodiversity, climate) cannot be substituted; Daly's rules: harvest renewables at or below regeneration, emit wastes within assimilative capacity, deplete non-renewables only as fast as renewable substitutes are developed.
Limits to growth: Meadows and others, The Limits to Growth (Club of Rome, 1972), predicted overshoot and collapse; critics (Nordhaus, Solow) pointed to price signals and substitution; the debate continues in degrowth versus green growth.
Green accounting: the UN System of Environmental-Economic Accounting (SEEA, 2012 central framework) and the World Bank's adjusted net saving (genuine saving), which subtracts resource depletion and pollution damage and adds education spending; negative genuine saving signals unsustainability; India's MoSPI publishes EnviStats India with environmental accounts.
6. Diagrams to Draw
Hotelling path: x-axis time, y-axis price; draw marginal extraction cost as a horizontal line and price rising exponentially above it, the gap (rent) growing at r, until price reaches the choke price where demand is zero and the stock is exhausted.
Renewable resource: x-axis stock S, y-axis growth and harvest; draw an inverted-U growth curve G(S) from 0 to carrying capacity K; mark MSY at the peak; draw a harvest line and show two equilibria, the lower one unstable.
Pigouvian tax: x-axis output, y-axis price and cost; demand (marginal private benefit), marginal private cost (MPC) and marginal social cost (MSC) above MPC; the market output Qm where demand meets MPC exceeds the efficient Q* where demand meets MSC; a tax equal to the vertical gap at Q* shifts MPC up to pass through the efficient point; shade the deadweight loss triangle.
Environmental Kuznets curve: x-axis income per head, y-axis pollution per head; inverted U with a turning point.
7. Examples and Applications
India's climate commitments: updated NDC (August 2022): reduce emissions intensity of GDP by 45% by 2030 from the 2005 level, reach about 50% of installed electricity capacity from non-fossil sources by 2030, and net zero by 2070 (announced at COP26, 2021); the 50% non-fossil capacity goal was reached in mid-2025, and non-fossil capacity stood at about 283 GW in March 2026 (Ministry of New and Renewable Energy).
Market-based tools in India: Perform, Achieve and Trade scheme for energy efficiency (2012), the Carbon Credit Trading Scheme notified under the Energy Conservation (Amendment) Act, 2022 (scheme notified in 2023), and the coal cess (from 2010, later merged into the GST compensation cess in 2017).
Constitutional and legal basis: Articles 48A and 51A(g) (42nd Amendment, 1976), the Supreme Court's reading of the right to a clean environment into Article 21, the polluter pays and precautionary principles (Vellore Citizens' Welfare Forum, 1996), and the National Green Tribunal (2010).
Commons in India: groundwater depletion in Punjab and Haryana driven by free power and MSP-backed rice, a case of open access and perverse incentives; joint forest management (from 1990) as an Ostrom-type solution.
Mission LiFE (2022): India's campaign for sustainable lifestyles, launched by the Prime Minister with the UN Secretary-General.
8. Using It in the Exam
10 marks: define sustainable development and state the Hotelling or Hartwick rule.
15 marks: renewable versus non-renewable resource economics with one diagram each.
20 marks: sustainability concepts (weak and strong), instruments (Pigou, Coase, permits), intergenerational equity (Stern versus Nordhaus) and India's climate policy with dated figures.
Keywords: Brundtland definition, scarcity rent, Hotelling rule, Hartwick rule, MSY, open access, Pigouvian tax, Coase theorem, social discount rate, natural capital, genuine saving.
| Feature | Weak sustainability | Strong sustainability |
|---|---|---|
| Key thinkers | Solow, Hartwick | Herman Daly, ecological economists |
| Substitutability | Natural and produced capital are substitutes | Critical natural capital has no substitute |
| Rule | Keep total capital non-declining (Hartwick rule) | Keep natural capital non-declining (Daly's rules) |
| Indicator | Adjusted net (genuine) saving | Physical indicators, planetary boundaries |
| Policy stance | Green growth, invest resource rents | Limits on throughput, steady-state economy |
Mains points
- Quote the Brundtland definition exactly and attribute it to the 1987 report.
- State the Hotelling rule as the net price rising at the rate of interest, and the Hartwick rule as reinvesting resource rents; both are common short questions.
- Use the Pigouvian tax diagram for any question on environmental degradation; add Coase and tradable permits as alternatives.
- Explain intergenerational equity through the Ramsey discount formula and the Stern-Nordhaus debate.
- Bring in India's NDC targets, the non-fossil capacity milestone with date, and the Carbon Credit Trading Scheme.
- Common mistake: confusing maximum sustainable yield with the economically efficient harvest, which is lower effort and a larger stock when costs are positive.
Did you know?
- Memory trick: Hotelling = 'Hold it in the ground only if it grows like money in the bank', so the rent must rise at the interest rate.
UPSC Previous Year Questions: Economic Development
From 2014 to 2026 UPSC asked 62 question parts (855 marks) from Economic Development, the most of any Paper I chapter. Development and environmental sustainability alone accounts for 25 parts (carbon trading, the environmental Kuznets curve, green accounting, climate agreements), followed by Kuznets and structural change (11), planning and PPP (10) and the HDI family (9). Every question below has a model answer written to the UPSC word limit.
In simple words
Read the question and spend five minutes writing your own outline: the concept and who gave it, the mechanism or index, evidence, and a balanced conclusion.
Then read the model answer and tick what you missed: the economist and year, the formula (HDI, GDI, EDP), the diagram (inverted U, cap and trade) or the international agreement with its year.
Rewrite one answer a day within the word limit (10 marks about 150 words, 15 marks about 200, 20 marks about 250) and add a recent Indian or global example.
1. Myrdal, Kuznets and Structural Change; Role of Agriculture
Example 1 (UPSC 2026, 15 marks): Compare Gunnar Myrdal's "backwash effects" with Simon Kuznets' "structural transformation" in the context of developing economies.
Paper and question: Paper I, Q7(b)
Approach: Explain Myrdal's backwash (and spread) effects and Kuznets's structural transformation, then compare them on nature, mechanism, outcome for developing countries and policy, ending with how they can be reconciled.
Myrdal's backwash effects: in Economic Theory and Underdeveloped Regions (1957), Gunnar Myrdal argued through circular cumulative causation that market forces widen, not narrow, regional and international inequality. A growing region attracts capital, skilled labour and trade from lagging regions (backwash effects), while spread effects are usually weaker in poor countries.
Kuznets's structural transformation: Simon Kuznets (Modern Economic Growth, 1966) showed that as income per head rises, the shares of agriculture in output and employment fall, those of industry and then services rise, labour moves to higher-productivity sectors and the economy urbanises.
Comparison: (i) Kuznets describes an empirical regularity of sectoral change and is broadly optimistic, since transformation raises productivity and incomes; Myrdal offers a theory of spatial and international divergence and is pessimistic about markets. (ii) For Kuznets labour and capital moving to modern sectors is the engine of growth; for Myrdal the same movement drains lagging regions. (iii) Kuznets expected inequality to rise and then fall (the inverted U); Myrdal saw no automatic reversal. (iv) Policy: Kuznets implies facilitating structural change; Myrdal calls for state intervention, regional policy and land reform to strengthen spread effects.
In India both appear: structural change has been services-led, yet backwash effects show in the gap between states such as Maharashtra and Bihar.
Hence structural transformation is necessary for development, but without policy to counter backwash effects it can deepen dualism.
Example 2 (UPSC 2026, 15 marks): What strategies are required for Agriculture Sector transformation to ensure rapid economic development of a developing country? Discuss.
Paper and question: Paper I, Q8(b)
Approach: Begin with agriculture's contributions to development (Kuznets; Johnston and Mellor), then set out the strategies for transformation (technology, water, markets, diversification, credit and risk, institutions, sustainability), with Indian examples.
Agriculture contributes to development through product, factor, market and foreign-exchange contributions (Kuznets) and, as Johnston and Mellor (1961) stressed, by supplying food, labour, savings and a market for industry. Its transformation from low-productivity subsistence farming to a productive, commercial sector is therefore a precondition for rapid development.
Strategies: (i) technology and productivity: high-yielding and climate-resilient seeds, public research and extension, as in the Green Revolution; (ii) water and inputs: irrigation, micro-irrigation and balanced fertiliser use; (iii) markets: better market access, warehousing, e-NAM (2016) and farmer producer organisations to raise bargaining power; (iv) diversification into horticulture, dairy, livestock and fisheries, which have higher income elasticity of demand, as India's dairy cooperatives showed; (v) credit and risk management: institutional credit, crop insurance (PMFBY, 2016) and income support (PM-KISAN, 2019); (vi) institutions: land records, secure tenancy and consolidation; (vii) linkages: agro-processing and rural non-farm jobs to absorb surplus labour.
Public investment in rural infrastructure must replace input subsidies that distort crop choice, and price policy should not lock farmers into water-intensive rice and wheat.
Sustainability is essential: soil health, groundwater management and climate adaptation. A transformed agriculture raises rural incomes, widens the home market and releases labour, making overall growth faster and more inclusive.
Example 3 (UPSC 2024, 15 marks): Discuss the inverted 'U' shaped hypothesis by Kuznets in describing the relationship between inequality and economic growth. How is this hypothesis useful for developing countries?
Paper and question: Paper I, Q8(b)
Approach: State Kuznets's hypothesis and its mechanism with the inverted-U diagram, review the evidence, then explain its usefulness and limits for developing countries.
Simon Kuznets, in 'Economic Growth and Income Inequality' (1955), suggested that income inequality first rises and then falls as income per head grows: an inverted U.
Mechanism: development shifts workers from a low-income, fairly equal agricultural sector to a high-income, more unequal urban-industrial sector. In the early stages a small modern sector widens the gap between sectors and inequality rises; as most workers move into the modern sector, as education spreads and as workers gain political power and social protection, inequality falls.
Diagram: income per head on the horizontal axis and the Gini coefficient on the vertical; an inverted-U curve rising to a peak at middle income and declining thereafter.
Evidence: cross-country data in the 1970s (Ahluwalia, 1976) seemed to support it, but time-series studies (Deininger and Squire, 1998) found little support within countries; East Asian economies grew fast with low inequality, and inequality has risen in most advanced countries since 1980 (Piketty, 2014).
Usefulness for developing countries: it warns that rising inequality in early growth is likely and should be anticipated; it highlights structural change, education and labour absorption as the forces that eventually reduce inequality; and it suggests policies such as land reform, mass education and social protection can shorten the rising phase. But it is not an iron law, so developing countries should not treat high inequality as a necessary price of growth.
Example 4 (UPSC 2023, 15 marks): "Income inequality is not a cause of concern as long as per capita income is rising." Critically examine this statement.
Paper and question: Paper I, Q8(c)
Approach: Critically examine: present the 'trickle-down' view, then the arguments that inequality matters (welfare, poverty elasticity, growth, capabilities, political economy), with Indian evidence, and conclude.
The statement reflects the trickle-down view: if per capita income rises, the benefits eventually reach all, and inequality is a temporary by-product, as Kuznets's inverted U suggested. Rising average income can indeed reduce absolute poverty.
But the statement is too strong. (i) Welfare: with diminishing marginal utility of income, a given total gives less social welfare when distributed unequally; Atkinson's index and Sen's welfare measure, W = μ(1 − G), show that rising mean income can coexist with stagnant welfare if the Gini rises. (ii) Poverty: the higher the inequality, the less growth reduces poverty (the growth elasticity of poverty falls), as Ravallion showed.
(iii) Growth itself: high inequality can lower growth by limiting human capital investment by the poor under credit constraints (Galor and Zeira, 1993), shrinking the home market and generating demands for distortionary redistribution (Alesina and Rodrik, 1994); IMF studies (Ostry, Berg and co-authors, 2014) link lower inequality to longer growth spells. (iv) Capabilities: Sen's approach judges development by what people can do and be, not by average income.
In India, consumption inequality measured by HCES 2022–23 is moderate, but income and wealth inequality is high (World Inequality Lab estimates); the persistence of malnutrition despite fast growth shows that averages hide deprivation.
Hence rising per capita income is necessary but not sufficient; inequality matters both for its own sake and for sustained, inclusive growth.
Example 5 (UPSC 2021, 15 marks): Evaluate Kuznets' inverted U shaped curve hypothesis of income distribution. Does it hold good for less developed countries as well?
Paper and question: Paper I, Q6(a)
Approach: Evaluate the hypothesis (statement, mechanism, diagram, supporting and contrary evidence), then judge its validity for less developed countries with examples.
Kuznets's hypothesis (1955) states that inequality rises in the early stages of economic growth, peaks at middle income and falls thereafter. The mechanism is the shift of population from a poor, equal rural sector to a richer, unequal urban sector, together with later forces such as education, urbanisation, demographic change and redistributive politics.
Diagram: Gini coefficient against income per head, an inverted U with the peak at middle income.
Evaluation: Kuznets based it on limited data for the US, UK and Germany and himself called it 'perhaps 5 per cent empirical information and 95 per cent speculation'. Cross-section studies (Ahluwalia, 1976) found an inverted U, but this partly reflected Latin American middle-income countries with high inequality; panel and time-series studies (Deininger and Squire, 1998; Fields) found no systematic pattern. Since 1980 inequality has risen in rich countries, giving a U turn at the top (Piketty).
Less developed countries: the evidence is mixed. Taiwan and South Korea grew rapidly with low and stable inequality because of land reform and mass education, contradicting the rising phase; Brazil reduced inequality in the 2000s through cash transfers; China and India saw inequality rise during fast growth, consistent with the hypothesis. The outcome depends on initial asset distribution, the pattern of growth and policy rather than on income alone.
So the hypothesis is a useful description of one historical path, not a law; for LDCs it implies that inequality can be managed by policy.
Example 6 (UPSC 2020, 10 marks): Explain Myrdal's cumulative causation theory as the theory for development.
Paper and question: Paper I, Q1(e)
Approach: Explain Myrdal's circular cumulative causation with backwash and spread effects, its international application and policy conclusion.
Gunnar Myrdal (Economic Theory and Underdeveloped Regions, 1957) rejected the idea of stable equilibrium. In his theory of circular cumulative causation, a change in one factor causes changes in others that reinforce the original change, so processes are cumulative.
If a region gains an initial advantage, it attracts capital, skilled labour and enterprise from other regions; its markets, infrastructure and incomes grow, attracting still more. These backwash effects drain lagging regions. Spread effects, such as rising demand for the products of the hinterland and diffusion of technology, work the other way, but in poor countries they are weak, so inequality widens.
The same applies internationally: free trade and capital flows tend to benefit rich countries and leave poor ones specialised in primary goods.
Myrdal therefore saw development as requiring active state intervention, planning, land reform and regional policy to strengthen spread effects. The theory influenced India's backward-area programmes and remains relevant to regional disparities.
Example 7 (UPSC 2019, 20 marks): In the contemporary world, many countries are not following Kuznets' pattern of structural change. Give reasons.
Paper and question: Paper I, Q6(c)
Approach: State Kuznets's pattern of structural change, then give the reasons many developing countries depart from it (premature deindustrialisation, services-led growth, technology, global value chains, China, informality), with India as an example.
Kuznets's pattern (Modern Economic Growth, 1966), building on Fisher and Clark, is that as income rises the shares of agriculture in output and employment fall, the share of industry, especially manufacturing, rises to a peak, and services expand later. Today's advanced economies and East Asia followed this sequence.
Many developing countries are not following it: (i) premature deindustrialisation: Dani Rodrik (2016) showed that manufacturing's share of employment now peaks at much lower levels of income and at lower shares than in early industrialisers, so economies move from agriculture to services directly; (ii) labour-saving technology: automation and capital-intensive techniques reduce the jobs created per unit of manufacturing output; (iii) global competition: China's scale in labour-intensive manufacturing since the 1990s has made it hard for others to enter, and falling relative prices of manufactures reduce their share in nominal output; (iv) global value chains: countries specialise in tasks rather than whole industries; (v) services revolution: information technology and tradable services allow services-led growth, as in India's IT and business services; (vi) domestic constraints: poor infrastructure, rigid labour and land laws, small firms and weak skills hold back manufacturing; (vii) informality: workers leaving agriculture move into low-productivity informal services and construction.
India illustrates this: agriculture's share in GVA fell to about 18% but it still employed about 46% of workers in PLFS 2023–24, while manufacturing's share in GVA has stayed around 15–17% for decades and services provide over half of GVA.
Diagram: sector shares against income per head: agriculture falling, services rising steadily, and manufacturing an inverted U whose peak is lower and occurs at lower income for late developers.
The departure matters because manufacturing has unconditional productivity convergence and absorbs low-skilled labour; hence policies such as Make in India (2014) and the production-linked incentive schemes (2020) aim to revive it, while services-led growth must be made more employment-intensive.
Example 8 (UPSC 2019, 15 marks): What are the causes of market failure in agriculture? How may government intervention mitigate this?
Paper and question: Paper I, Q8(c)
Approach: List the sources of market failure in agriculture (price instability, risk and missing markets, information, externalities, public goods, market power), then match each with government interventions, noting the risk of government failure.
Market failure occurs when free markets do not allocate resources efficiently. Agriculture is especially prone to it because of its biological, seasonal and dispersed nature.
Causes: (i) price instability: inelastic demand and supply that responds to past prices create cobweb cycles and sharp price swings; (ii) risk and missing markets: weather and pest shocks, with poorly developed insurance and futures markets; (iii) imperfect credit markets: lack of collateral and information leads to rationing and dependence on moneylenders; (iv) information asymmetry about input quality (spurious seeds) and prices; (v) externalities: groundwater depletion, chemical run-off and stubble burning; (vi) public goods: research, extension and irrigation are under-supplied privately; (vii) market power: traders and commission agents in thin local markets can exploit dispersed small farmers.
Interventions: price support and procurement (MSP) and buffer stocks to stabilise prices; crop insurance (PMFBY, 2016) and weather insurance; priority-sector lending, Kisan Credit Cards and NABARD refinance; seed certification, soil health cards and market information through e-NAM (2016); regulation and pricing of water and power, and subsidies for crop-residue machinery; public research (ICAR) and extension; and farmer producer organisations to countervail market power.
But intervention can fail too: MSP and power subsidies have encouraged rice and wheat over-production and groundwater depletion. Interventions should therefore correct specific failures at least cost.
Example 9 (UPSC 2018, 15 marks): Kuznets hypothesis predicts decline in income inequalities in the long run. In recent decades do trends in income inequalities in developed and developing economies support this hypothesis? Give reasons for your answer.
Paper and question: Paper I, Q7(b)
Approach: Restate the hypothesis, then review recent trends in developed economies (rising inequality since 1980) and developing economies (mixed), give the reasons, and conclude whether the evidence supports it.
Kuznets (1955) predicted that inequality, after rising in early industrialisation, would decline in the long run as economies mature: the downward arm of the inverted U.
Developed economies: the trend contradicts the prediction. After falling between about 1914 and 1970, inequality has risen since 1980 in the US, the UK and many other rich countries; the top 1% share of US income roughly doubled (Piketty and Saez). Reasons: skill-biased technical change, globalisation and offshoring that hurt less-skilled workers, weaker trade unions, cuts in top tax rates, financialisation and a rising return on capital relative to growth (Piketty's r greater than g, 2014).
Developing economies: the picture is mixed. Inequality rose in China and India during fast growth after liberalisation, which fits the rising arm; but several Latin American countries (Brazil, Mexico) reduced inequality in the 2000s through cash transfers, minimum wages and education, and East Asian economies grew with low inequality earlier. These outcomes reflect policy, not income level.
Diagram: Gini against time for the US showing a U shape over the twentieth century, unlike Kuznets's inverted U.
So recent trends do not support the hypothesis as a general law: inequality is shaped by technology, institutions and policy, and the late twentieth century has seen a reversal in rich countries. The inverted U describes one historical episode rather than an inevitable path.
Example 10 (UPSC 2016, 10 marks): Explain Kuznets' inverted 'U' hypothesis. Is growth good for the poor? Explain.
Paper and question: Paper I, Q5(d)
Approach: Explain the inverted U briefly, then answer whether growth is good for the poor using evidence (Dollar and Kraay) and the role of inequality and pattern of growth.
Kuznets's inverted U (1955) holds that inequality rises in the early stages of growth, as labour moves from a poor, equal rural sector to a richer, unequal urban sector, and falls later as most workers join the modern sector and education and redistribution spread.
Is growth good for the poor? Broadly yes. Dollar and Kraay ('Growth Is Good for the Poor', 2002) found that on average the incomes of the poorest 20% rise one-for-one with mean income. China and India cut extreme poverty sharply during fast growth.
But the effect depends on initial inequality and the pattern of growth: growth in labour-intensive sectors and agriculture reduces poverty more than capital-intensive or enclave growth, and high inequality lowers the poverty-reducing power of growth.
Hence growth is necessary for poverty reduction, and becomes 'pro-poor' when combined with human capital, jobs and social protection.
Example 11 (UPSC 2016, 10 marks): Under what conditions economic growth reduces employment growth? Discuss.
Paper and question: Paper I, Q5(e)
Approach: Use the identity (employment growth = output growth − labour productivity growth) and list the conditions under which growth reduces employment growth, with Indian illustration.
Employment growth equals output growth minus the growth of labour productivity, and the ratio of the two growth rates is the employment elasticity of output. Growth reduces employment growth, giving 'jobless growth', when productivity rises faster than output.
Conditions: (i) capital-intensive or labour-saving technology, including automation; (ii) a shift in output composition towards capital- or skill-intensive sectors such as finance, IT and petrochemicals, and away from agriculture and labour-intensive manufacturing; (iii) relative factor prices biased against labour: subsidised credit and capital goods, or wage and labour-law rigidities that make hiring costly; (iv) restructuring after liberalisation, when firms shed surplus labour to compete; (v) growth led by a few large firms or enclaves with weak linkages.
India's employment elasticity fell in the 2000s, when GDP grew fast but organised manufacturing employment grew slowly.
Remedies include promoting labour-intensive sectors such as textiles, food processing and tourism, supporting MSMEs, and building skills.
2. Trade, Foreign Investment and Multinationals in Development
Example 12 (UPSC 2026, 15 marks): Explain the factors contributing to the rise of MNCs. Discuss whether their efficiency is driven by superior technology or anti-competitive practices.
Paper and question: Paper I, Q7(c)
Approach: Explain the factors behind the rise of MNCs (ownership advantages, internalisation, location, globalisation and technology), then weigh the efficiency explanation (technology, scale, management) against the market-power explanation (Hymer, anti-competitive practices) and conclude.
A multinational corporation owns and controls production in more than one country. MNCs grew rapidly after the 1980s.
Factors behind their rise: (i) firm-specific ownership advantages such as technology, brands and management (Hymer, 1960; Dunning's OLI framework); (ii) internalisation: when markets for knowledge are imperfect, it is cheaper to exploit an advantage within the firm than to license it (Buckley and Casson, 1976); (iii) location advantages: cheap labour, resources, large markets and tariff-jumping; (iv) trade and investment liberalisation; (v) falling transport and communication costs and the IT revolution, which allow production to be split across countries.
Efficiency view: MNCs are more productive because of superior technology, R&D, scale and scope economies, management and global networks; studies of FDI generally find foreign affiliates more productive than domestic firms, and competition from them raises local productivity.
Market-power view: Stephen Hymer argued that MNCs exist to exploit and protect monopolistic advantages. Their profits may also come from anti-competitive practices: transfer pricing and profit shifting to tax havens, restrictive licensing, predatory pricing, acquisition of rivals, and control of platforms and data.
In reality both coexist: technology gives MNCs their initial advantage, while market power helps them keep it. Strong competition law, tax cooperation (such as the OECD global minimum tax agreed in 2021) help ensure that host countries gain from efficiency rather than suffer from market power.
Example 13 (UPSC 2025, 15 marks): "Increasing role of multinationals has reduced the significance of foreign aid during post-World Trade Organization (WTO) regime." Do you agree with this statement? Explain.
Paper and question: Paper I, Q7(b)
Approach: Take a qualified position: show with data how FDI and MNC flows have overtaken aid, explain why, then argue that aid retains a distinct role (LDCs, social sectors, global public goods, crises) and conclude.
I agree only partly. Since the WTO came into being in 1995, private capital flows led by multinationals have far exceeded official aid. Global FDI flows were about 1.5 trillion US dollars in 2024 (UNCTAD, World Investment Report 2025), while official development assistance from OECD donors was about 212 billion dollars (OECD preliminary data for 2024).
Why MNCs have gained importance: liberalisation of trade and investment under the WTO (TRIMs, GATS) and unilateral reforms; the rise of global value chains; and the advantages of FDI over aid: it brings technology, management and market access, is non-debt-creating, carries no political conditionality and is tied to performance.
Why aid remains significant: (i) FDI is concentrated in a few large emerging economies and in profitable sectors, while least developed countries, especially in sub-Saharan Africa, receive little and still depend on aid; (ii) aid finances public goods MNCs will not provide: primary health, education, sanitation and humanitarian relief; (iii) global public goods such as climate finance and pandemic response rely on official flows; (iv) concessional lending by the World Bank's IDA and multilateral banks supports countries in crisis when private capital flees; (v) aid can build the institutions and infrastructure that attract FDI.
Hence multinationals have reduced aid's relative importance as a source of capital, but not its significance for the poorest countries and for public goods; the two are complements.
Example 14 (UPSC 2020, 15 marks): Explain the recent changes in the trade and investment flows among different countries in the world. Discuss the major factors that led to these changes.
Paper and question: Paper I, Q8(a)
Approach: Describe the main changes in world trade and investment flows (rise of Asia and China, GVCs, services and digital trade, slowbalisation after 2008, trade wars and COVID shock), then explain the factors behind them.
Changes in trade flows: (i) the share of developing countries, especially East Asia, in world trade has risen sharply; China became the largest merchandise exporter by 2009; (ii) trade in intermediate goods within global value chains now accounts for most of world trade; (iii) services and digitally delivered trade have grown faster than goods; (iv) South-South trade has expanded; (v) after the 2008 crisis the ratio of trade to world GDP stopped rising, a phase called 'slowbalisation'; (vi) the US-China tariff war from 2018 and the COVID-19 shock of 2020 disrupted supply chains.
Changes in investment flows: FDI shifted towards developing Asia, with China, India and ASEAN as major hosts; developing countries such as China became significant outward investors; and global FDI fell sharply in 2020.
Factors: (i) liberalisation: the Uruguay Round and WTO (1995), China's WTO accession (2001) and reforms in India from 1991; (ii) falling transport and communication costs, containerisation and the IT revolution; (iii) labour-cost differences and large emerging markets; (iv) regional trade agreements such as ASEAN and later RCEP (signed 2020); (v) after 2008, weaker demand, rising protectionism and China's rebalancing towards domestic production; (vi) geopolitical tensions, concerns over supply-chain resilience and pandemic disruption, leading to reshoring and 'China plus one' strategies.
These changes create opportunities for countries like India to integrate into reconfigured value chains, through schemes such as the production-linked incentives of 2020.
Example 15 (UPSC 2019, 20 marks): Can multinational investment defeat the objective of inclusive growth? Give reasons for your answer.
Paper and question: Paper I, Q7(c)
Approach: Define inclusive growth, then argue both ways: how MNC investment can undermine inclusion (capital intensity, crowding out, regional and skill bias, profit outflow, tax avoidance) and how it can support it; conclude that outcomes depend on policy.
Inclusive growth means growth that is broad-based across sectors, regions and social groups, creates productive employment and reduces poverty and inequality; India's Eleventh Plan (2007–12) made it the central objective.
Yes, MNC investment can defeat it: (i) MNCs often use capital- and skill-intensive technology, creating few jobs for the unskilled and raising the skill premium; (ii) they may crowd out small domestic firms and artisans through superior brands and finance, as feared in retail; (iii) investment concentrates in a few states and cities with good infrastructure, widening regional disparities; (iv) profit repatriation, royalties and transfer pricing drain resources, and tax avoidance erodes the revenue needed for social spending; (v) in extractive sectors, displacement of tribal communities and environmental damage hurt the poor; (vi) market power can raise prices, as with some patented medicines.
But MNCs can also support inclusion: they create direct and indirect jobs (India's automobile and electronics assembly, IT services), bring technology and skills that spill over to local suppliers, integrate local firms into global value chains and pay taxes. Their effect depends on linkages with domestic firms and the host country's absorptive capacity.
Policy matters: directing FDI to labour-intensive manufacturing and backward regions, building supplier linkages and skills, enforcing competition and tax law (including the global minimum tax), and protecting land rights and the environment.
Hence multinational investment does not by itself guarantee or defeat inclusive growth; it can defeat it where it is enclave-type and capital-intensive, and promote it where policy ensures linkages, jobs and fair taxation.
Example 16 (UPSC 2016, 10 marks): Explain Dunning's eclectic theory of FDI.
Paper and question: Paper I, Q5(b)
Approach: Explain Dunning's OLI paradigm: the three conditions (ownership, location, internalisation) and what each explains, with an example.
John Dunning's eclectic theory (1977) combines earlier theories to explain why, where and how firms undertake foreign direct investment. FDI occurs only when three conditions, the OLI advantages, are present together.
Ownership (O) advantages: firm-specific assets such as technology, patents, brands, management and scale that allow a foreign firm to compete with local firms abroad (the 'why'). Location (L) advantages: features of the host country such as cheap labour, resources, market size and tariffs that make it better to produce there rather than export (the 'where').
Internalisation (I) advantages: the gains from exploiting the ownership advantage within the firm rather than through licensing or contracts, because of imperfect markets for knowledge, risk of imitation and the need for quality control (the 'how').
If L is absent the firm exports, and if I is absent it licenses its advantage. For example, Suzuki invested in India in the 1980s because it had technology (O), India offered a large protected market (L), and it preferred to control production (I).
Example 17 (UPSC 2015, 20 marks): "As long as the substitution possibilities between foreign and domestic resources are limited, the dual-gap analysis is relevant." Critically examine this statement.
Paper and question: Paper I, Q7(a)
Approach: Explain the Chenery-Strout two-gap model (savings gap and foreign-exchange gap, the binding gap), show why limited substitutability between foreign and domestic resources is the key assumption, then critically examine it.
The dual-gap model of Hollis Chenery and Alan Strout ('Foreign Assistance and Economic Development', 1966) argues that growth in developing countries can be limited by two separate constraints.
Savings gap: a target growth rate g requires investment I = v·g·Y (v the capital-output ratio); if domestic saving S falls short, the gap I − S must be filled by foreign capital. Foreign-exchange gap: investment needs imported capital goods and intermediates that domestic industry cannot produce; if required imports M exceed export earnings X, the gap M − X must be filled. Ex post the two gaps are equal (I − S = M − X), but ex ante they differ, and foreign capital must cover the larger, binding gap.
The model relies on limited substitutability between foreign and domestic resources: if domestic saving could be converted into imports (by exporting more, or by producing import substitutes), the foreign-exchange gap would vanish and only the savings gap would matter, as in the Harrod-Domar model. Structural rigidities in poor countries, such as export pessimism and the lack of capital-goods industries, make this conversion difficult, so the dual-gap analysis is relevant as long as substitution is limited.
Critique: (i) the rigidities are often policy-induced: overvalued exchange rates and inward-looking trade regimes depress exports; East Asian economies closed the foreign-exchange gap by export promotion; (ii) over time substitution rises through devaluation, import substitution and diversification, so the gaps are not fixed; (iii) the model assumes fixed capital-output and import coefficients; (iv) aid may substitute for domestic saving rather than add to it (Griffin and Enos, 1970).
So the statement is valid: the dual-gap analysis is a short-run, structuralist framework whose relevance diminishes as economies gain flexibility through trade and exchange-rate reform.
Example 18 (UPSC 2014, 20 marks): "Apart from bringing capital into a country, multinational corporations provide many other advantages that cannot be obtained by borrowing from international capital market." Discuss.
Paper and question: Paper I, Q8(b)
Approach: Discuss the non-capital benefits of MNC investment compared with borrowing (technology, management, market access, spillovers, risk sharing and no debt service, competition, employment and taxes), then note the caveats.
Borrowing from international capital markets provides only finance, which must be repaid with interest whatever the outcome. Investment by multinational corporations brings a package of resources that money alone cannot buy, which is why most developing countries now compete for FDI.
Advantages beyond capital: (i) technology: MNCs transfer production technology, often embodied in machinery and processes that are not available for sale; (ii) managerial and organisational skills, quality standards and training of local workers; (iii) market access: MNCs integrate host countries into global value chains and their marketing networks, raising exports, as Suzuki did for India's automobile exports and Samsung and Apple's suppliers for electronics; (iv) spillovers: local suppliers and competitors learn through linkages, worker mobility and demonstration effects; (v) risk sharing: FDI is equity, so returns are paid only when profits are made, there is no fixed debt-service burden, and FDI is more stable than loans in a crisis, as the 1997 Asian crisis and India's 1991 crisis showed; (vi) competition: entry of MNCs raises efficiency of domestic firms and quality for consumers; (vii) employment and tax revenue.
These benefits are not automatic. MNCs may use capital-intensive technology, keep R&D at home, repatriate profits, engage in transfer pricing and crowd out local firms; spillovers depend on the host country's absorptive capacity, skills and supplier base.
Policy: India's liberalised FDI regime since 1991, with most sectors on the automatic route, and schemes such as Make in India (2014) aim to capture these benefits while competition law and tax rules limit the costs.
Hence the statement is largely correct: MNCs provide technology, skills, market access and risk sharing that borrowing cannot, provided the host country builds the capacity to absorb them.
3. Planning, Tinbergen, Market versus Planning and Public-Private Partnership
Example 19 (UPSC 2026, 10 marks): Throw light on the changing role of markets in economic development of developing countries. How it has affected planning process? Discuss.
Paper and question: Paper I, Q5(c)
Approach: Trace the shift from state-led to market-friendly development, and show how planning changed from directive to indicative and strategic (India's Planning Commission to NITI Aayog).
In the 1950s and 1960s most developing countries followed state-led development: markets were seen as weak, so the state planned investment, ran public enterprises and controlled trade and prices. The poor performance of controls, the success of export-oriented East Asia, the debt crisis of the 1980s and the collapse of Soviet planning shifted opinion towards markets.
Markets now allocate most resources through price signals, private investment, competition and global integration, while the state corrects market failures and provides public goods, regulation and social protection, the 'market-friendly' approach of the World Bank's 1991 World Development Report.
Effect on planning: planning moved from directive, quantitative targets for every sector to indicative and strategic planning: setting a vision, coordinating infrastructure, using incentives and public-private partnership. India's Eighth Plan (1992–97) adopted indicative planning, and in 2015 NITI Aayog replaced the Planning Commission as a policy think tank promoting cooperative federalism, without allocating funds.
Thus planning has not disappeared; it now guides and complements markets rather than replacing them.
Example 20 (UPSC 2025, 15 marks): Explain the role of planning in the development process in the context of increasing significance of market economy.
Paper and question: Paper I, Q8(c)
Approach: Show why planning still matters in a market economy (market failures, coordination, long-term investment, equity, sustainability), how its form has changed (indicative, Tinbergen's targets and instruments, PPP), with India's experience.
Even as markets have become the main allocators of resources, planning, meaning the conscious coordination of economic decisions towards chosen goals, remains important in development; what has changed is its form.
Why planning remains relevant: (i) market failures: public goods, externalities, information gaps and missing markets for long-term finance; (ii) coordination failures: Rosenstein-Rodan's big push shows that complementary investments may not happen without coordination, especially in infrastructure; (iii) long horizons: markets under-invest in projects with long gestation, such as power, railways, research and human capital; (iv) equity and regional balance, which markets do not ensure; (v) sustainability, such as energy transition, which requires long-term targets.
Changed role: planning is now indicative and strategic. Following Tinbergen, the planner fixes targets (growth, employment, emissions) and assigns instruments (public investment, taxes, regulation), and coordinates with the private sector through incentives, PPP and stable policy rather than licences and quantitative controls. East Asian states combined markets with strategic planning, the 'developmental state'.
In India the Planning Commission's Five Year Plans ended with the Twelfth Plan (2012–17); NITI Aayog (2015) prepares strategies and visions, monitors outcomes (SDG India Index, Aspirational Districts Programme from 2018) and promotes cooperative federalism, while the National Infrastructure Pipeline (2019) and PM Gati Shakti (2021) coordinate infrastructure.
Hence, in a market economy, planning complements markets by setting direction, coordinating investment and correcting failures.
Example 21 (UPSC 2024, 15 marks): What are the advantages and disadvantages of public-private partnership model for economic development? What are the key prerequisites for success of PPP model? Explain giving examples.
Paper and question: Paper I, Q7(b)
Approach: Define PPP and its models, list advantages and disadvantages with Indian examples, then set out the prerequisites for success (risk allocation, regulation, renegotiation framework, finance), citing the Kelkar Committee.
A public-private partnership is a long-term contract in which a private party finances, builds and operates a public asset or service, bears significant risk and is paid through user charges or government annuities. Models include BOT (build-operate-transfer), DBFOT, the Hybrid Annuity Model (HAM, used by NHAI since 2016) and TOT (toll-operate-transfer).
Advantages: additional finance beyond the budget; private efficiency, technology and management; faster completion and better maintenance through whole-life costing; transfer of construction and operating risk; and service quality, as in the Delhi, Mumbai, Hyderabad and Bengaluru airports developed under PPP from the mid-2000s.
Disadvantages: higher private cost of capital; complex contracts and high transaction costs; aggressive bidding followed by renegotiation and stalled projects (many highway BOT projects after 2011); contingent liabilities for government; user charges that may exclude the poor.
Prerequisites for success (many recommended by the Kelkar Committee on revisiting and revitalising PPP, 2015): (i) balanced risk allocation, each risk borne by the party best able to manage it; (ii) well-prepared projects with land and clearances in place; (iii) transparent competitive bidding; (iv) independent sectoral regulators; (v) a framework for renegotiation and quick dispute resolution; (vi) long-term finance, such as viability gap funding (from 2006) and infrastructure debt funds; (vii) capacity in public agencies.
PPP works best where outputs are measurable and revenues reliable, and is no substitute for good public procurement elsewhere.
Example 22 (UPSC 2020, 10 marks): Explain how public-private partnership helps in the rapid economic development of a country.
Paper and question: Paper I, Q5(e)
Approach: Define PPP and explain the channels through which it speeds development (finance, efficiency, speed, risk sharing, innovation), with examples and a caveat.
A public-private partnership (PPP) is a long-term arrangement in which the private sector finances, builds and operates infrastructure or services that the state traditionally provided, sharing risks and rewards under a contract.
How it speeds development: (i) it adds private finance to scarce public funds, easing the infrastructure gap; (ii) private management brings efficiency, technology and better maintenance, since the operator bears whole-life costs; (iii) projects are often completed faster, as payment depends on completion and performance; (iv) construction and operating risks are shifted to the party best able to bear them; (v) better infrastructure lowers logistics costs and crowds in private investment, raising growth.
India's PPP airports (Delhi, Mumbai, Hyderabad, Bengaluru), ports such as Mundra and highways built under BOT and the Hybrid Annuity Model illustrate these gains.
But PPPs need sound contracts, risk sharing and regulation; poorly designed ones lead to renegotiation and stalled projects.
Example 23 (UPSC 2019, 15 marks): Can public-private partnership function effectively in the area of physical infrastructure?
Paper and question: Paper I, Q4(b)
Approach: Answer yes, conditionally: explain why physical infrastructure suits PPP, review Indian experience (successes and problems), and state the conditions under which PPP functions effectively.
Yes, but only under the right conditions. Physical infrastructure (roads, ports, airports, power, urban transport) suits PPP because outputs are measurable, user charges can generate revenue, and private firms can bring finance, construction efficiency and better maintenance.
Successes in India: modernisation of the Delhi and Mumbai airports (2006) and the greenfield Hyderabad and Bengaluru airports; private ports such as Mundra; national highways under BOT and, since 2016, the Hybrid Annuity Model; and private participation in power generation and transmission.
Problems: after 2011 many highway and power PPPs stalled because of aggressive bidding, delays in land acquisition and clearances, over-optimistic traffic forecasts, weak dispute resolution and stressed balance sheets of developers and banks (the twin balance sheet problem). The Delhi Airport Metro Express line was handed back in 2013.
Conditions for effectiveness: (i) allocation of each risk to the party best able to manage it, with land and clearances provided upfront by government; (ii) realistic project preparation and transparent bidding; (iii) independent regulation of tariffs and quality; (iv) a fair renegotiation and dispute-resolution framework, as the Kelkar Committee (2015) recommended; (v) long-term finance through infrastructure debt funds, viability gap funding and InvITs; (vi) shifting to annuity or hybrid models where demand risk is high.
Hence PPP can function effectively in physical infrastructure if contracts are well designed and governments retain strong regulatory capacity.
Example 24 (UPSC 2018, 10 marks): What are shadow prices? Why are these preferred over market prices in project evaluation?
Paper and question: Paper I, Q5(b)
Approach: Define shadow prices as social opportunity costs, explain why market prices mislead in developing countries (distortions), give examples (shadow wage, exchange rate, discount rate) and the Little-Mirrlees and UNIDO methods.
Shadow prices (accounting prices) are the values of goods and factors that reflect their true social opportunity cost, i.e. what society gives up when a resource is used in a project. They equal market prices only under perfect competition without distortions.
In developing countries market prices are distorted by tariffs and quotas, overvalued exchange rates, minimum wages and surplus labour, subsidised credit, monopoly and externalities. So: the shadow wage of unskilled labour is below the market wage when labour has a low alternative product; the shadow exchange rate exceeds the official rate when the currency is overvalued; and the social discount rate may differ from the market interest rate.
In social cost-benefit analysis, shadow prices ensure that projects are chosen for their contribution to national welfare, not private profit.
The Little-Mirrlees method (OECD Manual, 1968; revised 1974) values goods at world (border) prices, while the UNIDO Guidelines (Dasgupta, Marglin and Sen, 1972) use domestic consumption as numeraire and add distributional weights.
Example 25 (UPSC 2018, 15 marks): Explain why the market and the State have complementary roles in economic development.
Paper and question: Paper I, Q8(a)
Approach: Argue complementarity: what markets do well and where they fail, what the state does well and where it fails, and how the two reinforce each other, with East Asian and Indian examples.
The old debate posed the market and the state as alternatives. Development experience shows that they are complements: each does what the other cannot, and each needs the other to work well.
Markets allocate resources efficiently through prices, reward innovation and use dispersed information (Hayek). But they fail with public goods, externalities, information asymmetry, natural monopoly, coordination problems and inequality, and they under-provide health, education and infrastructure in poor countries.
The state can correct these failures: it provides law and order, property rights and contract enforcement on which markets depend; it supplies public goods and infrastructure; it regulates monopolies and pollution; it invests in human capital; and it redistributes and stabilises. But it can also fail through rent-seeking, inefficiency and information problems (public choice theory), as India's licence raj showed.
Complementarity in practice: the East Asian 'developmental states' (Japan, Korea, Taiwan) combined competitive export markets with strategic state support, which the World Bank's East Asian Miracle (1993) acknowledged; India's reforms since 1991 widened markets while the state invested in infrastructure, digital public goods (Aadhaar, UPI) and welfare.
Hence a market-friendly state that builds institutions and capabilities, and a market disciplined by regulation, together produce faster and more inclusive development.
Example 26 (UPSC 2015, 10 marks): What is indicative planning? In this context, explain how State and markets can play a synergetic role in economic development.
Paper and question: Paper I, Q7(c)
Approach: Define indicative planning (French model), contrast it with imperative planning, and explain the synergy between state and market it embodies, with India's example.
Indicative planning sets national targets and forecasts for the economy, but leaves the private sector free to decide, guiding it through information, consultation and incentives rather than commands. France pioneered it with the Monnet Plan of 1947, prepared through joint commissions of government, business and unions.
Unlike imperative (directive) planning of the Soviet type, where the state fixes outputs and prices, indicative planning relies on markets for allocation and uses planning to reduce uncertainty and coordinate investment.
Synergy: the state provides vision, public infrastructure, a stable macroeconomic framework and incentives (tax concessions, credit), and corrects market failures; markets supply efficiency, innovation and private investment that follow the signals. Planning reduces coordination failures, while market discipline prevents the waste of central planning.
India adopted indicative planning from the Eighth Plan (1992–97), and NITI Aayog (2015) continues the approach through strategy documents and cooperative federalism.
Example 27 (UPSC 2014, 10 marks): Point out the critical elements in typical Public-Private-Partnership (PPP) agreements in the infrastructure projects to safeguard the interests of the public.
Paper and question: Paper I, Q5(d)
Approach: List the key clauses that protect public interest in infrastructure PPP agreements (risk allocation, output standards, tariffs, concession period, termination, step-in, escrow, independent engineer, disputes, handback).
A PPP concession agreement transfers a public asset or service to a private party for decades, so its terms must protect users and taxpayers. The critical elements are:
(i) clear risk allocation, with each risk assigned to the party best able to manage it; (ii) output and performance standards (service levels, safety, maintenance) with penalties for failure; (iii) a transparent tariff formula and revision mechanism, ideally overseen by an independent regulator; (iv) a defined concession period, with revenue sharing or a cap on returns to prevent windfall gains; (v) an escrow account controlling cash flows; (vi) an independent engineer to certify construction and quality;
(vii) termination clauses with fair compensation, and government step-in rights if the operator defaults; (viii) rules limiting renegotiation and requiring competitive bidding; (ix) quick dispute resolution; (x) handback conditions ensuring the asset is returned in good condition.
India's Model Concession Agreements for highways and ports contain many of these provisions.
Example 28 (UPSC 2014, 10 marks): Our development strategy has been proposed in terms of 'faster', 'more inclusive' and 'sustainable' growth. Do the three components sit together well? Argue for your answer.
Paper and question: Paper I, Q7(c)
Approach: Identify the strategy (Twelfth Plan, 2012–17), examine the possible conflicts between faster, inclusive and sustainable growth, then argue that they can be complementary with the right pattern of growth.
The Twelfth Five Year Plan (2012–17) was titled 'Faster, More Inclusive and Sustainable Growth'. At first sight the three components conflict.
Possible conflicts: faster growth based on capital-intensive industry may widen inequality, as Kuznets's inverted U suggests; faster growth also raises the use of energy, water and land and increases emissions, while strict environmental rules may slow growth in the short run.
But they can sit together: inclusion strengthens growth by building human capital and widening the home market, and reduces social conflict; sustainability protects the natural capital on which future growth depends, and clean technologies and efficiency create new industries; and growth provides the resources for social and environmental spending. The environmental Kuznets curve and green growth show that decoupling is possible with policy.
Hence the three are compatible if growth is labour-intensive, resource-efficient and supported by human development, though trade-offs must be managed.
4. Measuring Development: Human Development Indices and the Basic Needs Approach
Example 29 (UPSC 2026, 15 marks): What are the various approaches to Human Development? Elaborate Basic Needs Approach.
Paper and question: Paper I, Q8(c)
Approach: List the main approaches to human development (income, basic needs, capability, human resource, rights-based), then elaborate the basic needs approach: origin, content, measurement, merits and criticism.
Approaches to human development: (i) the income or growth approach, which treats rising GDP per head as the route to well-being; (ii) the human resource development approach, which treats people as human capital; (iii) the basic needs approach, which targets minimum consumption and services for all; (iv) Amartya Sen's capability approach, which judges development by the freedoms people have to be and do what they value, and underlies UNDP's Human Development Reports since 1990; and (v) the human rights-based approach.
Basic needs approach: it emerged in the 1970s, when growth had not reduced poverty; it was launched by the ILO's World Employment Conference (1976) and developed by Paul Streeten and others (First Things First, 1981). It holds that development should directly ensure that all people have food, shelter, clothing, safe water, sanitation, health care, education and transport.
Measurement uses social indicators such as life expectancy, literacy, calorie intake and access to water, and Morris D. Morris's Physical Quality of Life Index (1979). India's Minimum Needs Programme in the Fifth Plan (1974–79) followed this approach.
Merits: it focuses on outcomes for the poor, shows that low-income countries such as Sri Lanka and Kerala can achieve high social indicators. Criticism: defining 'basic' is arbitrary; it can be paternalistic and focus on commodities rather than capabilities.
The capability approach later broadened it, but meeting basic needs remains central to human development.
Example 30 (UPSC 2025, 10 marks): Write down the major limitations of HDI developed by the UNDP.
Paper and question: Paper I, Q5(e)
Approach: State the HDI briefly and list its major limitations (coverage, weights and substitutability, inequality, data, sustainability, ranking sensitivity).
The UNDP's Human Development Index (since 1990) is the geometric mean of normalised indices of health (life expectancy), education (mean and expected years of schooling) and income (log of GNI per head, PPP).
Limitations: (i) narrow coverage: it omits freedom, security, employment, gender equality and environment, so it captures only a few capabilities; (ii) averages hide inequality between groups and regions, which is why the inequality-adjusted IHDI was added in 2010; (iii) arbitrary weights and goalposts: equal weights and the chosen minimum and maximum values are not derived from any theory, and they imply trade-offs between longevity and income that Ravallion (2012) found troubling;
(iv) quantity over quality: years of schooling ignore learning, and life expectancy ignores health quality; (v) data problems: outdated or imputed data and PPP revisions change rankings; (vi) no sustainability: high HDI may rest on unsustainable resource use, which the planetary pressures-adjusted HDI (2020) tries to address.
Despite these limits, the HDI remains a useful corrective to GDP.
Example 31 (UPSC 2024, 10 marks): Critically examine 'per capita' GDP as a crude indicator of development.
Paper and question: Paper I, Q5(a)
Approach: Explain what per capita GDP measures and why it is useful, then critically examine its shortcomings as a development indicator, and mention better measures.
Per capita GDP, the value of output divided by population, is the most widely used indicator of development because it is easy to measure, comparable and closely related to living standards. Yet it is a crude indicator.
Shortcomings: (i) it is an average that ignores distribution: a rise may accrue to a few; (ii) it excludes non-market activities such as household work and subsistence production, important in developing countries; (iii) it ignores environmental depletion and pollution, counting resource extraction as income; (iv) it counts 'regrettables' such as defence and pollution clean-up as output; (v) it omits leisure, health, education, freedom and security; (vi) exchange-rate conversion distorts comparisons unless PPP is used; (vii) GDP includes income paid to foreigners, so GNI may be a better income measure.
Sen showed that countries with similar income differ greatly in life expectancy and literacy (Kerala versus richer states).
Hence better measures such as the HDI, IHDI, multidimensional poverty index and green accounting supplement per capita GDP.
Example 32 (UPSC 2024, 20 marks): Describe the major components used in Human Development Index (HDI) by the United Nations Development Programme (UNDP). Write down the methodological limitations of this index. Suggest appropriate method to eliminate these limitations.
Paper and question: Paper I, Q8(a)
Approach: Describe the three dimensions, indicators, goalposts and aggregation of the HDI with the formula; list its methodological limitations; then suggest remedies (inequality adjustment, quality indicators, alternative weighting, additional dimensions, sustainability adjustment).
The Human Development Index, introduced by UNDP in 1990 under Mahbub ul Haq and inspired by Sen's capability approach, measures average achievement in three dimensions.
Components: (i) a long and healthy life: life expectancy at birth (goalposts 20 and 85 years); (ii) knowledge: mean years of schooling of adults aged 25 and above (maximum 15) and expected years of schooling for children (maximum 18), averaged; (iii) a decent standard of living: GNI per capita in PPP dollars (goalposts 100 and 75,000), in logarithms. Each dimension index = (actual − minimum)/(maximum − minimum), and since 2010 HDI = (I_health × I_education × I_income)^(1/3), a geometric mean. In the 2025 Report India's HDI was 0.685, ranked 130th of 193 countries.
Methodological limitations: (i) the goalposts and equal weights are arbitrary; (ii) the geometric mean still allows substitution between dimensions, implying controversial trade-offs between income and longevity (Ravallion, 2012); (iii) averages ignore inequality within countries; (iv) indicators measure quantity, not quality (schooling, not learning); (v) the log of income treats income gains at high levels as almost worthless; (vi) missing dimensions: gender, freedom, security, environment.
Remedies: (i) adjust for inequality, as in the IHDI (2010), which discounts each dimension by its Atkinson inequality; (ii) use quality indicators such as learning-adjusted years of schooling and healthy life expectancy; (iii) derive weights statistically (principal component analysis) or through public consultation, and test rankings for sensitivity; (iv) supplement with the GDI, GII and Multidimensional Poverty Index; (v) adjust for sustainability, as in the planetary pressures-adjusted HDI (2020) or by using adjusted net savings; (vi) improve national data and disaggregate to sub-national levels.
With these remedies the HDI becomes a more reliable dashboard of human development, though no single index can capture all of it.
Example 33 (UPSC 2023, 10 marks): Explain how modified HDI is an improved measure of development over HDI.
Paper and question: Paper I, Q5(d)
Approach: Explain the 2010 revision of the HDI (new indicators, geometric mean) and the inequality-adjusted HDI, showing how each improves on the original index.
The original HDI (1990) was a simple arithmetic average of indices of life expectancy, adult literacy with gross enrolment, and adjusted GDP per head. In 2010 UNDP introduced a modified HDI and companion indices.
Improvements: (i) better indicators: mean years and expected years of schooling replaced literacy and enrolment, which had reached ceilings in many countries, and GNI per head replaced GDP, since it measures the income residents actually receive; (ii) the geometric mean replaced the arithmetic mean, so poor performance in one dimension can no longer be fully offset by high achievement in another, and balanced development is rewarded.
(iii) The inequality-adjusted HDI (IHDI) discounts each dimension by its inequality across people (Atkinson measure), so the loss from inequality, the gap between HDI and IHDI, becomes visible; India loses roughly 30% of its HDI to inequality.
Later additions, such as the planetary pressures-adjusted HDI (2020), adjust for carbon emissions and material use. The modified HDI is thus a more accurate and more equity-sensitive measure, though weights and goalposts remain arbitrary.
Example 34 (UPSC 2022, 15 marks): Distinguish between Gender Development Index (GDI) and Gender Empowerment Measure (GEM) in terms of their components and constructions.
Paper and question: Paper I, Q6(c)
Approach: Explain the construction of the GDI (both the 1995 equally-distributed-equivalent version and the current female-to-male HDI ratio) and of the GEM, then tabulate the distinctions in a paragraph; note the GII replacement.
Both indices were introduced in UNDP's Human Development Report 1995 to capture gender gaps.
Gender Development Index (GDI): it uses the same three dimensions as the HDI (health, education, income) but measures them separately for women and men. In the 1995 version, each dimension was combined into an 'equally distributed equivalent' index, a harmonic-type mean of female and male achievements weighted by population shares with an inequality aversion parameter ε = 2, so that gender gaps lowered the index below the HDI. Since 2014 the GDI is simply the ratio of the female HDI to the male HDI; a value of 1 means parity.
Gender Empowerment Measure (GEM): it measured women's agency rather than well-being, through three dimensions: (i) political participation and decision-making, the share of parliamentary seats held by women; (ii) economic participation and decision-making, women's shares of legislators, senior officials and managers, and of professional and technical posts; and (iii) power over economic resources, estimated earned income of women relative to men. Each was converted into an equally distributed equivalent percentage with ε = 2 and averaged.
Distinction: the GDI asks whether women enjoy the same basic capabilities as men; the GEM asks whether women can participate in economic and political life and use those capabilities.
Because the GEM was biased towards elites and rich countries, UNDP replaced it in 2010 with the Gender Inequality Index.
Example 35 (UPSC 2021, 10 marks): Explain how gender sensitive human development index can be constructed.
Paper and question: Paper I, Q5(b)
Approach: Show how a gender-sensitive HDI is built: separate female and male indices for each HDI dimension, then either the GDI ratio or the equally-distributed-equivalent penalty; mention the GII.
A gender-sensitive HDI adjusts average human development for disparities between women and men. UNDP's Gender Development Index (GDI) is built in four steps.
Construction: (1) estimate female and male values of each indicator: life expectancy, mean and expected years of schooling, and estimated earned income (derived from wage ratios, labour-force shares and GNI). (2) normalise each using goalposts (life expectancy 22.5–87.5 years for women and 17.5–82.5 for men, reflecting women's biological advantage). (3) compute a female HDI and a male HDI as geometric means of their dimension indices. (4) GDI = HDI_female/HDI_male; a value below 1 shows female disadvantage.
The earlier 1995 method combined female and male indices into an 'equally distributed equivalent' with an aversion parameter ε = 2, penalising the HDI for gender gaps.
Agency is captured separately by the Gender Inequality Index (2010), using maternal mortality, adolescent births, parliamentary seats, secondary education and labour-force participation.
Example 36 (UPSC 2019, 10 marks): How is Human Development Index calculated by UNDP? Can there be a better method of assigning weights to various indicators?
Paper and question: Paper I, Q1(d)
Approach: Give the HDI calculation (indicators, goalposts, dimension indices, geometric mean), then discuss whether better weighting methods exist (statistical, participatory, data-driven) and their limits.
Calculation: UNDP's HDI has three dimensions. Health: life expectancy at birth (goalposts 20 and 85). Education: mean years of schooling (maximum 15) and expected years of schooling (maximum 18), averaged. Income: log of GNI per head in PPP dollars (goalposts 100 and 75,000). Each dimension index = (actual − min)/(max − min), and HDI = (I_health × I_education × I_income)^(1/3), so each dimension implicitly gets equal weight.
Better weights? Equal weights are simple but arbitrary. Alternatives: (i) statistical weights from principal component analysis (Noorbakhsh, 1998); (ii) 'benefit of the doubt' weights from data envelopment analysis, letting each country be judged by its best dimension; (iii) participatory weights from surveys of people's priorities; (iv) weights based on the shadow prices or trade-offs society accepts, prompted by Ravallion's (2012) critique.
Since 2010 the geometric mean also penalises uneven achievement across dimensions, which partly answers the weighting criticism.
Each alternative has its own arbitrariness and makes the index harder to understand, so UNDP retains equal weights for transparency and tests the robustness of rankings.
Example 37 (UPSC 2014, 20 marks): Describe the different indicators that are used by UNDP to construct the Human Development Index (HDI). Why is a logarithmic transformation applied only to per capita income in the calculation of HDI?
Paper and question: Paper I, Q8(a)
Approach: Describe the HDI indicators and their normalisation and aggregation, then explain why only income is log-transformed (diminishing returns of income to capabilities; income as a means; bounded nature of other indicators).
The Human Development Index, introduced in UNDP's first Human Development Report (1990) under Mahbub ul Haq with Amartya Sen's capability approach as its basis, measures average achievement in three basic dimensions of human development.
Indicators: (i) health, measured by life expectancy at birth (goalposts 20 and 85 years); (ii) knowledge, measured by mean years of schooling of adults aged 25 and over (maximum 15) and expected years of schooling of children entering school (maximum 18); (iii) standard of living, measured by GNI per capita in PPP dollars (goalposts 100 and 75,000). Each indicator is normalised as (actual − minimum)/(maximum − minimum); the education index averages its two components; and the HDI is the geometric mean of the three indices.
Why log only for income: (i) the HDI treats income as a means to capabilities, not an end, and its contribution to human development shows sharply diminishing returns: an extra 1,000 dollars matters far more at 1,000 dollars than at 50,000; the logarithm captures this concavity, as proposed by Anand and Sen; (ii) life expectancy and schooling are already naturally bounded (no one lives 200 years or studies 50 years) and their marginal value does not fall in the same way; (iii) without the log, the huge range of incomes across countries would dominate the index and the HDI would largely replicate GDP rankings. From 1991 to 1998 UNDP discounted incomes above a threshold even more heavily with Atkinson's formula, before adopting the logarithm in 1999.
Critics note that the log makes income gains in rich countries count very little. Still, the log transformation keeps the HDI faithful to its purpose: measuring human capabilities rather than wealth.
5. Development and Environmental Sustainability
Example 38 (UPSC 2026, 20 marks): "Earth provides enough to satisfy every man's needs, but not every man's greed". Analyse this statement in the context of environmental degradation and the rights of future generations. To what extent does the rapid, industrial-driven depletion of non-renewable resources constitute a violation of intergenerational equity.
Paper and question: Paper I, Q8(a)
Approach: Interpret the statement (needs versus greed, overconsumption), link it to environmental degradation and to intergenerational equity (Brundtland, Hotelling, Hartwick, weak and strong sustainability), then judge to what extent rapid depletion violates intergenerational equity.
The statement, attributed to Mahatma Gandhi, says that nature can meet everyone's basic needs, but not unlimited consumption driven by greed. Environmental degradation, on this view, results not from scarcity but from overconsumption, especially by the rich, and from treating nature as a free resource.
Environmental degradation: markets under-price natural resources because of externalities and open access, so forests, fisheries, groundwater and the atmosphere are over-used. The poor suffer most from the resulting damage.
Intergenerational equity: the Brundtland Report (Our Common Future, 1987) defined sustainable development as meeting the needs of the present without compromising the ability of future generations to meet their own needs. Future generations have no voice in today's markets, and positive discount rates give little weight to their welfare.
Non-renewable resources: Hotelling (1931) showed that efficient extraction raises the net price at the rate of interest, so some depletion is efficient. Under weak sustainability (Solow, 1974; Hartwick, 1977) depletion is fair if the rents are reinvested in reproducible capital, keeping total capital, and so future consumption, constant (Hartwick's rule). Under strong sustainability (Herman Daly) critical natural capital, such as a stable climate and biodiversity, cannot be substituted and must be preserved.
Judgement: rapid industrial depletion violates intergenerational equity when (i) rents are consumed rather than invested, as in many resource-rich economies with weak institutions (the resource curse); (ii) extraction causes irreversible damage, such as emissions from fossil fuels that commit future generations to warming; and (iii) prices ignore externalities. It does not necessarily violate it where rents build human and physical capital and technology creates substitutes.
Hence the extent of violation depends on reinvestment, substitutability and irreversibility; the remedy lies in pricing externalities, saving resource rents and shifting to renewables.
Example 39 (UPSC 2025, 15 marks): Do you think that economic growth and sustainable development are contrary to each other? Justify your answer.
Paper and question: Paper I, Q8(b)
Approach: Argue that they are not inherently contrary: present the conflict view (limits to growth, rebound), then the complementarity view (EKC, decoupling, green growth, growth financing sustainability), and conclude with conditions.
Sustainable development (Brundtland, 1987) is development that meets present needs without compromising future generations. Whether it conflicts with economic growth depends on the kind of growth.
The conflict view: the Club of Rome's The Limits to Growth (Meadows et al., 1972) and Herman Daly's steady-state economics argue that on a finite planet continuous growth in output must exhaust resources and sinks; global emissions and material use have risen with world GDP, and efficiency gains are partly offset by higher consumption (the Jevons or rebound effect).
The complementarity view: (i) growth that changes composition and technique can reduce pollution per unit of output: the environmental Kuznets curve; (ii) several advanced economies, such as the UK, have cut territorial carbon emissions while growing, showing decoupling; (iii) growth provides resources for clean technology, and poverty itself degrades the environment through fuelwood use and soil mining; (iv) clean energy, efficiency and the circular economy create new industries, the idea of green growth.
In India, rising GDP has gone with a fall in emissions intensity of GDP and non-fossil sources reaching about half of installed power capacity in 2025, though absolute emissions still rise.
Hence growth and sustainable development are not inherently contrary; they conflict only when growth is resource-intensive and externalities are unpriced. Pricing carbon, investing in renewables and protecting natural capital make them compatible.
Example 40 (UPSC 2024, 10 marks): Discuss how carbon trading is helpful in reducing environmental degradation.
Paper and question: Paper I, Q5(c)
Approach: Explain cap and trade, why trading achieves a given emission cut at least cost (equalising marginal abatement costs), and give examples with limitations.
Carbon trading (cap and trade), proposed by J.H. Dales (1968), sets a ceiling (cap) on total emissions and issues permits equal to the cap; firms must hold a permit for each tonne emitted and may buy or sell permits.
It reduces degradation in two ways. First, the cap fixes the environmental outcome. Second, trading achieves it at least cost: firms with low marginal abatement costs cut more and sell permits, firms with high costs buy them, until marginal abatement costs are equal across firms (Montgomery, 1972). The permit price also gives a continuing incentive to adopt cleaner technology.
Diagram: two firms' marginal abatement cost curves; trading moves abatement until both MACs equal the permit price.
Examples include the EU Emissions Trading System (2005), the US sulphur dioxide programme (1990s), and India's Perform, Achieve and Trade scheme (2012) and Carbon Credit Trading Scheme (2023). Limitations: over-allocation of permits, price volatility, monitoring costs and the risk that firms relocate (carbon leakage).
Example 41 (UPSC 2023, 10 marks): Can Kuznet's hypothesis of an inverted U-curve be extended to analyse environmental degradation? Explain.
Paper and question: Paper I, Q5(c)
Approach: Explain the environmental Kuznets curve (Grossman and Krueger), its mechanisms (scale, composition, technique, demand for environment) and diagram, then the limits of the extension.
Yes, partly. Grossman and Krueger (1991, 1995) found that some pollutants rise with income per head at low levels and fall beyond a turning point, an inverted U named the environmental Kuznets curve (EKC) by Panayotou (1993).
Mechanisms: at first the scale effect of more output and industrialisation dominates; later the composition effect (shift to services) and the technique effect (cleaner technology) take over, and richer citizens demand a cleaner environment and stronger regulation, since environmental quality behaves like a normal or luxury good.
Diagram: pollution on the vertical axis and income per head on the horizontal; an inverted U with the peak at the turning-point income.
But the extension is limited: it holds for local pollutants such as sulphur dioxide, not for carbon dioxide or biodiversity loss; rich countries may export pollution through trade (pollution havens); damage may be irreversible before the turning point; and it reflects policy, not automatic growth. For carbon, emissions have kept rising with income in most countries.
Example 42 (UPSC 2023, 10 marks): How renewable energy use can help attain environmental sustainability? Explain.
Paper and question: Paper I, Q5(e)
Approach: Explain the channels through which renewable energy promotes environmental sustainability (emissions, local pollution, resource depletion, energy security), with Indian data and a caveat.
Renewable energy (solar, wind, hydro, biomass) comes from flows that are replenished naturally, unlike coal, oil and gas, which are finite stocks.
It supports environmental sustainability by: (i) cutting greenhouse gas emissions, since power and transport are the largest sources; (ii) reducing local air pollution from coal plants and vehicles, with large health gains; (iii) conserving non-renewable resources for future generations, in line with intergenerational equity; (iv) reducing water use in thermal power; and (v) improving energy security and reducing import dependence.
India targets 500 GW of non-fossil capacity by 2030 and net zero by 2070, and non-fossil sources reached about half of installed capacity in 2025; schemes include PM-KUSUM (2019) for solar pumps and the National Green Hydrogen Mission (2023).
Renewables need storage, grid upgrades and responsible land use and recycling of panels and batteries to be truly sustainable.
Example 43 (UPSC 2023, 20 marks): How important is rent from extraction of renewable and non-renewable resources to distinguish between Net Domestic Product (NDP) and Environmentally adjusted Domestic Product (EDP). Will the distinction be valid if we have an economy with only renewable resources and the economy reaches the point of maximum sustainable yield?
Paper and question: Paper I, Q8(a)
Approach: Define NDP and EDP (SEEA), explain how depletion of non-renewables (Hotelling rent) and of renewables (rent on harvest in excess of regeneration) creates the difference, then show that at maximum sustainable yield renewable depletion is zero, so the distinction largely disappears except for degradation.
Net Domestic Product (NDP) deducts the depreciation of produced capital from GDP but treats natural capital as free. The UN's System of Environmental-Economic Accounting (SEEA, 1993; Central Framework 2012) defines an Environmentally adjusted Domestic Product: EDP = NDP − depletion of natural resources − cost of environmental degradation.
Role of resource rent: depletion is valued by the rent the resource earns, i.e. (price − marginal extraction cost) × quantity depleted, because that rent is the value of the asset being used up. For a non-renewable resource (coal, oil), every unit extracted reduces the stock, so the whole Hotelling rent on extraction is a capital loss, not income; John Hartwick (1977) showed that this rent must be reinvested to keep consumption sustainable. In mineral-rich economies this deduction can be several per cent of GDP, so rent is crucial to the gap between NDP and EDP.
For a renewable resource (fish, forests, groundwater), the stock regenerates, so only harvest in excess of natural growth reduces the stock: depletion = rent × (harvest − regeneration). If harvest is less than growth, the stock rises and no deduction is made.
Economy with only renewables at maximum sustainable yield: with logistic growth G(S) = rS(1 − S/K), MSY occurs at S = K/2, where harvest equals regeneration (rK/4). The stock is constant, so depletion is zero and EDP equals NDP on the depletion account. The distinction therefore loses validity for depletion.
Diagram: regeneration G(S) as an inverted U against the stock S, peaking at K/2; a harvest line touching the peak shows MSY, where harvest equals growth and the stock is unchanged.
However, EDP may still differ from NDP if there is degradation (pollution, loss of soil quality or biodiversity) or if harvesting is not at MSY. Moreover, MSY is not the economically efficient stock when harvesting costs and discounting are considered (Gordon and Scott). So the distinction remains valid wherever degradation or non-sustainable harvesting occurs.
Example 44 (UPSC 2022, 10 marks): With appropriate examples, discuss the difference between the flow and the stock concept of renewable resources. Can the availability of one of these two resources be less for the consumption of future generations? Justify your answer.
Paper and question: Paper I, Q5(e)
Approach: Distinguish flow and stock renewable resources with examples, then show that stock renewables can be depleted for future generations when harvest exceeds regeneration, while flows generally cannot.
Flow renewable resources are those whose availability in the future does not depend on current use: solar radiation, wind, tides and river flow. Using sunlight today does not reduce sunlight tomorrow; the flow is lost if not used.
Stock (or critical-zone) renewable resources regenerate biologically but have a stock that current use affects: fisheries, forests, groundwater, soil fertility and wildlife. If harvest is less than or equal to natural regeneration, the stock is maintained; if it exceeds regeneration, the stock shrinks, and beyond a critical minimum it may collapse irreversibly, as with the Newfoundland cod fishery in 1992.
Hence yes, the availability of stock renewables can be lower for future generations if they are over-exploited under open access (the tragedy of the commons); falling groundwater tables in Punjab are an example. Flows cannot be depleted by use, though their usable supply can be affected indirectly, for example climate change altering river flows.
Sustainable management therefore requires harvesting stock resources within regeneration limits.
Example 45 (UPSC 2022, 15 marks): Why do developing countries rely on specifying a permissible level of pollution and impose it uniformly across all polluting units of the same kind? What are the problems associated with such a control method?
Paper and question: Paper I, Q8(b)
Approach: Explain why developing countries prefer uniform emission standards (simplicity, monitoring capacity, information, legal tradition, equity), then the problems (cost-ineffectiveness shown by unequal marginal abatement costs, no dynamic incentive, enforcement and capture), with a diagram.
Most developing countries control pollution through command-and-control regulation: a permissible emission level is specified and applied uniformly to all units of the same kind, as India's Central Pollution Control Board does for industries under the Environment (Protection) Act, 1986.
Reasons: (i) simplicity and certainty: a single standard is easy to legislate, understand and check; (ii) limited administrative and monitoring capacity: market instruments need continuous emissions monitoring, permit registries and trading platforms; (iii) information: regulators do not know each firm's abatement costs; (iv) uniform rules seem fair and are legally defensible; (v) taxes and permits face political resistance as a 'licence to pollute'.
Problems: (i) cost-ineffectiveness: firms differ in abatement costs, and a uniform standard forces equal cuts, so marginal abatement costs are not equalised and the same reduction costs more than with a tax or tradable permits (Baumol and Oates); (ii) no dynamic incentive: once the standard is met, firms gain nothing by cutting further or innovating; (iii) enforcement problems: weak monitoring, small penalties and corruption mean widespread non-compliance; (iv) regulatory capture and rent-seeking; (v) standards ignore location: the same emission does more harm in a dense city.
Diagram: two firms with different marginal abatement cost curves; a uniform standard requiring equal abatement gives MAC₁ well below MAC₂; reallocating abatement to the low-cost firm until MACs are equal lowers total cost for the same reduction.
India is moving towards market instruments, such as Surat's particulate-matter emissions trading scheme (2019) and the Carbon Credit Trading Scheme (2023).
Example 46 (UPSC 2022, 15 marks): What are the major achievements and failures of COP (Conference of Parties) 26?
Paper and question: Paper I, Q8(c)
Approach: Give the context of COP26 (Glasgow, 2021), list its main achievements (Glasgow Climate Pact, coal and fossil subsidy language, Paris rulebook, sectoral pledges, adaptation finance, net-zero pledges including India's) and its failures (1.5°C gap, coal phase-down, finance, loss and damage).
The 26th Conference of the Parties to the UNFCCC was held in Glasgow from 31 October to 13 November 2021.
Achievements: (i) the Glasgow Climate Pact kept the 1.5°C goal 'alive', asked countries to strengthen their 2030 targets by the end of 2022 and, for the first time in a COP decision, called for a phase-down of unabated coal power and a phase-out of inefficient fossil-fuel subsidies; (ii) the Paris rulebook was completed, including rules for carbon markets under Article 6; (iii) developed countries agreed to at least double adaptation finance from 2019 levels by 2025; (iv) side pledges on methane (cut 30% by 2030), forests (halt deforestation by 2030) and phasing out coal; (v) new net-zero pledges, including India's net zero by 2070 and its 'Panchamrit' targets for 2030.
Failures: (i) pledges still put the world on a path well above 1.5°C; (ii) 'phase-out' of coal was weakened to 'phase-down' at the last minute; (iii) the promise of 100 billion dollars a year of climate finance by 2020 had not been met; (iv) developing countries' demand for a loss and damage fund was deferred to a dialogue (the fund was agreed at COP27 in 2022).
COP26 thus advanced the rules and ambition, but left the gap between pledges and the 1.5°C pathway, and between needs and finance, unresolved.
Example 47 (UPSC 2021, 10 marks): Do you agree whether sustainable use of energy ensures economic sustainability? Explain.
Paper and question: Paper I, Q5(e)
Approach: Define sustainable energy use and economic sustainability, show how the first supports the second (natural capital, costs, security, health), then note that it is necessary but not sufficient.
Sustainable energy use means meeting energy needs efficiently from sources that do not deplete finite stocks or overload environmental sinks. Economic sustainability means maintaining income and consumption over time, i.e. keeping the total capital stock (produced, human and natural) from declining.
Sustainable energy supports it: it preserves natural capital and avoids climate damage that would reduce future output; renewables have near-zero marginal cost and protect economies from oil-price shocks and import bills (India imports over 85% of its crude oil); efficiency lowers costs; and cleaner air raises labour productivity.
But it does not by itself ensure economic sustainability, which also needs investment in human and physical capital, sound public finances and institutions; a transition that is too costly or ignores coal-dependent workers and regions can harm growth and equity.
So sustainable energy is a necessary, not a sufficient, condition for economic sustainability, and a just transition is required.
Example 48 (UPSC 2020, 10 marks): Explain how renewable resources will play a role in future economics.
Paper and question: Paper I, Q1(c)
Approach: Explain why renewable resources will be central to future economies (exhaustion of non-renewables, climate constraint, falling costs, new industries, circular bioeconomy) and the conditions for sustainable use.
Renewable resources, such as solar and wind energy, forests, fisheries, water and soils, regenerate naturally, whereas fossil fuels and minerals are finite stocks whose depletion and emissions limit long-run growth.
Their role in future economics: (i) energy transition: the climate constraint and net-zero targets make renewable energy the backbone of future power systems, and solar and wind costs have fallen steeply over the past decade; (ii) new industries and jobs in solar manufacturing, batteries, green hydrogen and the bioeconomy; (iii) energy security for importers like India; (iv) a circular economy that replaces extraction with reuse; (v) sustainability accounting, where renewable natural capital counts as wealth.
But renewables must be used within regeneration limits; over-harvesting forests, fish and groundwater turns them into depletable stocks.
Pricing, property rights and community management (Ostrom) are therefore essential.
Example 49 (UPSC 2020, 15 marks): "Even green energy is not always green." Do you agree? Illustrate your answer taking biofuels as an example.
Paper and question: Paper I, Q3(b)
Approach: Agree: explain why biofuels are considered green, then show the hidden environmental and social costs (land-use change and carbon debt, food versus fuel, water, biodiversity), with examples including India's policy, and conclude with conditions for genuinely green bioenergy.
Yes. 'Green' energy is judged by its life-cycle impact, not just by emissions at the point of use. Biofuels (ethanol from sugarcane or maize, biodiesel from palm oil or jatropha) are considered green because the carbon released when they burn was absorbed by the plants as they grew, and they reduce oil imports.
Why they are not always green: (i) land-use change: clearing forests, peatlands or grasslands to grow biofuel crops releases large stored carbon; Searchinger and co-authors (2008) and Fargione and co-authors (2008) showed that this 'carbon debt' can make some biofuels worse than petrol for decades, as with palm oil on drained peat in Indonesia; (ii) food versus fuel: diverting maize and other crops to fuel contributed to the 2007–08 food price spike, hurting the poor; (iii) water: sugarcane-based ethanol is water-intensive, a concern in drought-prone Maharashtra.
India's experience shows both sides: the jatropha-based biodiesel push of the 2000s largely failed, while ethanol blending under the National Policy on Biofuels (2018) cut oil imports but raised concerns over diverting sugarcane, rice and maize and over water use.
Making them green: second-generation fuels from crop residues and waste, compressed biogas from organic waste, sustainability certification and avoiding conversion of forests and food land.
Hence biofuels are green only when produced from wastes or surplus land with low inputs; otherwise 'green' energy can raise net emissions and harm food security.
Example 50 (UPSC 2020, 10 marks): Discuss the issue of compatibility between international trade and environment sustainability.
Paper and question: Paper I, Q5(c)
Approach: Show both sides: trade can harm the environment (scale effect, pollution havens, transport emissions) or help it (composition and technique effects, diffusion of clean technology), then discuss WTO rules and border measures.
Grossman and Krueger (1991) decomposed the environmental effect of trade into a scale effect (more output, more pollution), a composition effect (specialisation according to comparative advantage) and a technique effect (higher income and access to cleaner technology reduce pollution per unit).
Conflict: trade expands output and transport emissions; under the pollution haven hypothesis, dirty industries move to countries with lax regulation, a 'race to the bottom'; and trade in timber, fish and wildlife can accelerate depletion.
Compatibility: trade spreads clean technologies such as solar panels, raises incomes that increase demand for environmental quality, and allows production where it is most resource-efficient.
WTO rules permit environmental measures under Article XX if they are non-discriminatory (Shrimp-Turtle case, 1998). Border carbon adjustments such as the EU's CBAM (definitive from 2026) raise concerns of green protectionism for developing countries. Compatibility therefore requires environmental policy, not trade restriction, as the first-best response.
Example 51 (UPSC 2019, 10 marks): How does 'carbon trading' help in reducing environment degradation?
Paper and question: Paper I, Q1(c)
Approach: Define cap and trade, explain the two channels (fixed cap; least-cost abatement through trading) and the innovation incentive, with examples and limits.
Carbon trading is a market-based instrument in which the regulator fixes the total permissible emissions (the cap), distributes or auctions tradable permits equal to it, and lets firms trade them. It applies Coase's insight that well-defined, transferable rights can internalise an externality.
How it helps: the cap guarantees the quantity of emissions; trading shifts abatement to firms that can cut emissions most cheaply, so the target is met at minimum total cost, since every firm abates until its marginal abatement cost equals the permit price; and the permit price rewards innovation and fuel switching, because each tonne saved can be sold.
International versions include the Kyoto Protocol's Clean Development Mechanism, under which Indian projects earned certified emission reductions, and the EU Emissions Trading System (2005). India's Perform, Achieve and Trade scheme (2012) trades energy-saving certificates.
Its success depends on a tight cap, accurate monitoring and stable prices.
Example 52 (UPSC 2019, 15 marks): 'Tragedy of the commons' leads to over-exploitation of resources. Analyze.
Paper and question: Paper I, Q2(a)
Approach: Explain Hardin's tragedy of the commons (rivalry plus non-excludability), show over-exploitation with the open-access fishery model and diagram, give examples, then remedies including Ostrom's critique.
Garrett Hardin ('The Tragedy of the Commons', 1968) argued that when a resource is rival in use but non-excludable, each user captures the full benefit of extra use but bears only a fraction of the cost of depletion, so rational individuals together destroy the resource. His example was herders adding cattle to a common pasture.
Mechanism: under open access, users enter until average revenue equals marginal cost, ignoring the stock externality they impose on others. Each user's extra catch reduces the stock and so raises everyone else's cost of fishing. H. Scott Gordon (1954) showed for fisheries that rent is fully dissipated.
Diagram: fishing effort on the horizontal axis; total revenue as an inverted U (from the biological yield curve) and total cost as a straight line from the origin; the efficient effort is where the slopes are equal (maximum rent); open access pushes effort to where TR = TC, beyond the efficient level and often beyond maximum sustainable yield.
Illustrations: collapse of the Newfoundland cod fishery (1992), groundwater depletion in north-west India, overgrazing of village commons, and the atmosphere as a free dump for greenhouse gases.
Remedies: private or state property rights, quotas and tradable permits (individual transferable quotas), taxes and licences. Elinor Ostrom (Governing the Commons, 1990; Nobel 2009) showed that communities often manage commons sustainably through local rules, monitoring and sanctions, as with Joint Forest Management in India; the tragedy is of open access, not of common property.
Example 53 (UPSC 2018, 15 marks): How does rural economic activity create environmental degradation in developing economies?
Paper and question: Paper I, Q8(b)
Approach: Explain the main rural activities that degrade the environment (agricultural intensification, deforestation and fuelwood, overgrazing, shifting cultivation, stubble burning, groundwater use) and the underlying causes (poverty, open access, perverse incentives), with Indian examples.
In developing economies most people depend directly on land, water, forests and pastures, so rural activity is a major source of environmental degradation as well as its main victim.
Activities: (i) intensive agriculture: excessive use of urea and pesticides degrades soil and pollutes water, and canal irrigation without drainage causes waterlogging and salinity; (ii) groundwater over-extraction encouraged by free power, making many blocks in Punjab, Haryana and Rajasthan over-exploited; (iii) stubble burning of rice residue in Punjab and Haryana, worsening winter air pollution in north India; (iv) deforestation for cultivation and fuelwood, as most poor households still depend on biomass fuel; (v) overgrazing and degradation of common lands; (vi) shifting cultivation (jhum) with shortened cycles in the north-east, causing soil erosion; (vii) sand and stone mining and brick kilns.
Underlying causes: the poverty-environment nexus: poor households with short horizons and no credit mine natural capital to survive (Partha Dasgupta); open access and the erosion of traditional common property management, documented by N.S. Jodha (1986) for dry regions of India; perverse subsidies on power, water and fertiliser and MSP biased towards rice and wheat; population pressure; and insecure tenure that discourages soil conservation.
Remedies include secure rights, community management, crop diversification, pricing of power and water, and residue-management incentives.
Example 54 (UPSC 2018, 20 marks): What policies would you suggest to combat negative environmental externalities?
Paper and question: Paper I, Q8(c)
Approach: Define negative externality with the MSC-MPC diagram, then suggest policies: Pigouvian taxes, tradable permits, Coasian bargaining, command-and-control, subsidies for abatement, liability and information, compare them and give Indian examples.
A negative externality arises when production or consumption imposes costs on third parties that are not reflected in prices, as with pollution. Marginal social cost (MSC) then exceeds marginal private cost (MPC), and the market over-produces.
Diagram: demand (marginal social benefit) falling; MPC and a higher MSC rising; the market produces Qm where demand meets MPC, above the efficient Q* where demand meets MSC; the triangle between MSC and demand from Q* to Qm is the welfare loss; a tax equal to the marginal external cost at Q* shifts MPC up to pass through the efficient point.
Policies: (i) Pigouvian tax (Pigou, 1920) equal to the marginal external damage, such as carbon taxes or India's coal cess (2010, later merged into the GST compensation cess); it gives a continuing incentive to abate but requires knowledge of damage. (ii) Tradable permits (cap and trade) fix the quantity and achieve it at least cost. (iii) Coasian bargaining (Coase, 1960): with clear property rights and low transaction costs, parties negotiate the efficient outcome; useful for small-number cases only. (iv) Command-and-control standards, such as Bharat Stage VI vehicle norms (2020), are simple and certain but not cost-effective. (v) Subsidies for clean technology, such as solar pumps and electric vehicles (FAME, 2015). (vi) Liability rules and courts, such as the polluter-pays principle applied by the National Green Tribunal (2010). (vii) Information disclosure and labelling.
Taxes and permits are generally more efficient than standards (Baumol and Oates), but with uncertainty about costs, Weitzman (1974) showed that the choice between price and quantity instruments depends on the relative slopes of marginal damage and abatement cost curves.
A mix suited to the pollutant, monitoring capacity and equity concerns works best, with revenues used to compensate poor households.
Example 55 (UPSC 2017, 15 marks): "The trade-off between environment and development remains unresolved." Comment in view of the United States exiting from Paris Climate Agreement.
Paper and question: Paper I, Q8(b)
Approach: Comment: explain the environment-development trade-off and the North-South dimension (equity, CBDR), show how the US exit from the Paris Agreement (announced June 2017) reflected that the trade-off is unresolved, then argue it can be reconciled.
The trade-off holds that protecting the environment imposes costs on growth: cutting emissions means costlier energy, slower industrial expansion and job losses in coal and heavy industry. Developing countries add an equity argument: the rich industrialised with fossil fuels and bear historical responsibility, so the poor should not be denied the same path, the principle of common but differentiated responsibilities (CBDR) in the UNFCCC (1992).
On 1 June 2017 President Trump announced US withdrawal from the Paris Agreement (2015), arguing that it would cost American jobs and favour China and India. The exit of the largest historical emitter showed that even rich countries see climate action as a threat to growth, weakened climate finance pledges and created a free-rider problem; the withdrawal took effect in November 2020 (the US rejoined in 2021 and announced withdrawal again in 2025).
Yet the trade-off is not inevitable. Clean energy costs have fallen sharply, green technologies create industries and jobs, and climate damage itself reduces growth. Many US states and firms continued their commitments, and India pursued solar expansion and the International Solar Alliance (2015).
Hence the trade-off remains unresolved politically, because costs fall now and on specific groups while benefits are global and long-term; resolving it requires finance, technology transfer and just transitions.
Example 56 (UPSC 2016, 15 marks): Illustrate the notion of perverse subsidy in the context of natural resource sector.
Paper and question: Paper I, Q4(b)
Approach: Define perverse subsidies (Myers and Kent), then illustrate them in natural-resource sectors (water and power for irrigation, fertiliser, fisheries, fossil fuels, forestry, mining), with the mechanism and Indian examples, and suggest reform.
Perverse subsidies (Norman Myers and Jennifer Kent, 2001) are subsidies that harm both the economy and the environment: they lower the private cost of using a resource below its social cost, encouraging over-use and depletion.
Illustrations: (i) irrigation power and water: free or flat-rate electricity and canal water priced far below cost in India encourage over-pumping and water-intensive crops; groundwater tables have fallen sharply in Punjab and Haryana, and the zero marginal cost removes any incentive to save water; (ii) fertiliser: the much larger subsidy on urea than on phosphate and potash has distorted the N:P:K ratio, degrading soils and polluting water; (iii) fisheries: fuel and boat subsidies expand fleets beyond sustainable catch, which the WTO's 2022 Agreement on Fisheries Subsidies seeks to curb; (iv) fossil fuels: consumer subsidies on diesel, kerosene and LPG encourage consumption and emissions; (v) forests and minerals: royalties set below scarcity value and cheap leases accelerate extraction.
Diagram: a subsidy shifts the private cost of the resource down below marginal social cost, raising use from the efficient level to a higher level; the gap is over-exploitation.
Reform involves pricing resources closer to cost, replacing input subsidies with direct income support, metering power and water, and redirecting savings to conservation, as attempted through solar pumps under PM-KUSUM and Punjab's 'Paani Bachao, Paisa Kamao' pilot.
Example 57 (UPSC 2016, 15 marks): "Pollution-income progression of agrarian communities (clean) to industrial economies (pollution intensive) to service economies (cleaner) would appear to be false if pollution increases again at the end due to higher levels of income and consumption of the people at large." Discuss.
Paper and question: Paper I, Q8(b)
Approach: Explain the EKC (clean agrarian, dirty industrial, cleaner service stages), then show why it may be N-shaped (re-linking through rising consumption, scale effects, carbon, displacement of pollution), with evidence, and conclude.
The statement describes the environmental Kuznets curve (Grossman and Krueger, 1991): pollution rises as an agrarian economy industrialises, then falls as the economy shifts to services, adopts cleaner technology and demands environmental quality, giving an inverted U.
But the progression would be false if pollution rises again at high incomes, making the curve N-shaped. De Bruyn and Opschoor (1997) found such 're-linking' for several rich countries. Reasons: (i) once cheap technical improvements are exhausted, the scale effect of ever-higher output and consumption dominates again; (ii) the rebound effect: efficiency lowers costs and raises use, as with cars, air travel and electronics; (iii) services are not 'weightless': data centres, transport and tourism consume energy; (iv) consumption-based accounting shows rich countries outsourcing pollution to manufacturing exporters, so territorial declines overstate improvement; (v) global pollutants such as carbon dioxide and waste have never followed the inverted U.
Diagram: pollution against income per head: rising, falling after the first turning point, then rising again at very high incomes, an N shape.
Hence the clean-dirty-clean sequence is not automatic; sustained decline needs continuing policy, such as carbon pricing, efficiency standards and sustainable consumption, rather than reliance on income growth.
Example 58 (UPSC 2015, 10 marks): How does carbon trading help in reducing environmental degradation?
Paper and question: Paper I, Q5(c)
Approach: Explain how carbon trading works (cap, permits, trading), why it is cost-effective, the Kyoto mechanisms of the time, and its limits.
Carbon trading puts a price on greenhouse gas emissions by creating a market in the right to emit. Under cap and trade, a government sets a limit on total emissions and issues permits; firms that emit less than their allowance can sell the surplus to firms that emit more.
It reduces degradation because the cap limits total emissions, while trading ensures that cuts are made where they are cheapest, equalising marginal abatement costs, so a given reduction is achieved at the lowest cost to society. The price signal also encourages investment in energy efficiency and renewables.
The Kyoto Protocol (1997) created three market mechanisms: international emissions trading among developed countries, Joint Implementation, and the Clean Development Mechanism (CDM), under which projects in developing countries such as India earned tradable credits. The EU Emissions Trading System, begun in 2005, is the largest.
Limitations: generous free allocation led to low prices in the EU, and some CDM credits were of doubtful additionality.
Example 59 (UPSC 2015, 10 marks): What do you mean by 'green accounting'? Discuss how this concept can be incorporated in national income accounting.
Paper and question: Paper I, Q8(a)
Approach: Define green accounting and explain how environmental depletion and degradation can be incorporated into national accounts (SEEA satellite accounts, EDP, genuine savings), with India's initiatives.
Green accounting adjusts national accounts for the use of natural capital and environmental damage, which conventional GDP ignores or even counts as income (for example, timber from deforestation).
Incorporation: (i) the UN's System of Environmental-Economic Accounting (SEEA, 1993; Central Framework adopted as a statistical standard in 2012) builds satellite accounts in physical and monetary terms for minerals, energy, water, forests and emissions alongside the national accounts; (ii) Environmentally adjusted Domestic Product: EDP = NDP − depletion of natural resources (valued by resource rent) − cost of degradation (damage or abatement cost); (iii) the World Bank's adjusted net (genuine) savings subtracts resource depletion and pollution damage from net saving and adds education spending.
In India, an expert group chaired by Partha Dasgupta (report 2013) proposed a framework for green national accounts, and MoSPI publishes environmental accounts in its EnviStats series.
Valuation of non-market damage remains the main difficulty.
Example 60 (UPSC 2015, 20 marks): Discuss the role of renewable energy resources in order to maintain environmental sustainability with special reference to India.
Paper and question: Paper I, Q8(b)
Approach: Explain how renewable energy supports environmental sustainability, then India's resource potential, policies and targets as of 2015 (National Solar Mission, 175 GW, INDC, ISA) with later progress, and the challenges.
Environmental sustainability requires that resource use stays within regeneration and absorption limits. Fossil fuels are finite and the main source of carbon dioxide and local air pollution; renewable energy (solar, wind, small hydro, biomass) draws on natural flows and emits little.
Role: renewables cut greenhouse gas emissions and urban air pollution, conserve coal and oil for future generations, reduce water use in thermal plants, improve energy security for an economy that imports most of its oil, and can bring electricity to remote villages through decentralised mini-grids and solar pumps.
India's position (2015): India has large solar potential and substantial wind potential in Tamil Nadu, Gujarat and other states. The Jawaharlal Nehru National Solar Mission (2010) targeted 20 GW of solar by 2022; in 2015 the government raised the renewable target to 175 GW by 2022 (100 GW solar, 60 GW wind, 10 GW biomass, 5 GW small hydro). India's INDC (October 2015) pledged to reduce the emissions intensity of GDP by 33–35% below 2005 levels by 2030 and to raise non-fossil power capacity to 40%. India and France launched the International Solar Alliance at COP21 in November 2015.
Later progress: the 40% non-fossil capacity target was met in 2021, the updated NDC (2022) raised it to 50% by 2030, a level reached in 2025, and the target is now 500 GW of non-fossil capacity by 2030.
Challenges: intermittency and the need for storage and grid integration; financially weak distribution companies; land acquisition; dependence on imported solar cells and modules; and the continued role of coal for base load. Addressing these through storage, green hydrogen, domestic manufacturing (production-linked incentives) and discom reform is key to making India's growth environmentally sustainable.
Example 61 (UPSC 2015, 20 marks): "Global warming will certainly increase the cry of the earth and the cry of the poor." In this context, examine the international efforts to reduce global warming.
Paper and question: Paper I, Q8(c)
Approach: Explain the statement (global warming hurts the planet and the poor most; Laudato Si', 2015), then examine international efforts from the UNFCCC (1992) through Kyoto, Copenhagen and Cancun to the Paris negotiations of 2015, assessing their achievements and limits.
The phrase 'the cry of the earth and the cry of the poor' comes from Pope Francis's encyclical Laudato Si' (2015). Global warming damages ecosystems through rising temperatures, sea-level rise and extreme weather, and its burden falls most on the poor, who depend on agriculture and natural resources, live in vulnerable areas and have little capacity to adapt, although they contributed least to emissions.
International efforts: (i) the UNFCCC (Rio, 1992) set the goal of stabilising greenhouse gas concentrations and the principle of common but differentiated responsibilities; (ii) the Kyoto Protocol (1997, in force 2005) set binding targets for developed countries (about 5% below 1990 levels in 2008–12) with market mechanisms such as the CDM, but the US never ratified it and developing countries had no obligations; (iii) the Copenhagen Accord (2009) recognised the 2°C limit and a pledge of 100 billion dollars a year of climate finance by 2020; (iv) Cancun (2010) created the Green Climate Fund; (v) the Durban Platform (2011) launched talks for a universal agreement, leading to the Paris Agreement of December 2015, under which all countries submit nationally determined contributions, with the goal of keeping warming well below 2°C and pursuing 1.5°C.
Assessment: these efforts built a framework, raised awareness and mobilised some finance and technology, and Paris achieved near-universal participation. But emissions continued to rise, targets were voluntary or weakly enforced, finance fell short of pledges, and adaptation and loss and damage for poor countries received little support.
Hence international efforts have not yet answered the cry of the poor: equity, finance and technology transfer, along with domestic action such as India's National Action Plan on Climate Change (2008), are needed to make climate policy both effective and just.
Example 62 (UPSC 2014, 10 marks): Can Kuznets' hypothesis of inverted-U curve be extended to environmental degradation? Explain.
Paper and question: Paper I, Q5(b)
Approach: Explain the extension of Kuznets's inverted U to pollution (the environmental Kuznets curve), its mechanisms and diagram, and its limitations.
Yes, with qualifications. Kuznets's inverted U related inequality to income; Grossman and Krueger (1991), studying the environmental effects of NAFTA, found a similar pattern for pollutants such as sulphur dioxide and smoke: environmental degradation rises with income per head in early development and falls after a turning point. This is the environmental Kuznets curve.
It reflects the scale effect of industrialisation at first, then the composition effect of a shift to services and the technique effect of cleaner technology and stronger regulation demanded by richer citizens.
Diagram: pollution against income per head, an inverted U.
Limits: it does not hold for carbon dioxide, waste or biodiversity; it may reflect relocation of dirty industries to poorer countries; some damage is irreversible; and the turning point depends on policy, so developing countries such as India need not wait to grow rich before acting.
Mains points
- Environment questions dominate this chapter: know cap and trade versus Pigouvian taxes, the environmental Kuznets curve (Grossman and Krueger) and its N-shaped critique, the tragedy of the commons (Hardin, Ostrom) and green accounting (SEEA, EDP).
- Kuznets's inverted U is asked as theory and as evidence: give the mechanism, the cross-country support (Ahluwalia) and the contrary evidence (East Asia, rising inequality since 1980, Piketty).
- HDI questions reward exact methodology: three dimensions, goalposts, the geometric mean since 2010, the log of income, and the companion indices (IHDI, GDI, GII, MPI).
- Planning and PPP questions expect Tinbergen's targets and instruments, shadow prices (Little-Mirrlees, UNIDO), indicative planning, NITI Aayog and PPP models (BOT, HAM) with the Kelkar Committee (2015).
- Always close with a balanced judgement and, where possible, an Indian illustration with its year.
Did you know?
- Simon Kuznets, who built the inverted-U hypothesis in his 1955 presidential address to the American Economic Association, also warned the US Congress in 1934 that the welfare of a nation can scarcely be inferred from a measure of national income.
Economics Optional: All chapters
- Exam Pattern, Syllabus and Strategy
- Price Determination and Theories of Distribution
- Market Structures
- Welfare Economics
- Theories of Employment, Income and Interest
- Money and Monetary Management
- Public Finance
- Theories of International Trade
- Trade Policy, Protection and the WTO
- Balance of Payments and Exchange Rates
- Theories of Growth
- Economic Development
- Indian Economy in the Pre-Independence Era
- Planning in India
- Agriculture before Liberalisation
- Industry before Liberalisation
- National Income, Poverty and Inequality
- Agriculture after Liberalisation
- Industry after Liberalisation
- External Sector after Liberalisation
- Public Finance and Fiscal Federalism in India
- Monetary System and the RBI
- Employment, Wages and Poverty Alleviation