
Economics Optional · UPSC Notes
External Sector after Liberalisation — UPSC Economics Optional Notes
Free, exam-focused notes for UPSC Prelims and Mains, with Prelims tips and Mains points for every topic. 4 topics.
Open in the interactive reader: bookmarks, progress tracking and read-aloud.
India and TRIPS, TRIMs and GATS
The Uruguay Round brought three new areas into the WTO: TRIPS (intellectual property), TRIMs (investment measures that distort trade) and GATS (services). TRIPS forced India to introduce product patents for medicines from 2005, which it balanced with Section 3(d) and compulsory licensing. TRIMs ended local content rules, while GATS opened services trade, where India's strengths lie in Mode 1 (IT exports) and Mode 4 (movement of professionals).
In simple words
TRIPS sets global rules for patents, copyrights and trademarks, so inventors can stop others copying for some years.
Think of a recipe owner who gets 20 years of exclusive rights; others can cook it only after that, unless the law allows exceptions.
For India this mattered most for medicines: patents can raise drug prices, so India's law blocks minor tweaks and allows compulsory licences; GATS and TRIMs cover services and investment rules.
UPSC asks how these agreements affect India's pharma, farming, services and policy space.
1. TRIPS: Concepts and Provisions
Agreement on Trade-Related Aspects of Intellectual Property Rights (1995): sets minimum standards that all WTO members must provide, enforced through the WTO dispute settlement system.
Patents (Article 27–33): available for products and processes in all fields of technology, for at least 20 years from filing, subject to novelty, inventive step and industrial application.
Other IPRs: copyright (life plus 50 years minimum), trademarks, geographical indications (extra protection for wines and spirits under Article 23), industrial designs, layout designs of integrated circuits and undisclosed information (trade secrets and test data, Article 39).
Plant varieties (Article 27.3(b)): members must protect plant varieties by patents or an effective sui generis system; India chose the Protection of Plant Varieties and Farmers' Rights Act, 2001, which keeps farmers' rights to save and sell seed (not branded).
Flexibilities: compulsory licences (Article 31), parallel imports through exhaustion rules (Article 6), exceptions (Article 30) and the freedom to define patentability criteria.
Transition periods: developing countries had until 2000, and until 1 January 2005 for product patents in fields like pharmaceuticals, with a 'mailbox' for applications and exclusive marketing rights in between.
Economic logic: patents give a temporary monopoly to reward innovation (Arrow, 1962, on the under-supply of knowledge; Nordhaus, 1969, on optimal patent life), at the cost of higher prices and deadweight loss.
2. India's Implementation of TRIPS
Patents Act, 1970: allowed only process patents for food, drugs and chemicals, enabling Indian firms to reverse-engineer and build a generic drug industry.
Amendments: the Patents (Amendment) Acts of 1999 (mailbox and EMR), 2002 (20-year term, other changes) and 2005 (product patents in all fields) brought the law into TRIPS compliance.
Section 3(d): new forms of a known substance are not patentable unless they show significantly enhanced efficacy, to prevent 'evergreening'.
Novartis vs Union of India (April 2013): the Supreme Court upheld the rejection of a patent for the beta-crystalline form of imatinib mesylate (Glivec), affirming Section 3(d).
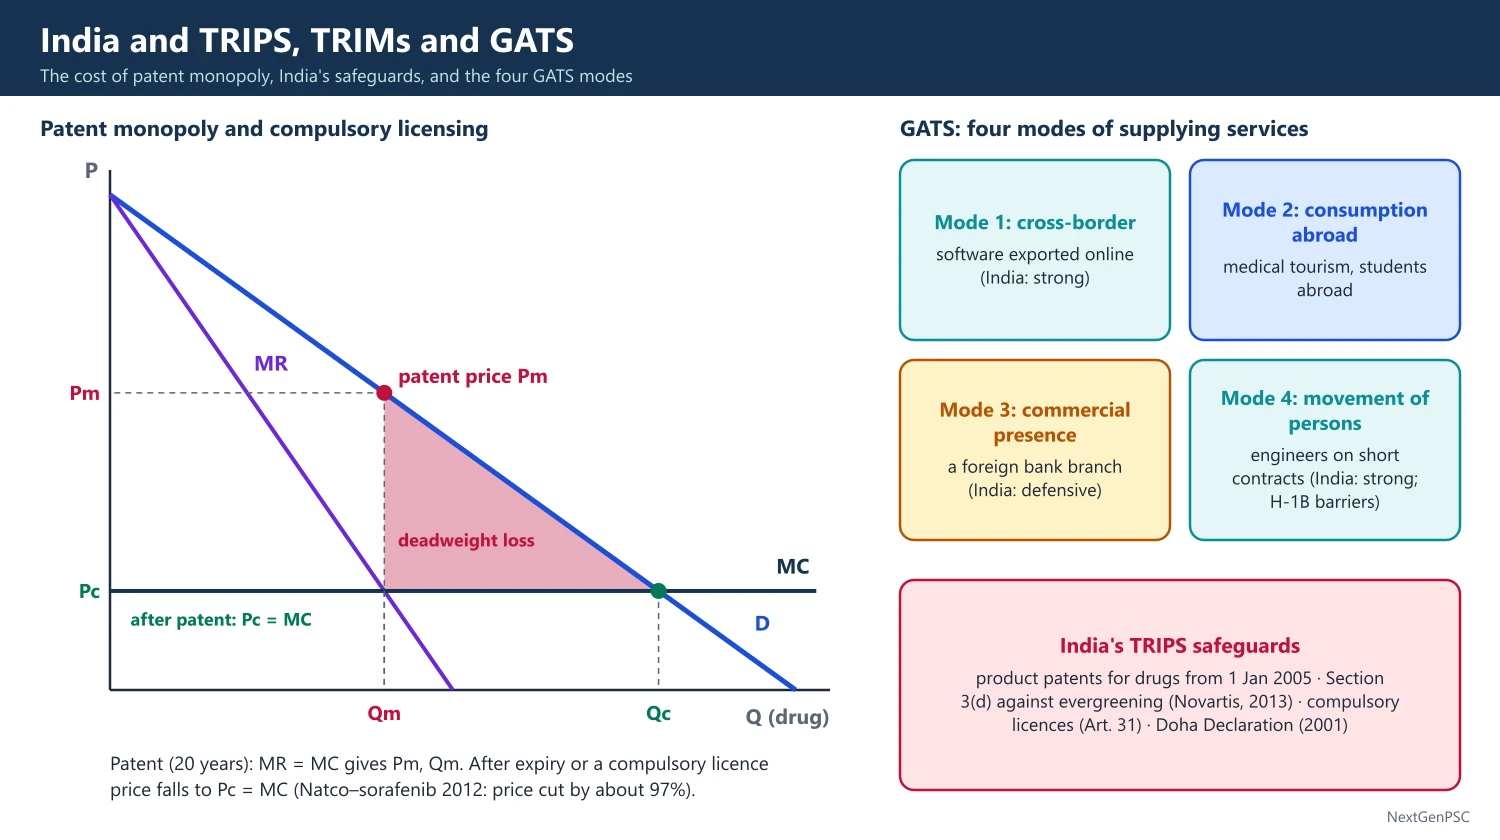
Compulsory licence: in March 2012 the Controller of Patents granted India's first compulsory licence to Natco for Bayer's cancer drug sorafenib (Nexavar), cutting the price by about 97%; the order was upheld on appeal.
Pre- and post-grant opposition: allows third parties (including patient groups) to challenge patents.
Other laws: Geographical Indications of Goods Act, 1999 (Darjeeling tea was the first GI, 2004–05), Biological Diversity Act, 2002 and the National IPR Policy (2016).
Doha Declaration on TRIPS and Public Health (2001): affirmed that TRIPS should be interpreted to protect public health; the 2003 decision and Article 31bis (in force January 2017) allow export of compulsorily licensed medicines to countries without manufacturing capacity.
COVID-19 waiver: India and South Africa proposed a broad TRIPS waiver (October 2020); MC12 (June 2022) agreed a narrower waiver for vaccine patents.
Traditional knowledge: India fought patents on turmeric (US patent revoked 1997), neem and basmati; it built the Traditional Knowledge Digital Library (2001); WIPO adopted a treaty on IP, genetic resources and associated traditional knowledge in May 2024 requiring disclosure of origin in patent applications.
3. TRIMs
Agreement on Trade-Related Investment Measures (1995): prohibits investment measures inconsistent with GATT Article III (national treatment) and Article XI (quantitative restrictions).
Illustrative list: local content requirements, trade-balancing requirements (imports linked to exports), foreign exchange balancing and restrictions on exports linked to local production.
India's adjustments: India phased out dividend balancing and local content conditions on foreign investors in consumer goods and autos.
India — Autos (2002): the WTO ruled that the indigenisation and trade-balancing conditions in India's 1997 Public Notice 60 MoUs for carmakers violated GATT.
India — Solar (DS456, 2016): the Appellate Body ruled that domestic content requirements in the Jawaharlal Nehru National Solar Mission violated national treatment; India shifted to other support (PLI for solar modules, ALMM list).
Policy space debate: developing countries argue TRIMs removes tools that East Asian countries used to build industries (Chang, Kicking Away the Ladder, 2002); supporters say local content raises costs.
4. GATS
General Agreement on Trade in Services (1995): covers all services except those supplied in the exercise of governmental authority.
Four modes of supply: Mode 1 cross-border supply (software exported online), Mode 2 consumption abroad (medical tourism, students abroad), Mode 3 commercial presence (a foreign bank branch) and Mode 4 presence of natural persons (engineers on short-term contracts).
Obligations: MFN applies generally; market access and national treatment apply only in sectors each member lists in its schedule (positive list approach), allowing gradual liberalisation.
India's interests: offensive in Modes 1 and 4 (IT, professional services) and defensive in Mode 3 in sensitive sectors (retail, legal services, insurance until recently).
Services exports: India's services exports were about 387 billion US dollars in 2024–25 and rose further in 2025–26 (RBI balance of payments data), with a large surplus that offsets part of the goods deficit.
Mode 4 barriers: visa restrictions such as US H-1B caps and fees, social security contributions without totalisation agreements, and recognition of qualifications.
E-commerce link: the WTO moratorium on customs duties on electronic transmissions (1998 onward) lapsed at MC14 in March 2026; India had argued it cost developing countries tariff revenue.
5. Diagrams to Draw
Patent monopoly diagram: draw demand and MR for a drug with constant MC; the patent holder sets MR = MC at price Pm and output Qm; after patent expiry or a compulsory licence, price falls to Pc = MC and output rises to Qc; shade the deadweight loss during the patent life and the consumer surplus gained afterwards.
Innovation trade-off: draw a curve showing innovation rising with patent length at a falling rate and a deadweight loss line rising with patent length; the optimum patent life is where marginal benefit equals marginal cost (Nordhaus).
GATS modes chart: draw a 2×2 grid showing where the supplier and consumer are located for each mode with an Indian example.
6. Theory and Debates
Innovation vs access: supporters argue strong IPR encourages R and D and FDI; critics like Stiglitz and Baker argue that TRIPS transfers rents from poor to rich countries and that patents are not the only way to fund innovation.
North-South: most patents are held by firms in rich countries, so stronger IPR raises royalty payments by developing countries (World Bank estimates in the 2000s).
India's pharma outcome: the generic industry survived and grew (India supplies a large share of generics to the US and of medicines to Africa), helped by TRIPS flexibilities; Indian firms also increased R and D.
TRIPS-plus pressure: FTAs and special reports such as the US Special 301 list push for data exclusivity and patent term extensions, which India has resisted.
7. Using It in the Exam
10-mark answer: define TRIPS, TRIMs and GATS in one line each and give one Indian implication each.
15/20-mark answer: discuss TRIPS and pharma (Section 3(d), Novartis 2013, Natco 2012, Doha 2001), TRIMs disputes (autos, solar), GATS modes and India's Mode 1 and 4 interests, with a patent monopoly diagram.
Keywords: product patent, evergreening, Section 3(d), compulsory licence, Doha Declaration, local content, national treatment, Mode 4, positive list.
Quotable line: the Doha Declaration's statement that TRIPS does not and should not prevent members from taking measures to protect public health (paraphrased).
| Agreement | Covers | Key rule | Indian implication |
|---|---|---|---|
| TRIPS | Intellectual property | Product and process patents, 20 years; minimum standards | Product patents for drugs from 2005; Section 3(d); compulsory licences |
| TRIMs | Investment measures affecting trade | No local content or trade-balancing rules | Lost autos (2002) and solar (2016) cases; shift to PLI |
| GATS | Trade in services | Four modes; positive-list commitments | Gains in Mode 1 IT exports; Mode 4 visa barriers |
Mains points
- Define each agreement precisely and give one Indian case for each (Novartis/Natco; autos/solar; Mode 1/Mode 4).
- Explain how India used TRIPS flexibilities to protect its generic industry and public health.
- Draw the patent monopoly diagram to show the access-innovation trade-off.
- Mention traditional knowledge, PPVFR Act 2001 and the 2024 WIPO treaty.
- For GATS, link India's services surplus to Modes 1 and 4 and discuss visa barriers.
- Common mistake: saying TRIPS banned compulsory licensing; it allows them under Article 31.
Did you know?
- Memory trick for GATS modes: 'C-C-C-P' — Cross-border, Consumption abroad, Commercial presence, Presence of persons.
- Natco's compulsory licence cut the monthly price of sorafenib from about ₹2.8 lakh to under ₹9,000.
EXIM and Foreign Trade Policy
India's trade regime moved from import licensing and high tariffs to a liberal regime after 1991: EXIM policies (1992–97, 1997–2002) removed most licences, quantitative restrictions ended in 2001 and peak tariffs fell from 150% to about 10% for non-farm goods by 2007–08. Renamed the Foreign Trade Policy in 2004, it is now governed by FTP 2023, which has no end date and targets 2 trillion US dollars of exports by 2030.
In simple words
The Foreign Trade Policy is the government's rulebook for exports and imports: what can be traded, on what terms and with what support.
It is like the rules of a market gate: who may enter, what fee they pay and what help sellers get.
Before 1991 India restricted imports heavily; after 1991 it opened up, cut tariffs and moved from cash subsidies to tax refunds that fit WTO rules.
UPSC asks about the evolution of trade policy, FTP 2023 and export performance.
1. Pre-1991 Trade Regime
Import controls: the Imports and Exports (Control) Act, 1947 created a licensing system; imports were classified as banned, restricted, limited permissible or Open General Licence (OGL).
Export pessimism: planners expected little gain from exports, following Prebisch-Singer and Nurkse; exports stagnated at around 0.5% of world trade by the 1980s.
Export incentives: cash compensatory support (CCS), replenishment (REP) licences and duty drawback tried to offset an overvalued rupee and high input costs.
Committees: Mudaliar Committee (1962), Alexander Committee (1978) on import-export policy, Tandon Committee (1980) on export strategy and Abid Hussain Committee (1984) on trade policy recommended gradual liberalisation.
First three-year EXIM policy (1985–88): expanded OGL and simplified procedures, a first step towards medium-term trade policy.
2. Trade Reforms of 1991 and EXIM Policies
July 1991: the rupee was devalued in two steps (about 18–19% against the dollar), CCS was abolished, and tradeable Exim scrips gave exporters import rights linked to exports.
LERMS (March 1992): the Liberalised Exchange Rate Management System allowed exporters to sell 60% of earnings at the market rate; the rate was unified in March 1993.
EXIM Policy 1992–97: the first five-year policy moved to a negative list for imports; most capital goods and intermediates became freely importable.
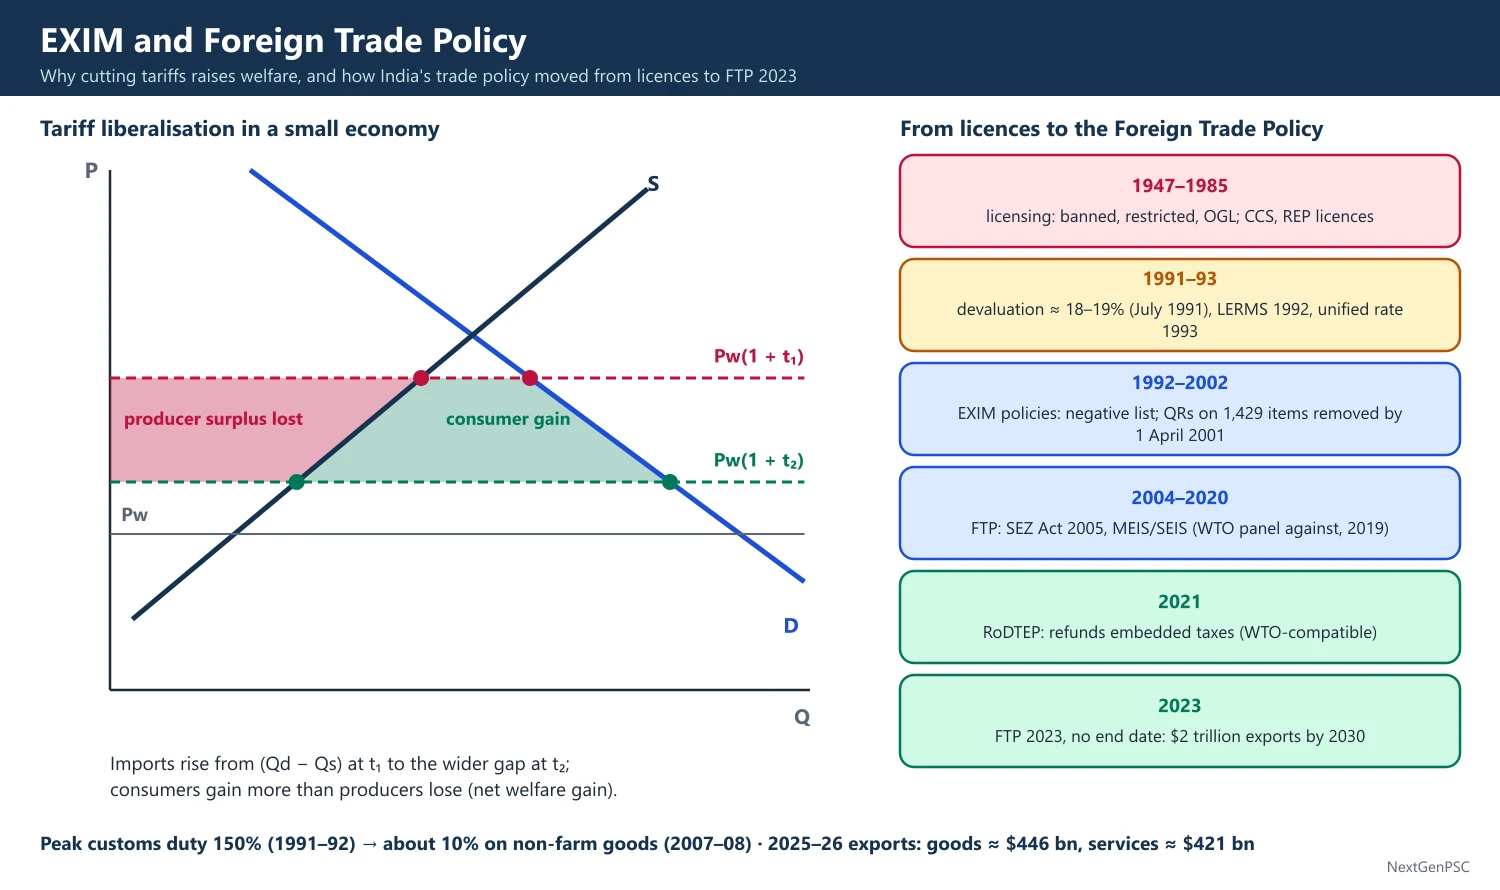
EXIM Policy 1997–2002: continued liberalisation; quantitative restrictions on 1,429 consumer and farm items were removed by 1 April 2001 after India lost a WTO case brought by the US (balance of payments justification rejected, 1999).
Tariff cuts: the peak customs duty fell from 150% (1991–92) to about 10% on non-agricultural goods by 2007–08, following the Chelliah Committee's direction; the average applied tariff fell sharply.
Rupee convertibility: current account convertibility from August 1994 removed exchange restrictions on trade.
3. Foreign Trade Policies 2004–2023
FTP 2004–09: renamed EXIM policy; aimed to double India's share of world merchandise trade to 1.5% by 2009; introduced Vishesh Krishi Upaj Yojana, Served from India scheme and the SEZ framework (SEZ Act, 2005).
FTP 2009–14: responded to the global financial crisis with market and product diversification (Focus Market and Focus Product schemes).
FTP 2015–20: merged schemes into the Merchandise Exports from India Scheme (MEIS) and Services Exports from India Scheme (SEIS); it was extended to March 2023 because of COVID-19.
WTO challenge: the US challenged MEIS, EOU, SEZ and EPCG export subsidies (DS541); the panel ruled against India in October 2019; India appealed into the void.
RoDTEP (1 January 2021): Remission of Duties and Taxes on Exported Products refunds embedded taxes not otherwise refunded (fuel duties, electricity duties, mandi tax), designed to be WTO-compatible; RoSCTL does the same for apparel and made-ups.
Other tools: Advance Authorisation (duty-free inputs for exports), EPCG (zero-duty capital goods with an export obligation of six times the duty saved within six years), Export Oriented Units (1981) and duty drawback.
4. Foreign Trade Policy 2023
Launch: announced on 31 March 2023, effective 1 April 2023, with no fixed end date so it can be updated as needed.
Target: total goods and services exports of 2 trillion US dollars by 2030.
Four pillars: incentive to remission, export promotion through collaboration (exporters, states, districts and Indian missions), ease of doing business and lower transaction costs, and emerging areas (e-commerce exports, SCOMET dual-use items, green exports).
Districts as Export Hubs: district export action plans to spread exports beyond major centres.
E-commerce exports: raised the courier export value limit and set up e-commerce export hubs.
Rupee trade: supports invoicing and settlement in rupees, following the RBI's July 2022 mechanism (Special Rupee Vostro Accounts).
Export Promotion Mission: approved by the Cabinet on 12 November 2025 with an outlay of ₹25,060 crore for 2025–26 to 2030–31, consolidating export support schemes such as interest equalisation and market access support.
5. Trade Performance and Agreements
Exports in 2025–26: merchandise exports of about 446 billion US dollars and services exports of about 421 billion dollars (RBI balance of payments data), with a large goods deficit and a growing services surplus.
Current account deficit: about 25.2 billion US dollars or 0.6% of GDP in 2025–26 (RBI, June 2026).
US tariffs: in August 2025 the US raised tariffs on most Indian goods to 50%, including a 25% penalty linked to India's purchases of Russian oil; India and the US continued talks on a bilateral trade agreement into 2026.
FTAs: India-UAE CEPA (in force May 2022), India-Australia ECTA (December 2022), India-EFTA TEPA (in force 1 October 2025), India-UK CETA (signed July 2025) and the conclusion of India-EU negotiations announced in January 2026.
RCEP: India withdrew from RCEP negotiations in November 2019, citing concerns about Chinese imports and safeguards.
Export composition: petroleum products, engineering goods, electronics (especially smartphones), gems and jewellery, pharmaceuticals and chemicals lead; electronics was among the fastest growing categories in 2024–26.
6. Diagrams to Draw
Tariff liberalisation: draw domestic D and S with world price Pw; show the tariff-inclusive price falling from Pw(1 + t1) to Pw(1 + t2) after reform; mark the rise in imports, the fall in domestic producer surplus and the larger gain in consumer surplus.
Export subsidy (large exporter): show domestic price rising above the world price and the deadweight loss triangles; this explains why WTO bans export subsidies and why RoDTEP refunds only embedded taxes.
Trade balance chart: draw bars of goods exports and imports and a line for the services surplus from 2015–16 to 2025–26.
7. Theory and Debates
Export-led growth: the East Asian experience (Krueger, Bhagwati) supports outward orientation; India's 1991 reforms followed this view.
New protectionism debate: since 2018 India raised tariffs on electronics, toys and other goods to support domestic manufacturing; critics (e.g. Arvind Subramanian and Shoumitro Chatterjee, 2020) argue this harms export competitiveness.
FTA utilisation: India's FTA utilisation by exporters has been low and its trade deficits with FTA partners (ASEAN, Korea) widened, fuelling caution about new FTAs.
Rules of origin and quality: exporters face non-tariff barriers such as EU carbon border adjustment (CBAM, definitive phase from 2026) and sanitary standards.
8. Using It in the Exam
10-mark answer: list the main features of FTP 2023 and its target, with one line on RoDTEP.
15/20-mark answer: trace trade policy from licensing to EXIM to FTP, explain WTO-driven changes (QR removal 2001, MEIS to RoDTEP), assess performance with 2025–26 data, and discuss FTAs and tariffs.
Keywords: OGL, negative list, QR removal, tariff rationalisation, MEIS, RoDTEP, EPCG, FTP 2023, Districts as Export Hubs, CBAM.
Quotable line: the Bhagwati-Krueger view that outward-oriented trade regimes outperform inward-looking ones (paraphrased).
| Policy | Period | Key features |
|---|---|---|
| Licensing regime | 1947–1985 | Import licences, OGL, CCS and REP licences |
| First EXIM policy | 1985–88 | Three-year policy; OGL expansion |
| EXIM Policy | 1992–97, 1997–2002 | Negative list; QRs removed by 2001 |
| Foreign Trade Policy | 2004–09, 2009–14 | SEZ Act 2005; focus market and product schemes |
| FTP 2015–20 | 2015–2023 | MEIS and SEIS; challenged at WTO; RoDTEP from 2021 |
| FTP 2023 | From 1 April 2023, no end date | 2 trillion dollar export target by 2030; remission over incentives |
Mains points
- Present trade policy as phases: controls, 1991 shock therapy, EXIM policies, FTPs, FTP 2023.
- Explain WTO-driven changes: QR removal in 2001, MEIS replaced by RoDTEP in 2021.
- Quote recent trade data with year and source (RBI BoP 2025–26).
- Discuss FTAs, RCEP withdrawal and the 2025 US tariff shock for current relevance.
- Use the tariff diagram to show welfare gains of liberalisation.
- Common mistake: calling FTP 2023 a five-year policy; it has no end date.
Did you know?
- India's share of world merchandise exports fell to about 0.5% in the early 1980s and has recovered to under 2%, while its share of world services exports is over 4%.
Exchange Rate Regime and Rupee Convertibility
India moved from a fixed rupee (pegged to sterling, then a basket from 1975) to a market-determined exchange rate through LERMS (1992) and unification (1993). It accepted current account convertibility under IMF Article VIII in August 1994, while capital account convertibility has been introduced gradually after the Tarapore Committees (1997, 2006). The RBI runs a managed float, intervening to curb volatility.
In simple words
The exchange rate is the price of one currency in terms of another, for example how many rupees buy one US dollar.
Convertibility means you can freely swap rupees for dollars: for trade and travel (current account) or for buying foreign assets (capital account).
India lets the market set the rupee's value but the RBI steps in to stop sharp swings; it opened the current account fully in 1994 and the capital account step by step.
UPSC asks about the 1991–94 changes, convertibility and managing the rupee.
1. Concepts and Definitions
Nominal exchange rate: rupees per unit of foreign currency; a rise means depreciation of the rupee.
Real exchange rate: RER = e·P*/P, adjusting the nominal rate for relative prices; the RBI publishes 6- and 40-currency trade-weighted NEER and REER indices.
Regimes: fixed (peg), crawling peg, managed float (intervention without a declared target) and free float; the IMF classifies de facto regimes, and it reclassified India's regime as a 'stabilised arrangement' for December 2022 to October 2023 in its 2023 Article IV report, a view the RBI disputed.
Convertibility: the freedom to convert domestic currency into foreign currency at market rates; current account convertibility covers trade, services, income and transfers, while capital account convertibility covers assets and liabilities.
Article VIII of the IMF: members accepting it agree not to restrict payments for current international transactions.
2. Evolution of the Rupee Regime
1947–1971: the rupee was pegged to sterling within the Bretton Woods par value system; devaluations in 1949 (with sterling) and June 1966 (by about 36.5%) after war and drought.
September 1975: after Bretton Woods collapsed, the rupee was linked to an undisclosed basket of currencies, managed by the RBI.
1980s: gradual real depreciation to support exports; growing current account deficits and short-term debt.
1991 crisis: the Gulf War oil shock, falling remittances, political instability and a downgrade cut reserves to about 1 billion US dollars (roughly two weeks of imports); India pledged gold with the Bank of England and the Union Bank of Switzerland and took IMF support.
July 1991 devaluation: two steps on 1 and 3 July cut the rupee by about 18–19% against the dollar.
LERMS (March 1992): a dual exchange rate: 60% of foreign exchange earnings converted at the market rate and 40% at the official rate (for government imports such as oil and fertiliser).
Unified market rate (March 1993): the dual system ended and the rupee became market-determined, with RBI intervention.
Current account convertibility (20 August 1994): India accepted Article VIII obligations.
FEMA (1999, in force 2000): replaced FERA, treating foreign exchange violations as civil rather than criminal matters.
3. Capital Account Convertibility
Tarapore Committee I (1997): recommended full capital account convertibility in three years (by 1999–2000) subject to preconditions: gross fiscal deficit cut to 3.5% of GDP, inflation of 3–5%, gross NPAs of banks cut to 5%, CRR cut to 3% and adequate reserves; the East Asian crisis (1997) led to caution.
Tarapore Committee II (2006): set out a five-year roadmap in three phases to 2010–11 with fiscal and banking preconditions and a monitoring framework.
Gradual opening since: FDI liberalisation, FPI limits, external commercial borrowing (ECB) frameworks, rupee-denominated 'masala bonds' (2016), and the Fully Accessible Route for certain government securities (2020).
Liberalised Remittance Scheme (2004): residents can remit up to 250,000 US dollars a year (limit since 2015) for permitted current and capital account transactions.
Bond index inclusion: Indian government bonds joined the JP Morgan GBI-EM index from June 2024 and the Bloomberg EM local currency index from January 2025, bringing passive inflows.
Rupee internationalisation: the RBI's July 2022 mechanism for trade invoicing in rupees (Special Rupee Vostro Accounts) and the Inter-Departmental Group report on internationalisation (2023) aim to expand the rupee's use abroad.
4. The Current Regime and Recent Developments
RBI stance: no target or band for the rupee; intervention in spot, forward and futures markets to contain excessive volatility and disorderly movements.
Reserves: foreign exchange reserves rose to a peak above 700 billion US dollars in September 2024 and stood around 720 billion dollars in early 2026 (RBI data), enough for about 10–11 months of imports.
Rupee path: the rupee moved from about 45 per dollar in 2010–11 to about 83 in 2024, crossed 90 in December 2025 and hit record lows in 2026 amid high crude oil prices, US tariffs and portfolio outflows.
Current account: the CAD was about 0.6% of GDP in 2025–26 (RBI), modest by historical standards, supported by services exports and remittances.
Capital flows: net FDI was low in 2025–26, and FPI flows were volatile, making the capital account the main source of rupee pressure.
5. Diagrams to Draw
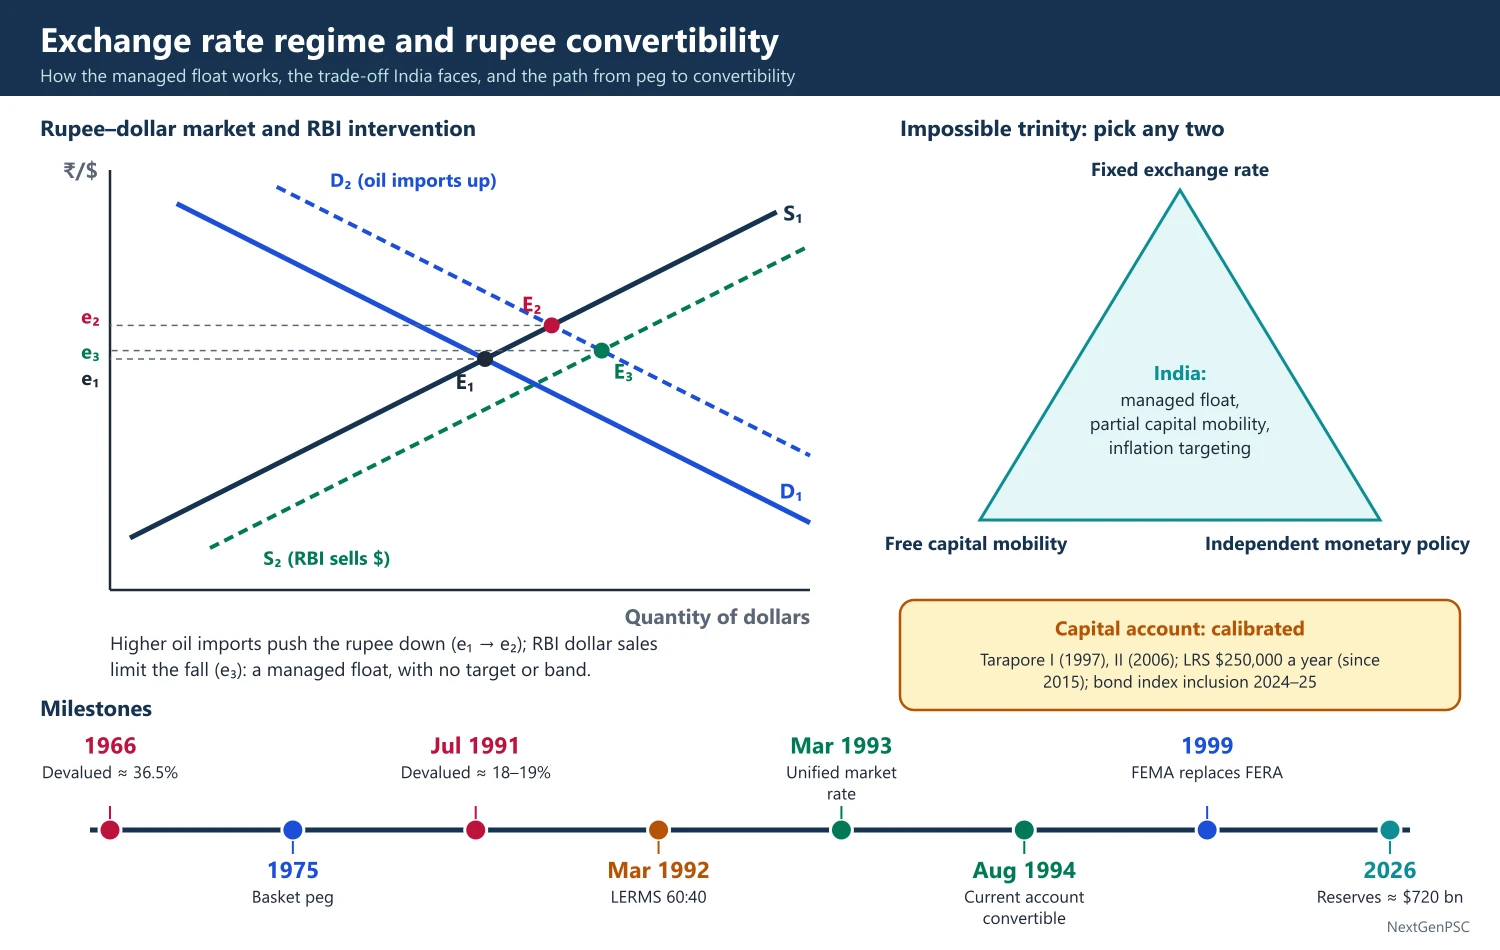
Forex market: draw demand for dollars (imports, outflows) sloping down and supply of dollars (exports, inflows) sloping up against the rupee price of the dollar; a rise in oil imports shifts demand right and the rupee depreciates from e1 to e2; show RBI selling dollars shifting supply right to limit the fall.
Impossible trinity triangle: draw a triangle with corners 'fixed exchange rate', 'free capital mobility' and 'independent monetary policy'; a country can have only two sides; mark India's position as managed float with partial capital mobility and inflation-targeting monetary policy.
Mundell-Fleming: in (Y, r) space with IS, LM and a horizontal BP line under perfect capital mobility, show that monetary policy is powerful under floating rates and fiscal policy under fixed rates.
6. Theory and Debates
Fixed vs flexible: Friedman (1953) argued for flexible rates as automatic adjustment; critics stress volatility and the 'fear of floating' in emerging markets (Calvo and Reinhart, 2002).
Sequencing: McKinnon (The Order of Economic Liberalization, 1991) argued for fiscal control and domestic financial reform before opening the capital account.
Capital account sceptics: Bhagwati ('The Capital Myth', 1998), Stiglitz and Rodrik argued that free capital flows bring crises without clear growth gains; the East Asian (1997) crisis is the key case; India's caution is often credited with avoiding contagion.
Supporters: argue that convertibility deepens markets, lowers the cost of capital and disciplines policy.
Depreciation effects: the Marshall-Lerner condition (sum of export and import demand elasticities above one) and the J-curve determine whether depreciation improves the trade balance; pass-through to inflation is significant for oil-importing India.
Taper tantrum example (2013): when the US Federal Reserve hinted at slowing bond purchases, portfolio outflows pushed the rupee from about 55 to about 68 per dollar; India was grouped among the 'Fragile Five' and the RBI responded with FCNR(B) deposit swaps that raised about 34 billion US dollars.
China comparison: China keeps tighter capital controls and a managed rate against a basket, showing another point on the impossible trinity.
Argentina and Turkey: repeated currency crises with high inflation and dollar debts show the risk of opening the capital account without fiscal and monetary credibility.
7. Using It in the Exam
10-mark answer: define current vs capital account convertibility and give India's milestones (1992, 1993, 1994).
15/20-mark answer: trace the regime from 1947, explain LERMS and Tarapore preconditions, analyse the impossible trinity, and assess the RBI's managed float with recent rupee and reserve data.
Keywords: basket peg, LERMS, unified rate, Article VIII, Tarapore preconditions, LRS, managed float, impossible trinity, NEER/REER.
Quotable line: the Tarapore Committee's view that capital account convertibility should follow, not precede, fiscal and banking strength (paraphrased).
| Year | Change |
|---|---|
| 1966 | Devaluation by about 36.5% |
| 1975 | Link to a basket of currencies |
| July 1991 | Two-step devaluation of about 18–19% |
| March 1992 | LERMS dual exchange rate (60:40) |
| March 1993 | Unified market-determined rate |
| August 1994 | Current account convertibility (IMF Article VIII) |
| 1997, 2006 | Tarapore Committees on capital account convertibility |
| 2004 onward | LRS; limit 250,000 US dollars since 2015 |
| Aspect | Current account | Capital account |
|---|---|---|
| Covers | Trade, services, income, transfers | FDI, FPI, loans, deposits, foreign assets |
| India's status | Full since August 1994 | Partial and calibrated |
| Main risk | Low | Sudden stops and capital flight |
| Key reference | IMF Article VIII | Tarapore Committees 1997 and 2006 |
Mains points
- Give the chronology precisely: 1991 devaluation, LERMS 1992, unification 1993, Article VIII 1994.
- State the Tarapore preconditions with numbers; examiners reward specificity.
- Use the impossible trinity to explain why India keeps capital controls and a managed float.
- Bring current data: reserves around 720 billion dollars (early 2026), CAD 0.6% of GDP (2025–26), rupee past 90.
- Discuss the East Asian crisis and sequencing (McKinnon) as arguments for gradualism.
- Common mistake: claiming the rupee is fully convertible; only the current account is.
Did you know?
- In 1991 India airlifted about 47 tonnes of gold to London as collateral to raise foreign exchange; by 2024 its reserves exceeded 700 billion dollars.
UPSC Previous Year Questions: External Sector after Liberalisation
From 2014 to 2026 UPSC asked 36 question parts (525 marks) on India's external sector after liberalisation, all in Paper II. The most-asked area is the exchange rate regime and rupee convertibility (16 parts, mainly capital account convertibility and the Tarapore Committees), followed by EXIM and Foreign Trade Policy (11) and TRIPS, TRIMs and GATS (9). Every question below has a model answer written to the UPSC word limit.
In simple words
Read the question and its Approach line, then write your own answer in the time UPSC gives (about 7 minutes for 10 marks, 11 for 15 and 14 for 20).
Only then read the model answer and compare: did you define the term, give the policy with its year, use recent trade or reserve data, and end with a balanced judgement?
Note the facts you missed (Tarapore preconditions, FTP 2023 target, Section 3(d), GATS modes) in a short list and revise it before the exam.
1. India and TRIPS, TRIMs and GATS
Example 1 (UPSC 2026, 10 marks): Analyze the impact of the TRIPS Agreement on the pricing and availability of generic drugs in the Indian pharmaceutical sector.
Paper and question: Paper II, Q5(a)
Approach: Explain what TRIPS required of India, then trace its effect on prices and availability of generics through the 2005 product patent regime and India's flexibilities.
The TRIPS Agreement (WTO, 1995) requires 20-year patents for products and processes in all fields of technology. India's Patents Act, 1970 allowed only process patents for drugs, which let Indian firms reverse-engineer medicines and become the 'pharmacy of the developing world'.
Effect on prices: after the Patents (Amendment) Act, 2005 introduced product patents, new molecules patented after 1995 can be sold only by the patent holder or licensees, so the cheap generic route for new drugs closed and prices of such drugs stay high until expiry.
Effect on availability: older off-patent medicines, which form most of India's consumption, were unaffected, and India still supplies a large share of the world's generic volume.
Safeguards: India used TRIPS flexibilities: Section 3(d) blocks evergreening (upheld in Novartis v. Union of India, 2013); compulsory licensing under Section 84 (Natco–Bayer sorafenib, 2012, price cut by about 97%); and the Doha Declaration (2001) on public health.
Thus TRIPS raised prices of new patented drugs but India's flexibilities have preserved the generic industry and affordable access for most medicines.
Example 2 (UPSC 2026, 20 marks): Explain the Intellectual Property Rights (IPR) regime under the WTO. Discuss the specific implications of TRIPS and GATS on India's trade policy and domestic regulations.
Paper and question: Paper II, Q8(a)
Approach: Define IPR and outline the WTO's TRIPS regime (standards, enforcement, flexibilities), then discuss the implications of TRIPS and of GATS separately for India's trade policy and domestic laws.
Intellectual property rights are legal rights over creations of the mind (inventions, brands, designs, works) that give the creator temporary exclusive use. The WTO's TRIPS Agreement (1995) sets minimum standards for all members.
The regime: TRIPS covers patents (20 years, products and processes in all fields), copyright, trademarks, geographical indications, industrial designs, layout-designs, trade secrets and plant varieties (patents or an effective sui generis system under Article 27.3(b)). It applies national treatment and MFN and requires civil and border enforcement. Flexibilities include compulsory licences (Article 31), exceptions, and the Doha Declaration (2001).
Implications of TRIPS for India: India amended its patent law in 1999, 2002 and 2005 (product patents from 1 January 2005), and enacted the Geographical Indications Act, 1999, the Protection of Plant Varieties and Farmers' Rights Act, 2001 and the Biological Diversity Act, 2002. It kept public-health safeguards such as Section 3(d) and compulsory licensing, and adopted the National IPR Policy in 2016. In trade negotiations India resists 'TRIPS-plus' demands (data exclusivity, patent-term extension) in FTAs.
Implications of GATS for India: GATS (1995) covers trade in services through four modes and asks members to schedule market-access and national-treatment commitments. India gained from Mode 1 (IT and business services exports) and seeks easier Mode 4 movement of professionals, while opening Mode 3 gradually: banking, insurance (FDI cap raised to 100% in 2025), telecom and retail rules were liberalised under domestic reform rather than binding WTO commitments.
Domestic regulation: both agreements pushed India towards transparent, rule-based regulation, but India keeps policy space for health, food security and data.
On balance the regime improved India's IP and services framework, and India's careful use of flexibilities has limited its costs.
Example 3 (UPSC 2024, 15 marks): What are the main features of 'TRIMS'? How does it act against India's interest?
Paper and question: Paper II, Q4(c)
Approach: State what TRIMs prohibits, with the illustrative list and transition periods, then explain how it constrains India's industrial policy with the autos and solar disputes.
The Agreement on Trade-Related Investment Measures (TRIMs), part of the Uruguay Round (in force 1995), prohibits investment conditions on goods trade that violate GATT Article III (national treatment) or Article XI (quantitative restrictions).
Main features: an illustrative list bans local content requirements (forcing firms to use domestic inputs), trade-balancing requirements (linking imports to exports), foreign-exchange balancing and export restrictions. Members had to notify such measures and phase them out within 2 years (developed), 5 years (developing) and 7 years (least developed). It applies only to goods, not services, and a Committee on TRIMs monitors compliance.
How it acts against India's interest: first, it removes tools that East Asian economies used to build domestic suppliers and technology. India had to drop indigenisation and export-obligation conditions in the automobile sector; the WTO panel in India–Autos (2001–02) ruled against India's memoranda of understanding with car makers. Second, in India–Solar Cells (DS456, 2016) the Appellate Body struck down domestic content requirements in the National Solar Mission, so India shifted to production-linked incentives and approved lists.
Third, it limits policies to push MNCs to source locally, which matters for MSME linkages, while developed countries continue other subsidies.
However, TRIMs also improved India's investment climate and FDI. India demands more policy space for developing countries in the WTO review of TRIMs.
Example 4 (UPSC 2022, 15 marks): What is the main purpose of General Agreement on Trade in Services (GATS)? What are the services covered under it? State the modes under which the services are supplied.
Paper and question: Paper II, Q6(c)
Approach: Give GATS's purpose and principles, the coverage of services (12 sectors, government services excluded) and explain the four modes of supply with Indian examples.
The General Agreement on Trade in Services (GATS), negotiated in the Uruguay Round and in force from 1 January 1995, is the first multilateral agreement on services trade.
Purpose: to expand services trade under transparent rules and progressive liberalisation (Article XIX), as a means of growth and development. General obligations are MFN treatment (with listed exemptions) and transparency; specific commitments on market access (Article XVI) and national treatment (Article XVII) apply only to sectors a member lists in its schedule (a positive-list approach), so countries open at their own pace.
Coverage: all services except those supplied 'in the exercise of governmental authority' and most air traffic rights. The WTO classification lists 12 sectors: business (including professional and computer), communication, construction and engineering, distribution, education, environmental, financial (banking and insurance), health, tourism and travel, recreational and cultural, transport, and other services.
Modes of supply: Mode 1, cross-border supply (software or call-centre services delivered from India to a US client); Mode 2, consumption abroad (foreign patients in Indian hospitals, Indian students abroad); Mode 3, commercial presence (a foreign bank opening a branch in India); Mode 4, presence of natural persons (Indian IT professionals working onsite abroad).
India's interest lies in Modes 1 and 4, where it is competitive, while developed countries press for Mode 3 access in finance and retail.
Example 5 (UPSC 2021, 15 marks): Analyse the effects of TRIPS Agreement on Indian agriculture.
Paper and question: Paper II, Q8(b)
Approach: Explain Article 27.3(b) of TRIPS and India's sui generis response, then analyse effects on seeds, farmers' rights, biopiracy and GIs, with cases.
TRIPS touches agriculture mainly through Article 27.3(b), which lets members exclude plants and animals from patents but requires protection of plant varieties 'by patents or by an effective sui generis system or by any combination thereof', and through geographical indications.
India's response: instead of joining UPOV 1991, India enacted the Protection of Plant Varieties and Farmers' Rights Act, 2001, which protects breeders but uniquely lets farmers save, use, exchange and sell farm-saved seed (but not branded seed), register farmers' varieties and claim compensation if a variety fails. The Biological Diversity Act, 2002 requires approval and benefit-sharing for use of Indian bio-resources.
Effects: (i) Seed sector: private R&D and hybrid seed markets grew; Bt cotton, approved in 2002, spread to over 90% of cotton area. (ii) Farmers' rights: the PepsiCo potato case (2019) and the revocation of its variety registration in 2021 showed the Act protecting farmers. (iii) Biopiracy: India won revocation of the US turmeric patent (1997) and the European neem patent. (iv) GIs: the GI Act, 1999 protects Darjeeling tea, Basmati claims and many farm products, though TRIPS gives stronger protection only to wines and spirits.
Risks remain: higher seed costs, concentration in a few seed firms and pressure for UPOV-type rules in FTAs. On balance, India's sui generis model has used TRIPS flexibility to balance breeders' incentives with farmers' rights.
Example 6 (UPSC 2020, 15 marks): What is intellectual property? Why does intellectual property need to be promoted and protected?
Paper and question: Paper II, Q6(c)
Approach: Define intellectual property and its main forms, then give the economic case for protection (public-good nature, incentives, disclosure) and note the need to balance it with access.
Intellectual property means creations of the human mind, such as inventions, literary and artistic works, designs, symbols and names used in commerce, over which the law grants the creator exclusive rights for a limited time. Its main forms are patents, copyright, trademarks, industrial designs, geographical indications, trade secrets and plant variety rights; WIPO (1967) and the WTO's TRIPS Agreement (1995) set the international rules.
Why promote and protect it: (i) Knowledge is a non-rival and partly non-excludable good: once an idea is public, others can copy it at almost no cost, so without protection innovators cannot recover R&D costs and society under-invests in innovation (Arrow, 1962). (ii) A patent gives temporary monopoly profits in return for disclosure, so knowledge spreads after expiry. (iii) Endogenous growth theory (Romer, 1990) links growth to R&D, which IP rights encourage. (iv) Trademarks and GIs reduce consumers' search costs and protect reputation, as with Darjeeling tea. (v) IP attracts FDI and technology transfer and builds creative industries (software, films, pharma).
Indian context: the National IPR Policy (2016), 'Creative India; Innovative India', aims at awareness, faster examination and commercialisation.
Balance: protection raises prices and limits access (the monopoly deadweight loss), so the system must keep safeguards such as Section 3(d), compulsory licensing and fair use. Optimal IP protection is strong enough to reward innovation but limited enough to serve public welfare.
Example 7 (UPSC 2019, 15 marks): Narrate the implications of the TRIPS Agreement with special reference to the pharmaceutical sector in India.
Paper and question: Paper II, Q6(b)
Approach: Show the shift from process to product patents and its implications for prices, R&D, industry structure and exports, with the safeguards and cases India used; add a monopoly diagram.
Under the Patents Act, 1970 India granted only process patents (5–7 years) for drugs, which created a strong generic industry and some of the world's lowest drug prices. TRIPS required product patents for 20 years, introduced from 1 January 2005 by the Patents (Amendment) Act, 2005.
Implications: (i) Prices: new patented drugs are sold at monopoly prices; generics of post-1995 molecules cannot be made in India until expiry. (ii) R&D and strategy: large Indian firms (Sun, Dr. Reddy's, Lupin) raised R&D spending, moved into complex generics, biosimilars and contract research and manufacturing, and grew in regulated markets such as the US. (iii) Industry structure: mergers and acquisitions by MNCs (Daiichi–Ranbaxy, 2008) and licensing deals increased. (iv) Exports: exports kept growing to about 30 billion US dollars in 2024–25, since most world demand is for off-patent generics.
Safeguards: Section 3(d) denies patents for new forms of known substances without enhanced efficacy (Novartis, Supreme Court, April 2013); compulsory licensing under Section 84 (Natco–Bayer, 2012); pre- and post-grant opposition; and the Doha Declaration (2001) and Article 31bis (2017) for exports to countries without capacity.
Diagram: price on the vertical axis and quantity on the horizontal; draw demand D and marginal revenue MR below it, with a flat marginal cost MC; the patent holder sets output Qm where MR = MC and price Pm on D, while generic competition gives Qc and Pc = MC; the triangle between D and MC from Qm to Qc is the deadweight loss of patent protection.
Overall, TRIPS reshaped Indian pharma towards innovation and quality, while India's flexibilities preserved affordable medicine for itself and the developing world.
Example 8 (UPSC 2018, 15 marks): Describe the salient features of TRIMS. How has it impacted the textile and clothing sector in India?
Paper and question: Paper II, Q8(b)
Approach: List the salient features of TRIMs, then explain its impact on textiles and clothing together with the closely linked phase-out of the Multi-Fibre Arrangement under the Agreement on Textiles and Clothing.
The TRIMs Agreement (Uruguay Round, 1995) disciplines investment measures that distort trade in goods.
Salient features: (i) no member may apply a TRIM inconsistent with GATT Article III (national treatment) or Article XI (no quantitative restrictions); (ii) an illustrative list bans local content requirements, trade-balancing and foreign-exchange balancing requirements and export restrictions linked to investment; (iii) existing TRIMs had to be notified and removed within 2, 5 and 7 years for developed, developing and least developed members; (iv) it covers goods only.
Impact on textiles and clothing: TRIMs barred conditions such as compulsory use of domestic yarn or export obligations on foreign investors, so textile policy shifted from conditions to incentives (Technology Upgradation Fund Scheme 1999, later PM MITRA parks and PLI for man-made fibre and technical textiles). FDI up to 100% through the automatic route opened the sector to foreign brands and capital.
The bigger change came with the companion Agreement on Textiles and Clothing, which phased out Multi-Fibre Arrangement quotas by 1 January 2005. Indian exports rose after 2005, but gains were smaller than expected because of small, fragmented firms, labour-law rigidities and stronger competition from China, Bangladesh and Vietnam.
Thus TRIMs and the end of quotas exposed Indian textiles to global competition; scale, technology and FTAs (UAE 2022, UK 2025) decide whether India gains.
Example 9 (UPSC 2016, 15 marks): Examine the implications of Trade Related Intellectual Property Rights (TRIPS) on Indian Economy.
Paper and question: Paper II, Q3(c)
Approach: Outline TRIPS obligations and India's legal changes, then examine implications sector by sector (pharma, agriculture, traditional knowledge, technology and FDI), ending with a balanced view.
The TRIPS Agreement (1995) obliged WTO members to provide minimum IP standards: 20-year product and process patents, copyright, trademarks, geographical indications and plant variety protection, with enforcement under WTO dispute settlement. Developing countries got transition periods up to 2000, and up to 2005 for product patents in pharmaceuticals and agro-chemicals.
India's changes: Patents Act amendments of 1999, 2002 and 2005; Copyright and Trade Marks Acts revised (1999); GI Act, 1999; PPV&FR Act, 2001; Biological Diversity Act, 2002.
Implications: (i) Pharmaceuticals: new drugs became costlier, but India retained Section 3(d) and compulsory licensing, and its generic exports grew. (ii) Agriculture: seed firms gained protection while farmers kept the right to save and sell farm seed; seed costs rose for hybrids and Bt cotton. (iii) Traditional knowledge: India fought biopiracy (turmeric, neem, basmati) and built the Traditional Knowledge Digital Library. (iv) Technology and FDI: stronger IP encouraged MNC R&D centres, technology licensing and creative industries such as software and films. (v) Costs: higher royalty payments abroad and possible 'TRIPS-plus' pressure in FTAs.
Overall: TRIPS transferred some rents from Indian consumers to foreign patent holders in the short run, but it also pushed Indian industry towards innovation; the net effect has been moderate because India used flexibilities well.
India should keep defending public-health safeguards while raising its own R&D spending, which is only about 0.65% of GDP.
2. EXIM and Foreign Trade Policy
Example 10 (UPSC 2025, 10 marks): Do you agree with the view that India's Foreign Trade Policy, 2023–2028 will boost country's trade surplus and generate employment? Give reasons.
Paper and question: Paper II, Q5(b)
Approach: State FTP 2023's aims and tools, then judge separately whether it can turn the trade balance and create jobs, using 2025–26 trade data; conclude with a qualified view.
Foreign Trade Policy 2023, effective 1 April 2023 with no end date, aims at exports of 2 trillion US dollars by 2030 by shifting from incentives to remission of taxes (RoDTEP), automation, Districts as Export Hubs, new Towns of Export Excellence, e-commerce exports and rupee settlement.
Trade surplus: only partly. India's goods trade is in structural deficit: in 2025–26 merchandise exports were about 442 billion dollars against a goods deficit of about 333 billion (Commerce Ministry). The deficit comes from crude oil, gold and electronics imports, which trade policy cannot easily cut. Only services give a surplus, and the overall goods-and-services deficit widened to about 119 billion dollars.
Employment: more likely. District hubs, e-commerce from small towns and support to labour-intensive sectors through the Export Promotion Mission (₹25,060 crore, 2025–31) can raise jobs, especially in MSMEs.
So the FTP can raise exports and jobs at the margin, but a lasting improvement in the trade balance needs manufacturing competitiveness (PLI, logistics), lower energy import dependence and new FTAs.
Example 11 (UPSC 2024, 15 marks): What steps have been taken by the Government of India to increase exports during the last 10 years? Have these yielded the desired result? Examine.
Paper and question: Paper II, Q6(b)
Approach: List the main export-promotion measures of 2014–2024 under policy, incentive, infrastructure and market-access heads, then assess results with export data and conclude that results are mixed.
Steps taken (2014–2024): (i) Policy: FTP 2015–20 (MEIS and SEIS), extended to 2023, and the open-ended FTP 2023 with a 2-trillion-dollar target for 2030; Make in India (2014). (ii) WTO-compatible incentives: after the WTO panel ruled against MEIS (DS541, 2019), India moved to RoDTEP (January 2021) and RoSCTL for apparel; interest equalisation on export credit (2015). (iii) Manufacturing: Production-Linked Incentive schemes in 14 sectors (2020–21) with about ₹1.97 lakh crore of outlay. (iv) Logistics: PM Gati Shakti (2021), National Logistics Policy (2022) and GST refunds. (v) Market access: India–UAE CEPA and India–Australia ECTA (2022), rupee trade settlement (July 2022) and Districts as Export Hubs.
Results: total exports of goods and services rose from about 466 billion dollars in 2013–14 to about 825 billion in 2024–25, but mostly because services exports more than doubled. Merchandise exports grew slowly, from about 314 to about 437 billion dollars, and the FTP 2015–20 target of 900 billion dollars by 2019–20 was missed.
Bright spots: electronics, led by smartphones, became one of the top export items after PLI; pharma and engineering goods grew. Weak spots: labour-intensive exports (textiles, leather) stagnated, India's share of world merchandise exports stayed below 2%, and the goods deficit widened.
Hence the measures yielded the desired result only partly; competitiveness through logistics, scale, standards and deeper FTAs remains the key.
Example 12 (UPSC 2023, 20 marks): Briefly explain the growth and structure of India's foreign trade in the post-liberalization period.
Paper and question: Paper II, Q7(a)
Approach: Describe growth (values, trade-to-GDP, phases) and then structure (composition of exports and imports, direction, services) from 1991 to the latest year, ending with the structural lessons.
The 1991 reforms (devaluation, removal of import licensing and QRs, tariff cuts from a peak of over 300% to near 10% for most goods, and a market-determined rupee) turned India from an inward-looking to an open economy.
Growth: merchandise exports rose from about 18 billion dollars in 1990–91 to about 442 billion in 2025–26, and services exports from under 5 billion to about 420 billion; total trade in goods and services rose from about 15% of GDP in 1990–91 to a peak of over 55% in 2011–12, and was around 45% in recent years.
Composition of exports: the share of traditional items (tea, textiles, leather, ores) fell and that of engineering goods (now the largest group), petroleum products, pharmaceuticals, chemicals and, since 2020, electronics (smartphones) rose. Imports: crude oil and petroleum (about a quarter), electronics, gold, machinery, coal and chemicals dominate.
Direction: the shares of Western Europe and Russia fell in the 1990s, while Asia rose; the US is the largest export market, and China the largest source of imports, with a large bilateral deficit; Russia became a major oil supplier after 2022, and the UAE a key partner after CEPA (2022).
Services: software and IT-enabled services, and lately global capability centres, account for about half of services exports, producing a surplus that, with remittances (about 135 billion dollars in 2024–25), finances most of the goods deficit.
Trade balance: the goods deficit widened from about 6 billion dollars in 1990–91 to over 300 billion in 2025–26, yet the current account deficit stayed modest (about 0.6% of GDP in 2025–26).
In short, trade grew fast and diversified, but India remains a services-led exporter with a persistent goods deficit; labour-intensive manufacturing exports are the missing link.
Example 13 (UPSC 2023, 15 marks): Critically examine the contribution of Special Economic Zones (SEZs) in promoting foreign trade in India.
Paper and question: Paper II, Q7(b)
Approach: Define SEZs and trace the policy (Kandla EPZ, 2000 policy, SEZ Act 2005), give their export contribution with data, then critically assess problems and reform proposals.
Special Economic Zones are duty-free enclaves treated as foreign territory for trade and duties. India set up Asia's first export processing zone at Kandla in 1965, announced the SEZ policy in April 2000 and passed the SEZ Act, 2005 (rules in force February 2006), offering duty-free imports, single-window clearance and income-tax holidays (100% for five years, 50% for the next five).
Contribution: SEZ exports of goods and services rose to about 164 billion dollars in 2023–24 (Commerce Ministry), roughly a fifth of India's total exports, from 280 operational zones (423 approved, March 2024). IT and IT-enabled services dominate, along with gems and jewellery, engineering and pharma.
Criticisms: (i) land acquisition conflicts (Nandigram 2007) and use of zones for real estate; (ii) large revenue losses with doubtful additionality, as firms relocated from the domestic tariff area; (iii) the Minimum Alternate Tax (2011) and the end of tax holidays for units starting after March 2020 cut attractiveness; (iv) concentration in a few southern and western states; (v) vacant land in many zones; (vi) the WTO panel (DS541, 2019) found SEZ export subsidies inconsistent with WTO rules.
Reform: the Baba Kalyani Committee (2018) proposed employment and economic enclaves, and the 2022 Budget proposed replacing the SEZ Act with a DESH law linked to development rather than exports alone.
SEZs thus helped services exports but did not become China-style manufacturing hubs.
Example 14 (UPSC 2023, 15 marks): Discuss the salient features of India's New Foreign Trade Policy, 2023.
Paper and question: Paper II, Q7(c)
Approach: Give the date, approach and target of FTP 2023, then list its salient features under its four pillars, and end with a brief assessment.
India's Foreign Trade Policy 2023 was announced on 31 March 2023 and took effect on 1 April 2023. Unlike earlier five-year policies, it has no end date and is updated as needed. It aims at exports of goods and services of 2 trillion US dollars by 2030.
Four pillars: (i) incentive to remission (tax refunds such as RoDTEP instead of WTO-challenged subsidies); (ii) export promotion through collaboration with states, districts and Indian missions abroad; (iii) ease of doing business, lower transaction costs and e-initiatives; (iv) emerging areas such as e-commerce, export hubs and SCOMET (dual-use items).
Salient features: (a) automated, paperless processing of authorisations; (b) four new Towns of Export Excellence (Faridabad, Mirzapur, Moradabad, Varanasi); (c) Districts as Export Hubs with district export action plans; (d) lower thresholds for status-holder recognition of exporters; (e) e-commerce exports encouraged, with the courier export value limit raised from ₹5 lakh to ₹10 lakh per consignment; (f) merchanting trade allowed; (g) a one-time amnesty scheme for exporters who defaulted on export obligations under EPCG and Advance Authorisation; (h) support for rupee invoicing and settlement of trade.
Assessment: the policy is flexible and WTO-compatible, but critics note it gives few new incentives, and outcomes depend on logistics, quality standards, FTAs and global demand (US tariffs in 2025).
Example 15 (UPSC 2022, 15 marks): What are the expectations from Foreign Trade Policy 2021–26? Elucidate your answer.
Paper and question: Paper II, Q8(b)
Approach: Explain why the FTP due in 2021 was delayed (COVID, extension of FTP 2015–20 to March 2023) and then set out what exporters and the economy expected from the new policy.
The Foreign Trade Policy 2015–20 was due to be replaced from April 2020, then from April 2021 (popularly called FTP 2021–26), but because of COVID-19 and global uncertainty it was extended several times, until 31 March 2023, when an open-ended FTP 2023 was announced.
Expectations from the new policy: (i) WTO-compatible support: since the WTO panel (DS541, 2019) ruled against MEIS and SEZ subsidies, exporters expected adequate RoDTEP rates and coverage and clarity on the SEIS dues for services. (ii) Ambitious targets: after merchandise exports crossed 400 billion dollars in 2021–22, a target of 1 trillion dollars each for goods and services by 2030 was discussed. (iii) Districts as Export Hubs to spread exports to MSMEs and small towns. (iv) E-commerce exports through simpler courier and payment rules. (v) Logistics and ease of doing business: integration with PM Gati Shakti and the National Logistics Policy, paperless processes and faster GST refunds. (vi) Services: a dedicated strategy for IT, tourism, education and health services. (vii) Synergy with PLI schemes, Atmanirbhar Bharat and new FTAs (UAE, Australia, UK, EU), and rupee trade settlement.
Caveat: trade policy alone cannot offset weak global demand or high logistics costs; reforms in labour, land and infrastructure must accompany it.
Most of these expectations were reflected in FTP 2023, which adopted a 2-trillion-dollar target and an open-ended, consultative design.
Example 16 (UPSC 2020, 15 marks): Describe the salient features of New Foreign Trade Policy (2015-20) in India. Examine its role in improving the current account balance.
Paper and question: Paper II, Q8(c)
Approach: List the features of FTP 2015–20 (MEIS, SEIS, targets, EPCG, trade facilitation, mid-term review), then examine its role in the current account using CAD data, separating policy effects from oil and gold prices.
Salient features of FTP 2015–20 (announced 1 April 2015): (i) five earlier reward schemes were merged into the Merchandise Exports from India Scheme (MEIS), and the Served from India Scheme was replaced by the Services Exports from India Scheme (SEIS), both paying freely transferable duty credit scrips; (ii) targets of 900 billion dollars of goods and services exports by 2019–20 and a rise in India's share of world exports from about 2% to 3.5% by 2020; (iii) lower export obligation (75%) under EPCG for capital goods bought domestically, linking to Make in India; (iv) trade facilitation: online filing, fewer mandatory documents and 24×7 customs clearance at major ports.
Role in the current account: the current account deficit fell from 4.8% of GDP in 2012–13 to 1.3% in 2014–15, 1.1% in 2015–16 and about 0.6% in 2016–17, rose to 2.1% in 2018–19 and turned into a surplus of 0.9% in 2020–21. However, merchandise exports stagnated (about 310 billion dollars in 2014–15, 262 billion in 2015–16, 330 billion in 2018–19), so the improvement came mainly from the fall in crude oil prices after 2014, curbs on gold imports, steady services surpluses and remittances, and the collapse of imports in the COVID year.
The 900-billion-dollar target was missed. Hence the policy's direct contribution to the current account was modest; global prices and services exports mattered more.
Example 17 (UPSC 2017, 15 marks): Write a note on the broad trend of India's foreign trade and current account balance during roughly the last one decade.
Paper and question: Paper II, Q4(b)
Approach: Describe trade trends from about 2007 to 2017 in phases with data, then the current account balance year-wise and its drivers (oil, gold, services, remittances), ending with the lesson.
Trade trend (2007–2017): merchandise exports rose from about 163 billion dollars in 2007–08 to a peak of about 314 billion in 2013–14, after a dip in 2009–10 due to the global financial crisis. They then fell to about 262 billion in 2015–16 as world demand and commodity prices weakened, before recovering to about 276 billion in 2016–17. Imports peaked at about 490 billion dollars in 2011–12, swollen by high oil prices and gold, and then declined to about 384 billion in 2016–17.
Services: services exports kept growing, from about 90 billion dollars to over 160 billion, led by software, and the services surplus with remittances of 60–70 billion dollars a year offset much of the goods deficit.
Current account balance: the deficit widened from 1.3% of GDP in 2007–08 to 2.8% in 2009–10 and 2010–11, 4.2% in 2011–12 and a record 4.8% (about 88 billion dollars) in 2012–13, contributing to the 2013 'taper tantrum' and the rupee fall. It then narrowed sharply to 1.7% in 2013–14, 1.3% in 2014–15, 1.1% in 2015–16 and about 0.6% in 2016–17, helped by gold import curbs (2013), the fall in crude prices after mid-2014 and weak imports.
The lesson is that India's current account is vulnerable to oil and gold prices, and lasting balance requires competitive manufacturing exports.
Example 18 (UPSC 2016, 10 marks): Bring out the salient features of New EXIM policy of Government of India.
Paper and question: Paper II, Q5(d)
Approach: Note the evolution from EXIM policies to Foreign Trade Policies, then list the salient features of the then-new FTP 2015–20.
After 1991 India moved from licensing to liberal five-year EXIM policies (1992–97, 1997–2002, 2002–07), renamed Foreign Trade Policy in 2004. The new EXIM policy in 2016 was the Foreign Trade Policy 2015–20, announced on 1 April 2015.
Salient features: (i) five reward schemes merged into the Merchandise Exports from India Scheme (MEIS), with rewards by product and market group; (ii) the Services Exports from India Scheme (SEIS) for services exporters located in India; (iii) duty credit scrips made freely transferable and usable for customs, excise and service tax; (iv) target of 900 billion dollars of goods and services exports by 2019–20 and a 3.5% share of world exports; (v) EPCG export obligation cut to 75% for domestically sourced capital goods, supporting Make in India; (vi) trade facilitation through online filing, fewer documents and 24×7 customs; (vii) a mid-term review every two and a half years.
The policy simplified incentives and linked trade to manufacturing, but exports stayed weak in 2015–16 because of falling world demand.
Example 19 (UPSC 2015, 20 marks): It is often said that the prime generator of economic growth in India in the post-liberalisation period has been the service sector. Do you agree with this view? What has been its implication on the balance of payments in India?
Paper and question: Paper II, Q4(a)
Approach: Test the claim with data on services' share in GDP and in growth, give the counter-view (manufacturing, jobs, premature deindustrialisation), then explain the BoP implication through the services surplus.
Yes, largely. Since 1991 the services sector has been India's main engine of growth. Its share in GDP rose from about 41% in 1990–91 to over 50% by the mid-2000s and about 55% of GVA in 2024–25 (NSO), and it contributed well over half of GDP growth in most years. Trade, hotels, transport, finance, real estate, IT and business services led, helped by liberalisation of telecom, banking and insurance, cheap skilled labour and the IT revolution.
Qualifications: (i) India's path skipped the manufacturing stage; manufacturing stayed at about 15–17% of GDP, which Rodrik (2015) calls premature deindustrialisation. (ii) Services growth was skill-intensive and created limited jobs for low-skilled workers; agriculture still employs about 46% of workers (PLFS 2023–24). (iii) Part of services growth reflects government and non-tradable services. So services are the prime generator of output, but not of employment.
Implications for the balance of payments: (i) Services exports rose from about 5 billion dollars in 1990–91 to 158 billion in 2014–15 and about 387 billion in 2024–25, led by software and business services. (ii) The resulting net services surplus (about 76 billion dollars in 2014–15, about 189 billion in 2024–25) with private remittances finances most of the large merchandise deficit, keeping the current account deficit low (1.3% of GDP in 2014–15). (iii) Services exports are less volatile than commodity exports and raise India's resilience to oil shocks. (iv) But they depend on a few markets (US, UK) and are exposed to visa and outsourcing restrictions and to automation and AI.
Thus services both lead growth and stabilise the BoP, but balanced growth needs labour-intensive manufacturing alongside them.
Example 20 (UPSC 2014, 15 marks): Write on the Look East Policy of India.
Paper and question: Paper II, Q8(b)
Approach: Explain the origin and objectives of the Look East Policy, its phases and economic instruments (ASEAN FTA, CECA/CEPA, connectivity), then assess outcomes and its upgrade to Act East.
The Look East Policy was launched in the early 1990s under Prime Minister P.V. Narasimha Rao, alongside the 1991 reforms, to build economic and strategic ties with Southeast and East Asia after the collapse of the Soviet Union, India's main partner.
Phase I (1990s): focus on ASEAN trade and investment; India became an ASEAN sectoral dialogue partner (1992), full dialogue partner (1996) and joined the ASEAN Regional Forum (1996); summit-level ties began in 2002. Phase II (from about 2003): extended to China, Japan, South Korea and Australia, and added security, connectivity and the East Asia Summit (2005).
Economic instruments: India–Singapore CECA (2005), the ASEAN–India Trade in Goods Agreement (signed 2009, in force 2010), India–Korea CEPA (2010), India–Japan and India–Malaysia agreements (2011), and the ASEAN–India services and investment agreement (concluded 2014); BIMSTEC (1997) and Mekong–Ganga Cooperation (2000); connectivity projects such as the India–Myanmar–Thailand Trilateral Highway and the Kaladan multimodal project.
Outcomes: trade with ASEAN rose many times, making it one of India's largest trading partners, and Japanese and Singaporean investment grew. But India runs a widening deficit with ASEAN and China, and connectivity projects lag.
In November 2014 the policy was upgraded to the Act East Policy, stressing implementation, the North-East and Indo-Pacific security.
3. Exchange Rate Regime and Rupee Convertibility
Example 21 (UPSC 2026, 10 marks): Distinguish between current account and capital account convertibility. Why has India been cautious regarding full capital account convertibility?
Paper and question: Paper II, Q5(b)
Approach: Define both forms of convertibility with India's dates, then give the reasons for caution (Tarapore preconditions, East Asian and taper-tantrum lessons, impossible trinity).
Current account convertibility is freedom to convert the rupee into foreign currency, at market rates, for trade in goods and services, income and transfers. India adopted it in August 1994 by accepting IMF Article VIII. Capital account convertibility is freedom to convert domestic financial assets into foreign financial assets and back at market rates (Tarapore Committee, 1997), covering FDI, portfolio flows, loans and residents' investment abroad. India's capital account is only partly convertible: FDI and FPI are largely open, while debt flows and residents' outflows (LRS limit of 250,000 dollars a year) are capped.
Reasons for caution: (i) the Tarapore preconditions on fiscal deficit, inflation and bank health were never fully met; (ii) the East Asian crisis (1997) and the 'taper tantrum' (2013) showed how sudden capital outflows cause currency crashes; (iii) the impossible trinity means free capital flows would force India to give up either exchange-rate stability or independent monetary policy; (iv) large government borrowing and a current account deficit make India vulnerable.
India therefore follows gradual, sequenced opening.
Example 22 (UPSC 2026, 15 marks): Analyze India's exchange rate regime post-1991. Discuss the move towards market-determined exchange rates, and the management of volatile capital flows.
Paper and question: Paper II, Q8(b)
Approach: Trace the regime from the 1991 devaluation through LERMS and the unified rate to today's managed float, then explain how the RBI manages volatile capital flows (intervention, sterilisation, capital-flow measures, reserves), with recent rupee data.
Move to a market rate: in July 1991 the rupee was devalued by about 18–19% in two steps. The Liberalised Exchange Rate Management System (March 1992) introduced a dual rate; on the Rangarajan Committee's advice the rates were unified on 1 March 1993, making the rupee market-determined.
Managed float: since then the RBI has no target level but intervenes to curb excessive volatility and disorderly movements. The IMF classified India's de facto regime as a 'stabilised arrangement' for 2022–23 and as a 'crawl-like arrangement' in November 2025. The rupee moved from about 31 per dollar in 1993 to about 83 in 2024, crossed 90 in December 2025 and hit record lows near 97 in 2026.
Managing volatile flows: (i) spot and forward market intervention, buying dollars during inflow surges and selling during outflows; (ii) sterilisation of the liquidity impact through open market operations and the Market Stabilisation Scheme (2004); (iii) capital-flow management: caps on FPI debt holdings, ECB limits, and variation of the LRS limit (cut to 75,000 dollars in 2013); (iv) reserve accumulation, about 700 billion dollars in 2024–26; (v) gradual opening of bond markets (Fully Accessible Route, 2020; global index inclusion, 2024).
India's approach is a pragmatic middle path in the impossible trinity: a flexible but managed rupee, partly open capital account and an independent inflation-targeting monetary policy.
Example 23 (UPSC 2025, 15 marks): What are the advantages and disadvantages of full convertibility of Indian rupee? Do you believe that capital account convertibility is feasible under the present circumstances in India? Discuss.
Paper and question: Paper II, Q7(b)
Approach: Define full convertibility, list advantages and disadvantages, then test feasibility today against the Tarapore preconditions with current data, concluding in favour of gradualism.
Full convertibility means the rupee can be freely exchanged for foreign currency at market rates for both current and capital account transactions. India has full current account convertibility (1994) but only partial capital account convertibility.
Advantages: access to global savings and a lower cost of capital; better allocation of capital and portfolio diversification for residents; deeper financial markets and greater rupee internationalisation; market discipline on fiscal and monetary policy. Disadvantages: exposure to sudden stops and capital flight, as in East Asia (1997); exchange-rate volatility and loss of monetary autonomy under the impossible trinity; risk of asset bubbles and currency mismatch in corporate borrowing; tax evasion and round-tripping.
Feasibility now: some Tarapore I preconditions are met: CRR is 3% (from November 2025), banks' gross NPAs fell to about 2.3% (March 2025), reserves are around 700 billion dollars and the current account deficit is small (about 0.6% of GDP in 2025–26). But others are not: the Centre's fiscal deficit (4.4% in 2025–26 RE) is above the 3.5% benchmark and the general government deficit is higher; and the rupee fell to record lows in 2026 amid portfolio outflows, showing vulnerability.
Hence full convertibility is not advisable yet; India should continue calibrated liberalisation (bond index inclusion, rupee trade settlement) while consolidating its fiscal position.
Example 24 (UPSC 2025, 15 marks): What is the strategy of the Reserve Bank of India (RBI) for exchange rate management? Discuss the recent changes in India's Exchange Rate Policy.
Paper and question: Paper II, Q7(c)
Approach: State the RBI's exchange-rate objective and tools, then discuss recent changes in policy (greater flexibility, IMF reclassification, rupee internationalisation, reserve use) with dates.
Strategy: under the managed float in place since 1993, the RBI does not target any level or band of the rupee; its stated aim is to curb excessive volatility and maintain orderly market conditions, while the rate is set by demand and supply. It leans against the wind: buying dollars when inflows are strong (building reserves) and selling them when outflows threaten disorder.
Tools: spot, forward and futures intervention; buy-sell foreign exchange swaps to manage liquidity and the forward book; sterilisation through open market operations; capital-flow measures (FPI debt limits, ECB rules, LRS); and reserves as a buffer (around 700 billion dollars, about 10 months of imports, in 2024–26).
Recent changes: (i) More flexibility: after very low volatility in 2023–24, which led the IMF to call India's regime a 'stabilised arrangement', the RBI under Governor Sanjay Malhotra (from December 2024) allowed larger two-way movement; the IMF reclassified India as a 'crawl-like arrangement' in November 2025. (ii) Rupee internationalisation: invoicing and settlement of trade in rupees through Special Rupee Vostro Accounts (July 2022), extended in 2025 to wider uses of vostro balances. (iii) Wider market access: non-resident participation through the Fully Accessible Route and global bond index inclusion (2024–25).
Overall, the RBI has moved towards a more flexible rupee while keeping reserves as an insurance against sudden stops.
Example 25 (UPSC 2024, 10 marks): What are the implications of depreciating Rupee on Indian Economy?
Paper and question: Paper II, Q5(c)
Approach: Explain the channels through which depreciation affects trade, inflation, debt, capital flows and growth, with a diagram of the foreign exchange market and the Marshall-Lerner condition.
A depreciation is a market-driven fall in the rupee's value against other currencies; the rupee fell from about 83 per dollar in 2024 to record lows above 95 in 2026.
Positive effects: exports become cheaper abroad and imports dearer, which improves the trade balance if the Marshall-Lerner condition holds (sum of export and import demand elasticities greater than 1), usually after a J-curve lag; remittances and IT earnings are worth more in rupees.
Negative effects: (i) imported inflation, since India imports about 85% of its crude oil, plus edible oils, fertilisers and electronics; (ii) a higher rupee burden of external debt and unhedged ECBs; (iii) costlier imported inputs reduce export gains in sectors such as electronics and gems; (iv) expectations of further fall can trigger portfolio outflows; (v) the subsidy bill on fertiliser and LPG rises.
Diagram: dollars on the horizontal axis and the rupee price of a dollar on the vertical axis; draw upward-sloping supply S and downward-sloping demand D of dollars; a rise in demand (oil imports, capital outflows) shifts D right from D1 to D2, raising the rate from e1 to e2, which is the rupee's depreciation.
The net effect depends on elasticities and pass-through; the RBI smooths volatility so that depreciation helps competitiveness without stoking inflation.
Example 26 (UPSC 2023, 15 marks): State the salient features of the Foreign Exchange Management Act (FEMA), 1999 in India. To what extent it deviates from the Foreign Exchange Regulation Act (FERA), 1979?
Paper and question: Paper II, Q6(c)
Approach: List the salient features of FEMA 1999 and then contrast it point by point with FERA (enacted 1973) on philosophy, nature of offences, burden of proof, powers and transactions.
The Foreign Exchange Management Act, 1999 came into force on 1 June 2000, replacing the Foreign Exchange Regulation Act (FERA, enacted in 1973), in line with liberalisation and current account convertibility.
Salient features: (i) objective: to facilitate external trade and payments and promote the orderly development of the foreign exchange market; (ii) current account transactions are free, subject only to reasonable restrictions notified by the Central Government; (iii) capital account transactions are allowed to the extent permitted by the RBI in consultation with the Government; (iv) contraventions are civil, punishable by a penalty of up to three times the sum involved, with imprisonment only for failure to pay; (v) adjudicating authorities and an Appellate Tribunal hear cases; the Enforcement Directorate investigates; (vi) residential status depends on stay of more than 182 days in a year.
How it deviates from FERA: (a) FERA aimed at conserving scarce foreign exchange; FEMA at managing it. (b) FERA violations were criminal offences with arrest without warrant; FEMA makes them civil. (c) Under FERA the accused had to prove innocence; under FEMA the burden lies on the authorities. (d) FERA meant everything was prohibited unless permitted; FEMA frees current account dealings. (e) FEMA is shorter and more transparent.
Serious money laundering is now dealt with separately under the PMLA, 2002, so FEMA marks a shift from control to facilitation.
Example 27 (UPSC 2022, 20 marks): What is the objective of exchange rate management? Do you think that the present regime of exchange rate management has been satisfactory in terms of building adequate foreign exchange reserves in India? Discuss.
Paper and question: Paper II, Q6(a)
Approach: State the objectives of exchange rate management, outline the regime, then evaluate reserve adequacy with data and standard metrics, noting costs and the 2022 drawdown, and conclude.
Objective: exchange rate management aims to keep the external value of the currency consistent with macroeconomic stability: to prevent excessive volatility and disorderly markets, maintain export competitiveness (a stable real effective exchange rate), avoid imported inflation, and build buffers against external shocks. In India the RBI pursues these under a managed float since 1993, without targeting any level.
Reserve building: reserves rose from about 5.8 billion dollars in March 1991 (barely weeks of imports) to a peak of about 642 billion in September 2021, as the RBI bought dollars during heavy capital inflows. During 2022, after the Russia–Ukraine war and US rate hikes, the RBI sold dollars to defend the rupee and reserves fell to about 525 billion in October 2022, then rebuilt to a record above 700 billion in September 2024.
Adequacy: by standard measures reserves are adequate: (i) import cover of about 9–11 months versus the traditional 3-month norm; (ii) reserves exceed short-term external debt by a wide margin (Greenspan–Guidotti rule); (iii) they cover a large share of total external debt; (iv) they are above the IMF's reserve-adequacy metric for emerging markets. They allowed India to absorb the 2013 taper tantrum, COVID-19 and the 2022 shock without a crisis.
Concerns: (i) India's reserves are largely 'borrowed', built from capital inflows rather than current account surpluses, so they can reverse; (ii) sterilisation and low returns on US Treasuries impose a cost of carry; (iii) heavy intervention may keep the rupee overvalued and hurt exports; (iv) the 2022 drawdown showed how fast reserves can fall.
On balance the regime has been satisfactory in building adequate reserves and preventing a 1991-type crisis, though reserves should complement, not replace, a stronger export base and fiscal discipline.
Example 28 (UPSC 2022, 15 marks): Differentiate between Current Account convertibility and Capital Account convertibility. What were the pre-conditions recommended by Tarapore Committee-I for adopting Capital Account convertibility.
Paper and question: Paper II, Q7(b)
Approach: Distinguish the two forms of convertibility (definition, scope, India's status), then list the Tarapore Committee-I (1997) preconditions with numbers.
Current account convertibility allows free conversion of the rupee into foreign currency for current transactions: trade in goods and services, interest and dividends, and remittances. India accepted IMF Article VIII obligations in August 1994. Capital account convertibility allows free conversion for transactions that change ownership of foreign assets and liabilities, such as FDI, portfolio investment, bank and corporate borrowing and residents' investment abroad; the Tarapore Committee defined it as the freedom to convert local financial assets into foreign financial assets and vice versa at market-determined rates. The first affects flows of income; the second, stocks of wealth, and it carries greater risk of sudden reversals. India's capital account is partly convertible.
Tarapore Committee-I (1997) preconditions, to be met over three years (1997–98 to 1999–2000): (i) the Centre's gross fiscal deficit cut from about 4.5% to 3.5% of GDP; (ii) a mandated inflation rate averaging 3–5% over three years; (iii) banks' gross NPAs reduced to 5% and the cash reserve ratio to 3%; (iv) adequate reserves (at least six months of imports) and a falling debt-service ratio, from about 25% to 20% of current receipts; (v) the real effective exchange rate kept within a band of ±5% around a neutral level; (vi) strengthening of the financial system and monetary autonomy.
The East Asian crisis (1997) and unmet fiscal targets led India to postpone full convertibility.
Example 29 (UPSC 2021, 20 marks): Define capital account convertibility. Examine Tarapore Committee (I and II) recommendations on capital account convertibility of rupee.
Paper and question: Paper II, Q8(a)
Approach: Define capital account convertibility, then examine Tarapore I (1997) and Tarapore II (2006) in turn (context, preconditions, roadmap, recommendations), and assess how far India followed them.
Capital account convertibility (CAC) is the freedom to convert local financial assets into foreign financial assets and vice versa at market-determined exchange rates (Tarapore Committee, 1997). It covers FDI, portfolio flows, external borrowing and residents' investment abroad, and goes beyond current account convertibility, which India adopted in 1994.
Tarapore Committee I (1997), set up by the RBI under S.S. Tarapore, recommended full CAC in three phases over 1997–98 to 1999–2000, subject to preconditions: the Centre's gross fiscal deficit cut to 3.5% of GDP; inflation averaging 3–5%; banks' gross NPAs reduced to 5% and CRR to 3%; reserves adequate for at least six months of imports; a lower debt-service ratio; and a real effective exchange rate kept within ±5% of a neutral level. The East Asian crisis of 1997 and unmet fiscal targets meant the roadmap was shelved.
Tarapore Committee II (2006), appointed after the Prime Minister's call to revisit the issue, proposed a five-year roadmap in three phases (2006–07, 2007–09, 2009–11): gradual increases in ECB limits, FII investment in government securities and the Liberalised Remittance Scheme limit for residents (raised in steps to 200,000 dollars by 2007); fiscal consolidation including a lower revenue deficit; bank strengthening; and monitoring of indicators such as the current account deficit and short-term debt. It also flagged risks from participatory notes and from large inflows appreciating the rupee.
Assessment: India adopted many liberalisation steps but not full CAC, especially after the 2008 crisis showed the dangers of open capital accounts. Fiscal preconditions remain unmet, though bank NPAs (about 2.3% in March 2025) and CRR (3% from November 2025) now meet Tarapore norms.
The committees' lasting contribution is the principle that convertibility should follow, not precede, macroeconomic and financial strength.
Example 30 (UPSC 2020, 10 marks): Do you think that Indian currency is fully convertible? Explain.
Paper and question: Paper II, Q5(d)
Approach: Answer directly (no): explain full current account convertibility and partial capital account convertibility, with examples of remaining restrictions.
No. The Indian rupee is fully convertible only on the current account and partly convertible on the capital account.
Current account: since August 1994, when India accepted IMF Article VIII, the rupee can be freely converted for trade in goods and services, interest, dividends and remittances, subject only to a few reasonable restrictions under FEMA, 1999.
Capital account: conversion for asset transactions is allowed only within limits. Non-residents enjoy fairly open access: FDI is automatic in most sectors, foreign portfolio investors can buy equities, and some government bonds have been fully open to them since 2020 (Fully Accessible Route). But residents face caps: individuals can remit only up to 250,000 dollars a year under the Liberalised Remittance Scheme; corporate overseas investment and external commercial borrowing are subject to limits; and FPI investment in corporate debt is capped.
The Tarapore Committees (1997, 2006) linked full convertibility to fiscal, inflation and banking preconditions, and India has preferred gradual opening after the East Asian (1997) and global (2008) crises.
Example 31 (UPSC 2019, 15 marks): Examine the role of capital account convertibility in controlling deficit in the current account of India's Balance of Payments (BOPs).
Paper and question: Paper II, Q4(b)
Approach: Use the BoP identity to show that capital account openness finances rather than controls the current account deficit, then examine its positive and negative roles with Indian episodes.
The balance of payments identity is CA + KA + ΔR = 0 (ignoring errors), where CA is the current account balance, KA the capital account (net financial inflows) and ΔR the change in reserves (an increase entered as negative). A current account deficit must be financed by net capital inflows or by drawing down reserves. Capital account convertibility therefore mainly helps to finance a CAD, not to control it.
Positive role: (i) freer FDI and portfolio inflows let India run a CAD of 1–2% of GDP to invest more than it saves, without losing reserves; (ii) FDI brings technology and export capacity, which can reduce the CAD over time; (iii) an open capital account disciplines policy, since markets punish large deficits.
Negative role: (i) large inflows appreciate the rupee in real terms, making exports dearer and imports cheaper, which widens the CAD; (ii) easy financing tempts countries into unsustainable deficits, as in India's 4.8% CAD in 2012–13; (iii) when flows reverse, as in the 2013 taper tantrum, a 'sudden stop' forces abrupt adjustment, a sharp depreciation and import curbs (India raised gold import duty in 2013).
Thus controlling the CAD depends on competitiveness, oil prices and fiscal discipline; capital account openness buys time but can also magnify risk, which is why India prefers stable FDI over volatile debt flows.
Example 32 (UPSC 2018, 20 marks): Do you believe that capital account convertibility is feasible under the present circumstances in India? Explain.
Paper and question: Paper II, Q8(a)
Approach: Define CAC and its benefits and risks, then judge feasibility in 2018 against the Tarapore preconditions with data of that time, adding the impossible trinity, and conclude for gradualism.
Capital account convertibility is the freedom to convert domestic financial assets into foreign ones and back at market rates. India has had current account convertibility since 1994 but keeps limits on residents' outflows and debt inflows.
Case for: access to cheaper global capital, risk diversification for residents, deeper financial markets, and a step towards rupee internationalisation. Case against: volatile 'hot money', sudden stops and contagion (East Asia 1997, global crisis 2008, taper tantrum 2013), and the impossible trinity (Mundell–Fleming): with free capital mobility India cannot have both a stable rupee and an independent monetary policy.
Preconditions in 2018: (i) fiscal: the Centre's fiscal deficit was about 3.5% of GDP in 2017–18 and the combined Centre-State deficit about 6%, against the Tarapore benchmark of 3.5% for the Centre and the FRBM goal of 3%; (ii) banking: gross NPAs peaked at about 11.2% in March 2018, far above the 5% norm, and banks were under stress; (iii) inflation: CPI inflation was around 4–5% under the new inflation-targeting framework (2016), broadly satisfactory; (iv) external: reserves of about 424 billion dollars (March 2018) were comfortable, but the CAD was widening (1.8% in 2017–18) as oil prices rose, and the rupee fell sharply in 2018; (v) CRR was 4%, above the 3% norm.
Judgement: with weak banks, high public debt and a rising CAD, full convertibility in 2018 would have exposed India to destabilising outflows; the rupee's fall in 2018 confirmed this.
Hence full CAC was not feasible then; India should continue calibrated liberalisation (FDI, equity, long-term debt first, short-term debt last) while cleaning up banks and consolidating its fiscal position.
Example 33 (UPSC 2017, 10 marks): Do you think the recent appreciation of Indian currency is harming India's exports? Can it have a beneficial side too? Explain in brief.
Paper and question: Paper II, Q5(e)
Approach: Explain how appreciation affects exports (price competitiveness, REER, labour-intensive sectors), then give the beneficial side (cheaper imports, lower inflation and debt cost), concluding with a balanced view.
In 2017 the rupee appreciated by about 6% against the US dollar (from about 68 to about 64 per dollar) because of strong portfolio and FDI inflows, and the real effective exchange rate rose further as Indian inflation exceeded partners'.
Harm to exports: yes, to a degree. Appreciation raises the foreign-currency price of Indian goods or squeezes exporters' rupee margins. Price-sensitive, labour-intensive exports such as textiles, leather, gems and jewellery and engineering goods, competing with Bangladesh, Vietnam and China, suffer most; merchandise exports were sluggish in 2017.
Beneficial side: (i) cheaper imports of crude oil, gold, electronics and capital goods reduce imported inflation, helping the RBI's 4% CPI target; (ii) the rupee cost of servicing external debt and ECBs falls; (iii) cheaper imported inputs help exporters who use them, such as gems and electronics.
Exports depend more on world demand and productivity than on the exchange rate alone, so the RBI aims to avoid prolonged overvaluation rather than to target a weak rupee.
Example 34 (UPSC 2016, 10 marks): "Partial Capital Account Convertibility cannot serve the purpose of integrating Indian Economy with World Economy". Critically examine.
Paper and question: Paper II, Q5(a)
Approach: Present the claim, then critically examine it: show the channels through which India is already integrated under partial convertibility, the gaps that remain, and conclude that integration does not require full convertibility.
The statement argues that unless capital moves freely, India cannot be fully integrated with world financial markets, since limits on outflows and debt flows keep domestic interest rates and asset prices partly insulated.
Against the statement: under partial capital account convertibility India has integrated deeply. Trade in goods and services rose to over 50% of GDP in the early 2010s; FDI is automatic in most sectors and inflows rose to over 40 billion dollars a year by 2015–16; foreign portfolio investors are major players in Indian equity markets; and Indian firms borrow abroad through ECBs and invest overseas. Restrictions apply mainly to residents' outflows and short-term debt, the riskiest flows.
Partly valid: limits on foreign holdings of government and corporate bonds keep the debt market shallow and the rupee little used internationally.
Partial convertibility has given India the benefits of integration while shielding it from crises such as East Asia (1997) and 2008, so the statement overstates the case; full convertibility should follow fiscal and banking strength.
Example 35 (UPSC 2015, 10 marks): Do you think that full convertibility of rupee on capital account will help in accelerating India's economic growth? Give reasons.
Paper and question: Paper II, Q1(d)
Approach: Give the theoretical case that full CAC raises growth, then the empirical evidence against it (Rodrik, Bhagwati, Prasad–Rajan–Subramanian) and India's experience, ending with a reasoned 'not necessarily'.
Theoretical case: full capital account convertibility lets capital flow from capital-rich to capital-scarce economies like India, raising investment beyond domestic savings, lowering the cost of capital, improving allocation and bringing financial deepening and discipline, all of which could accelerate growth.
Evidence against: (i) Rodrik (1998) found no significant link between capital account openness and growth across countries; (ii) Bhagwati (1998) argued that the gains from free capital flows are unproven while crises are costly, unlike free trade; (iii) Prasad, Rajan and Subramanian (2007) found that developing countries relying less on foreign capital grew faster; (iv) Kose, Prasad, Rogoff and Wei (2009) suggested benefits arise only above thresholds of institutional and financial development.
India's experience: India grew fast in 2003–2011 with only partial convertibility, while open economies of East Asia suffered the 1997 crisis. With a fiscal deficit above Tarapore norms and weak banks in 2015, full convertibility would raise vulnerability to sudden stops.
So full convertibility will not by itself accelerate growth; India should open gradually, favouring FDI, as preconditions are met.
Example 36 (UPSC 2014, 15 marks): Discuss the issues involved in Capital Account Convertibility. In the light of this, explain India's important Capital Account Liberalization measures.
Paper and question: Paper II, Q6(b)
Approach: Discuss the issues in CAC (preconditions, sequencing, impossible trinity, volatility), then list India's main capital account liberalisation measures up to 2014 by type of flow.
Issues in capital account convertibility: (i) Preconditions: the Tarapore Committees (1997, 2006) linked it to fiscal consolidation, low inflation, sound banks and adequate reserves. (ii) Sequencing: open FDI first, then equity portfolio flows, long-term debt, and short-term debt last, because short-term debt is the most volatile. (iii) Impossible trinity: free capital flows limit either exchange-rate stability or monetary independence. (iv) Volatility and contagion: sudden stops, as in East Asia (1997) and the 2013 taper tantrum, when the rupee fell from about 55 to 68 per dollar. (v) Real appreciation from surges of inflows, which hurts exports. (vi) Capital flight and tax evasion.
India's liberalisation measures: (a) FDI: automatic route from 1991, sectoral caps raised in stages (telecom, insurance to 49% in 2014–15, retail). (b) Portfolio: FIIs allowed from 1992, with limits on government and corporate debt raised over time; ADRs and GDRs for Indian firms (1992); Qualified Foreign Investors allowed in 2011–12. (c) Debt: external commercial borrowing under automatic and approval routes. (d) Outflows: Indian firms' overseas investment liberalised; the Liberalised Remittance Scheme (2004) began at 25,000 dollars a year, rose to 200,000 in 2007, was cut to 75,000 in 2013 and raised to 125,000 in June 2014. (e) NRI deposit schemes.
India's approach has been gradual and reversible, as the 2013 cut in the LRS limit showed.
Mains points
- Capital account convertibility returns almost every year: always give the definition (FEMA/RBI), the Tarapore I (1997) preconditions, Tarapore II (2006) roadmap and the impossible trinity before judging feasibility.
- For trade policy questions, trace the line from licensing and QRs to EXIM policies (1992 onward), FTPs (2004, 2009, 2015) and the open-ended FTP 2023, and judge results with 2025–26 trade and current account data.
- TRIPS questions reward specific Indian cases: Patents (Amendment) Act 2005, Section 3(d), Novartis (2013), the Natco compulsory licence (2012), PPV&FR Act 2001 and the Doha Declaration (2001).
- Exchange rate answers should explain the managed float (LERMS 1992, unified rate 1993, Article VIII 1994), RBI intervention and reserves, and recent rupee weakness, with a simple demand-supply diagram for the rupee.
- Examiners reward a balanced conclusion: India gains from integration but sequences opening with macroeconomic stability, so avoid one-sided praise or condemnation.
Did you know?
- In 1991 India's reserves fell to about two weeks of imports and gold was flown to London as collateral; by 2024–26 reserves were around 700 billion US dollars, roughly ten months of imports.
Economics Optional: All chapters
- Exam Pattern, Syllabus and Strategy
- Price Determination and Theories of Distribution
- Market Structures
- Welfare Economics
- Theories of Employment, Income and Interest
- Money and Monetary Management
- Public Finance
- Theories of International Trade
- Trade Policy, Protection and the WTO
- Balance of Payments and Exchange Rates
- Theories of Growth
- Economic Development
- Indian Economy in the Pre-Independence Era
- Planning in India
- Agriculture before Liberalisation
- Industry before Liberalisation
- National Income, Poverty and Inequality
- Agriculture after Liberalisation
- Industry after Liberalisation
- External Sector after Liberalisation
- Public Finance and Fiscal Federalism in India
- Monetary System and the RBI
- Employment, Wages and Poverty Alleviation