
Economics Optional · UPSC Notes
Public Finance and Fiscal Federalism in India — UPSC Economics Optional Notes
Free, exam-focused notes for UPSC Prelims and Mains, with Prelims tips and Mains points for every topic. 4 topics.
Open in the interactive reader: bookmarks, progress tracking and read-aloud.
Fiscal Deficits, the FRBM Act and Fiscal Consolidation
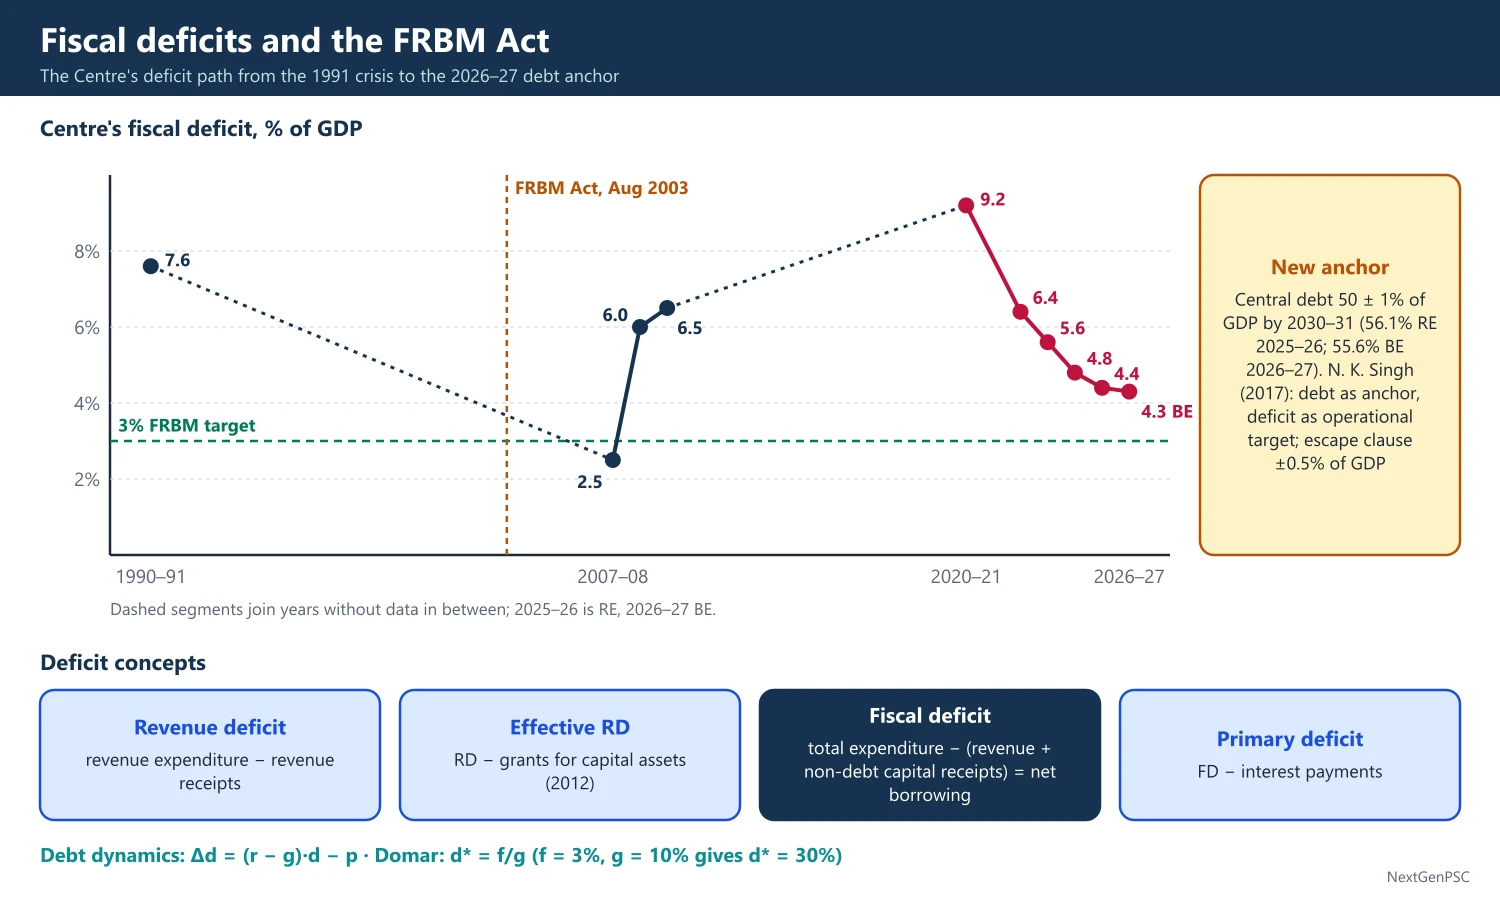
The fiscal deficit measures the government's total borrowing need. The FRBM Act, 2003 set rules to cut deficits, later revised on the advice of the N.K. Singh Committee (2017) to anchor policy on debt. After the COVID-19 spike (9.2% of GDP in 2020–21), the Centre brought its deficit to 4.4% in 2025–26 (RE) and budgeted 4.3% for 2026–27, with a new anchor of debt at 50 ± 1% of GDP by 2030–31.
In simple words
The fiscal deficit is how much more the government spends than it earns in a year, which it must borrow.
It is like a household that spends ₹1.1 lakh but earns ₹1 lakh; it borrows ₹10,000 and pays interest next year.
High deficits raise debt and interest costs and can crowd out private investment, so the FRBM Act sets limits and a path to bring debt down.
UPSC asks about deficit concepts, FRBM rules and whether consolidation is on track.
1. Deficit Concepts
Revenue deficit (RD): revenue expenditure minus revenue receipts; it shows borrowing used for consumption-type spending.
Effective revenue deficit: RD minus grants for creation of capital assets (introduced in the 2012 FRBM amendment), since grants to states for capital assets are recorded as revenue spending.
Fiscal deficit (FD): total expenditure minus (revenue receipts + non-debt capital receipts such as recovery of loans and disinvestment); it equals the government's net borrowing.
Primary deficit: FD minus interest payments; a primary surplus means current policies are reducing debt apart from interest.
Monetised deficit: the part of the deficit financed by RBI credit; automatic monetisation through ad hoc Treasury Bills ended on 1 April 1997 under a 1994 agreement and was replaced by Ways and Means Advances.
Quality of deficit: a deficit that funds capital expenditure is better than one that funds revenue spending (the 'golden rule' of borrowing only for investment).
2. Background to Fiscal Rules
1980s deterioration: rising subsidies, interest and defence spending pushed the Centre's fiscal deficit to about 7.6% of GDP in 1990–91 and the combined (Centre plus states) deficit to over 9%, a key cause of the 1991 crisis.
Early 1990s consolidation: deficits fell, but the Fifth Pay Commission (1997) and weak tax growth reversed gains by the early 2000s.
Rationale for rules: fiscal rules bind future governments against deficit bias (Buchanan and Wagner, Democracy in Deficit, 1977) and improve credibility; India followed international practice (e.g. the EU's Maastricht 3% and 60% criteria).
3. The FRBM Act, 2003 and Its Amendments
Passage: the Fiscal Responsibility and Budget Management Act was passed in August 2003 and its rules notified in July 2004.
Targets: eliminate the revenue deficit and cut the fiscal deficit to 3% of GDP by 31 March 2008 (later moved to 2009), with annual cuts of at least 0.3% of GDP in FD and 0.5% in RD.
Transparency: required the Medium-Term Fiscal Policy Statement, Fiscal Policy Strategy Statement and Macroeconomic Framework Statement with the Budget; barred the RBI from buying primary issues of government securities from 2006.
Twelfth Finance Commission link: it made debt relief for states conditional on enacting fiscal responsibility laws; all states passed FRLs by the late 2000s.
Success then pause: the Centre's FD fell to about 2.5% of GDP in 2007–08, but the global financial crisis led to stimulus and the targets were suspended (FD about 6% in 2008–09 and 6.5% in 2009–10).
2012 amendment: introduced the effective revenue deficit target and a Medium-Term Expenditure Framework Statement.
2015 and 2018 amendments: the 2018 amendment (through the Finance Act) adopted the N.K. Singh Committee's debt anchor: general government debt of 60% of GDP and Central debt of 40% by 2024–25, FD of 3% by March 2021, and an escape clause.
4. N.K. Singh FRBM Review Committee (2017)
Debt as anchor: general government debt of 60% of GDP by 2023 (40% Centre, 20% states), with the fiscal deficit as the operational target.
Glide path: Central FD of 3% by 2019–20 and 2.5% by 2022–23; revenue deficit cut by 0.25 point a year.
Escape clause: a deviation of up to 0.5% of GDP for national security, war, national calamity, collapse of agriculture, far-reaching structural reforms, or a sharp fall in real output growth of at least 3 points below the average of the previous four quarters.
Fiscal Council: recommended an independent Fiscal Council to make forecasts and assess compliance; it has not been set up.
Dissent: the then CEA Arvind Subramanian dissented on making debt the anchor, preferring the fiscal deficit as more controllable.
5. Consolidation Path since COVID-19
Spike: the Centre's FD rose to 9.2% of GDP in 2020–21 as revenues fell and spending on food, health and relief rose; off-budget borrowings (such as FCI's NSSF loans) were brought onto the budget for transparency.
Glide path announced (Budget 2021–22): bring FD below 4.5% of GDP by 2025–26.
Outcome: FD fell to 6.4% (2022–23), 5.6% (2023–24), 4.8% (2024–25) and 4.4% in 2025–26 (revised estimate), meeting the target.
Budget 2026–27: FD budgeted at 4.3% of GDP; from now on annual deficits are derived from a debt target of 50 ± 1% of GDP for Central government debt by 2030–31; Central debt was estimated at 56.1% (RE 2025–26) and 55.6% (BE 2026–27).
Composition shift: Central capital expenditure rose to about 3% of GDP or more in recent budgets, improving the quality of spending, while the revenue deficit fell.
States: the Fifteenth Finance Commission allowed states a fiscal deficit of 3% of GSDP plus an extra 0.5% tied to power sector reforms; 50-year interest-free loans to states for capital spending have been provided since 2020–21.
6. Debt Sustainability: Theory
Debt dynamics: Δd = (r − g)·d − p, where d is the debt-GDP ratio, r the interest rate, g nominal growth and p the primary balance; when g exceeds r, debt can fall even with small primary deficits.
Domar condition (1944): with a constant deficit ratio f and nominal growth g, the debt ratio converges to d* = f/g; for example, f = 3% and g = 10% gives d* = 30%.
Crowding out: high government borrowing raises interest rates and reduces private investment (classical view); Keynesians argue that in a slump deficits crowd in investment through demand.
Ricardian equivalence: Barro (1974) argued that rational households save more when deficits rise because they expect future taxes, so deficits do not change demand; evidence for India is weak.
Functional finance: Abba Lerner argued that fiscal policy should target full employment and stable prices rather than a balanced budget.
Multipliers: RBI and other studies find higher multipliers for capital expenditure than for revenue spending, supporting capex-led consolidation (estimates vary).
7. Diagrams to Draw
Deficit trend chart: draw the Centre's FD as % of GDP from 1990–91 to 2026–27; mark FRBM 2003, the 2008–09 pause, the 2020–21 spike (9.2%) and the glide path to 4.3%.
Crowding out (IS-LM): draw IS shifting right after a rise in G; the interest rate rises from r1 to r2; show that the actual rise in Y is less than the horizontal shift of IS; the gap is crowding out.
Loanable funds: draw saving (supply) and investment (demand) against the interest rate; government borrowing shifts demand right, raising r and reducing private investment.
8. Using It in the Exam
10-mark answer: define the four deficits, give FRBM 2003 targets and the latest FD figure.
15/20-mark answer: trace fiscal rules (FRBM 2003, 2012, 2018), the N.K. Singh Committee, the COVID spike and glide path, the shift to a debt anchor in 2026–27, and the debt dynamics equation.
Keywords: fiscal deficit, primary deficit, effective revenue deficit, escape clause, debt anchor, r − g, crowding out, golden rule.
Quotable line: the N.K. Singh Committee's view that debt should be the medium-term anchor and the fiscal deficit the operational target (paraphrased).
| Year | Fiscal deficit | Note |
|---|---|---|
| 1990–91 | About 7.6% | Pre-crisis peak |
| 2007–08 | About 2.5% | FRBM success |
| 2009–10 | About 6.5% | Post-crisis stimulus |
| 2020–21 | 9.2% | COVID-19 |
| 2024–25 | 4.8% | Glide path |
| 2025–26 (RE) | 4.4% | Below 4.5% target met |
| 2026–27 (BE) | 4.3% | Debt anchor 50 ± 1% by 2030–31 |
Mains points
- Define all deficit concepts with formulas before discussing policy.
- Give the FRBM timeline: 2003 Act, 2004 rules, 2008–09 pause, 2012 and 2018 amendments.
- Explain the N.K. Singh Committee's debt anchor and escape clause with conditions.
- Use current numbers: 9.2% (2020–21), 4.4% (2025–26 RE), 4.3% (2026–27 BE), debt 50 ± 1% by 2030–31.
- Add the debt dynamics equation (r − g) to show analytical depth.
- Common mistake: treating all deficits as bad; distinguish capex-financing deficits from revenue deficits.
Did you know?
- Memory trick for FD: 'Borrowing = Spending − Earning − Selling' (selling = disinvestment and loan recoveries).
Finance Commissions and Fiscal Federalism
Fiscal federalism deals with how taxing and spending powers are divided between levels of government. In India the Centre raises most revenue while states spend most, creating a vertical fiscal imbalance, corrected by Finance Commissions under Article 280. The Twelfth Finance Commission (C. Rangarajan, 2005–10) linked debt relief to fiscal responsibility laws; the Sixteenth (Arvind Panagariya, 2026–31) kept states' share at 41% and added contribution to GDP as a criterion.
In simple words
In India the Centre collects most taxes, but states run schools, hospitals, police and farming, so money must be shared; this is fiscal federalism.
It is like a joint family where the main earner hands each member a share for their duties.
Every five years a Finance Commission decides what share of central taxes goes to states and how it is split among them using a formula.
UPSC asks about Finance Commission criteria, especially the Twelfth and the latest, and Centre-state tensions.
1. Concepts and Theory
Fiscal federalism: the assignment of functions, taxes and transfers across levels of government; Musgrave's three functions place stabilisation and distribution mainly with the Centre and allocation partly with lower levels.
Decentralisation theorem: Wallace Oates (Fiscal Federalism, 1972) argued that public goods should be provided by the lowest level of government that covers their benefits, unless there are economies of scale or spillovers.
Tiebout model (1956): people 'vote with their feet' among local governments, revealing preferences for public goods.
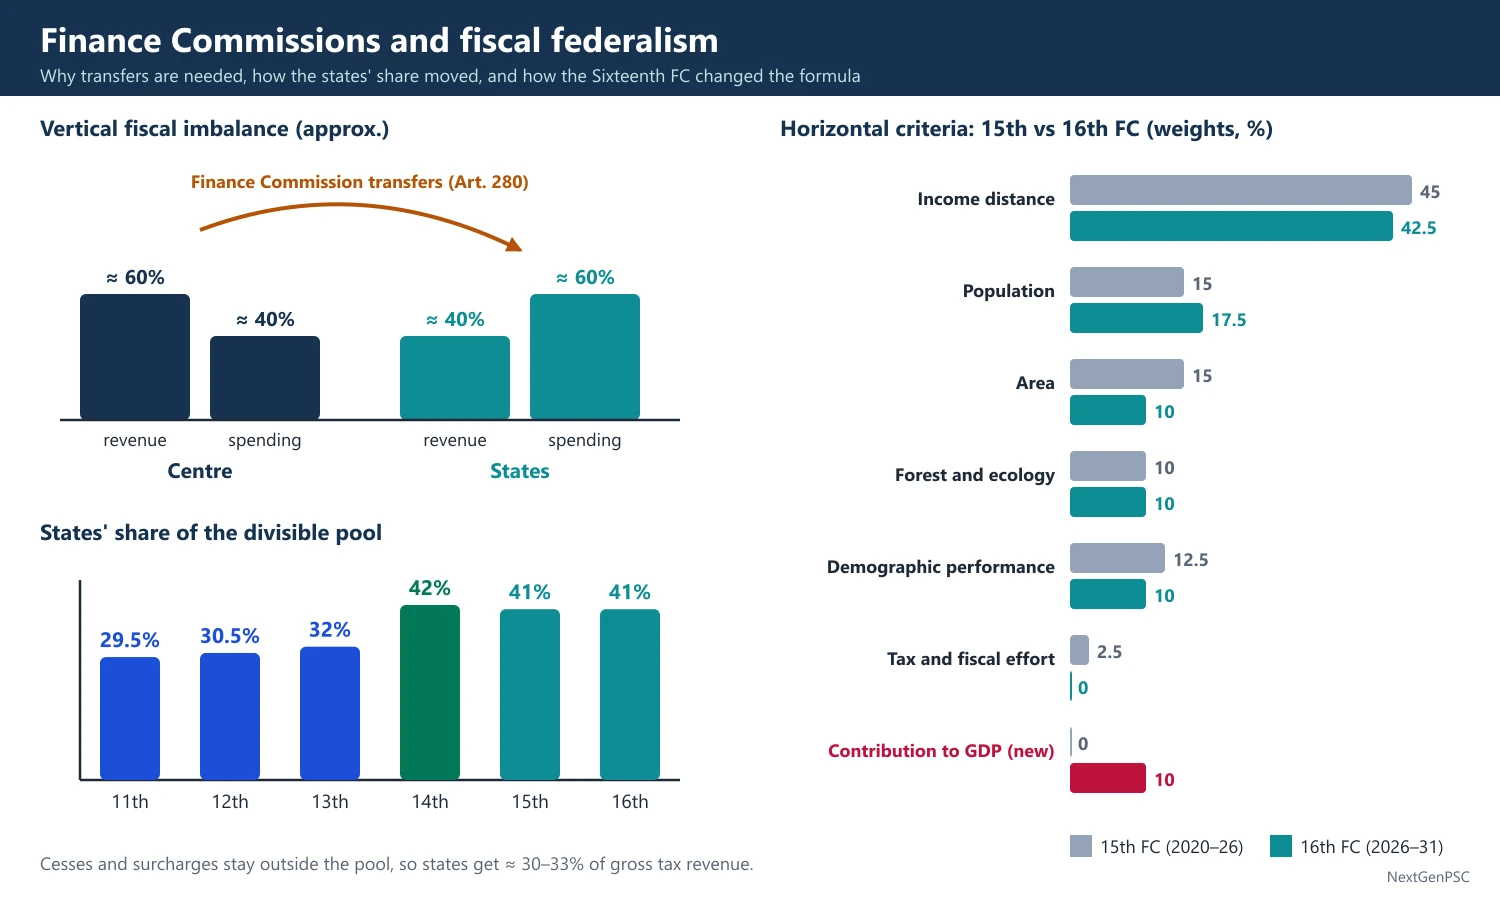
Vertical fiscal imbalance: the Centre raises about 60% of combined revenue while states carry about 60% of combined expenditure (approximate shares in recent years), so transfers are needed.
Horizontal imbalance: states differ widely in revenue capacity and needs; equalisation transfers aim to let all states provide comparable services at comparable tax effort.
Constitutional provisions: Article 270 (sharing of central taxes), Article 275 (grants-in-aid), Article 280 (Finance Commission), Article 282 (discretionary grants), Article 293 (state borrowing), Article 279A (GST Council).
Divisible pool: since the 80th Amendment (2000), following the Tenth Finance Commission's alternative scheme, all central taxes are shareable except cesses, surcharges and cost of collection.
2. Finance Commissions over Time
First FC: (1951, K.C. Neogy) shared income tax and some excise duties; early commissions set the template of tax shares plus grants.
Tenth FC: (K.C. Pant, 1995–2000) proposed sharing 29% of gross central tax revenue (the alternative scheme of devolution), implemented by the 80th Amendment.
Eleventh FC: (A.M. Khusro, 2000–05) 29.5% of the divisible pool; linked part of grants to a fiscal reform facility.
Twelfth FC: (C. Rangarajan, 2005–10) raised the share to 30.5%; created the Debt Consolidation and Relief Facility, rescheduling central loans to states at lower interest with write-offs linked to cutting revenue deficits, conditional on states enacting fiscal responsibility legislation; recommended ending central loans to states so states borrow from the market; gave grants for health, education, roads and buildings and maintenance; and targeted elimination of revenue deficits with state fiscal deficits of 3% of GSDP by 2008–09.
Thirteenth FC: (Vijay Kelkar, 2010–15) 32%; recommended a 'grand bargain' for GST with compensation and a revised fiscal consolidation roadmap.
Fourteenth FC: (Y.V. Reddy, 2015–20) raised the share sharply to 42%, the largest jump, favouring untied transfers; introduced forest cover as a criterion and dropped revenue-need-based approaches; the Centre reduced its share in centrally sponsored schemes in response.
Fifteenth FC: (N.K. Singh, 2020–26) 41% (after Jammu and Kashmir became a Union Territory); criteria: income distance 45%, population (2011) 15%, area 15%, forest and ecology 10%, demographic performance 12.5% and tax and fiscal efforts 2.5%; it also gave revenue deficit, sector-specific, state-specific and local body grants.
3. Sixteenth Finance Commission (2026–31)
Constitution: set up on 31 December 2023 under Arvind Panagariya; its report was submitted on 17 November 2025 and tabled in Parliament on 1 February 2026; the award covers 2026–27 to 2030–31.
Vertical share: retained states' share at 41% of the divisible pool, though 18 states had sought 50%; the government accepted this.
New criterion: introduced a state's contribution to national GDP with a 10% weight, rewarding economic performance; to make room, it reduced income distance and demographic performance by 2.5 points each and area by 5 points, and dropped the tax effort criterion (2.5); population's weight also rose from 15 to 17.5 (weights as reported).
Reported weights: population 17.5%, demographic performance 10%, area 10%, forest 10%, income distance 42.5% and contribution to GDP 10% (as reported in analyses of the report).
Grants: discontinued revenue deficit grants and sector- and state-specific grants recommended by the Fifteenth Commission; ICRA estimated that 14 of 28 states would gain in their share.
4. Issues in Indian Fiscal Federalism
Cesses and surcharges: these stay outside the divisible pool; their rising share means states receive much less than 41% of gross central tax revenue (estimates of about 30–33% in recent years).
Centrally sponsored schemes: tied transfers with matching requirements limit state autonomy; after the Planning Commission was replaced by NITI Aayog (1 January 2015), plan grants ended and CSS were rationalised.
GST and fiscal autonomy: states gave up taxes like VAT and entry tax to the GST pool; the end of GST compensation in June 2022 hurt some states' revenues.
Population criterion: southern states argue that using population penalises them for controlling fertility; the demographic performance criterion was added (Fifteenth FC) to address this.
Borrowing limits: the Centre sets state borrowing limits under Article 293(3); off-budget borrowings of state entities are now counted, which some states dispute (e.g. Kerala's 2023–24 Supreme Court petition).
Local bodies: 73rd and 74th Amendments (1992) created a third tier, but municipal finances remain weak; FCs give grants to local bodies.
5. Diagrams to Draw
Fiscal gap diagram: draw two bars, one for the Centre (revenue tall, expenditure shorter) and one for states (revenue short, expenditure taller); draw an arrow labelled 'FC transfers' from the Centre's surplus to the states' gap.
Devolution trend chart: draw the states' share from the Eleventh to the Sixteenth FC (29.5%, 30.5%, 32%, 42%, 41%, 41%).
Criteria pie charts: draw two pies comparing Fifteenth and Sixteenth FC weights, highlighting the new GDP contribution slice.
6. Theory and Debates
Equity vs efficiency: income distance favours poorer states (equity); the GDP contribution criterion rewards richer states (efficiency and incentive); the Sixteenth FC tried to balance both.
Soft budget constraint: bailouts of states can weaken fiscal discipline (Rodden and others); the Twelfth FC's conditional debt relief tried to address this.
Cooperative vs competitive federalism: the GST Council is seen as cooperative federalism; state rankings on business reforms foster competitive federalism.
Gadgil formula (1969): used for plan transfers before 2015, weighting population, per capita income, tax effort and special problems; the Gadgil-Mukherjee formula (1991) revised it.
7. Examples and Applications
Bihar and Uttar Pradesh: receive the largest shares because of population and income distance.
Tamil Nadu, Karnataka and Kerala: have argued that they receive far less per rupee of tax contributed, fuelling a debate on 'fiscal transfers from south to north'.
Germany and Australia: use explicit equalisation formulas (Australia's Commonwealth Grants Commission), useful comparisons for India.
8. Using It in the Exam
10-mark answer: define vertical and horizontal imbalance, give the Twelfth FC's main recommendations and the Sixteenth FC's share and new criterion.
15/20-mark answer: add theory (Musgrave, Oates), FC history with shares, the cess issue, GST compensation, CSS and debates on equity vs efficiency.
Keywords: vertical fiscal imbalance, divisible pool, Debt Consolidation and Relief Facility, income distance, demographic performance, contribution to GDP, cesses and surcharges.
Quotable line: Oates' decentralisation theorem that public goods are best provided by the lowest level of government that captures their benefits (paraphrased).
| FC | Chair | Period | States' share | Notable feature |
|---|---|---|---|---|
| 11th | A.M. Khusro | 2000–05 | 29.5% | First after 80th Amendment |
| 12th | C. Rangarajan | 2005–10 | 30.5% | Debt relief linked to FRLs; end of central loans to states |
| 13th | Vijay Kelkar | 2010–15 | 32% | GST grand bargain |
| 14th | Y.V. Reddy | 2015–20 | 42% | Largest jump; forest cover criterion |
| 15th | N.K. Singh | 2020–26 | 41% | Demographic performance; 2011 population |
| 16th | Arvind Panagariya | 2026–31 | 41% | Contribution to GDP criterion (10%); revenue deficit grants ended |
Mains points
- Explain vertical and horizontal imbalance with the constitutional basis (Articles 270, 275, 280).
- Give the Twelfth FC in detail since the syllabus names it: 30.5%, DCRF linked to FRLs, end of central loans.
- Compare Fourteenth, Fifteenth and Sixteenth FC criteria with weights.
- Raise the cess and surcharge issue and its effect on effective devolution.
- Discuss equity vs efficiency and the southern states' concerns.
- Common mistake: saying states get 41% of all central taxes; it is 41% of the divisible pool.
Did you know?
- Memory trick for recent FC shares: '29.5, 30.5, 32, 42, 41, 41' — one big jump at the Fourteenth.
- Two economists who chaired Finance Commissions, C. Rangarajan and Y.V. Reddy, were also RBI Governors.
Tax Reforms and GST
India's tax reforms since 1991, guided by the Chelliah Committee (1991–93) and Kelkar Task Forces (2002, 2004), cut rates, widened the base and moved indirect taxes towards a value added tax. The Goods and Services Tax (1 July 2017) replaced most central and state indirect taxes with a destination-based dual tax, run by the GST Council. GST 2.0 (22 September 2025) simplified it to two main slabs of 5% and 18% plus a 40% rate for demerit goods.
In simple words
GST is one tax on goods and services across India, replacing a tangle of central and state taxes like excise, VAT and service tax.
Before GST, tax was charged on tax at each step, like paying toll at every state border; GST gives credit for tax already paid so only value added is taxed.
Tax reforms since 1991 cut rates and widened the base so more people pay less, and GST created a common national market.
UPSC asks about tax reform committees, GST design, the GST Council and fiscal federalism.
1. Principles and Concepts
Canons of taxation: Adam Smith's equity, certainty, convenience and economy; modern additions are efficiency (low deadweight loss), simplicity and buoyancy.
Tax buoyancy: percentage change in tax revenue divided by percentage change in GDP; buoyancy above 1 means revenue grows faster than the economy.
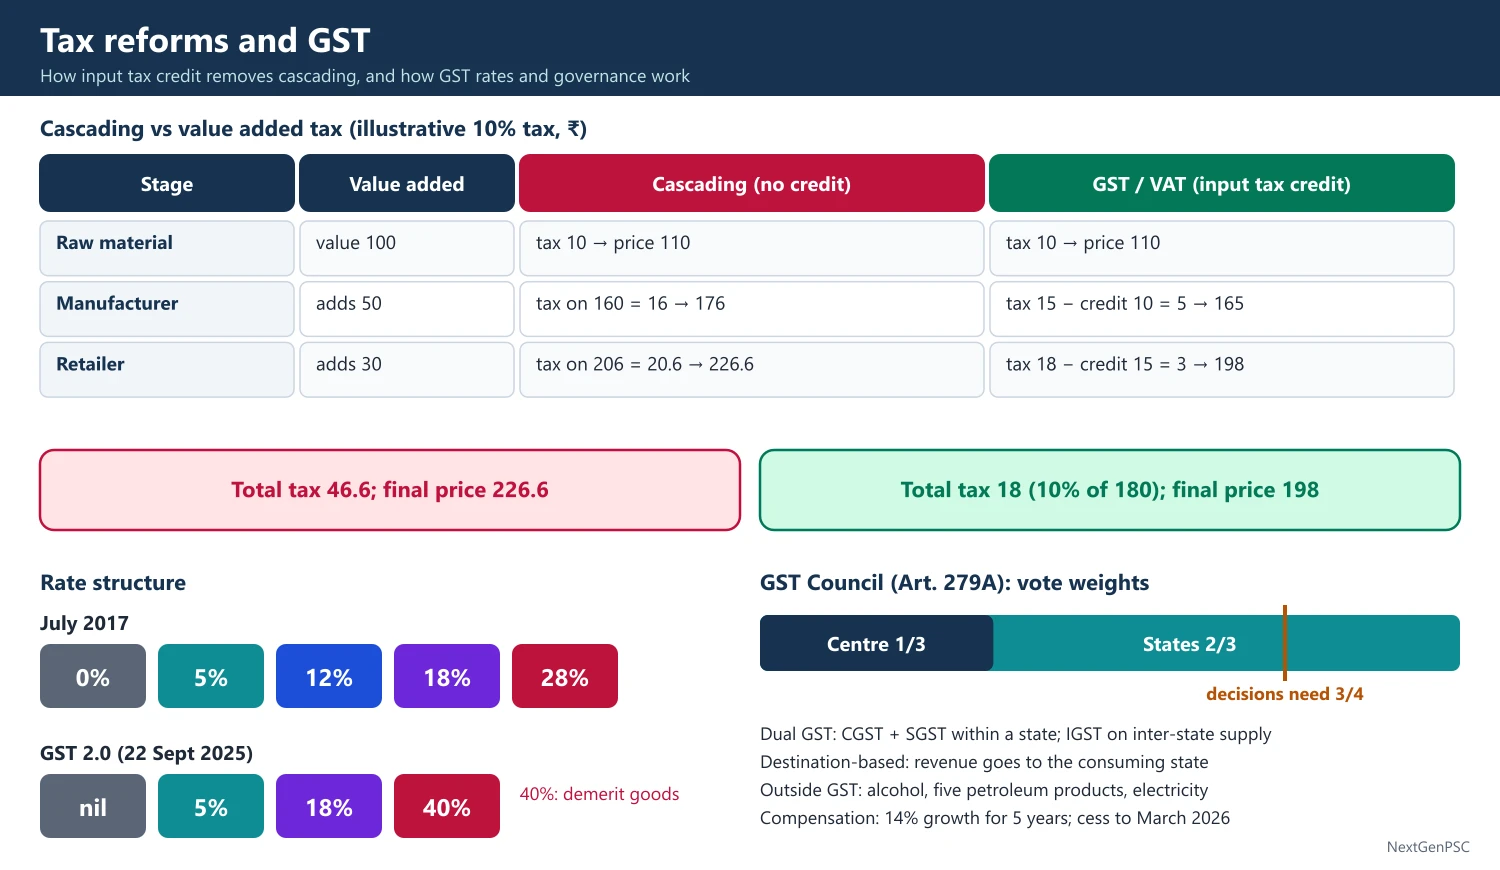
Cascading: tax on tax when inputs are taxed and no credit is given; it raises costs and distorts production choices.
Value added tax: tax at each stage on value added, collected by the invoice-credit method; output tax minus input tax credit.
Optimal taxation: Ramsey (1927) showed that commodity taxes should be inversely related to demand elasticities; Mirrlees (1971) analysed optimal income taxes; these guide trade-offs between efficiency and equity.
Laffer curve: tax revenue first rises and then falls as tax rates rise; lower rates can raise revenue if rates are very high (used to justify India's cuts from very high marginal rates in the 1970s).
2. Pre-1991 Tax Structure
High rates: the top marginal income tax rate including surcharge reached 97.75% in 1973–74, encouraging evasion and black money.
Indirect taxes: central excise and customs dominated; customs duties were among the highest in the world; state sales taxes cascaded.
MODVAT (1986): following the Long Term Fiscal Policy (1985) under V.P. Singh, a modified VAT gave credit for excise paid on inputs, a first step towards VAT.
3. Reforms since 1991
Tax Reforms Committee (Raja Chelliah, 1991–93): recommended lower and fewer rates for income and corporate taxes, a broader base, lower customs duties (peak towards 50% by 1995–96 and lower later), conversion of excise to a VAT and taxation of services.
Service tax (1994): introduced by Manmohan Singh on three services and expanded to a negative list in 2012.
Kelkar Task Forces (2002): on direct and indirect taxes recommended raising the exemption limit, removing many exemptions, PAN and TIN-based information systems and a national VAT; the 2004 Task Force on implementing the FRBM Act proposed a comprehensive GST.
CENVAT (2000) and state VAT (April 2005): converted central excise and state sales taxes into VAT-type taxes; an Empowered Committee of State Finance Ministers (Asim Dasgupta) coordinated state VAT and later GST design.
Direct taxes: rates fell (top personal rate 30% from 1997–98), securities transaction tax (2004), dividend distribution tax (1997, abolished 2020), wealth tax abolished (2015).
Direct Taxes Code: drafted in 2009–10 but not enacted; its ideas reappeared in later reforms.
Corporate tax cut (September 2019): base rate of 22% without exemptions and 15% for new manufacturing companies.
New personal tax regime: optional from 2020 and default from 2023; Budget 2025–26 made income up to ₹12 lakh effectively tax-free under it through a rebate.
Income-tax Act, 2025: a simplified law replacing the Income-tax Act, 1961, in force from 1 April 2026.
Collections: net direct tax collections were about ₹23.4 lakh crore in 2025–26 (Income Tax Department), and direct taxes now form over half of the Centre's gross tax revenue.
4. GST Design
Constitution (101st Amendment) Act, 2016: inserted Article 246A (concurrent power to tax goods and services), Article 269A (IGST on inter-state supplies) and Article 279A (GST Council); GST began on 1 July 2017.
Dual GST: CGST and SGST on intra-state supplies, IGST on inter-state supplies and imports; destination-based, so revenue accrues to the consuming state.
Taxes subsumed: central excise, service tax, additional customs duties, state VAT, entry tax, luxury and entertainment taxes (except by local bodies) and others.
Outside GST: alcohol for human consumption, and five petroleum products (crude, petrol, diesel, ATF and natural gas) until the Council decides; electricity is also outside.
GST Council: chaired by the Union Finance Minister with state finance ministers; the Centre has one-third of the vote weight and the states two-thirds; decisions need a three-fourths majority; in Mohit Minerals (May 2022) the Supreme Court held its recommendations to be persuasive, not binding.
Revenue Neutral Rate: the Arvind Subramanian committee (2015) suggested an RNR of about 15–15.5% and a standard rate of 17–18%.
Compensation: the GST (Compensation to States) Act, 2017 guaranteed states 14% annual revenue growth for five years (to June 2022) through a compensation cess; the cess was extended to March 2026 to repay loans of about ₹2.69 lakh crore taken in 2020–22 to pay states.
Technology: GSTN, e-way bills (2018) and e-invoicing (2020) improved compliance; the GST Appellate Tribunal was set up to settle disputes.
5. GST 2.0 (September 2025)
Decision: the 56th GST Council meeting on 3 September 2025 approved a simpler structure, effective 22 September 2025.
Rates: two main slabs of 5% (essentials and mass-consumption items) and 18% (standard), with the 12% and 28% slabs removed; a special 40% rate for demerit and luxury goods such as tobacco products, pan masala, aerated sugary drinks and large cars; special low rates remain for items such as precious metals.
Compensation cess: phased out, with tobacco products moving to the new rate structure once the cess-funded loans were cleared.
Aims: reduce classification disputes, correct inverted duty structures, lower prices of common goods and boost consumption.
Collections: gross GST collections were about ₹22 lakh crore in 2024–25 and grew about 8% in 2025–26, with monthly gross collections near ₹2 lakh crore (Finance Ministry data).
6. Diagrams to Draw
Cascading vs VAT: draw a three-stage chain (raw material, manufacturer, retailer) with values; under cascading, tax is charged on the full value including earlier tax; under GST, input tax credit is deducted; show the lower final price.
Tax incidence: draw D and S and a specific tax shifting S up; the burden split between buyers and sellers depends on relative elasticities; inelastic demand means consumers bear more.
Laffer curve: draw tax revenue on the y-axis against tax rate on the x-axis, rising to a maximum at t* and then falling.
7. Theory and Debates
Fiscal federalism: GST pooled states' sovereignty; the Council is a model of cooperative federalism, but states lost tax autonomy and depend on compensation and devolution.
Regressivity: indirect taxes fall more heavily on the poor; lower rates on essentials (5% or nil) aim to offset this.
Petroleum and alcohol: keeping them out preserves state revenue but breaks the input credit chain.
Tax-GDP ratio: India's general government tax-GDP ratio of about 17–18% is low compared with OECD averages; reforms aim to widen the base rather than raise rates.
International tax: India joined the OECD two-pillar framework discussions on a 15% global minimum tax and abolished its equalisation levies on digital services (2% in 2024 and 6% from April 2025).
8. Using It in the Exam
10-mark answer: list GST's key features (dual, destination-based, Council, compensation) and GST 2.0 rates.
15/20-mark answer: trace tax reforms (Chelliah, Kelkar, VAT, GST), explain cascading with an example, analyse GST's effect on federalism and revenue, and assess GST 2.0.
Keywords: cascading, input tax credit, destination principle, GST Council, RNR, compensation cess, GST 2.0, tax buoyancy, Laffer curve.
Quotable line: the Kelkar Task Force (2004) called GST the logical next step to a comprehensive value added tax across goods and services (paraphrased).
| Feature | July 2017 design | GST 2.0 (from 22 September 2025) |
|---|---|---|
| Main slabs | 0, 5, 12, 18, 28% | 5% and 18% (plus nil) |
| Demerit goods | 28% plus compensation cess | 40% special rate |
| Compensation cess | For five years, extended to March 2026 | Phased out |
| Aim | Revenue neutrality and transition | Simplicity, lower prices, fewer disputes |
| Committee | Year | Key recommendation |
|---|---|---|
| Long Term Fiscal Policy | 1985 | MODVAT (1986) |
| Chelliah Tax Reforms Committee | 1991–93 | Lower rates, wider base, lower customs, VAT |
| Kelkar Task Forces | 2002 | Fewer exemptions, information systems, national VAT |
| Kelkar Task Force on FRBM | 2004 | Comprehensive GST |
| Arvind Subramanian Committee | 2015 | RNR 15–15.5%, standard rate 17–18% |
Mains points
- Trace reforms through committees: LTFP 1985, Chelliah 1991–93, Kelkar 2002 and 2004, Subramanian 2015.
- Explain cascading and input tax credit with a numerical chain; examiners value it.
- Cover GST's constitutional basis (101st Amendment, Articles 246A, 269A, 279A) and Council voting rules.
- Assess GST 2.0 (5%, 18%, 40%) and the end of compensation with current collections data.
- Link GST to fiscal federalism and state autonomy.
- Common mistake: saying petrol is under GST; it is constitutionally included but not yet taxed under GST.
Did you know?
- GST was launched at a midnight session of Parliament on 30 June–1 July 2017, echoing the midnight session of 14–15 August 1947.
- Memory trick for GST 2.0: '5–18–40' — essentials, standard, sin.
UPSC Previous Year Questions: Public Finance and Fiscal Federalism in India
From 2014 to 2026 UPSC asked 26 question parts (380 marks) on public finance and fiscal federalism in India, all in Paper II. The most-asked area is the FRBM Act and fiscal consolidation (12 parts), followed by Finance Commissions and fiscal federalism (9, especially the Twelfth and Fourteenth Commissions) and tax reforms and GST (5). Every question below has a model answer written to the UPSC word limit.
In simple words
Read the question and its Approach line, then write your own answer within UPSC time (about 7 minutes for 10 marks, 11 for 15 and 14 for 20).
Then compare with the model answer: did you give the Act or Commission with its year, the exact targets and shares, recent deficit data and a balanced judgement?
Make a one-page sheet of numbers (FRBM targets, Finance Commission shares and criteria, deficit path to 2026–27, GST 2.0 rates) and revise it often.
1. Fiscal Deficits, the FRBM Act and Fiscal Consolidation
Example 1 (UPSC 2026, 10 marks): Explain the core objectives of the Fiscal Responsibility and Budget Management (FRBM) Act, 2003. Has it been successful?
Paper and question: Paper II, Q5(c)
Approach: List the core objectives and targets of the FRBM Act, then judge its success in phases (2004–08, suspension, amendments, COVID, glide path) with deficit data.
The Fiscal Responsibility and Budget Management Act, 2003 (in force July 2004) aimed to ensure intergenerational equity, long-term macroeconomic stability and transparency by binding the Centre to rules: eliminate the revenue deficit and cut the fiscal deficit to 3% of GDP (deadline later set at March 2009), limit guarantees, stop RBI primary subscription to government securities (from 2006), and present medium-term fiscal statements to Parliament.
Success: (i) the fiscal deficit fell from 4.5% of GDP in 2003–04 to 2.5% in 2007–08; (ii) the targets were suspended for the 2008–09 stimulus, and the deficit rose to 6.5% in 2009–10; (iii) amendments in 2012 (effective revenue deficit) and 2018 (debt anchor of 40% for the Centre, escape clause) reset goals; (iv) COVID-19 pushed the deficit to 9.2% in 2020–21; (v) a glide path reduced it to 4.4% in 2025–26 (RE) and 4.3% in 2026–27 (BE), with a debt target of about 50% by 2030–31.
So the Act built fiscal transparency, but its numerical targets were repeatedly postponed; it is a partial success.
Example 2 (UPSC 2024, 20 marks): Discuss the changes made by the Government of India in the fiscal policy since liberalisation. How far these changes proved to be conducive to growth with social justice in the country? Discuss.
Paper and question: Paper II, Q4(a)
Approach: Trace fiscal policy changes since 1991 in phases (stabilisation, tax reform, FRBM, rights-based spending, GST, capex push), then assess growth and social justice outcomes with data, ending with a balanced view.
In 1990–91 the Centre's fiscal deficit was about 7.6% of GDP, contributing to the balance of payments crisis. Fiscal policy since then has changed in five main ways.
Changes: (i) Stabilisation (1991–97): deficit cut, subsidies trimmed and automatic monetisation of deficits through ad hoc treasury bills ended in 1997. (ii) Tax reform on the Chelliah Committee (1991–93) lines: lower rates and broader base; the top income tax rate fell from 56% to 30%, peak customs duty from over 150% to about 10%, and corporate tax was cut to 22% (15% for new manufacturing firms) in 2019; CENVAT (2000), state VAT (2005) and GST (2017; GST 2.0 in 2025). (iii) Rule-based policy: FRBM Act 2003, amendments of 2012 and 2018, debt anchor. (iv) Rights-based social spending: MGNREGA (2005), RTE (2009), NFSA (2013), and later PM-KISAN (2019) and free foodgrains under PMGKAY. (v) Better targeting and quality of spending: direct benefit transfer with JAM (from 2013), and a public capex push to about 3% of GDP after 2020.
Growth: GDP growth rose from about 3.5% in the planning era to 6–7% on average after 1991, and 8% or more in 2003–08 and recently; lower tax rates and better compliance raised buoyancy, and public capex crowded in private investment.
Social justice: multidimensional poverty fell from 29.2% in 2013–14 to 11.3% in 2022–23 (NITI Aayog, 2024), and welfare schemes reached more people through DBT. But concerns remain: spending on health (about 2% of GDP) and education (under 5%) remains low; indirect taxes are regressive; consolidation often cut capital and social spending first; and income and wealth inequality has risen.
Thus fiscal policy has moved from deficit-driven expansion to rule-based, growth-and-welfare-oriented management, with social justice still work in progress.
Example 3 (UPSC 2022, 10 marks): Discuss the desirability of increased public expenditure in India in recent years.
Paper and question: Paper II, Q5(e)
Approach: Explain why higher public spending after 2020 was desirable (COVID, capex multiplier, crowding in, welfare), then note the limits (deficit, debt, quality), and conclude.
Public expenditure rose sharply in India after 2020, first for COVID-19 relief and then as a deliberate capital expenditure push: the Centre's capex rose from about ₹3.4 lakh crore in 2019–20 to ₹7.5 lakh crore budgeted for 2022–23 (about 2.9% of GDP).
Why it is desirable: (i) Counter-cyclical role (Keynes): when private demand collapsed in 2020, government spending supported incomes and demand. (ii) High multiplier: RBI estimates (2019) put the capital expenditure multiplier at about 2.5 within a year, compared with about 1 for revenue spending. (iii) Crowding in: roads, railways and logistics raise private returns and investment when private capex is weak. (iv) Welfare: free foodgrains (PMGKAY) and other transfers protected the poor.
Limits: the fiscal deficit (6.4% of GDP in 2022–23 BE) and general government debt near 85% of GDP raise interest burdens and may crowd out private borrowing; the quality of spending and execution matters.
Increased spending was therefore desirable, provided it is capex-heavy, well targeted and followed by fiscal consolidation.
Example 4 (UPSC 2022, 15 marks): Point out the main features of Fiscal Responsibility and Budget Management (FRBM) Act. To what extent, it has been successful in achieving the targets?
Paper and question: Paper II, Q8(c)
Approach: List the main features of the FRBM Act (targets, prohibitions, statements, amendments), then assess achievement of targets period by period with data.
Main features of the FRBM Act, 2003 (rules notified July 2004): (i) eliminate the revenue deficit and reduce the fiscal deficit to 3% of GDP, by annual cuts of at least 0.5% and 0.3% of GDP respectively (deadline moved to March 2009); (ii) cap on additional guarantees at 0.5% of GDP a year; (iii) no borrowing from the RBI in the primary market from April 2006; (iv) three statements with the Budget: the Medium-term Fiscal Policy Statement, Fiscal Policy Strategy Statement and Macroeconomic Framework Statement; (v) quarterly reviews and an escape clause for national security or calamity.
Amendments: 2012: effective revenue deficit; 2018: on the N.K. Singh Committee (2017), a debt anchor (general government 60%, Centre 40% of GDP by 2024–25), fiscal deficit of 3% by March 2021, the revenue deficit target dropped, and a 0.5% escape clause.
Achievement: (i) 2004–08: success; the fiscal deficit fell to 2.5% and the revenue deficit to 1.1% in 2007–08. (ii) 2008–2014: targets suspended; deficits of 6–6.5% during the stimulus. (iii) 2014–2020: gradual improvement to 3.4–3.5%, but the 3% target was repeatedly deferred. (iv) 2020–21: 9.2% under COVID; central debt rose to about 60% of GDP, far above 40%. (v) After 2021: a glide path to 4.4% in 2025–26 (RE).
The Act improved transparency and discipline, but its targets have been met only once and postponed often.
Example 5 (UPSC 2020, 15 marks): Discuss the role of the Fiscal Responsibility and Budget Management Act, 2003, in improving the fiscal health of the State finances in India.
Paper and question: Paper II, Q7(b)
Approach: Explain how the FRBM framework was extended to states (Twelfth FC incentives, state FRLs, borrowing limits), then show the improvement in state finances with data and the later reversal, ending with an assessment.
The central FRBM Act, 2003 applies to the Union, but it triggered state-level rules. The Twelfth Finance Commission (2005–10) made its Debt Consolidation and Relief Facility, which rescheduled central loans at lower interest and wrote off repayments in proportion to revenue deficit reduction, conditional on states enacting Fiscal Responsibility Legislation (FRL) with targets of zero revenue deficit and a fiscal deficit of 3% of GSDP by 2008–09. Karnataka passed the first FRL in 2002, and all states had done so by 2010–11. Since states need central consent to borrow under Article 293(3), FC-recommended deficit limits became binding.
Effect on state finances: (i) the states' combined fiscal deficit fell from about 4% of GDP in 2003–04 to about 1.5% in 2006–07 and 2007–08; (ii) the states as a whole ran revenue surpluses in 2006–2009; (iii) their debt fell from about 31% of GDP in 2004 to about 22% by 2012.
Later pressures: UDAY (2015) shifted power discom debt to states; farm loan waivers, the end of GST compensation, and COVID-19 pushed deficits up (about 4% in 2020–21, with an extra borrowing limit allowed), and debt returned to about 28–29% of GDP; off-budget borrowing through state companies grew.
FRBM rules, through FC incentives, thus clearly improved state finances in the 2000s; sustaining them now needs power sector reform, better own-tax effort and transparency on off-budget debt.
Example 6 (UPSC 2019, 10 marks): Differentiate between plan and non-plan expenditure as used in the government budget. Is this distinction relevant for government finances in India today?
Paper and question: Paper II, Q5(e)
Approach: Define plan and non-plan expenditure, explain why the distinction was abolished from 2017–18 and what replaced it, and judge its relevance today.
Plan expenditure was spending on schemes and projects approved under the Five-Year Plans, decided with the Planning Commission. Non-plan expenditure was everything else: interest payments, defence, subsidies, salaries, pensions and maintenance of assets created in earlier Plans.
Why it lost relevance: (i) it biased spending towards new projects and starved maintenance, since non-plan spending was seen as 'unproductive'; (ii) the split did not match the economically meaningful revenue–capital distinction, since plan spending included revenue items and non-plan included capital items; (iii) it fragmented the Budget and outcomes; (iv) the Planning Commission was replaced by NITI Aayog in January 2015, and the Twelfth Five-Year Plan ended in 2017. On the C. Rangarajan Committee's advice (2011), the distinction was abolished from the 2017–18 Budget.
Today the Budget classifies spending as revenue and capital, and centrally sponsored versus central sector schemes, with an outcome budget. The old distinction is therefore not relevant, though the revenue–capital split, and the quality of spending, matter greatly.
Example 7 (UPSC 2018, 15 marks): The chequered fiscal history of India of the last fifteen years has been a saga of fiscal prudence on the part of the States and fiscal profligacy by the Centre. Do you agree? Give reasons.
Paper and question: Paper II, Q4(b)
Approach: Compare Centre and State deficits over roughly 2003–2018 with data, explain why States appeared prudent (FRLs, borrowing limits, devolution) and why the comparison is partly misleading, then give a qualified answer.
Largely yes, with qualifications. The states' combined fiscal deficit fell from about 4.4% of GDP in 2003–04 to about 1.5% in 2007–08 and stayed mostly between 2% and 2.5% until 2014–15, within the 3% limit; they even ran revenue surpluses in 2006–2009. The Centre's deficit, after falling to 2.5% in 2007–08, jumped to 6% in 2008–09 and 6.5% in 2009–10, stayed near 5–6% until 2012–13 and came down to 3.5% only by 2016–17, missing FRBM targets repeatedly.
Why states looked prudent: (i) Fiscal Responsibility Laws, induced by the Twelfth Finance Commission's debt relief; (ii) Article 293(3) lets the Centre cap state borrowing, so limits are binding, while the Centre can amend its own law; (iii) higher devolution from the Thirteenth and especially Fourteenth Finance Commissions (42%); (iv) the Centre bore the burden of the 2008–09 stimulus, oil and fertiliser subsidies and stabilisation.
Why the claim is partly misleading: (i) states' deficits rose to about 3% after 2015–16 when UDAY transferred discom debt, and farm loan waivers followed; (ii) off-budget borrowing through state companies hides deficits; (iii) states cut capital spending to meet targets; (iv) the Centre's spending includes defence, interest and transfers that support states.
So the statement captures the broad contrast, but fiscal prudence was partly imposed on states and their position weakened after 2015.
Example 8 (UPSC 2018, 20 marks): Do you agree that fiscal slippage in the recent past is structural in nature? Also suggest road map for fiscal consolidation in the next few years.
Paper and question: Paper II, Q6(a)
Approach: Distinguish structural from cyclical deficits, examine whether the 2017–19 slippage was structural (revenue base, rigid spending, off-budget items), then lay out a road map for consolidation drawing on the N.K. Singh Committee.
A cyclical deficit arises because revenues fall and spending rises in a downturn, and disappears with recovery; a structural deficit is the deficit that would persist at potential output, reflecting a lasting gap between revenue capacity and committed spending.
The slippage: the Centre's fiscal deficit target of 3.2% for 2017–18 slipped to 3.5%, and the 3.3% target for 2018–19 to about 3.4%, while growth was close to 7%, so the shortfall was not mainly cyclical.
Structural features: (i) narrow revenue base: the Centre's gross tax-to-GDP ratio of about 11–12%, a small income tax base, and GST teething problems that cut indirect tax buoyancy; (ii) rigid committed spending: interest payments absorbed over a third of the Centre's net revenue receipts, plus salaries and pensions (Seventh Pay Commission, 2016), defence and subsidies; (iii) a persistent revenue deficit of about 2.5% of GDP, meaning borrowing financed consumption; (iv) off-budget borrowing (FCI loans from the National Small Savings Fund, PSU bonds), which understated the true deficit. There were also cyclical elements, such as weak corporate profits, so the slippage was largely, not wholly, structural.
Road map: (i) adopt the N.K. Singh Committee's (2017) debt anchor (general government debt of 60% of GDP, Centre 40%) with the fiscal deficit as the operational target, falling to 3% by 2020–21; (ii) broaden the tax base: GST stabilisation, fewer exemptions and better compliance through data analytics; (iii) rationalise subsidies through DBT and targeting; (iv) protect capital expenditure and cut revenue spending; (v) bring off-budget items on budget; (vi) set up an independent fiscal council, as the Committee proposed; (vii) strategic disinvestment and asset monetisation.
Credible consolidation needs revenue reform more than spending cuts, so that growth-supporting investment is not sacrificed.
Example 9 (UPSC 2017, 10 marks): "Subsidies are a source of inefficiency and corruption." Do you agree with the statement in the Indian context? Justify your answer.
Paper and question: Paper II, Q1(b)
Approach: Take a qualified position: show where subsidies cause inefficiency and leakage (with Indian examples), where they are justified, and how DBT and targeting reduce the problems.
Partly agree. Subsidies are government payments that lower the price of a good below its cost. Badly designed subsidies cause inefficiency: free or cheap power for farmers encourages over-pumping of groundwater and water-intensive paddy in Punjab; urea priced far below other fertilisers distorts the N:P:K ratio; and open-ended price subsidies benefit the better-off who consume more.
They also invite leakage and corruption: diversion of PDS grain (an estimated 46% leakage in 2011–12, Gulati and Saini), of subsidised kerosene for adulteration, and of urea to industry, plus ghost beneficiaries.
But subsidies are justified for merit goods (education, health, food security), positive externalities and equity in a poor country, as the NFSA (2013) shows.
Reforms such as Aadhaar-linked direct benefit transfer (JAM, Economic Survey 2014–15), PDS digitisation and LPG transfers have cut leakages. The problem is design, not subsidies as such.
Example 10 (UPSC 2016, 10 marks): Critically examine the salient features of Fiscal Responsibility Act.
Paper and question: Paper II, Q5(b)
Approach: List the FRBM Act's salient features and then evaluate them critically (merits and weaknesses) in a short balanced conclusion.
The FRBM Act, 2003 (in force July 2004) is India's central fiscal rule. Salient features: (i) eliminate the revenue deficit and bring the fiscal deficit down to 3% of GDP (deadline March 2009); (ii) limit guarantees to 0.5% of GDP a year; (iii) end RBI subscription to primary issues of government securities from 2006; (iv) present three fiscal policy statements with each Budget and quarterly reviews to Parliament; (v) allow deviation only for national security or calamity.
Merits: it brought the deficit down to 2.5% by 2007–08, ended automatic monetisation and increased transparency.
Weaknesses: targets were suspended in 2008–09 and repeatedly deferred; the 3% figure is arbitrary; consolidation fell on capital spending; off-budget items (oil and fertiliser bonds) escaped; and there was no independent fiscal council.
It improved discipline but needed a debt anchor and flexibility, later added in 2018.
Example 11 (UPSC 2014, 20 marks): What are the salient features of FRBM Act? Examine the criticisms labelled against it.
Paper and question: Paper II, Q6(a)
Approach: Set out the FRBM Act's objectives, targets, prohibitions and transparency provisions, then examine the main criticisms (rigidity, pro-cyclicality, quality of adjustment, evasion, enforcement) with examples, and conclude.
The Fiscal Responsibility and Budget Management Act, 2003, based on the 2000 bill drafted after the E.A.S. Sarma Committee, and in force from July 2004, aims at intergenerational equity and macroeconomic stability through rule-based fiscal management.
Salient features: (i) targets: eliminate the revenue deficit and cut the fiscal deficit to 3% of GDP by March 2009, with minimum annual reductions of 0.5% and 0.3% of GDP; (ii) limits: additional guarantees capped at 0.5% of GDP a year, and a ceiling on additional liabilities; (iii) no monetisation: the Centre cannot borrow from the RBI in the primary market from 1 April 2006, except through ways and means advances; (iv) transparency: the Medium-term Fiscal Policy Statement, Fiscal Policy Strategy Statement and Macroeconomic Framework Statement with the Budget, and quarterly reviews; (v) an escape clause for national security, calamity or exceptional grounds; (vi) 2012 amendment: effective revenue deficit and a medium-term expenditure framework.
Criticisms: (i) rigid, arbitrary numbers: 3% copied from Maastricht, with no link to debt sustainability; (ii) pro-cyclical: strict targets in a slowdown deepen it, so they were suspended in 2008–09; (iii) poor quality of adjustment: governments cut capital spending rather than subsidies or revenue spending; (iv) creative accounting: oil and fertiliser bonds and deferred subsidy payments kept deficits off budget; (v) weak enforcement: no penalty and no independent fiscal council, so targets were postponed in 2004, 2012 and later; (vi) it ignored the combined Centre-State position.
Despite these criticisms, the Act brought a fiscal culture of targets and disclosure; its weaknesses called for a debt anchor, counter-cyclical flexibility and independent monitoring.
Example 12 (UPSC 2014, 15 marks): How global financial crisis and sovereign debt crisis of European nations exposed the disturbing role of speculative motive and fiscal imprudence? What lesson could India derive from it?
Paper and question: Paper II, Q6(c)
Approach: Explain how speculation (Keynes's speculative motive, asset bubbles, leverage) drove the 2008 crisis and how fiscal imprudence drove the euro-area debt crisis, then draw lessons for India.
Speculation and the global financial crisis (2008): Keynes's speculative motive describes holding or trading assets to profit from expected price changes. In the US, low interest rates and lax regulation fed a housing bubble; banks securitised subprime mortgages into complex derivatives, used high leverage and bet on ever-rising prices. When house prices fell in 2007, asset values collapsed, and Lehman Brothers failed in September 2008, freezing credit worldwide. Minsky's financial instability hypothesis, that stability breeds speculative and Ponzi finance, fitted this well.
Fiscal imprudence and the euro-area crisis (2010–12): Greece had concealed deficits; its deficit was revised to over 15% of GDP for 2009 and debt exceeded 120% of GDP. Portugal, Ireland, Italy and Spain also faced soaring bond yields. Without their own currencies, they could not devalue or monetise, so bailouts came with harsh austerity.
Lessons for India: (i) credible fiscal consolidation under the FRBM framework; (ii) keep public debt mainly domestic and rupee-denominated; (iii) strong macroprudential regulation and limits on leverage; (iv) transparency in fiscal accounts; (v) cautious capital account liberalisation.
2. Finance Commissions and Fiscal Federalism
Example 13 (UPSC 2026, 15 marks): Discuss the structure of fiscal federalism in India. How have successive Finance Commissions tried to address the vertical and horizontal fiscal imbalances?
Paper and question: Paper II, Q7(b)
Approach: Describe the constitutional structure of fiscal federalism and the vertical and horizontal imbalances, then show how successive Finance Commissions addressed each (shares, criteria, grants) up to the Sixteenth, and conclude.
Structure: the Seventh Schedule assigns buoyant taxes (income, corporation, customs) to the Union and major spending duties to states, creating a vertical fiscal imbalance: the Centre raises about 60% of combined revenue while states incur about 60% of combined expenditure. Differences in states' revenue capacity and costs create a horizontal imbalance. The Constitution provides tax sharing (Article 270), grants-in-aid (Article 275), a Finance Commission every five years (Article 280), discretionary grants (Article 282), borrowing controls (Article 293) and, since 2016, the GST Council (Article 279A).
Vertical imbalance: Finance Commissions raised states' share of the divisible pool (all central taxes since the 80th Amendment, 2000): 29.5% (Eleventh), 30.5% (Twelfth), 32% (Thirteenth), 42% (Fourteenth), 41% (Fifteenth) and 41% retained by the Sixteenth (2026–31).
Horizontal imbalance: formulas weight need and equity, mainly income distance (50% in the Twelfth and Fourteenth, 45% in the Fifteenth, 42.5% in the Sixteenth), population, area and forest cover, with incentives for demographic performance and tax effort; the Sixteenth added a 10% weight for contribution to GDP. Revenue deficit grants (Fourteenth and Fifteenth) filled residual gaps, though the Sixteenth discontinued them and kept grants for local bodies and disasters.
Problems remain: cesses and surcharges outside the pool cut effective devolution to about 30–33% of gross tax revenue. Still, the FC system has made transfers more formula-based and predictable.
Example 14 (UPSC 2025, 20 marks): How do the current Finance Commission's recommendations align with the Government's Fiscal Consolidation goals? Elucidate.
Paper and question: Paper II, Q8(a)
Approach: Identify the 'current' Finance Commission (Fifteenth, 2021–26, with the Sixteenth's report pending in 2025), set out its fiscal roadmap and transfers, compare them with the Centre's consolidation path, and judge the degree of alignment.
In 2025 the recommendations in force were those of the Fifteenth Finance Commission (chair N.K. Singh) for 2021–26; the Sixteenth Commission (chair Arvind Panagariya), covering 2026–31, submitted its report in November 2025.
Fifteenth FC's fiscal roadmap: (i) the Centre's fiscal deficit to fall to 4% of GDP by 2025–26; (ii) states' deficit limits of 4% of GSDP in 2021–22, 3.5% in 2022–23 and 3% in 2023–26, with an extra 0.5% in 2021–25 tied to power sector reforms; (iii) transfers: 41% tax share and grants of about ₹10.3 lakh crore, including revenue deficit grants of about ₹2.94 lakh crore, local body and disaster grants.
Government's consolidation goals: the Union Budget 2021–22 set a fiscal deficit target of below 4.5% of GDP by 2025–26, after the COVID peak of 9.2% in 2020–21; the deficit fell to 4.4% in 2025–26 (RE). From 2026–27 the government shifted to a debt anchor: central debt of about 50±1% of GDP by 2030–31.
Alignment: (i) Largely aligned on direction: both chose a gradual glide path rather than a sudden return to 3%, and the states' limit of 3% was applied, with extra borrowing for capital spending through 50-year interest-free loans. (ii) Differences: the Centre's target (4.5%) was looser than the Commission's 4%; sector- and state-specific grants were not accepted; and rising cesses reduced divisible resources.
The Sixteenth FC reinforces consolidation: it retains 41%, keeps the states' limit at 3% of GSDP, ends revenue deficit grants and envisages the Centre's deficit at 3.5% by 2030–31, so it aligns closely with the debt-anchor approach.
On balance, Finance Commission recommendations and the government's consolidation goals have moved together, though with the Centre taking a slightly more gradual path.
Example 15 (UPSC 2024, 20 marks): Distinguish between fiscal federalism, fiscal consolidation and cooperative federalism. Comment on the outcome of cooperative federalism in India.
Paper and question: Paper II, Q7(a)
Approach: Define and distinguish the three concepts clearly, then comment on the outcomes of cooperative federalism in India (GST Council, NITI Aayog, COVID response, capex loans) and its tensions, concluding with a balanced view.
Fiscal federalism is the division of functions, taxes and transfers among levels of government in a federation (Musgrave; Oates's decentralisation theorem says each public good should be provided by the lowest level that covers its benefits). Fiscal consolidation is the policy of reducing deficits and debt to sustainable levels, as under the FRBM Act. Cooperative federalism is a style of governance in which the Centre and states take decisions jointly and share responsibility, rather than acting separately or competitively.
Distinction: fiscal federalism is a structure (who taxes and spends what); fiscal consolidation is a policy goal that can apply to any level; cooperative federalism is a process of joint decision-making. They interact: consolidation needs states' cooperation, since states account for about half of general government spending.
Outcomes of cooperative federalism in India: (i) the GST Council (2016) pooled the tax sovereignty of the Centre and states; nearly all decisions have been by consensus, including GST 2.0 (September 2025); (ii) NITI Aayog (2015) replaced the Planning Commission, with states in its Governing Council and indices fostering competitive federalism; (iii) the Fourteenth Finance Commission raised devolution to 42% and gave states more untied funds; (iv) coordinated responses to COVID-19, including back-to-back GST compensation loans of about ₹2.69 lakh crore in 2020–22; (v) Special Assistance to States for Capital Investment, 50-year interest-free loans since 2020–21.
Tensions: the rising share of cesses and surcharges outside the divisible pool; the end of GST compensation in June 2022; central limits on states' off-budget borrowing; conditional centrally sponsored schemes; and disputes over the population criterion.
Cooperative federalism has produced major achievements, above all GST, but trust needs a fairer sharing of cesses and predictable rules for state borrowing.
Example 16 (UPSC 2023, 10 marks): What do you mean by horizontal fiscal disequilibrium in a federal setup and how did the XIIth Finance Commission correct such imbalance in India?
Paper and question: Paper II, Q5(c)
Approach: Define horizontal fiscal disequilibrium with its causes, then show how the Twelfth Finance Commission corrected it through its devolution formula and equalisation and need-based grants.
Horizontal fiscal disequilibrium is the inequality among states (units at the same level) in their ability to provide comparable public services at comparable tax rates, because of differences in income and tax base, population, area, cost of services and historical backwardness. In India, Bihar's per capita income is a fraction of Goa's or Haryana's.
Twelfth Finance Commission (chair C. Rangarajan, 2005–10) corrected it in three ways: (i) a devolution formula weighted towards poorer states: income distance 50%, population 25%, area 10%, tax effort 7.5% and fiscal discipline 7.5%, on a 30.5% share of central taxes; (ii) equalisation grants for education and health to states with below-average spending, plus non-plan revenue deficit grants to 15 states; (iii) grants for maintenance of roads and buildings, forests, heritage and state-specific needs, and debt relief.
Though inequality persisted, the Commission linked equity with fiscal discipline.
Example 17 (UPSC 2021, 15 marks): Critically analyse the recommendations of the Twelfth Finance Commission on fiscal federalism.
Paper and question: Paper II, Q7(c)
Approach: Summarise the Twelfth FC's recommendations on devolution, grants, debt relief and fiscal rules, then analyse critically their merits and weaknesses.
The Twelfth Finance Commission (chair C. Rangarajan) covered 2005–10. Recommendations: (i) states' share of central taxes raised to 30.5% (from 29.5%); (ii) horizontal formula: income distance 50%, population 25%, area 10%, tax effort 7.5%, fiscal discipline 7.5%; (iii) larger grants (about 19% of transfers): non-plan revenue deficit grants, equalisation grants for education and health, grants for maintenance of roads, buildings and forests, heritage, state-specific needs, local bodies and calamity relief; (iv) the Debt Consolidation and Relief Facility: central loans to states consolidated for 20 years at 7.5% interest, with repayments written off in proportion to revenue deficit reduction, conditional on states enacting fiscal responsibility laws; (v) fiscal targets: zero revenue deficit and a 3% fiscal deficit for both Centre and states by 2008–09.
Merits: it institutionalised fiscal discipline in states (all states passed FRLs, and state deficits fell to about 1.5% of GDP by 2007–08), cut their interest burden, and gave more weight to equalisation in social sectors.
Weaknesses: (i) the share rose only modestly, leaving the vertical imbalance; (ii) a heavier reliance on conditional grants reduced states' autonomy; (iii) uniform 3% targets ignored differences in states' needs; (iv) incentives rewarded states already able to cut deficits.
Overall, the Twelfth FC is remembered for linking transfers to fiscal reform, a model later Commissions built on.
Example 18 (UPSC 2020, 20 marks): Distinguish between Fiscal Federalism and Fiscal Consolidation. Discuss the fundamental changes in Indian fiscal federalism after introducing GST.
Paper and question: Paper II, Q8(a)
Approach: Distinguish fiscal federalism from fiscal consolidation, then discuss the fundamental changes GST brought to Indian fiscal federalism (pooled sovereignty, Council, destination principle, loss of autonomy, compensation), with the COVID-era test.
Fiscal federalism concerns the division of taxing powers, spending responsibilities and transfers between the Union, states and local bodies (Musgrave, Oates). Fiscal consolidation is the reduction of fiscal deficits and public debt to sustainable levels through higher revenue or lower spending. The first is about the structure of public finance across levels; the second is about its aggregate size and sustainability at any level.
Changes after GST (1 July 2017): (i) Concurrent taxing power: the 101st Amendment (2016) inserted Article 246A, so both the Centre and states tax the same base (goods and services). (ii) Pooled sovereignty: rates and rules are set by the GST Council (Article 279A), where the Centre has one-third and states two-thirds of the votes and decisions need a three-fourths majority, a major institution of cooperative federalism. (iii) Destination principle: revenue goes to the consuming state through IGST settlement. (iv) Loss of fiscal autonomy: states gave up VAT, entry tax, octroi and luxury taxes and now control directly only taxes on alcohol, petroleum products, stamp duty and electricity. (v) Compensation: the Centre guaranteed 14% annual growth of states' GST revenue for five years (to June 2022) through a cess.
Stress test: in the COVID shortfall of 2020–22 the cess fell short, and after disagreement the Centre borrowed about ₹2.69 lakh crore and passed it on to states as back-to-back loans, with the cess extended to March 2026 to repay them. The end of compensation in June 2022 hurt states with weak GST growth.
GST thus shifted Indian fiscal federalism from separated to shared tax powers; it strengthens cooperation but makes states more dependent on the Council and the Centre.
Example 19 (UPSC 2019, 15 marks): What is fiscal federalism? Examine the role of the various Finance Commissions since 2001 in reducing horizontal and vertical fiscal imbalances.
Paper and question: Paper II, Q7(b)
Approach: Define fiscal federalism and the two imbalances, then examine Finance Commissions from the Eleventh to the Fifteenth (shares, criteria, grants) and assess their effectiveness.
Fiscal federalism is the division of revenue powers, expenditure functions and transfers among levels of government. India's states face a vertical imbalance (they spend about 60% of general government expenditure but raise much less revenue) and a horizontal imbalance (unequal capacities among states). Finance Commissions under Article 280 correct both.
Commissions since 2001: (i) Eleventh (A.M. Khusro, 2000–05): 29.5% of all central taxes after the 80th Amendment; income distance given 62.5% weight; fiscal discipline introduced as a criterion. (ii) Twelfth (C. Rangarajan, 2005–10): 30.5%; income distance 50%; equalisation grants for health and education; debt relief tied to fiscal responsibility laws. (iii) Thirteenth (Vijay Kelkar, 2010–15): 32%; fiscal capacity distance 47.5%; grants linked to GST and outcomes. (iv) Fourteenth (Y.V. Reddy, 2015–20): a jump to 42%, mostly untied; forest cover added; revenue deficit grants to 11 states. (v) Fifteenth (N.K. Singh, 2020–26): 41%; demographic performance (12.5%) to reward population control.
Assessment: the vertical gap narrowed as states' share and untied funds rose, and horizontal formulas favoured poorer states such as Bihar and Uttar Pradesh. But per capita income gaps between states have not closed, the rising share of cesses outside the divisible pool weakens devolution, and southern states see population weights as unfair.
Finance Commissions have thus reduced imbalances but cannot remove them without stronger own-revenue effort by states.
Example 20 (UPSC 2017, 15 marks): Give a short analysis of the state of devolution of resources from the Centre to the States in India in the light of the idea of fiscal federalism.
Paper and question: Paper II, Q8(b)
Approach: Set out the idea of fiscal federalism and then analyse the state of devolution around 2017: the Fourteenth FC's 42%, the end of plan grants, restructured CSS, cesses and GST, ending with an assessment.
The idea of fiscal federalism (Musgrave, Oates) is that functions should be assigned to the level of government closest to the people that can perform them efficiently, with revenues or transfers matching these functions so that states can act autonomously and provide comparable services.
State of devolution (around 2017): (i) the Fourteenth Finance Commission (2015–20) raised states' share of central taxes from 32% to 42%, the largest jump ever, increasing untied transfers; (ii) with the Planning Commission replaced by NITI Aayog (2015), plan grants and Normal Central Assistance ended; (iii) the Centre cut its share in many centrally sponsored schemes (mostly to 60:40 with states) and rationalised them into core and optional schemes, after the Shivraj Singh Chouhan sub-group of chief ministers (2015); (iv) total transfers (devolution plus grants) rose only moderately as a share of the Centre's revenue because scheme grants fell; (v) the Centre relied more on cesses and surcharges, which are not shared, so their share in gross tax revenue rose; (vi) GST (2017) pooled taxes under the GST Council and compensated states for five years.
Assessment: devolution became more formula-based and untied, strengthening state autonomy, but rising cesses, conditional schemes and loss of tax autonomy under GST qualified the gain.
Fiscal federalism improved in form, but real devolution depends on sharing cesses and predictable transfers.
Example 21 (UPSC 2015, 20 marks): What are the major recommendations of the Fourteenth Finance Commission?
Paper and question: Paper II, Q8(c)
Approach: Set out the Fourteenth FC's recommendations under heads (vertical share, horizontal formula, grants, fiscal roadmap, institutional suggestions) and add a brief assessment.
The Fourteenth Finance Commission, chaired by former RBI Governor Y.V. Reddy, submitted its report in December 2014 for the period 2015–20; the government accepted its main recommendations in February 2015.
Vertical devolution: states' share of the divisible pool raised from 32% to 42%, the largest increase ever, with the explicit aim of giving states untied funds and reducing reliance on discretionary and scheme-based transfers.
Horizontal formula: income distance 50%, population (1971) 17.5%, demographic change (2011 population) 10%, area 15% and forest cover 7.5%, a new criterion recognising the ecological services of forest-rich states.
Grants: (i) grants to local bodies of about ₹2.87 lakh crore (panchayats about ₹2 lakh crore, municipalities about ₹87,000 crore), split into basic and performance grants; (ii) post-devolution revenue deficit grants of about ₹1.95 lakh crore to 11 states; (iii) disaster relief through the State Disaster Response Fund; (iv) no sector- or state-specific grants.
Fiscal roadmap: a fiscal deficit of 3% of GDP for the Centre and 3% of GSDP for states, with states allowed up to 0.25% more if their debt-GSDP ratio is at most 25%, and another 0.25% if interest payments are at most 10% of revenue receipts; dropping the effective revenue deficit target; amending the FRBM Act to create an independent fiscal council.
Other recommendations: GST compensation for five years, a new institutional arrangement for centrally sponsored schemes, review of public sector enterprises and pricing of public utilities.
Assessment: it marked a shift towards fiscal autonomy and cooperative federalism, but the Centre responded by cutting its share in centrally sponsored schemes, so net transfers rose less than the headline jump.
3. Tax Reforms and GST
Example 22 (UPSC 2025, 10 marks): What are the implications of the Goods and Services Tax (GST) reforms for Indian federalism? Discuss.
Paper and question: Paper II, Q5(e)
Approach: Explain how GST and its 2025 reform (GST 2.0) affect Indian federalism through pooled sovereignty, the Council, revenue, compensation and autonomy, and conclude with a balanced view.
GST (July 2017), under the 101st Amendment, gave the Centre and states concurrent power to tax goods and services (Article 246A) and created the GST Council (Article 279A). GST 2.0, approved by the 56th Council meeting on 3 September 2025 and effective 22 September 2025, cut most rates to two slabs of 5% and 18%, with 40% for demerit goods, and wound up the compensation cess.
Implications: (i) Cooperative federalism: the reform was agreed by consensus, showing the Council's strength as a forum of pooled sovereignty. (ii) Revenue risk for states: rate cuts were estimated to cost about ₹48,000 crore a year, and states have no compensation now, so several states demanded protection. (iii) Reduced autonomy: states cannot set their own GST rates and depend on the Council and devolution. (iv) Consumption states gain under the destination principle. (v) The Supreme Court in Mohit Minerals (2022) held Council recommendations persuasive, not binding.
GST thus deepens fiscal integration, but stable revenue sharing is essential to keep states' trust.
Example 23 (UPSC 2017, 10 marks): Would you advocate that the income of rich farmers should be taxed in India? Give reasons.
Paper and question: Paper II, Q1(a)
Approach: Give the constitutional and legal position, then argue for taxing rich farmers (equity, base, evasion) while noting practical problems, ending with a qualified 'yes'.
Position: agricultural income is outside the central income tax (Entry 82, Union List excludes it; Section 10(1) of the Income-tax Act exempts it) and can be taxed only by states (Entry 46, State List), which rarely do. Since 1973 'partial integration' uses agricultural income only to set the rate on non-agricultural income.
Yes, for rich farmers: (i) horizontal equity: a large farmer earning crores pays nothing while a salaried worker earning ₹10 lakh pays tax; (ii) the exemption is misused to launder black money as 'agricultural income'; (iii) it would widen a narrow tax base; (iv) the K.N. Raj Committee (1972) proposed an agricultural holdings tax, and NITI Aayog member Bibek Debroy revived the idea in 2017.
Problems: incomes are volatile and hard to measure, most farmers are small (86% of holdings below 2 hectares, Agriculture Census 2015–16), administrative costs are high and states lack political will.
A tax on large holdings or high farm incomes above a high threshold, with averaging over years, is advisable.
Example 24 (UPSC 2017, 15 marks): Explain GST. Analyse how it is going to impact Indian business.
Paper and question: Paper II, Q7(c)
Approach: Explain what GST is and how it works (dual, destination-based, input tax credit, Council), then analyse its likely impact on Indian business, positive and negative, ending with a judgement.
Goods and Services Tax (GST), launched on 1 July 2017 under the 101st Constitutional Amendment (2016), is a comprehensive, destination-based value added tax on the supply of goods and services. It is dual: the Centre levies CGST and states SGST on intra-state supplies, and IGST applies to inter-state supplies and imports. At each stage tax is paid only on value added, because tax paid on inputs is credited (input tax credit). It subsumed central excise, service tax, VAT, entry tax, octroi and other levies; alcohol and five petroleum products stayed out. Rates (0, 5, 12, 18 and 28% plus cess) are set by the GST Council.
Positive impact: (i) ends cascading (tax on tax), lowering costs and prices; (ii) a common national market, removing state check-posts and cutting truck transit time, with e-way bills; (iii) warehousing and supply chains organised on efficiency rather than tax arbitrage; (iv) simpler compliance through a single online system (GSTN); (v) exports zero-rated; (vi) formalisation, since buyers need invoices to claim credit.
Negative or transitional impact: (i) compliance burden and IT costs for small firms; (ii) working capital blocked by delayed refunds, hurting exporters; (iii) multiple rates and frequent changes created uncertainty; (iv) the informal sector lost its cost advantage.
On balance GST benefits organised business through efficiency and a unified market, while small firms needed a transition period.
Example 25 (UPSC 2016, 15 marks): Examine the process of introducing and passing GST Bill in Parliament. How it helps in Fiscal Consolidation in the country?
Paper and question: Paper II, Q4(b)
Approach: Trace the GST Bill's journey from the Kelkar Task Force to the 101st Amendment and its ratification, then explain how GST supports fiscal consolidation (base, buoyancy, compliance, RNR).
Process: (i) the Kelkar Task Force on implementing the FRBM Act (2004) proposed a comprehensive GST; (ii) the Finance Minister announced in the 2006–07 Budget a target date of April 2010; (iii) the Constitution (115th Amendment) Bill, 2011 lapsed with the dissolution of the 15th Lok Sabha in 2014; (iv) the Constitution (122nd Amendment) Bill was introduced in December 2014 and passed by the Lok Sabha in May 2015; the Rajya Sabha referred it to a Select Committee and passed it with amendments on 3 August 2016, dropping the proposed 1% additional origin tax and making compensation to states for five years a constitutional commitment; the Lok Sabha concurred on 8 August 2016; (v) as it affected federal powers, it was ratified by more than half the state legislatures (Assam first) and received Presidential assent on 8 September 2016 as the 101st Amendment Act; the GST Council was then constituted.
Help in fiscal consolidation: (i) a wider tax base covering services and the full supply chain; (ii) better compliance through invoice matching and the input-credit chain; (iii) higher tax buoyancy as the economy formalises; (iv) the Arvind Subramanian Committee (2015) estimated a revenue-neutral rate of about 15–15.5%, implying no loss at moderate rates.
Thus GST was expected to raise the tax-to-GDP ratio over time and support deficit reduction, though transitional compensation imposed short-term costs.
Example 26 (UPSC 2015, 10 marks): What are the broad features of the proposed GST Model?
Paper and question: Paper II, Q5(c)
Approach: List the broad features of the GST model as proposed in the 122nd Amendment Bill (2014–15), noting dual structure, taxes subsumed, exclusions, IGST, Council and compensation.
The proposed GST model, in the Constitution (122nd Amendment) Bill, 2014, had these broad features:
(i) Dual GST: concurrent levy by the Centre (CGST) and states (SGST) on the same supply; (ii) destination-based consumption tax with full input tax credit to end cascading; (iii) taxes subsumed: central excise, additional customs duties, service tax and central surcharges and cesses; state VAT, entry tax, octroi, luxury and entertainment taxes and purchase tax; (iv) exclusions: alcohol for human consumption kept out, and petroleum products to be brought in from a date the Council recommends; (v) IGST on inter-state supplies and imports, collected by the Centre and apportioned; (vi) a proposed additional tax of up to 1% on inter-state supplies for two years, to compensate producing states; (vii) a GST Council of Union and state finance ministers to recommend rates, exemptions and thresholds; (viii) compensation to states for revenue loss for up to five years.
The 1% origin tax was later dropped.
Mains points
- FRBM questions recur: always give the 2003 targets (fiscal deficit 3% and zero revenue deficit), the 2008–09 suspension, the 2012 and 2018 amendments, the N.K. Singh Committee (2017) debt anchor and escape clause, and the latest deficit path (4.4% in 2025–26 RE, 4.3% in 2026–27 BE, debt about 50±1% by 2030–31).
- Finance Commission answers score with exact shares (29.5%, 30.5%, 32%, 42%, 41%, 41%), horizontal criteria with weights, and the Twelfth FC's debt relief tied to fiscal responsibility laws.
- Separate concepts carefully when asked to distinguish: fiscal federalism (division of functions and finances), fiscal consolidation (reducing deficits and debt) and cooperative federalism (joint decision-making, e.g. the GST Council).
- GST answers should cover the 101st Amendment (2016), the GST Council (Article 279A), compensation till June 2022 and the cess till March 2026, and GST 2.0 (22 September 2025) with its effect on states.
- Examiners reward balance: credit fiscal rules for discipline but note rigidity, off-budget borrowing, the cess problem and the quality of expenditure.
Did you know?
- The 3% fiscal deficit target in India's FRBM Act echoes the 3% limit of the European Union's Maastricht Treaty (1992), a number chosen more by convention than by economic theory.
Economics Optional: All chapters
- Exam Pattern, Syllabus and Strategy
- Price Determination and Theories of Distribution
- Market Structures
- Welfare Economics
- Theories of Employment, Income and Interest
- Money and Monetary Management
- Public Finance
- Theories of International Trade
- Trade Policy, Protection and the WTO
- Balance of Payments and Exchange Rates
- Theories of Growth
- Economic Development
- Indian Economy in the Pre-Independence Era
- Planning in India
- Agriculture before Liberalisation
- Industry before Liberalisation
- National Income, Poverty and Inequality
- Agriculture after Liberalisation
- Industry after Liberalisation
- External Sector after Liberalisation
- Public Finance and Fiscal Federalism in India
- Monetary System and the RBI
- Employment, Wages and Poverty Alleviation