
Economics Optional · UPSC Notes
Industry before Liberalisation — UPSC Economics Optional Notes
Free, exam-focused notes for UPSC Prelims and Mains, with Prelims tips and Mains points for every topic. 4 topics.
Open in the interactive reader: bookmarks, progress tracking and read-aloud.
Industrial Policies 1948–1980 and Trends in Industrial Growth
India's industrial policy moved from the Industrial Policy Resolution of 1948 to the 1956 Resolution, which reserved the commanding heights for the state, backed by industrial licensing under the IDR Act, 1951, and later by the MRTP Act (1969) and FERA (1973). Industry grew fast until the mid-1960s, then entered a phase of industrial stagnation (about 1965–80) whose causes are debated, before recovering in the 1980s with partial liberalisation.
In simple words
After independence the government decided which industries it would run itself, such as steel and railways, and required private firms to get a licence before building or expanding a factory. This is the industrial licensing system.
It is like a city where you need permission even to add a room to your shop.
It built a broad industrial base but slowed growth after the mid-1960s.
UPSC asks you to compare the policy resolutions, explain the licence system and analyse the causes of industrial stagnation.
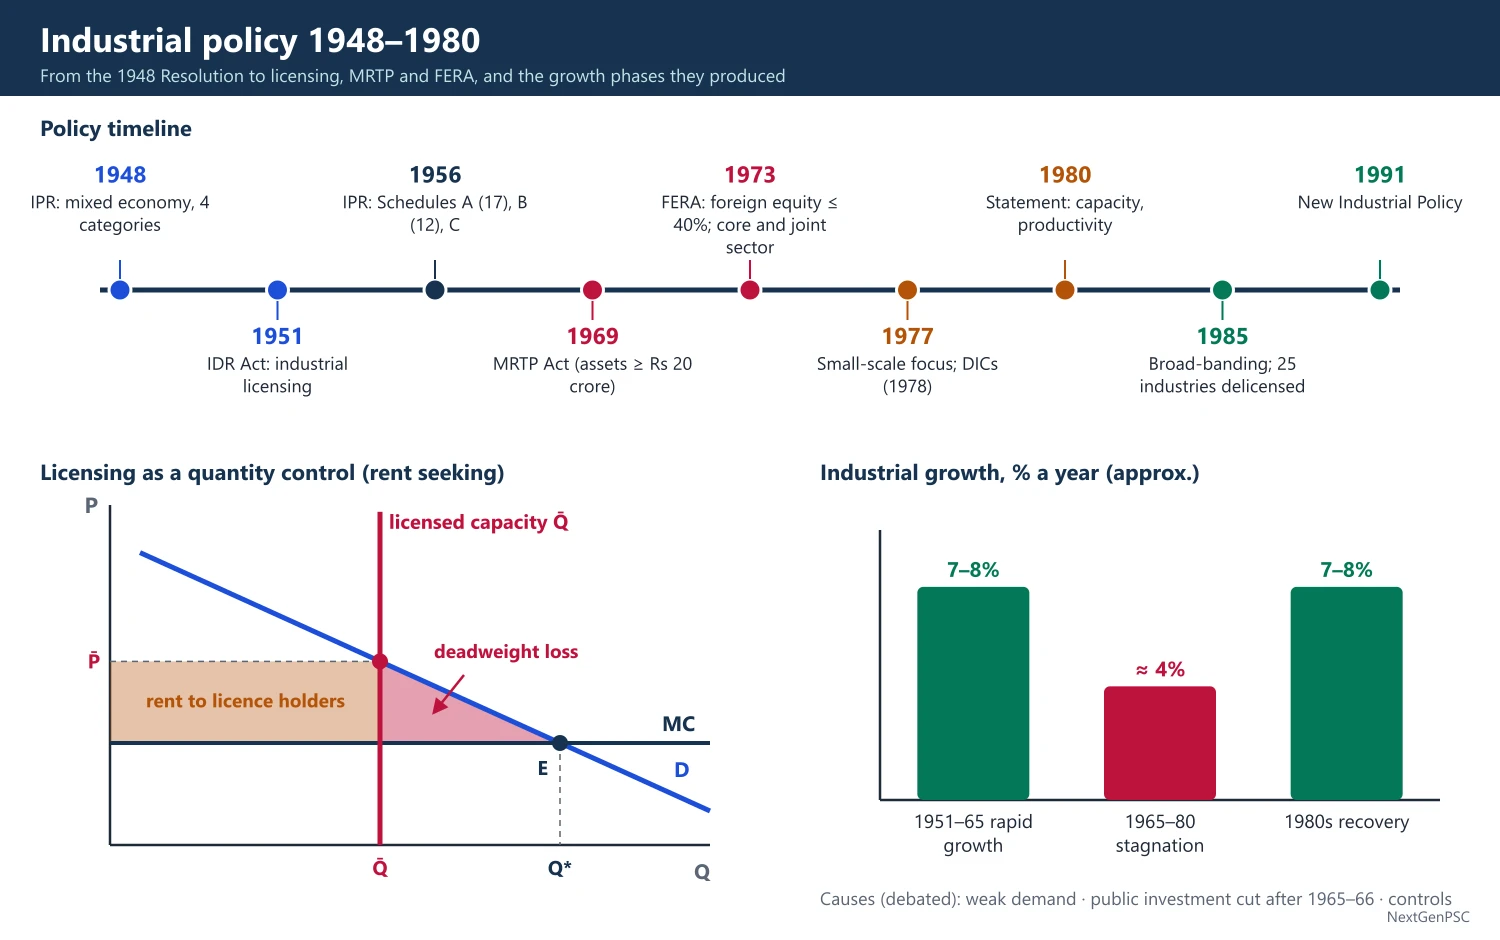
1. Industrial Policy Resolution, 1948
Date and context: announced on 6 April 1948 in the Constituent Assembly (Legislative); it declared a mixed economy with a progressively active role for the state.
Four categories: (1) exclusive state monopoly: arms and ammunition, atomic energy and railways; (2) basic industries (coal, iron and steel, aircraft manufacture, shipbuilding, telephone and telegraph equipment, mineral oils): new units by the state, existing private units allowed for ten years; (3) 18 important industries (such as automobiles, heavy machinery, cement, sugar, textiles) left to the private sector under state regulation; (4) the rest open to private enterprise.
Small and cottage industries: given an important role for employment and use of local resources.
Foreign capital: the Prime Minister's statement of April 1949 allowed foreign investment, generally with majority Indian ownership and control.
2. Industries (Development and Regulation) Act, 1951
Licensing: new units, substantial expansion, new products and change of location for scheduled industries required a licence from the Centre; the aim was to direct investment according to plan priorities, regional balance and prevention of concentration.
Other powers: the government could investigate and take over the management of units run against the public interest; development councils for industries were created.
3. Industrial Policy Resolution, 1956
Date and context: adopted on 30 April 1956, after Parliament accepted the 'socialist pattern of society' as the objective (December 1954) and the Congress's Avadi session (1955), and in line with the Second Plan.
Schedule A (17 industries): exclusive responsibility of the state for new units, including arms, atomic energy, iron and steel, heavy machinery, coal, mineral oils, aircraft, air transport, railways, shipbuilding, telephones and electricity generation and distribution.
Schedule B (12 industries): progressively state-owned, where the state would generally set up new units but private enterprise could supplement, such as aluminium, machine tools, basic chemicals, fertilisers, road and sea transport.
Schedule C: all remaining industries, left to private initiative under licensing and regulation.
Other features: support to small and cottage industries, reduction of regional disparities, fair labour conditions; it remained the basic policy until 1991.
4. Controls on Concentration and Foreign Capital
Evidence of concentration: the Mahalanobis Committee on Distribution of Income and Levels of Living (report 1964) and the Monopolies Inquiry Commission (K. C. Das Gupta, 1965) found concentration of economic power; R. K. Hazari's study for the Planning Commission (1967) and the Industrial Licensing Policy Inquiry Committee (S. Dutt, 1969) found that licensing had favoured large business houses, which pre-empted licences.
MRTP Act, 1969: the Monopolies and Restrictive Trade Practices Act required firms with assets of Rs 20 crore or more (and dominant undertakings) to get approval for expansion, mergers and new undertakings, and regulated restrictive trade practices; the threshold was raised to Rs 100 crore in 1985; it was replaced by the Competition Act, 2002.
FERA, 1973: the Foreign Exchange Regulation Act generally limited foreign equity in Indian companies to 40%, with exceptions for high-technology and export-oriented firms; some multinationals (Coca-Cola and IBM in 1977) left rather than dilute equity; replaced by FEMA in 1999.
5. Policy Statements of 1973, 1977 and 1980
1973: introduced a list of core industries open to large houses and foreign companies (alongside the public sector) and the idea of a joint sector with state and private participation.
1977 (Janata government): shifted emphasis to small, tiny and cottage industries, expanded the reserved list for small-scale units (from about 180 items to over 500), created District Industries Centres (from 1 May 1978) and took a stricter line on large houses and foreign firms.
1980: stressed optimum use of capacity, productivity, economic federalism (nucleus plants in backward areas), and gave some relief to large units through automatic capacity expansion; it prepared the way for the liberalising measures of 1985 (broad-banding, delicensing of 25 industries, raising the MRTP limit).
6. Trends in Industrial Growth
1951–1965, rapid growth: industrial output grew at about 7–8% a year, led by capital goods and basic industries under the Second and Third Plans.
1965–1980, stagnation or retrogression: growth fell to about 4% a year; capital goods growth fell sharply after the cut in public investment following the 1965–67 crisis.
1980s recovery: manufacturing growth recovered to about 7–8% a year, helped by partial liberalisation, higher public investment and better infrastructure performance.
Structural change: the share of basic, capital and intermediate goods in industrial output rose and that of consumer goods fell; India built a diversified industrial base including steel, machinery, chemicals, fertilisers and transport equipment.
Productivity: Isher Judge Ahluwalia, Industrial Growth in India: Stagnation since the Mid-Sixties (1985), found that total factor productivity in manufacturing declined over 1959–60 to 1979–80, so growth came mainly from adding inputs; later studies found TFP growth improved in the 1980s.
Measurement: industrial growth is tracked by the Index of Industrial Production compiled by the Central Statistical Organisation, with base years revised over time (1970, 1980–81, 1993–94, 2004–05 and 2011–12), so long-run comparisons need care.
Regional concentration: industry stayed concentrated in Maharashtra, Gujarat, Tamil Nadu and West Bengal; backward-area incentives (following the Pande and Wanchoo working groups of 1968–69) had limited effect.
Industrial sickness: rising numbers of sick units led to the Sick Industrial Companies (Special Provisions) Act, 1985, and the Board for Industrial and Financial Reconstruction (1987).
7. Explanations of the Stagnation (Debated)
Demand-side explanations: slow growth of agricultural incomes and adverse income distribution restricted demand for industrial consumer goods (Sukhamoy Chakravarty, Deepak Nayyar, Amiya Bagchi); the narrow market of the rich could not sustain growth.
Public investment explanation: the fall in public investment after 1965–66, especially in infrastructure, reduced demand for capital goods and caused supply bottlenecks in power, coal and transport (Raj Krishna, C. Rangarajan, K. N. Raj; Srinivasan and Narayana).
Policy and efficiency explanation: the licence-permit system, MRTP and FERA controls, import substitution and small-scale reservation reduced competition, scale economies and productivity (Bhagwati and Desai, 1970; Ahluwalia, 1985; Bhagwati and Srinivasan, 1975).
Agriculture-industry linkage: agricultural performance affected industry through food prices, wages, raw materials (cotton, jute, sugarcane) and rural demand.
Synthesis: most economists now see a combination of falling public investment, infrastructure bottlenecks and a restrictive policy regime; the relative weight of each is debated.
8. Diagrams and Charts
Industrial growth chart: bar chart of annual industrial growth: about 7–8% (1951–65), about 4% (1965–80), about 7–8% (1980s); label the plan holiday and 1991.
Licensing as a quantity control: x-axis output, y-axis price; demand curve and a vertical supply line at the licensed capacity Q̄ below the free-market output; price rises above marginal cost, creating rents for licence holders (Krueger's rent seeking); shade the rent rectangle and the deadweight loss triangle.
Policy timeline: 1948 IPR → 1951 IDR Act → 1956 IPR → 1969 MRTP → 1973 FERA and policy statement → 1977 statement and DICs → 1980 statement → 1985 delicensing → 1991 New Industrial Policy.
9. Using It in the Exam
10 marks: compare the 1948 and 1956 Resolutions (categories and schedules).
15 marks: licensing, MRTP and FERA: aims and effects.
20 marks: evolution of industrial policy 1948–1980, growth phases, causes of stagnation (demand, public investment, policy) and the 1980s recovery.
Keywords: commanding heights, Schedule A, B, C, licence raj, pre-emption of capacity, MRTP, FERA, core sector, joint sector, industrial stagnation, TFP.
| Feature | IPR 1948 | IPR 1956 |
|---|---|---|
| Date | 6 April 1948 | 30 April 1956 |
| Classification | Four categories | Three schedules (A: 17, B: 12, C: rest) |
| State's exclusive area | Arms, atomic energy, railways | 17 industries incl. iron and steel, heavy machinery, coal, oil, air transport |
| Ideology | Mixed economy | Socialist pattern of society |
| Private sector | Allowed in most areas under regulation | Schedule C and supplementing Schedule B under licensing |
Mains points
- Give dates and the classification of each Resolution precisely; tables help.
- Explain licensing's aims (plan priorities, regional balance, curbing concentration) and its actual effects (pre-emption, rent seeking, delays).
- Cite the Hazari (1967) and Dutt (1969) findings that led to the MRTP Act.
- Present the stagnation debate with names under three heads: demand, public investment and policy.
- Use Ahluwalia's TFP finding and the 1980s recovery to bridge to the 1991 reforms.
- Common mistake: saying the 1956 Resolution nationalised existing private industry; it reserved new units in Schedule A for the state but allowed existing private units to continue.
Did you know?
- Memory trick for 1956: 'A-17, B-12, C-rest', Schedule A had 17 industries, Schedule B had 12.
Role of the Public and Private Sectors
In the mixed economy model, the public sector was to hold the commanding heights, build infrastructure and heavy industry, promote regional balance and self-reliance, while the private sector operated under licensing, MRTP and FERA controls. Public enterprises built capacity but suffered from low returns, overstaffing and a soft budget constraint; reforms moved through MoUs (1988), disinvestment (from 1991) and strategic sale (Air India, 2022).
In simple words
India chose a mixed economy: the government ran steel plants, power, railways and banks, while private firms made most consumer goods. Government-owned companies are the public sector.
It is like a joint family where elders run the big shared assets and younger members run their own shops.
Public firms built industry where private capital was scarce but often made losses because they were protected and politically managed.
UPSC asks about the rationale, performance and reform of public enterprises and the role of private enterprise.
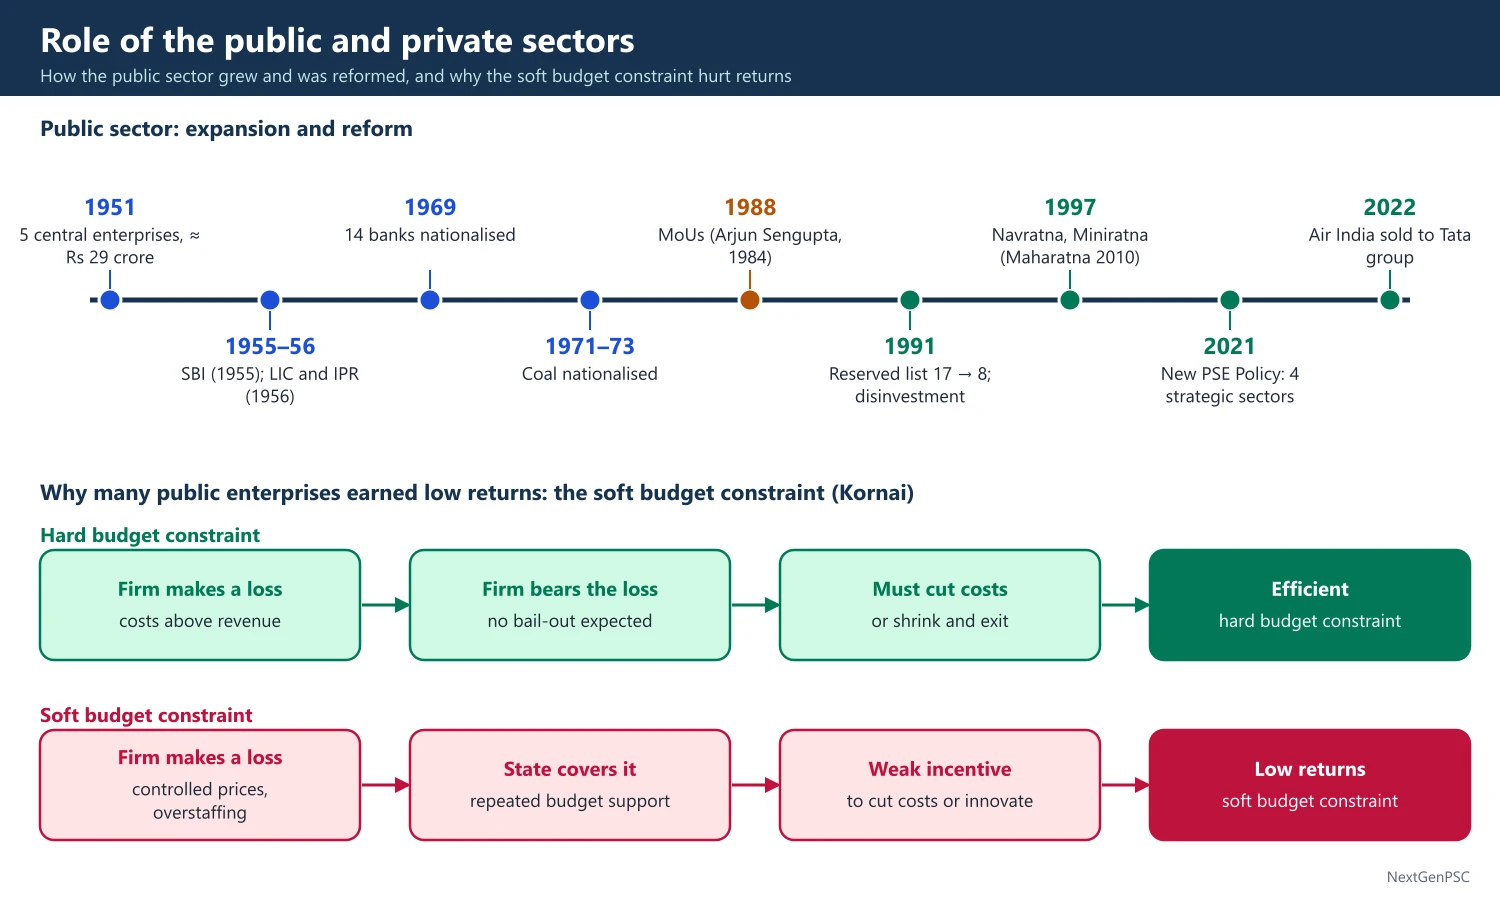
1. Concepts and Rationale
Mixed economy: coexistence of public and private ownership, with the state planning and directing investment; India's model combined Fabian socialism, Soviet-style planning and democratic politics.
Commanding heights: Lenin's phrase, used by Nehru and Mahalanobis, for the strategic sectors (heavy industry, energy, transport, finance) that the state should control.
Economic rationale: natural monopolies and infrastructure with long gestation and lumpy investment; private capital was scarce and risk-averse; external economies and the Big Push; self-reliance in strategic goods; regional balance by locating plants in backward areas (Bhilai, Rourkela, Bokaro); generating surpluses for public investment (an expectation of the Second and Third Plans).
Social and political rationale: preventing concentration of economic power, model employer, employment for reserved categories, price control of essentials.
2. Growth of the Public Sector
Scale: Central public sector enterprises grew from 5 units with an investment of about Rs 29 crore in 1951 to over 240 enterprises by 1990–91 (Public Enterprises Survey data).
Expansion routes: new plants (steel, heavy engineering, fertilisers, oil), nationalisation (Imperial Bank as SBI in 1955, life insurance in 1956, 14 banks in 1969, general insurance in 1972, coal in 1971–73) and take-over of sick private units (textile mills under NTC, 1968 and after).
Share in the economy: the public sector's share in gross domestic capital formation was close to half in the 1980s, and its share in organised-sector employment was about two-thirds.
3. Performance and Problems of Public Enterprises
Achievements: built steel, power, oil, heavy machinery, fertiliser and telecom capacity; trained engineers and managers; spread industry to backward regions; held prices of essential inputs.
Low returns: the rate of return on capital employed was very low for decades; many enterprises made losses, partly because prices were controlled to subsidise users.
Soft budget constraint: Janos Kornai's concept (1979–80s) that enterprises expecting bail-outs from the state lack the discipline to cut costs; repeated budget support to loss-makers fits this.
Principal-agent and political problems: multiple objectives, political interference in appointments, pricing and location, overstaffing, lack of autonomy and accountability, and delays in projects (Shleifer and Vishny, 'Politicians and Firms', 1994, model politicians using firms to create jobs for supporters).
Committees: the Arjun Sengupta Committee (1984) recommended greater autonomy and a contract between government and enterprise, leading to Memoranda of Understanding (from 1988); the Bureau of Public Enterprises (1965) and the Administrative Reforms Commission (1967) earlier recommended autonomy and accountability.
4. The Private Sector before 1991
Constraints: licensing under the IDR Act, capacity limits, MRTP approvals for large houses, FERA limits on foreign equity, reservation of items for small industry, import licensing and price controls (steel, cement, sugar).
Growth despite controls: large family business groups (Tata, Birla and others) expanded across sectors, often by pre-empting licences; the private corporate sector benefited from protection but faced little competition.
Joint sector: the 1973 policy encouraged joint ventures between state agencies and private firms.
Role in the economy: agriculture, most trade, small industry and services remained private; the household and unorganised sector accounted for most output and employment.
Financing: development finance institutions (IFCI 1948, ICICI 1955, IDBI 1964) and state financial corporations provided long-term loans to private industry, often with convertibility clauses giving the state a stake.
5. Reforms after 1991 (Link)
Dereservation: the New Industrial Policy (July 1991) cut the industries reserved for the public sector from 17 to 8; by 2001 only atomic energy and railway operations remained reserved, the list later narrowed further.
Disinvestment: sale of minority stakes from 1991–92; the Rangarajan Committee on disinvestment (1993) suggested limits; strategic sales (such as Modern Food Industries, 2000, and BALCO, 2001); the Department of Disinvestment (1999), later DIPAM (2016).
Autonomy schemes: Navratna (1997), Miniratna (1997) and Maharatna (2010) status gave greater financial and operational freedom to well-performing enterprises.
New Public Sector Enterprise Policy (announced in the Union Budget 2021–22): four broad strategic sectors (atomic energy, space and defence; transport and telecommunications; power, petroleum, coal and other minerals; banking, insurance and financial services) with a bare minimum public presence; enterprises in non-strategic sectors to be privatised or closed.
Strategic sale of Air India: completed in January 2022 to the Tata group; the LIC initial public offering followed in May 2022.
6. Charts and Diagrams
Soft budget constraint sketch: x-axis cost, y-axis probability of bail-out; under a hard budget constraint the firm bears losses; under a soft one the state covers them, so the firm's incentive to cut cost falls; a simple flow chart works well.
Public sector expansion timeline: 1951 (5 CPSEs) → 1955 SBI → 1956 LIC and IPR → 1969 bank nationalisation → 1971–73 coal → 1988 MoUs → 1991 dereservation and disinvestment → 1997 Navratna → 2021 NPSE policy → 2022 Air India sale.
Comparison table: public versus private sector on objectives, finance, efficiency, accountability and social role.
7. Theory and Debates
Ownership versus competition: some economists argue that competition matters more than ownership for efficiency (Vickers and Yarrow, Privatization: An Economic Analysis, 1988); Indian public firms that faced competition (such as some oil and power companies) often performed well.
Case for public ownership today: strategic sectors, market failures and financial stability; public sector banks' role during crises and in financial inclusion is cited.
Case for privatisation: efficiency, fiscal relief and depoliticisation; evidence from India (for example Gupta, 2005, on partial privatisation) suggests that stock market listing and private participation improved performance, though results vary (debated).
8. The Public Sector Today
Continuing weight: central public sector enterprises remain dominant in oil and gas, power generation and transmission, coal and mining (for example ONGC, NTPC, Power Grid and Coal India).
Investment role: the capital expenditure of large CPSEs is an important part of public investment, and their dividends are a significant non-tax revenue for the Union government.
Public sector banks: mergers in 2019–2020 reduced the number of public sector banks from 27 in 2017 to 12 in 2020, aiming at stronger balance sheets.
Asset monetisation: the National Monetisation Pipeline (2021) leases operating public assets (roads, transmission lines, pipelines) to private operators while ownership stays public.
Disinvestment record: annual disinvestment receipts have often fallen short of budget targets, showing the political and market difficulty of reducing state ownership.
9. Using It in the Exam
10 marks: rationale of the public sector in the Second Plan, or the soft budget constraint.
15 marks: performance and problems of public enterprises before 1991 with committees.
20 marks: role of public and private sectors in India's industrialisation, their interaction under controls, and the path to disinvestment and the 2021 policy.
Keywords: mixed economy, commanding heights, Schedule A, soft budget constraint, MoU, Navratna, disinvestment, strategic sale, competitive neutrality, development finance institutions.
| Feature | Public sector | Private sector |
|---|---|---|
| Main areas | Heavy industry, infrastructure, banking (after 1969), insurance | Consumer goods, agriculture, trade, small industry |
| Objectives | Plan priorities, self-reliance, regional balance, employment | Profit within licensing limits |
| Finance | Budget support, plan outlays | Own funds, DFIs, banks |
| Main problems | Low returns, soft budget constraint, political interference | Licensing delays, MRTP and FERA limits, lack of competition |
| Reform path | MoUs (1988), disinvestment, Navratna status, strategic sale | Delicensing (1985, 1991), MRTP replaced by Competition Act (2002) |
Mains points
- Begin with the economic rationale for the public sector (natural monopoly, Big Push, scarce private capital, regional balance), not only ideology.
- Balance achievements (capacity, skills, regional spread) with problems (low returns, soft budget constraint, political interference).
- Name committees and dates: Arjun Sengupta (1984), MoUs (1988), Rangarajan on disinvestment (1993), Navratna (1997), NPSE policy (2021).
- Explain how controls shaped the private sector: licence pre-emption, MRTP, FERA and protection.
- Use theory (Kornai, principal-agent, ownership versus competition) to lift the answer above description.
- Common mistake: treating disinvestment and privatisation as the same; disinvestment can leave control with the government, while strategic sale transfers control.
Did you know?
- Air India began as Tata Airlines, founded by J. R. D. Tata in 1932, was nationalised in 1953, and returned to the Tata group in January 2022, almost 69 years later.
Small-scale and Cottage Industries
Planners saw small-scale and cottage industries as a source of employment, consumer goods and decentralised growth with little capital, in line with the Mahalanobis model and Gandhian ideas. Support came through the Karve Committee (1955) recommendations, reservation of products (from 1967, peaking at 873 items in 1984), cheap credit, KVIC, SIDO, NSIC and District Industries Centres. Critics argue that protection kept firms small and inefficient, producing a missing middle; reservation ended in 2015 and the sector is now defined as MSMEs.
In simple words
Small and cottage industries are tiny workshops and household units, like handlooms, pottery and small engineering shops, that employ many people with little machinery. Today they are called MSMEs.
They are like neighbourhood kitchens feeding a whole town compared with one big factory canteen.
Planners protected them to create jobs, but protection also kept many of them small and less productive.
UPSC asks about their role, policy support, reservation and problems.
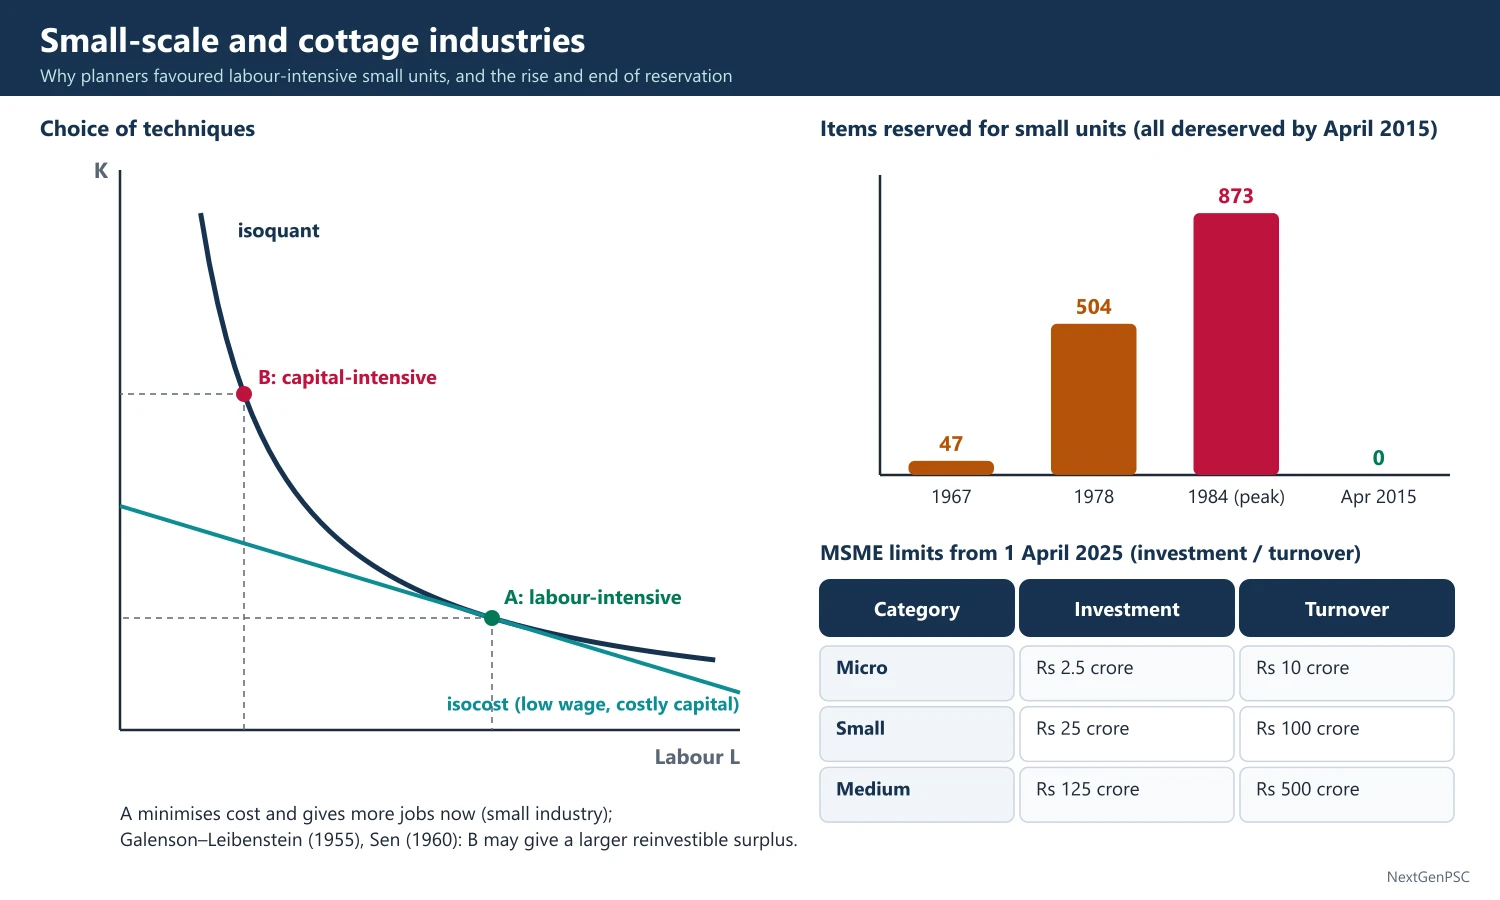
1. Concepts and Definitions
Cottage (household) industries: run mainly by family members, often part-time, with traditional skills and little capital (handloom, khadi, pottery, leather, coir).
Small-scale industries (SSI): modern small units defined by an investment ceiling in plant and machinery; the limit rose over time: Rs 5 lakh in fixed assets (1950), Rs 7.5 lakh (1966), Rs 10 lakh (1975), Rs 20 lakh (1980), Rs 35 lakh (1985), Rs 60 lakh (1991), Rs 3 crore (1997) and Rs 1 crore (1999).
MSMED Act, 2006: introduced micro, small and medium enterprises for manufacturing (investment up to Rs 25 lakh, Rs 5 crore and Rs 10 crore) and services (Rs 10 lakh, Rs 2 crore and Rs 5 crore).
Composite criteria (June 2020): investment and turnover together, same for manufacturing and services: micro up to Rs 1 crore investment and Rs 5 crore turnover; small up to Rs 10 crore and Rs 50 crore; medium up to Rs 50 crore and Rs 250 crore.
Revised limits (from 1 April 2025, announced in Budget 2025–26): micro up to Rs 2.5 crore investment and Rs 10 crore turnover; small up to Rs 25 crore and Rs 100 crore; medium up to Rs 125 crore and Rs 500 crore.
2. Rationale for Promotion
Employment: labour-intensive techniques give more jobs per unit of capital in a labour-surplus, capital-scarce economy.
Mahalanobis model: the C2 sector (household and small-scale consumer goods) was to meet consumer demand and absorb labour while scarce capital went to heavy industry.
Gandhian and decentralisation arguments: village self-reliance, dispersal of industry, prevention of urban congestion, use of local skills and materials.
Equity: wider distribution of income and ownership, entrepreneurship among less privileged groups.
Quick returns and low gestation: small units start producing quickly, easing the wage-goods constraint (Vakil-Brahmananda).
3. Policy Support before 1991
Karve Committee (Village and Small-Scale Industries Committee, 1955): chaired by D. G. Karve for the Second Plan; recommended no expansion of large-scale capacity in selected consumer goods, differential excise duties, reservation of production spheres, and cooperative organisation of artisans; it favoured progressive modernisation of village industries.
Institutions: Small Industries Development Organisation (1954) and its Small Industries Service Institutes; National Small Industries Corporation (1955) for machinery on hire-purchase and marketing; Khadi and Village Industries Commission (statutory, KVIC Act 1956, set up in April 1957); boards for handloom, handicrafts, coir and silk; District Industries Centres (from 1 May 1978).
Reservation: began in 1967 with 47 items reserved for exclusive manufacture by small units; the list expanded to 504 items in 1978 and peaked at 873 items in 1984.
Other support: priority-sector lending, concessional credit through state financial corporations, purchase preference in government procurement, excise exemptions, industrial estates (from 1955) and the Credit Guarantee Scheme.
SIDBI (2 April 1990): the Small Industries Development Bank of India was set up as the principal development finance institution for the sector.
4. Problems
Finance: lack of collateral, high cost of credit, and delayed payments by large buyers and government departments.
Technology and scale: outdated technology, low productivity, poor quality and limited marketing reach.
Raw materials and infrastructure: shortages under controls, unreliable power, lack of testing and design facilities.
Sickness: a large number of units became sick; the RBI's Kapur Committee (1998) and the Abid Hussain Committee (1997) reviewed the sector.
Perverse incentives: reservation and concessions linked to the size ceiling discouraged firms from growing beyond the limit, and some large firms split into small units to claim benefits.
Competition after liberalisation: tariff cuts and dereservation exposed small units to competition from large firms and imports, especially from China, in toys, electronics and consumer goods.
Informality: most micro units are unregistered and outside tax and labour laws, which keeps them small and limits their access to formal credit and government schemes.
5. Theory and Debates
Choice of techniques: Amartya Sen, Choice of Techniques (1960), and the Galenson-Leibenstein investment criterion (1955) argued that capital-intensive techniques might generate a larger reinvestible surplus and faster growth, while labour-intensive techniques maximise current employment; the debate concerns the trade-off between present jobs and future growth.
Missing middle: Indian manufacturing has many tiny firms and a few large ones, with few medium-sized firms (Dipak Mazumdar and Sandip Sarkar); Hsieh and Klenow (Quarterly Journal of Economics, 2009) found large misallocation of capital and labour across Indian manufacturing plants, and later work showed Indian plants grow far less with age than US plants (2014).
Critique of reservation: the Abid Hussain Committee (1997) recommended abolishing reservation because it kept units small, blocked technology upgrading and hurt exports in sectors such as garments, toys and leather where China gained; Rakesh Mohan (2002) made a similar case.
Defence of support: small firms employ a large share of the non-farm workforce and face genuine market failures (credit, information), so targeted support, not size-based protection, is the modern consensus.
6. After Liberalisation (Link to Present)
Dereservation: items were removed from the reserved list in stages from 1997, and the last 20 items were dereserved in April 2015.
Size of the sector: the NSS 73rd round (2015–16) estimated about 6.34 crore unincorporated non-agricultural MSMEs employing about 11.1 crore workers, over 99% of them micro enterprises; MSMEs are often cited as contributing about 30% of GDP and about 45% of exports (Ministry of MSME).
Credit schemes: Credit Guarantee Fund Trust for Micro and Small Enterprises (2000), Pradhan Mantri MUDRA Yojana (2015), Emergency Credit Line Guarantee Scheme (2020) and the Trade Receivables Discounting System (TReDS, operational from 2017).
Payments discipline: the MSMED Act requires buyers to pay within 45 days, and from 2023–24 income-tax rules (Section 43B(h)) disallow deductions for payments to micro and small enterprises delayed beyond that limit.
Registration: Udyam Registration (July 2020) is a paperless, PAN- and GST-linked system; the Udyam Assist Platform (2023) brought informal micro enterprises into the formal net for priority-sector lending.
7. Charts and Diagrams
Choice of technique diagram: x-axis labour, y-axis capital; draw an isoquant with two points: a labour-intensive technique (more L, less K) and a capital-intensive technique (more K, less L); an isocost line reflecting low wages and high cost of capital touches the isoquant at the labour-intensive point; note the Galenson-Leibenstein argument for the other point.
Firm-size distribution: bar chart with many firms at the smallest size, few in the middle and some large firms, illustrating the missing middle.
Definition timeline: SSI limits from Rs 5 lakh (1950) to Rs 1 crore (1999), MSMED Act (2006), composite criteria (2020) and revised limits (2025).
8. Using It in the Exam
10 marks: rationale for small and cottage industries in Indian planning, or the role of the Karve Committee.
15 marks: reservation policy: aims, effects and dereservation.
20 marks: role, policy support, problems and debates (choice of techniques, missing middle), and the transition to the MSME framework with current definitions.
Keywords: labour intensity, Karve Committee, reservation, KVIC, SIDBI, DICs, MSMED Act, composite criteria, missing middle, misallocation, choice of techniques.
| Category | MSMED Act 2006 (manufacturing, investment) | June 2020 (composite) | From 1 April 2025 (composite) |
|---|---|---|---|
| Micro | Up to Rs 25 lakh | Rs 1 crore / Rs 5 crore | Rs 2.5 crore / Rs 10 crore |
| Small | Up to Rs 5 crore | Rs 10 crore / Rs 50 crore | Rs 25 crore / Rs 100 crore |
| Medium | Up to Rs 10 crore | Rs 50 crore / Rs 250 crore | Rs 125 crore / Rs 500 crore |
Mains points
- Explain the rationale in terms of the Indian planning model (Mahalanobis C2 sector, wage goods, employment) rather than only Gandhian ideals.
- Give the Karve Committee's key recommendations and the reservation numbers (47 items in 1967, peak of 873 in 1984, full dereservation in 2015).
- Use theory: choice of techniques (Sen, Galenson-Leibenstein) and the missing middle (Hsieh-Klenow).
- Present both sides on reservation: employment protection versus suppression of scale, technology and exports.
- Link to today with the MSME definitions (2020 and April 2025) and credit and payment reforms.
- Common mistake: quoting outdated MSME limits; the composite limits were revised with effect from 1 April 2025.
Did you know?
- At its peak in 1984, 873 products, from pickles and candles to some electrical goods, could be manufactured only by small-scale units.
UPSC Previous Year Questions: Industry before Liberalisation
From 2014 to 2026 UPSC asked 20 question parts worth 290 marks from this chapter in Paper II. The most-asked topics are the role of the public and private sectors (8 parts) and small-scale, cottage and MSME industries (7 parts), followed by industrial policy and the industrial deceleration of 1965–80 (5 parts). Every question below has a model answer written to the UPSC word limit.
In simple words
Read the question and write your own answer in the time limit first: about 7 minutes for 10 marks and 11 minutes for 15 or 20 marks.
Then compare it with the model answer: did you cite the policy resolution or Act with its year, give growth figures, and name the economists behind each explanation?
Note what you missed, revise that topic in the notes above, and rewrite the answer after a few days.
1. Industrial Policies 1948–1980 and Trends in Industrial Growth
Example 1 (UPSC 2024, 15 marks): Discuss the inadequacies in the process of industrialisation in the pre-liberalised India.
Paper and question: Paper II, Q3(c)
Approach: Discuss the inadequacies of pre-1991 industrialisation: slow and decelerating growth, inefficiency and high ICOR, licensing and controls, public sector problems, technology and export weakness, regional and employment failures, with brief evidence.
Pre-1991 industrialisation, guided by the Industrial Policy Resolutions of 1948 and 1956 and the Mahalanobis strategy, built a diversified base but had serious inadequacies.
Slow and uneven growth: industrial output grew about 7% a year in 1951–65 but decelerated to about 4% in 1965–80 (Isher Ahluwalia, 1985), recovering only in the 1980s.
Inefficiency: the licence-permit raj (Industries (Development and Regulation) Act, 1951) and the MRTP Act (1969) restricted entry and scale; protection and import substitution created high-cost industry; the incremental capital-output ratio rose to over 5; capacity was under-used.
Public sector problems: low returns on capital, overstaffing, political interference, administered prices below cost, and chronic losses in many enterprises, including sick private units taken over by the state.
Technology and exports: restrictions on foreign technology and FDI (FERA, 1973) led to outdated technology; India's share of world exports fell to about 0.5%.
Employment and regional imbalance: capital-intensive industry created few jobs for an abundant labour force; reservation of products for small firms kept them small and discouraged scale; industry stayed concentrated in Maharashtra, Gujarat, Tamil Nadu and West Bengal despite incentives for backward areas.
These weaknesses, together with fiscal and external imbalances, culminated in the 1991 crisis and the New Industrial Policy of July 1991.
Example 2 (UPSC 2023, 10 marks): Deceleration and structural retrogression have been the key features of industrial sector in India during 1965–80. Give reasons.
Paper and question: Paper II, Q1(d)
Approach: Show the facts of deceleration (growth fell from about 7% to 4%) and retrogression (shift in composition, slowdown of capital goods), then give reasons (demand, supply, policy, investment).
Industrial growth fell from about 7% a year in 1951–65 to about 4% in 1965–80 (deceleration), while the capital-goods sector, which had led growth, slowed most sharply, reversing the structural progress of the Second and Third Plans (structural retrogression).
Reasons: (i) fall in public investment after 1965, due to wars, drought and fiscal strain, which hit demand for capital goods (Srinivasan and Narayana; Isher Ahluwalia); (ii) infrastructure bottlenecks in power, coal and railways; (iii) slow agricultural growth, which limited demand for industrial goods and raised wage-goods prices.
Further reasons: (iv) narrow market due to unequal income distribution (Nayyar, Chakravarty); (v) licensing and controls, including the MRTP Act (1969), which restricted large firms; (vi) import substitution with little export orientation and the oil shocks of 1973 and 1979.
These demand and supply factors together explain the stagnation until the partial liberalisation of the 1980s.
Example 3 (UPSC 2021, 10 marks): Explain the principal causes of deceleration in industrial growth during the mid-1960s to mid-1970s.
Paper and question: Paper II, Q1(d)
Approach: Give the fact of deceleration with figures, then explain the principal causes under demand-side, supply-side and policy heads, naming the economists.
Industrial growth, about 7–8% a year in 1951–65, fell to about 4% in 1965–76, a deceleration analysed in detail by Isher Judge Ahluwalia (Industrial Growth in India: Stagnation since the Mid-Sixties, 1985).
Demand-side causes: (i) decline in real public investment after 1965–66, as the wars of 1962, 1965 and 1971, droughts and fiscal pressure cut Plan outlays, reducing demand for capital goods; (ii) slow agricultural growth and adverse terms of trade, which limited rural demand (Ashok Mitra's terms-of-trade argument); (iii) a narrow market for mass consumer goods due to unequal income distribution (Deepak Nayyar, Sukhamoy Chakravarty).
Supply-side causes: infrastructure bottlenecks in power, coal and transport; rising capital-output ratios and low productivity; inefficiency of public enterprises.
Policy causes: the licence raj, the MRTP Act (1969), reservation for small industry and import controls stifled competition, scale and technology (Bhagwati and Desai, 1970). Most economists now accept a combination of these causes.
Example 4 (UPSC 2021, 15 marks): Analyse the trends in the production of primary goods and capital goods in Indian industries during the pre-liberalisation period.
Paper and question: Paper II, Q2(b)
Approach: Using the use-based classification, analyse trends in basic (primary) goods and capital goods across phases (1951–65, 1965–80, 1980s), with reasons and implications.
Under the use-based classification of industrial production, basic or primary goods include steel, cement, fertilisers, chemicals, coal, mining and electricity, while capital goods include machinery, transport equipment and electrical machinery.
1951–65: following the Mahalanobis strategy, both grew fastest: capital goods recorded double-digit growth in the Second and Third Plans as public steel plants (Bhilai, Rourkela, Durgapur), heavy engineering (HEC, Ranchi; BHEL) and machine tools (HMT) came up; basic goods grew rapidly with power and fertiliser expansion. Their share in industrial output rose at the expense of consumer goods.
1965–80: capital goods growth collapsed to low single digits as real public investment fell after the wars and droughts, demand from railways and power slowed, and import substitution had exhausted easy gains; basic goods grew more steadily, supported by public investment in power, coal and fertilisers, but infrastructure bottlenecks persisted. This shift is called structural retrogression.
1980s: partial liberalisation, easier technology imports and higher public spending revived both, with capital goods recovering strongly in the second half of the decade.
Implications: the capital goods sector depended on public investment, so its fortunes followed fiscal cycles; India achieved a broad base in basic and capital goods but at high cost and with outdated technology, a key reason for the 1991 reforms.
Example 5 (UPSC 2019, 20 marks): Explain the principal causes of deceleration in industrial growth during the mid 1960's to mid 1970's in India. Do you think that the reasons for the slowdown in industrial growth since the late 1990s are basically different from those of the earlier deceleration? Answer with proper arguments.
Paper and question: Paper II, Q4(a)
Approach: Answer both parts: causes of the mid-1960s to mid-1970s deceleration (demand, supply, policy), then compare with the late-1990s slowdown (causes, similarities, differences) and conclude that they were largely different.
Industrial growth fell from about 7–8% a year in 1951–65 to about 4% in 1965–76; after rising to about 12–13% in 1994–96, it slowed again to about 4–5% in 1997–2002.
Causes of the 1965–76 deceleration: (i) cuts in real public investment after the wars (1962, 1965), droughts (1965–67) and the Plan holiday, which reduced demand for capital goods (Isher Ahluwalia, 1985); (ii) infrastructure shortages in power, coal and transport; (iii) slow agricultural growth limiting demand and raising wage-goods prices; (iv) narrow markets due to income inequality (Nayyar); (v) the licence raj, MRTP Act (1969) and import controls restricting competition and technology.
Causes of the late-1990s slowdown: (i) a cyclical fall in demand after the investment boom of 1993–96 created over-capacity; (ii) high real interest rates; (iii) the East Asian crisis (1997–98) and cheap imports after tariff cuts; (iv) infrastructure gaps; (v) slower agricultural growth in some years; (vi) restructuring of firms adjusting to competition.
Similarities: both involved a fall in investment demand, infrastructure bottlenecks and weak rural demand.
Differences: the 1960s–70s slowdown was mainly structural and policy-induced, rooted in controls, a closed economy and public investment cuts; the late-1990s slowdown occurred in a liberalised, open economy and was largely cyclical and demand-driven, with global factors and competitive restructuring. Recovery after 2002 came through private investment and exports, not public spending.
Hence the reasons were basically different in nature, though some common elements, such as investment and infrastructure, persisted.
2. Role of the Public and Private Sectors
Example 6 (UPSC 2026, 20 marks): Trace the evolution of the debate between the public and private sectors in India's industrial development from the Industrial Policy Resolutions to the 1991 reforms.
Paper and question: Paper II, Q4(a)
Approach: Trace the debate chronologically: Bombay Plan and IPR 1948, IPR 1956, controls and nationalisation (1969–73), IPR 1977 and 1980, 1980s liberalisation, and 1991; show the arguments on each side and how the balance shifted.
The role of the public versus the private sector was the central question of India's industrial policy from independence to 1991.
Foundations (1944–1948): the Bombay Plan (1944) by leading industrialists accepted a large state role in basic industries; the Industrial Policy Resolution (IPR) of 1948 reserved arms, atomic energy and railways for the Centre, kept new units in six basic industries for the state, and assured existing private units of ten years without nationalisation, a mixed economy.
IPR 1956: after the 'socialistic pattern of society' (1955) and the Mahalanobis plan, Schedule A (17 industries) was reserved for the state, Schedule B (12 industries) was to be progressively state-owned with private participation, and Schedule C was left to the private sector under licensing; the public sector was to occupy the commanding heights.
Controls and nationalisation (1965–1977): the Hazari report (1967) and Dutt Committee (1969) found licensing favoured big business houses, leading to the MRTP Act (1969), bank nationalisation (1969), coal and general insurance nationalisation (1971–73) and FERA (1973).
Rethinking (1977–1990): the 1977 policy stressed small and cottage industries; in the 1980s broad-banding (1985), delicensing of some industries and MRTP relaxation favoured private enterprise, as public sector inefficiency and losses became evident.
1991: the New Industrial Policy (July 1991) abolished licensing for all but a few industries, reduced public sector reservation to eight areas (later fewer), removed MRTP asset limits and opened FDI; disinvestment began. The private sector became the main engine of growth.
Arguments: supporters stressed capital scarcity, infrastructure and equity; critics (Shenoy, Bhagwati and Desai) stressed inefficiency and rent-seeking.
The debate thus moved from state leadership with private partnership to market leadership with a strategic public sector.
Example 7 (UPSC 2025, 15 marks): Why was the public sector given a leading role in industrial development during the pre-liberalisation era? Explain.
Paper and question: Paper II, Q8(b)
Approach: Explain the economic, social and political reasons for the public sector's leading role before 1991, with the policy framework (IPR 1948, 1956) and examples.
The Industrial Policy Resolutions of 1948 and 1956 gave the public sector the 'commanding heights' of the economy; central public enterprises grew from 5 with an investment of Rs 29 crore in 1951 to over 200 by the late 1980s.
Capital scarcity and lumpiness: steel, heavy engineering, power and mining needed huge, long-gestation investment that the private sector could not mobilise; Bhilai, Rourkela and Durgapur steel plants were built by the state.
Infrastructure and linkages: railways, power, ports and irrigation are public goods or natural monopolies with large external benefits.
Strategy: the Mahalanobis model gave priority to capital goods to raise long-run growth and achieve self-reliance.
Social goals: preventing concentration of economic power (Articles 39(b) and (c)), balanced regional development by locating plants in backward areas, employment and control of surplus for reinvestment.
Political and historical reasons: distrust of colonial-era private capital, Nehru's Fabian socialism and the Soviet example; even industrialists in the Bombay Plan (1944) accepted a state role.
Strategic needs: defence, atomic energy and self-reliance after wars. These reasons made the public sector the leading instrument of planned development until 1991.
Example 8 (UPSC 2023, 15 marks): Explain the role of public sector in the Indian economy. Also point out its main problems faced during the period between 1970 to 1980.
Paper and question: Paper II, Q3(b)
Approach: Explain the roles of the public sector (infrastructure, basic industries, self-reliance, regional balance, employment, surplus), then the problems of 1970–80 (low returns, sickness takeovers, overstaffing, interference, under-utilisation, pricing) with responses.
Under the Industrial Policy Resolution of 1956, the public sector was assigned the 'commanding heights' of the Indian economy.
Roles: (i) building infrastructure (railways, power, ports, telecom); (ii) developing basic and capital goods (steel through SAIL's plants, BHEL, HEC, HMT, ONGC); (iii) promoting self-reliance in technology and defence; (iv) balanced regional development by locating plants in backward areas such as Bhilai and Rourkela; (v) employment and model labour practices; (vi) generating surplus for reinvestment and preventing concentration of economic power; (vii) controlling the financial system after bank nationalisation (1969).
Problems in 1970–80: (i) low returns: despite large investment, the rate of return on capital employed was very low and many enterprises made losses; (ii) takeover of sick units: textile mills (National Textile Corporation), coal and other loss-making private units were nationalised, adding to losses; (iii) over-capitalisation and overstaffing; (iv) political and bureaucratic interference and lack of autonomy; (v) under-utilisation of capacity due to power shortages and poor management; (vi) administered prices kept below cost for social reasons; (vii) delays and cost overruns.
Responses: the Arjun Sengupta Committee (1984) recommended greater autonomy, leading to Memorandums of Understanding (1988) between enterprises and ministries.
The public sector built India's industrial foundation but became a fiscal burden, paving the way for reforms after 1991.
Example 9 (UPSC 2021, 15 marks): Critically analyse the performance of public sector enterprises during the pre-reform period.
Paper and question: Paper II, Q2(c)
Approach: Give a balanced critique: achievements (scale, infrastructure, self-reliance, regional dispersal) versus failures (returns, efficiency, budget burden), with evidence and reasons.
Central public sector enterprises expanded from 5 units with Rs 29 crore of investment in 1951 to over 200 enterprises with investment exceeding Rs 1 lakh crore by 1990–91.
Achievements: (i) created a base in steel, heavy engineering, power equipment, fertilisers, petroleum and mining; (ii) built infrastructure and helped self-reliance in defence and technology (BHEL, HAL, ONGC); (iii) dispersed industry to backward regions; (iv) provided employment and trained managers and engineers; (v) public sector banks expanded rural credit after 1969.
Failures: (i) low profitability: returns on capital were low and many enterprises, especially taken-over sick units, made chronic losses; (ii) inefficiency: overstaffing, under-utilised capacity, cost and time overruns and outdated technology; (iii) budgetary burden: losses and subsidies strained public finances instead of generating surplus as the Plans hoped; (iv) pricing distortions through administered prices.
Reasons: multiple, conflicting objectives, political interference, soft budget constraints (Kornai), lack of autonomy and accountability, and protection from competition.
Assessment: the public sector met its developmental and strategic aims but failed on efficiency; the MoU system (1988) and post-1991 reforms aimed to correct this.
Example 10 (UPSC 2020, 10 marks): Comment on the role of the public sector during the early phase of industrial development in India.
Paper and question: Paper II, Q1(d)
Approach: Comment on the public sector's role in 1951–65: rationale, policy, achievements (heavy industry, infrastructure) and early weaknesses.
In the early phase of planned industrialisation (1951–65), the public sector was the main driver of investment in heavy industry and infrastructure.
Rationale and policy: scarce private capital, long gestation of basic industries, the Mahalanobis strategy and the goal of a socialistic pattern of society led the Industrial Policy Resolution of 1956 to reserve 17 industries for the state (Schedule A).
Achievements: steel plants at Bhilai, Rourkela and Durgapur (Second Plan); Heavy Engineering Corporation, BHEL, HMT, Indian Telephone Industries and ONGC (1956); multipurpose river projects; railways and power expansion. Industrial output grew about 7% a year, with capital goods growing fastest, and new plants were placed in backward regions.
Early weaknesses: long delays and cost overruns, dependence on foreign aid and technology, and the beginning of low returns. Overall the public sector laid India's industrial foundation in this phase.
Example 11 (UPSC 2018, 10 marks): Critically examine the relative contributions of public and private sectors in the pre-liberalisation period in India.
Paper and question: Paper II, Q5(c)
Approach: Compare the two sectors' contributions before 1991 (investment, output, sectors, employment, efficiency) and give a critical judgement.
Under the mixed economy of the Industrial Policy Resolutions (1948, 1956), the public and private sectors had complementary roles.
Public sector: it accounted for nearly half of gross capital formation in the 1980s, built steel, power, heavy engineering, petroleum, mining and infrastructure, dispersed industry to backward regions and dominated banking after 1969. Its weakness was low returns and inefficiency.
Private sector: it produced most consumer goods (textiles, sugar, light engineering) and almost all agricultural output, and household enterprises provided most employment; large business houses grew under licensing, often with protected markets. Its weakness was concentration and rent-seeking, while small firms stayed small.
Judgement: the public sector supplied the base and the private sector most of the output and jobs; the private corporate sector's efficiency, evident after delicensing in the 1980s, made it the main engine after 1991.
Example 12 (UPSC 2016, 10 marks): What were the economic and non-economic rationale for adopting mixed-economy model in India?
Paper and question: Paper II, Q1(c)
Approach: List the economic rationale (capital scarcity, market failure, infrastructure, big push, equity, self-reliance) and non-economic rationale (democracy, freedom struggle, Directive Principles, Soviet and Fabian influence, avoiding concentration).
India adopted a mixed economy, in which the public and private sectors coexist under state planning, through the Industrial Policy Resolutions of 1948 and 1956.
Economic rationale: (i) scarce private capital and the long gestation of basic industries; (ii) market failures in infrastructure and public goods; (iii) the need for a coordinated 'big push' (Rosenstein-Rodan) and the Mahalanobis priority for capital goods; (iv) reducing inequality and regional imbalance; (v) self-reliance and import substitution after colonial dependence.
Non-economic rationale: (i) democracy ruled out the coercion of a fully planned Soviet model, while a free market alone was distrusted after colonial exploitation; (ii) the Directive Principles (Articles 38 and 39) direct the state to prevent concentration of wealth and secure social justice; (iii) Nehru's Fabian socialism and the apparent success of Soviet planning; (iv) nationalist consensus, including the Bombay Plan (1944) and the Congress National Planning Committee (1938).
The mixed economy thus balanced growth, equity and democratic freedom.
Example 13 (UPSC 2016, 20 marks): During post-independence era India assigned the role of 'Commanding Heights' to the public undertakings. Should this policy be continued? Give reasons for your answer.
Paper and question: Paper II, Q7(a)
Approach: Explain the 'commanding heights' policy and its results, then argue whether it should continue: no as a blanket policy, yes in strategic areas, citing post-1991 changes (disinvestment, New PSE Policy 2021) and conclude.
The phrase 'commanding heights', associated with Lenin's New Economic Policy, was used by Indian planners for the strategic sectors the state should control. The Industrial Policy Resolution of 1956 reserved 17 industries for the public sector (Schedule A).
Results: the public sector built India's base in steel, power, oil, mining, heavy engineering and banking, but by the 1980s many enterprises showed low returns, overstaffing, under-utilised capacity and losses, partly because of political interference and soft budget constraints.
Change after 1991: the New Industrial Policy (1991) cut reserved sectors to eight, later to a few (atomic energy, railways operations); disinvestment began in 1991–92; Maharatna, Navratna and Miniratna status gave autonomy to profitable firms; the New Public Sector Enterprise Policy (2021) proposes minimal presence in four strategic sectors and privatisation elsewhere; Air India was privatised in 2022.
Should it continue? Arguments against: private capital and capital markets are now deep; competition and regulators can discipline markets; state-owned firms tie up scarce fiscal resources and many are inefficient; telecom and aviation show private entry raising efficiency.
Arguments for a strategic role: defence, atomic energy, critical minerals and energy security; natural monopolies such as railways; public sector banks for financial inclusion and countercyclical lending, as during COVID-19; public enterprises such as NTPC, ONGC and Coal India remain profitable and support infrastructure.
Conclusion: the old policy of commanding heights over the whole economy should not continue; instead the state should retain a lean public sector in strategic and market-failure areas, run on commercial principles, and focus on regulation and public goods.
3. Small-scale and Cottage Industries
Example 14 (UPSC 2026, 15 marks): Discuss the significance of small-scale and cottage industries during 1947–1991. What role did Indian States play during the above period in facilitating these industries?
Paper and question: Paper II, Q4(b)
Approach: Discuss the significance of small-scale and cottage industries in 1947–91 (employment, decentralisation, consumer goods, Gandhian and Mahalanobis rationale) and the policies, then the role of state governments (finance, infrastructure, institutions, incentives).
Small-scale and cottage industries held a special place in planning from 1947 to 1991.
Significance: (i) employment: they were labour-intensive and absorbed far more workers per unit of capital than large industry; (ii) consumer goods: the Mahalanobis plan relied on household and small industries to supply consumer goods; (iii) decentralisation: rural and small-town location reduced migration and regional imbalance, echoing Gandhi's emphasis on village industries; (iv) equity: wider distribution of income and ownership, preventing concentration.
Central policies: the IPRs of 1948 and 1956 supported small industry; the Karve Committee (1955) backed village industries; KVIC (1956) and boards for handlooms and handicrafts; reservation of products for exclusive manufacture by small units from 1967, rising to over 800 items; District Industries Centres (1978).
Role of state governments: (i) finance through State Financial Corporations (under the SFC Act, 1951); (ii) infrastructure: industrial estates (from 1955); (iii) institutions: State Small Industries Development Corporations supplied raw materials and marketing support, state Khadi and Village Industries Boards; (iv) implementation of District Industries Centres as single-window agencies; (v) incentives: sales tax concessions, power subsidies and purchase preference in state procurement.
Assessment: the sector grew in numbers and jobs, and clusters such as Tiruppur and Ludhiana emerged, but reservation discouraged scale and technology.
Small industries thus served employment and equity, with states as the main delivery agents.
Example 15 (UPSC 2025, 15 marks): Point out the main challenges faced by the small-scale and cottage industries in Indian economy.
Paper and question: Paper II, Q3(c)
Approach: Point out the main challenges (finance, delayed payments, technology, markets, informality and compliance, infrastructure, skills, competition) with data where possible, and suggest remedies briefly.
Small-scale and cottage industries, now part of the MSME sector, contribute about 30% of GDP and about 45% of exports and employ over 11 crore people (NSS 73rd round, 2015–16), yet face persistent challenges.
Finance: lack of collateral and credit history limits bank credit; the IFC (2018) estimated a large MSME credit gap; many rely on informal lenders.
Delayed payments: large buyers and government agencies delay payments despite the 45-day limit under the MSMED Act, 2006, straining working capital.
Technology and productivity: outdated machinery, low R&D and quality certification limit competitiveness.
Markets: weak branding and marketing; competition from cheap imports, especially from China.
Informality and compliance: most micro units are unregistered; GST and labour compliance costs burden them.
Infrastructure and skills: unreliable power, poor cluster infrastructure and shortage of skilled workers. Remedies include credit guarantees (CGTMSE), TReDS for receivables, Udyam registration, cluster development and the 2025 revision of MSME limits.
Sickness and scale: many units are too small to invest in technology or meet large orders; incipient sickness is detected late, and the Reserve Bank's framework for revival of stressed MSMEs (2016, revised 2019) has had limited reach.
Example 16 (UPSC 2024, 20 marks): Highlight the role of MSMEs in Indian Economy. What steps have been taken by the Government to enhance its contribution?
Paper and question: Paper II, Q3(a)
Approach: Highlight the role of MSMEs (output, employment, exports, entrepreneurship, regional balance, linkages) with data, then the government's steps (legal framework, definitions, credit, market access, technology, formalisation, recent schemes).
Micro, small and medium enterprises (MSMEs) are defined under the MSMED Act, 2006, using composite criteria of investment and turnover since 2020.
Role: (i) output: about 30% of GDP; (ii) employment: over 11 crore workers (NSS 73rd round, 2015–16), second only to agriculture; (iii) exports: about 45% of merchandise exports, in textiles, leather, gems and engineering goods; (iv) entrepreneurship, including among women, SCs and STs; (v) regional balance through clusters in small towns; (vi) linkages as suppliers to large industry (auto components, electronics).
Steps by the government: (i) legal framework: the MSMED Act, 2006, with Micro and Small Enterprise Facilitation Councils for delayed payments; (ii) definitions: composite investment and turnover limits from 2020, raised in the Union Budget 2025–26 (micro up to Rs 2.5 crore investment and Rs 10 crore turnover; small up to Rs 25 crore and Rs 100 crore; medium up to Rs 125 crore and Rs 500 crore); (iii) credit: priority-sector lending, CGTMSE (2000), MUDRA loans (2015) and the Emergency Credit Line Guarantee Scheme (2020); (iv) formalisation: Udyam registration (2020) and the Udyam Assist Platform (2023) for informal micro units; (v) market access: the Public Procurement Policy (2012), whose MSME target was raised to 25% in 2018, GeM and TReDS for bill discounting; (vi) technology and skills: technology centres, cluster development and the RAMP programme; (vii) artisans: PM Vishwakarma (2023).
These measures have widened access, but credit, delayed payments and technology remain constraints.
Example 17 (UPSC 2022, 15 marks): 'The small and cottage industries promote indigenous entrepreneurship'. Comment on the statement with respect to India.
Paper and question: Paper II, Q3(c)
Approach: Comment by explaining how small and cottage industries promote indigenous entrepreneurship (low entry barriers, local skills, first-generation and women entrepreneurs, clusters), with examples and limits.
The statement is broadly valid: small and cottage industries are the main nursery of indigenous entrepreneurship in India.
How they promote it: (i) low entry barriers: small capital and simple technology let first-generation entrepreneurs start businesses, supported by MUDRA loans (2015) and PMEGP (2008); (ii) local skills and materials: traditional crafts such as handloom, pottery, brassware and food processing build on inherited skills; (iii) clusters: Tiruppur (knitwear), Ludhiana (hosiery and cycle parts), Moradabad (brassware), Surat (diamonds) and Rajkot (engineering) show how small firms learn, specialise and grow; (iv) inclusion: women, SCs, STs and rural youth become owners, helped by Stand-Up India (2016) and self-help groups; (v) innovation and scaling: some small firms grew into large companies.
Indigenous entrepreneurship also strengthens self-reliance and 'vocal for local' goals and reduces dependence on imports.
Limits: many units remain tiny, informal and survivalist rather than growth-oriented; credit, technology and market access constrain scaling; past reservation policy discouraged growth. With support for finance, skills and markets, small industries can convert necessity entrepreneurship into opportunity entrepreneurship.
Example 18 (UPSC 2020, 20 marks): What are the major problems faced by the Small Scale Industries (SSIs)? Examine the role of the MSMED Act, 2006, in enhancing productivity of Small Scale Industries in India.
Paper and question: Paper II, Q3(a)
Approach: List the major problems of SSIs, then examine the MSMED Act, 2006 (definitions, medium category, delayed payments, facilitation councils, promotion measures) and its effect on productivity, with limits and later reforms.
Small-scale industries (SSIs) are vital for employment and exports, but they suffer from low productivity.
Major problems: (i) inadequate and costly credit, as banks demand collateral; (ii) delayed payments by large buyers and government; (iii) obsolete technology and little R&D; (iv) weak marketing and branding; (v) poor infrastructure and power supply; (vi) shortage of skilled labour; (vii) regulatory and compliance burden; (viii) competition from imports after liberalisation; (ix) sickness and closure of units.
Role of the MSMED Act, 2006: (i) it replaced the narrow 'small-scale industry' concept with micro, small and medium enterprises, covering both manufacturing and services, with investment limits (manufacturing up to Rs 25 lakh, Rs 5 crore and Rs 10 crore); the new medium category allowed firms to grow without losing all support, reducing the incentive to stay small; (ii) it fixed a maximum of 45 days for payments to micro and small enterprises, with compound interest at three times the RBI bank rate on delays; (iii) it set up Micro and Small Enterprise Facilitation Councils to resolve payment disputes; (iv) it created a National Board for MSMEs and allowed government procurement preference, credit and skill programmes; (v) it simplified registration through a memorandum.
Effect on productivity: the Act improved working capital, recognition and access to credit and procurement; together with the end of product reservation (fully dereserved in 2015) it encouraged scale and technology upgrading.
Limits: enforcement of payment rules was weak until Samadhaan (2017) and TReDS, investment-only definitions created disincentives, and most micro units remained informal.
Later reforms, the composite investment-turnover definitions (2020, revised 2025) and Udyam registration, built on the Act.
Example 19 (UPSC 2017, 10 marks): What role are MSMEs playing in India's economic growth?
Paper and question: Paper II, Q5(c)
Approach: State the role of MSMEs in growth (output, employment, exports, linkages, entrepreneurship, inclusive growth) with data, and add one line on constraints.
Micro, small and medium enterprises, defined under the MSMED Act, 2006, are central to India's growth.
Output: they contribute about 30% of GDP and a large part of manufacturing output.
Employment: about 6.3 crore enterprises employed about 11.1 crore workers (NSS 73rd round, 2015–16), the largest source of non-farm jobs.
Exports: they supply over two-fifths of merchandise exports, in textiles, garments, leather, gems and jewellery, and engineering goods.
Linkages and entrepreneurship: they supply components to large firms and nurture first-generation entrepreneurs.
Resilience and innovation: MSMEs absorb workers leaving agriculture, adapt quickly to local demand, and form the base of start-ups and clusters such as Tiruppur and Ludhiana; they are also central to Make in India (2014) supply chains.
Inclusive growth: they are spread across rural areas and small towns, employing women and weaker sections. Credit gaps, delayed payments and low technology limit their contribution.
Example 20 (UPSC 2015, 10 marks): What was the impact of policy reservation in favour of small scale industries in India during the post-independence but pre-liberalisation era?
Paper and question: Paper II, Q1(b)
Approach: Explain the reservation policy (1967 start, peak of over 800 items) and its objectives, then its impact: employment and dispersal (positive) versus small scale, low technology and lost exports (negative).
From 1967 the government reserved certain products for exclusive manufacture by small-scale units; the list grew from 47 items to a peak of over 800 items by the mid-1980s, after the 1977 policy expanded it.
Objectives: protect small units from competition by large firms, generate employment, disperse industry and prevent concentration of economic power.
Positive impact: the number of small units and their employment grew rapidly; industry spread to small towns; some sectors such as hosiery and light engineering developed clusters.
Negative impact: (i) firms had an incentive to stay small to retain protection, so they could not reap scale economies; (ii) technology and quality stayed low; (iii) India lost export markets in garments, toys and footwear to China and East Asia, where large firms used scale; (iv) large firms faced shortages and high costs of reserved inputs.
The Abid Hussain Committee (1997) recommended dereservation, which began in the late 1990s and ended in 2015.
Mains points
- The 1965–80 deceleration recurs (2019, 2021, 2023): give the growth fall (about 7% to 4%) and group causes into demand (public investment, agriculture, inequality), supply (infrastructure) and policy (licensing, MRTP), naming Isher Ahluwalia, Nayyar and Bhagwati-Desai.
- Public sector questions reward a two-sided answer: commanding heights and achievements (steel, BHEL, ONGC, regional dispersal) versus low returns, interference and soft budgets, with the Arjun Sengupta Committee (1984) and the 2021 PSE policy.
- Know the sequence IPR 1948, IPR 1956 (Schedules A, B, C), MRTP 1969, FERA 1973, IPR 1977, 1980 Statement and NIP 1991.
- MSME answers need the MSMED Act, 2006 provisions, the 2020 and 2025 definitions, and current data on output, jobs and exports with source.
- Reservation for small industry (1967, peak over 800 items, ended 2015) is a favourite for a balanced 10-mark answer.
Did you know?
- Central public sector enterprises numbered just 5, with total investment of Rs 29 crore, in 1951; by the time of the 1991 reforms there were over 200, worth more than Rs 1 lakh crore.
Economics Optional: All chapters
- Exam Pattern, Syllabus and Strategy
- Price Determination and Theories of Distribution
- Market Structures
- Welfare Economics
- Theories of Employment, Income and Interest
- Money and Monetary Management
- Public Finance
- Theories of International Trade
- Trade Policy, Protection and the WTO
- Balance of Payments and Exchange Rates
- Theories of Growth
- Economic Development
- Indian Economy in the Pre-Independence Era
- Planning in India
- Agriculture before Liberalisation
- Industry before Liberalisation
- National Income, Poverty and Inequality
- Agriculture after Liberalisation
- Industry after Liberalisation
- External Sector after Liberalisation
- Public Finance and Fiscal Federalism in India
- Monetary System and the RBI
- Employment, Wages and Poverty Alleviation