
Sociology Optional · UPSC Notes
Research Methods and Analysis — UPSC Sociology Optional Notes
Free, exam-focused notes for UPSC Prelims and Mains, with Prelims tips and Mains points for every topic. 4 topics.
Open in the interactive reader: bookmarks, progress tracking and read-aloud.
Qualitative and Quantitative Methods
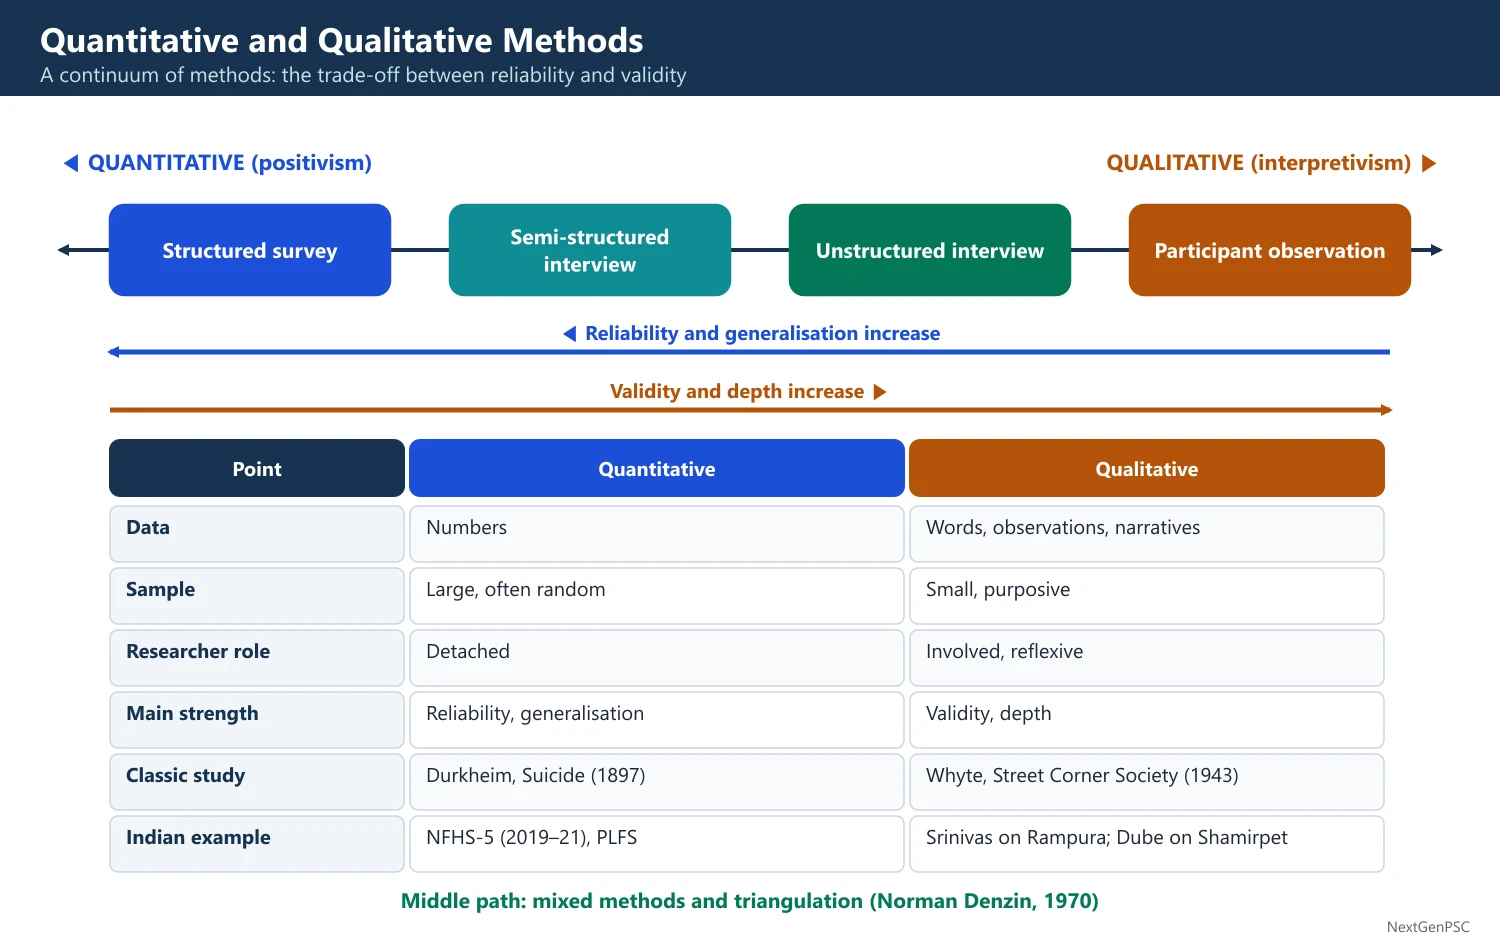
Quantitative methods measure social phenomena in numbers through surveys, structured questionnaires, official statistics and experiments, aiming at reliability and generalisation; they grow from positivism. Qualitative methods study meanings and processes in depth through participant observation, unstructured interviews, case studies and documents, aiming at validity; they grow from interpretivism. Most modern research uses mixed methods and triangulation (Norman Denzin, 1970).
In simple words
Quantitative research counts: how many people, what percentage, how much change; qualitative research listens and watches: why people act and what it means to them.
It is like learning about a wedding: one way counts guests and money spent, the other sits with the family to understand the rituals and tensions.
Both are useful, and good researchers often combine them.
UPSC asks you to compare the two, link them to positivism and interpretivism, and give examples.
1. Concepts and Definitions
Quantitative research: research that collects numerical data and analyses it statistically to describe patterns, test hypotheses and find relationships between variables.
Qualitative research: research that collects non-numerical data (words, observations, images) to understand meanings, experiences and social processes in their context.
Mixed methods: research that combines both in one design, either in sequence (for example interviews first, then a survey) or in parallel.
Triangulation: Norman Denzin (The Research Act, 1970) described using more than one data source, investigator, theory or method to cross-check findings.
Methodological pluralism: the view that the research question, not loyalty to one philosophy, should decide the method.
2. Quantitative Methods Explained
Philosophical base: positivism; society as an objective reality that can be measured.
Main techniques: sample surveys with structured questionnaires or schedules, official statistics, content analysis by counting, experiments and quasi-experiments, secondary analysis of large data sets.
Steps: hypothesis → operationalisation of concepts into variables → sampling → structured data collection → coding → statistical analysis (frequencies, cross-tabulation, correlation, regression).
Strengths: reliability (others can repeat it), representativeness (with probability samples), comparison across groups and time, and use in policy.
Weaknesses: may impose the researcher’s categories, miss meanings, give surface answers, and treat official statistics as neutral (Cicourel, Atkinson).
Classic examples: Durkheim’s Suicide (1897); Paul Lazarsfeld’s panel study of voting, The People’s Choice (1944); John Goldthorpe and colleagues’ Affluent Worker studies (1968–69).
3. Qualitative Methods Explained
Philosophical base: interpretivism, phenomenology and symbolic interactionism; society as meanings produced in interaction.
Main techniques: participant and non-participant observation, unstructured and semi-structured interviews, focus groups, life histories, case studies, analysis of personal documents and narratives.
Steps: broad research question → entry into the field and rapport → observation and interviews → field notes → coding of themes → interpretation, often moving back and forth.
Strengths: validity, depth, capturing the actor’s point of view, discovering new concepts, studying hidden or sensitive groups.
Weaknesses: low reliability, small and unrepresentative samples, researcher bias, time-consuming, and ethical problems in covert research.
Classic examples: Bronisław Malinowski (Argonauts of the Western Pacific, 1922); William Foote Whyte (Street Corner Society, 1943); Erving Goffman (Asylums, 1961); Paul Willis (Learning to Labour, 1977).
4. The Debate and the Middle Path
The ‘paradigm wars’: positivists criticised qualitative work as unscientific; interpretivists criticised quantitative work as superficial.
Practical factors: Haralambos and Holborn note that choice of method also depends on practical issues (time, money, access), ethical issues and the topic, not only theory.
Mixed-methods classics: the Marienthal study of unemployment in Austria (Marie Jahoda, Paul Lazarsfeld and Hans Zeisel, 1933) combined statistics, observation and diaries; Goldthorpe’s Affluent Worker combined survey and interviews.
Sequence designs: qualitative work can generate hypotheses and questionnaire items, and quantitative work can test them on a larger sample; or a survey can identify cases for in-depth study.
Critique of mixing: some argue the two rest on incompatible assumptions; most researchers today treat this as a practical rather than philosophical problem (debated).
5. Indian Examples and Studies
Quantitative, national: Census of India (2011; next with reference date 1 March 2027), National Family Health Survey (NFHS-5, 2019–21, about 6.37 lakh households), Periodic Labour Force Survey (from 2017–18), Household Consumption Expenditure Survey 2022–23.
Quantitative, academic: the India Human Development Survey (NCAER and University of Maryland, 2004–05 and 2011–12) and the CSDS-Lokniti National Election Studies on voting and caste.
Qualitative village studies: M.N. Srinivas on Rampura (Mysore), S.C. Dube on Shamirpet (near Hyderabad, Indian Village, 1955), McKim Marriott on Kishan Garhi (Aligarh district), Kathleen Gough on Kumbapettai (Thanjavur), André Béteille on Sripuram (Thanjavur, Caste, Class and Power, 1965).
Fieldwork and access: Gerald Berreman (Hindus of the Himalayas, 1963; essay Behind Many Masks, 1962) showed that villagers presented different faces depending on the caste of his interpreter, a lesson about the researcher’s identity in qualitative work.
Mixed methods in India: F.G. Bailey’s and Béteille’s studies combined household censuses of land and caste with observation; the study Untouchability in Rural India (2006) surveyed 565 villages and also recorded narratives.
Current issues: studies of gig and platform workers in Indian cities combine app-data and surveys with interviews about work experience.
Oscar Lewis in India: his Village Life in Northern India (1958) on Rampur near Delhi combined household data with descriptions of family and faction life.
Quantitative caste data: NFHS and IHDS allow comparison of SC, ST, OBC and other households on health, education and assets, which no single village study can do.
Qualitative caste data: Dalit autobiographies and ethnographies show how humiliation is experienced, which numbers alone cannot capture.
Policy use: schemes are evaluated through large surveys, while qualitative studies explain why take-up is low among particular groups.
6. Linking Thinkers
Durkheim and Weber: the quantitative–qualitative divide mirrors Durkheim’s social facts and Weber’s verstehen, though Weber himself used statistics in his study of the Protestant ethic.
Marx: used both government statistics (factory inspectors’ reports) and historical analysis in Capital (1867), an early mixed approach.
Mead and Blumer: their symbolic interactionism provides the main justification for qualitative fieldwork.
7. Using it in the Exam
10 marks: define both, two features each, one example each, mention triangulation.
15 marks: comparison table (philosophy, data, sample, strengths, weaknesses) with an Indian example for each.
20 marks: definitions → philosophical roots → techniques → strengths and weaknesses → mixed methods and triangulation (Denzin, Marienthal) → Indian examples (NFHS, village studies, Berreman) → conclusion on pluralism.
Diagram idea: a continuum from structured survey → semi-structured interview → unstructured interview → participant observation, with reliability rising to the left and validity rising to the right.
Useful definition: Denzin defined triangulation as the combination of methodologies in the study of the same phenomenon (paraphrase of The Research Act, 1970).
| Point | Quantitative | Qualitative |
|---|---|---|
| Philosophy | Positivism | Interpretivism, phenomenology |
| Data | Numbers | Words, observations, narratives |
| Sample | Large, often random | Small, purposive |
| Researcher role | Detached | Involved, reflexive |
| Main strength | Reliability, generalisation | Validity, depth |
| Classic study | Durkheim, Suicide (1897) | Whyte, Street Corner Society (1943) |
| Indian example | NFHS-5 (2019–21), PLFS | Srinivas on Rampura; Dube on Shamirpet |
Mains points
- Typical angle: ‘Compare qualitative and quantitative methods’ or ‘Is the distinction overdrawn?’; link each to its philosophy and give classic and Indian studies.
- Use a comparison table and end with triangulation and mixed methods.
- Cite Indian village studies for qualitative work and NFHS, PLFS, IHDS for quantitative work.
- Mention practical and ethical factors in method choice, not only theory.
- Use Berreman’s fieldwork to show how the researcher’s identity affects qualitative data in caste society.
- Common mistake: claiming one method is always superior; examiners reward fit between question and method.
Did you know?
- Malinowski did his famous Trobriand fieldwork partly because, as an Austrian subject in Australian territory during the First World War, he was allowed to stay in the islands rather than return.
- Memory trick: ‘Quant counts, Qual listens’.
Techniques of Data Collection
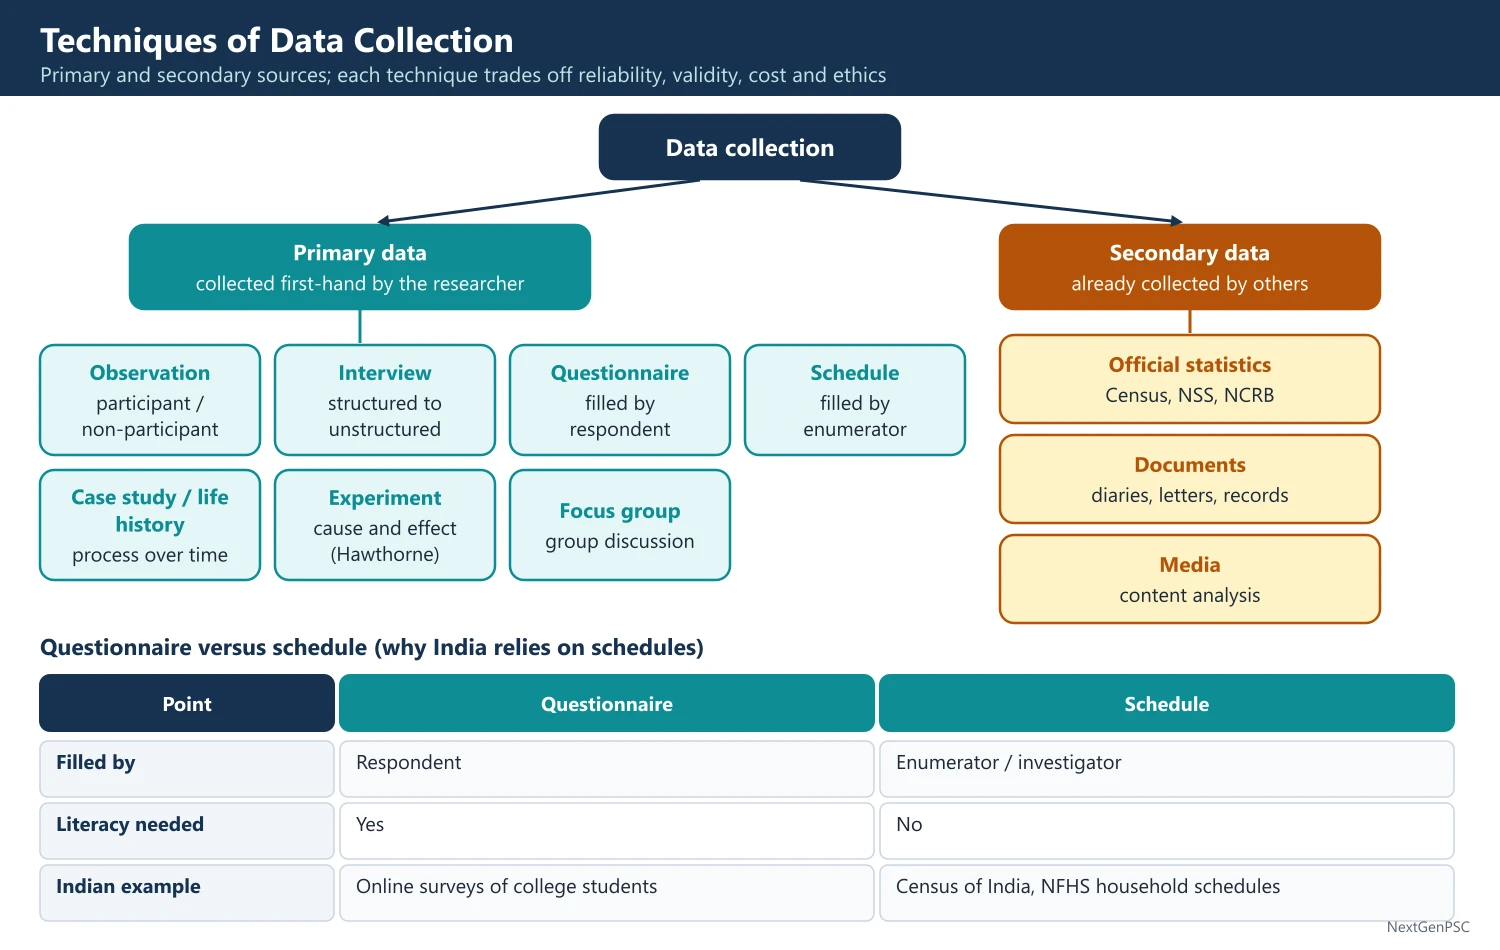
Sociologists collect primary data through observation, interviews, questionnaires, schedules, case studies, experiments and focus groups, and secondary data from official statistics, documents and media. Each technique has strengths and limits in reliability, validity, cost and ethics; in India the schedule (filled in by an enumerator) is widely used because of varied literacy, and the Census 2027 will be the first digital census.
In simple words
Data collection means the ways researchers gather information: watching people, asking them questions, giving them forms to fill, or reading records.
It is like a doctor who examines you, asks how you feel, gives you a form about your history and also reads your old reports.
Choosing the right tool decides whether the findings are trustworthy.
UPSC asks you to explain and compare these techniques with examples and their limits.
1. Concepts and Definitions
Primary data: data collected first-hand by the researcher for the present study.
Secondary data: data already collected by others, such as Census tables, NSS reports, court records, diaries or newspapers.
Research tool: the instrument used to gather data, such as a questionnaire, schedule, interview guide or observation checklist.
Rapport: a relationship of trust between researcher and respondents that makes honest data possible.
2. Observation
Participant observation: the researcher joins the group’s life; it may be overt (the group knows) or covert (the group does not know).
Non-participant observation: the researcher watches without joining, sometimes using a structured checklist.
Strengths: studies behaviour in natural settings, reveals the gap between what people say and do, gives insight into meanings.
Weaknesses: observer effect (people change when watched), researcher may ‘go native’ and lose detachment, small scale, ethical problems if covert.
Examples: Whyte’s Street Corner Society (1943) in Boston; Goffman’s year at St Elizabeths Hospital for Asylums (1961); Laud Humphreys’ covert Tearoom Trade (1970), criticised on ethical grounds.
Indian examples: Srinivas lived in Rampura in 1948 and 1952; Dube’s team studied Shamirpet in the early 1950s; Berreman’s Sirkanda fieldwork showed impression management by villagers.
3. Interviews
Structured interview: fixed questions in fixed order; easy to compare, used in surveys.
Semi-structured interview: a guide of topics with freedom to probe.
Unstructured (in-depth) interview: a conversation guided by the respondent’s concerns; gives depth and validity.
Focus group discussion: a guided group discussion of 6 to 12 people, useful for norms and shared views, for example on village sanitation or school meals.
Interviewer effects: the interviewer’s gender, caste, class and age can shape answers, which is especially important in India; Ann Oakley (1981) argued for non-hierarchical interviewing.
Social desirability bias: respondents may give socially approved answers, for example under-reporting dowry or untouchability practices.
4. Questionnaire and Schedule
Questionnaire: a list of questions answered by respondents themselves, by post, online or in person; cheap and wide, but needs literate respondents and has low response rates.
Schedule: a list of questions asked and filled in by an enumerator face to face; used where literacy varies; more costly but higher response and clarity.
Types of questions: closed (fixed options) and open-ended; good questions avoid leading, double-barrelled and vague wording.
Scales: Emory Bogardus’s social distance scale (1925), Louis Thurstone’s scale (1928), Rensis Likert’s summated rating scale (1932) and Louis Guttman’s cumulative scale (1944) measure attitudes.
Pilot study and pre-testing: trying the tool on a small group to correct confusing questions before the main study.
Indian example: the Census of India uses schedules filled by enumerators; for Census 2027 the house-listing phase runs in 2026 and population enumeration in February 2027, with data collected digitally through mobile apps and an option of self-enumeration.
5. Case Study, Life History and Other Techniques
Case study: intensive study of a single unit (a person, family, village, organisation or event); Frédéric Le Play’s studies of working-class family budgets (1855) are early examples.
Life history and personal documents: W.I. Thomas and Florian Znaniecki (The Polish Peasant in Europe and America, 1918–20) used letters and an autobiography to study migration.
Genealogical method: W.H.R. Rivers developed it for kinship studies; Indian village researchers use genealogies to trace lineage, land and marriage.
Sociometry: Jacob Moreno (Who Shall Survive?, 1934) mapped choices and relationships in groups as sociograms.
Experiments: laboratory (Stanley Milgram’s obedience study, 1963; Philip Zimbardo’s Stanford prison experiment, 1971) and field experiments; the Hawthorne studies (Western Electric, 1924–32) found that being observed itself changed workers’ output.
Panel and longitudinal studies: the same people are studied over time, as in Lazarsfeld’s voting study (1944) or India’s IHDS (2004–05 and 2011–12) with re-interviewed households.
Digital methods: online surveys, social media analysis and big data are now common, but raise issues of representativeness and privacy (India’s Digital Personal Data Protection Act, 2023).
6. Secondary Data and Content Analysis
Official statistics: Census, NSS/PLFS, NFHS, NCRB and Sample Registration System; cheap and large-scale but shaped by definitions and reporting (Cicourel’s critique).
Documents: government reports, court judgements, diaries, autobiographies, letters and archives; historians and sociologists such as Ghurye used Sanskrit texts and colonial records.
Content analysis: Bernard Berelson (1952) defined it as a research technique for the objective, systematic and quantitative description of the manifest content of communication; examples include studies of how matrimonial advertisements mention caste or how textbooks portray women.
Semiotic and discourse analysis: qualitative reading of media and texts for hidden meanings and power (Roland Barthes, Foucault).
7. Research Ethics
Principles: informed consent, voluntary participation, avoiding harm, confidentiality and anonymity, honesty in reporting.
Controversies: Humphreys’ covert study, Milgram and Zimbardo’s experiments led to stronger ethical review; professional bodies such as the American Sociological Association and British Sociological Association publish codes.
Indian context: research among Dalits, tribes, women facing violence or communities in conflict needs special care; consent must be meaningful where literacy and power differ.
8. Using it in the Exam
10 marks: define a technique (for example participant observation), two strengths, two weaknesses, one example.
15 marks: compare questionnaire and schedule, or structured and unstructured interview, with Indian context.
20 marks: primary versus secondary → observation, interview, questionnaire and schedule, case study, experiments → secondary data and content analysis → ethics → choosing techniques by research question → Indian examples (Census 2027, Rampura, Berreman, NFHS) → conclusion.
Diagram idea: a tree: data collection → primary (observation, interview, questionnaire, schedule, case study, experiment) and secondary (statistics, documents, media).
Useful point: Goode and Hatt (Methods in Social Research, 1952) stress that the schedule is filled by the investigator and the questionnaire by the respondent, a distinction UPSC often tests.
| Point | Questionnaire | Schedule |
|---|---|---|
| Filled by | Respondent | Enumerator / investigator |
| Literacy needed | Yes | No |
| Cost and reach | Cheap, wide (post, online) | Costly, needs trained staff |
| Response rate | Often low | High |
| Clarity of answers | Questions may be misunderstood | Enumerator can clarify |
| Indian example | Online surveys of college students | Census of India, NFHS household schedules |
| Technique | Best for | Main limit | Classic or Indian example |
|---|---|---|---|
| Participant observation | Meanings, hidden groups | Observer effect, ethics | Whyte (1943); Srinivas in Rampura |
| Structured interview / survey | Large-scale patterns | Surface answers | NFHS-5 (2019–21) |
| Unstructured interview | Depth, experience | Low reliability | Oakley (1981); Dalit women’s testimonios (Rege) |
| Case study / life history | Process over time | Generalisation | Thomas and Znaniecki (1918–20) |
| Experiment | Cause and effect | Artificial, ethical issues | Hawthorne studies (1924–32) |
| Content analysis | Media, documents | Context may be lost | Caste in matrimonial advertisements |
Mains points
- Typical angles: ‘participant observation: strengths and limits’, ‘questionnaire versus schedule’, ‘relevance of case study method’, ‘ethical issues in research’.
- Always pair a technique with a classic study and an Indian example.
- Discuss the Hawthorne effect and interviewer effects of caste and gender in Indian fieldwork.
- Mention the Census 2027 as the first digital census with self-enumeration and caste enumeration as current examples.
- Bring in ethics (Humphreys, Milgram) for any question on observation or experiments.
- Common mistake: mixing up questionnaire and schedule, or overt and covert observation.
Did you know?
- The ‘Hawthorne effect’ is named after the Hawthorne Works of Western Electric near Chicago, where output rose in some trials whatever the researchers changed, apparently because workers knew they were being watched.
- Memory trick: Questionnaire = ‘you fill it’; Schedule = ‘someone fills it for you’.
Variables, Sampling, Hypothesis, Reliability and Validity
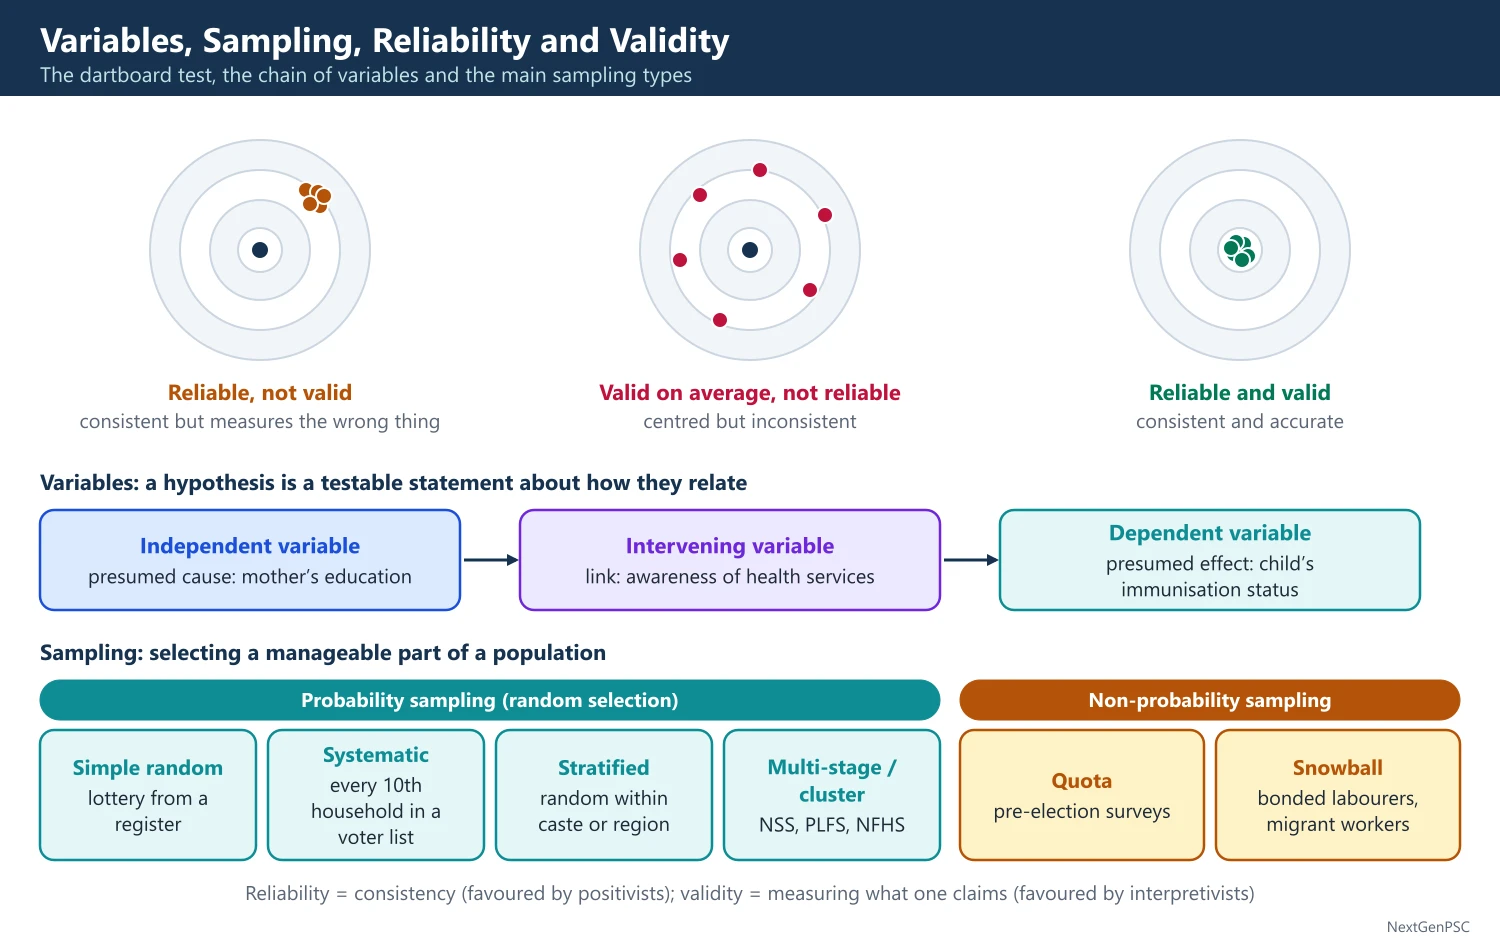
A variable is a characteristic that varies (income, caste, education), and research studies how independent variables affect dependent ones. A hypothesis is a testable statement about such a relationship; sampling selects a manageable part of a population to study; reliability means consistency of measurement and validity means measuring what one claims to measure. Positivists stress reliability, interpretivists stress validity.
In simple words
Research needs a clear guess to test (hypothesis), things that change (variables), a fair small group to study (sample) and trustworthy measurement.
Tasting one spoon of well-stirred dal tells you about the whole pot; that is sampling, but only if the dal is stirred well.
A weighing machine that gives the same reading each time is reliable; one that weighs correctly is valid.
UPSC asks you to define these terms, give types and show their use with Indian examples.
1. Variables
Concept and variable: a concept (for example ‘social status’) is abstract; a variable is its measurable form with different values (for example years of schooling or occupational rank).
Operationalisation: turning a concept into measurable indicators; for example ‘women’s empowerment’ in NFHS-5 is measured through indicators such as participation in household decisions, owning a bank account and owning a mobile phone.
Independent variable: the presumed cause (for example mother’s education).
Dependent variable: the presumed effect (for example child’s immunisation status).
Intervening variable: one that links the two (for example awareness of health services).
Extraneous or confounding variable: a third factor that affects both and can create a spurious relationship.
Spurious correlation: a classic textbook example is the correlation between storks and births in some regions, both linked to rural settings; Lazarsfeld’s ‘elaboration model’ tests whether a relationship survives controls.
Levels of measurement: nominal (caste, religion), ordinal (ranked categories such as social class), interval and ratio (income, age).
2. Hypothesis
Definition: William Goode and Paul Hatt (Methods in Social Research, 1952) define a hypothesis as a proposition which can be put to a test to determine its validity.
Features of a good hypothesis: clear concepts, empirically testable, specific, related to theory, and stated in terms of variables.
Types: descriptive, relational (between variables), causal; null hypothesis (no relationship) and alternative hypothesis.
Sources: theory (for example Durkheim’s integration thesis), previous research, analogy, personal experience and culture.
Role: it guides data collection and links theory with evidence; Popper stressed that hypotheses must be falsifiable.
Criticism: interpretivists and grounded theorists (Glaser and Strauss, 1967) argue that rigid hypotheses close off discovery; exploratory studies may start without them.
Indian example: ‘The higher the education of women, the later their age at marriage’ is testable with NFHS data; NFHS-5 (2019–21) found 23.3 percent of women aged 20–24 had married before 18, down from 26.8 percent in NFHS-4 (2015–16).
3. Sampling
Key terms: population or universe (all units), sampling frame (the list from which a sample is drawn), sampling unit, sample size, sampling error and bias.
Probability sampling: every unit has a known chance of selection, allowing statistical generalisation.
Simple random sampling: each unit has an equal chance, for example by lottery or random numbers.
Systematic sampling: every nth unit from a list after a random start.
Stratified sampling: the population is divided into strata (for example by caste or region) and samples drawn from each, ensuring representation of small groups.
Cluster and multi-stage sampling: groups (villages, urban blocks) are selected first, then households; India’s NSS and PLFS use stratified multi-stage designs with villages and urban blocks as first-stage units.
Non-probability sampling: convenience, quota (fixed numbers per category), purposive or judgement, and snowball sampling (for hidden groups such as bonded labourers or sex workers).
Classic failure: the 1936 Literary Digest poll wrongly predicted Alf Landon’s victory because its sample came from telephone and car owners, while George Gallup’s smaller sample correctly predicted Roosevelt.
Sample size: depends on population variation, desired precision and resources; a larger sample reduces sampling error but not bias.
4. Reliability
Definition: the consistency of a measure; the same method should give the same results when repeated under the same conditions.
Types: test-retest reliability (over time), inter-rater reliability (between observers), internal consistency or split-half reliability (between parts of a scale; Cronbach’s alpha, 1951).
Threats: vague questions, poorly trained interviewers, changing conditions.
Strength of quantitative methods: standardised tools such as structured schedules give high reliability, which is why national surveys use them.
5. Validity
Definition: the extent to which a measure captures what it claims to measure and findings are true.
Face and content validity: whether a measure appears to and actually covers all aspects of the concept, for example whether a poverty measure includes health and education, not only income.
Construct validity: whether the measure behaves as theory predicts.
Criterion validity: agreement with another accepted measure, either at the same time (concurrent) or later (predictive).
Internal validity: whether the observed effect is really caused by the independent variable.
External validity: whether findings can be generalised to other settings.
Indian example: income poverty lines (Tendulkar committee, 21.9 percent poor in 2011–12) and NITI Aayog’s multidimensional poverty index (14.96 percent in 2019–21) measure poverty differently; the choice affects validity.
Reliability without validity: a measure can be consistent but wrong; for example counting only registered complaints gives a reliable but invalid measure of domestic violence.
6. Linking Thinkers and Debates
Positivists versus interpretivists: positivists (Durkheim, Lazarsfeld) value reliability and representativeness; interpretivists (Weber, Blumer) value validity and meaning.
Durkheim’s Suicide as hypothesis testing: he tested the hypothesis that suicide varies inversely with social integration using religion, family and political crisis as indicators.
Merton’s middle-range theory: encouraged testable hypotheses linking theory and data.
7. Using it in the Exam
10 marks: define the term (hypothesis or sampling or validity), give types, one example.
15 marks: distinguish reliability and validity, with types and an Indian measurement example.
20 marks: variables and operationalisation → hypothesis (Goode and Hatt) → sampling types with NSS/NFHS example → reliability and validity types → positivist and interpretivist views → conclusion on balancing rigour and meaning.
Diagram idea: a dartboard figure: tight cluster off-centre (reliable, not valid), scattered around centre (valid on average, not reliable), tight cluster at centre (reliable and valid).
Useful definition: Goode and Hatt’s definition of hypothesis as ‘a proposition which can be put to a test to determine its validity’ (1952).
| Type | Method | Use | Example |
|---|---|---|---|
| Simple random | Equal chance for all | Homogeneous population with full list | Lottery of students from a register |
| Systematic | Every nth unit | Long lists | Every 10th household in a voter list |
| Stratified | Random within strata | Ensure small groups included | Sampling by caste or region |
| Multi-stage / cluster | Clusters, then units | Large countries | NSS, PLFS, NFHS |
| Quota | Fixed number per category | Quick opinion polls | Pre-election surveys |
| Snowball | Respondents refer others | Hidden groups | Bonded labourers, migrant workers |
| Point | Reliability | Validity |
|---|---|---|
| Question | Is the measure consistent? | Does it measure the right thing? |
| Types | Test-retest, inter-rater, split-half | Face, content, construct, criterion, internal, external |
| Favoured by | Positivists | Interpretivists |
| Methods strong on it | Surveys, structured schedules | Participant observation, in-depth interviews |
| Indian example | Same NFHS questions across rounds | Whether income lines capture poverty versus MPI |
Mains points
- Typical angles: ‘What is a hypothesis? Discuss its sources and role’, ‘reliability versus validity’, ‘relevance of sampling in social research’.
- Use precise definitions (Goode and Hatt for hypothesis, Berelson for content analysis) and types in a table.
- Give Indian survey examples: NSS/PLFS multi-stage sampling, NFHS indicators, poverty measures.
- Link reliability to positivism and validity to interpretivism, and show that good research needs both.
- Mention spurious correlation and the need for controls when discussing variables.
- Common mistake: defining sampling without types or examples; examiners expect at least probability versus non-probability.
Did you know?
- The 1936 Literary Digest poll mailed about ten million ballots and still got the US election wrong, while Gallup’s far smaller but better-designed sample got it right: size cannot fix bias.
- Memory trick: Reliability = Repeatable; Validity = Very true.
UPSC Previous Year Questions: Research Methods and Analysis
From 2014 to 2026 UPSC asked 31 question parts (410 marks) from Research Methods and Analysis, all in Paper I: 10 parts of 20 marks and 21 of 10 marks. The most-asked topic is variables, sampling, hypothesis, reliability and validity (14 parts, with four parts in 2025 alone), followed by techniques of data collection (9) and qualitative versus quantitative methods (8). Every question below has a model answer written to the UPSC word limit.
In simple words
Read the question and the Approach line, then write your own answer in 7 minutes for 10 marks or 11 minutes for 20 marks before looking at the model.
Compare your answer with the model: did you define the term with its thinker, cover every part of the directive, and give an Indian example such as NFHS, the Census or a village study?
Note what you missed in a notebook and revisit the matching notes topic of this chapter; methods questions repeat their core ideas often.
1. Qualitative and Quantitative Methods
Example 1 (UPSC 2024, 20 marks): What do you understand by 'mixed method'? Discuss its strengths and limitations in social research.
Paper and question: Paper I, Q4(a)
Approach: Define mixed methods with its main designs (Creswell, Denzin’s triangulation), then discuss strengths and limitations in two balanced blocks with Indian and classic examples, ending with a judgement.
Mixed method research combines quantitative and qualitative data collection and analysis within a single study, so that the strengths of one offset the weaknesses of the other. It grew out of Norman Denzin’s idea of triangulation (The Research Act, 1970) and was systematised by John Creswell, who distinguished convergent (parallel), explanatory sequential (survey first, then interviews) and exploratory sequential (interviews first, then survey) designs.
Flow chart: Exploratory design: qualitative fieldwork → themes and questionnaire items → survey of a large sample; Explanatory design: survey → puzzling results → in-depth interviews.
Strengths: first, it joins breadth with depth: a survey shows how widespread a pattern is, interviews show what it means to actors. Second, findings cross-checked by two methods are more valid. Third, qualitative work generates hypotheses and good questions that quantitative work then tests. The Marienthal study of unemployment (Jahoda, Lazarsfeld and Zeisel, 1933) and Goldthorpe’s Affluent Worker studies combined statistics with interviews and observation.
In India, Srinivas and Béteille combined household censuses of land and caste with participant observation in Rampura and Sripuram, and Untouchability in Rural India (Shah, Mander, Thorat, Deshpande and Baviskar, 2006) surveyed 565 villages while recording narratives of humiliation. Studies of platform workers today combine app-based surveys with interviews.
Limitations: positivism and interpretivism rest on different assumptions about social reality, so purists argue that mixing them is philosophically incoherent (a debated point). Mixed designs need more time, money and skills in both traditions; when the two sets of findings conflict, integrating them is difficult, and the qualitative part often becomes a mere add-on to the survey.
Thus mixed methods are best seen as methodological pluralism: the research question, not loyalty to a paradigm, should decide the combination, and a well-designed study can gain both representativeness and meaning.
Example 2 (UPSC 2023, 20 marks): What are the different dimensions of qualitative method? Do you think that qualitative method helps to gain a deeper sociological insight? Give reasons for your answer.
Paper and question: Paper I, Q6(a)
Approach: First list the dimensions of qualitative method (philosophical, design, techniques, analysis, researcher role), then argue with reasons and studies that it gives deeper insight, with a caveat on its limits.
Qualitative method studies social life through non-numerical data such as words, observations and images, seeking to understand meanings in their natural context. It rests on Weber’s Verstehen, Schutz’s phenomenology and the symbolic interactionism of Mead and Blumer.
Dimensions: (i) philosophical: interpretivism, which treats reality as socially constructed (Berger and Luckmann, 1966); (ii) design: flexible and inductive, with concepts emerging from data, as in Glaser and Strauss’s grounded theory (1967); (iii) techniques: participant observation, in-depth interviews, focus groups, life histories, case studies and documents; (iv) analysis: thematic coding and Geertz’s thick description (1973), interpreting actions within their web of meanings; (v) the researcher as instrument, which demands reflexivity about one’s own caste, gender and class.
Why it yields deeper insight: first, it captures the actor’s point of view; Srinivas’s long stay in Rampura showed how the dominant caste actually exercised power, beyond what census tables showed. Second, it reveals the gap between what people say and do; Berreman found that Sirkanda villagers presented different faces depending on the caste of his interpreter. Third, it studies hidden or sensitive groups and processes such as untouchability, domestic violence or manual scavenging, where surveys meet silence. Fourth, it discovers new concepts: Sanskritisation and dominant caste came from fieldwork, as did Goffman’s total institution (Asylums, 1961).
Yet its small samples, low reliability and risk of researcher bias limit generalisation, as positivists note. Hence qualitative method does give deeper insight into meaning and process, and its findings gain strength when checked against quantitative data such as NFHS or IHDS.
Example 3 (UPSC 2021, 20 marks): How do qualitative and quantitative methods supplement each other in sociological enquiry?
Paper and question: Paper I, Q3(a)
Approach: Contrast the two methods briefly, then show the ways they supplement each other (sequence, triangulation, explaining and generalising) with classic and Indian studies, and conclude on methodological pluralism.
Quantitative methods, rooted in positivism, measure social facts through surveys and statistics and value reliability and representativeness; qualitative methods, rooted in interpretivism, study meanings through observation and interviews and value validity and depth. The old ‘paradigm war’ has given way to the view that each covers the other’s blind spots.
Ways they supplement each other: first, qualitative work generates hypotheses and questionnaire items, and surveys then test them on large samples; second, surveys identify patterns and qualitative work explains them; third, Denzin’s triangulation (1970) cross-checks one method’s findings with another, raising validity; fourth, qualitative case studies are generalised through quantitative data, while statistics are humanised by narratives.
Flow chart: Fieldwork → concepts and hypotheses → survey → statistical patterns → in-depth interviews to explain them → theory.
Classic examples: Durkheim’s statistical Suicide (1897) was later criticised by Douglas (1967) for ignoring the meanings coroners attach to deaths, showing the need for both; the Marienthal study (1933) and Goldthorpe’s Affluent Worker used surveys with interviews.
Indian examples: Srinivas’s concept of dominant caste, found through fieldwork in Rampura, has been tested in many states with land and electoral data; CSDS-Lokniti election surveys show caste-wise voting, while ethnographies explain why caste loyalties shift. NFHS-5 (2019–21) shows that 23.3 percent of women aged 20–24 married before 18, but qualitative studies reveal the family honour and dowry pressures behind these numbers. Similarly, Untouchability in Rural India (2006) combined a 565-village survey with narratives.
Thus the two methods are complementary: numbers tell us how much and how widespread, meanings tell us why and how, and a mature sociology uses both according to the research question.
Example 4 (UPSC 2019, 20 marks): Bring out the significance of Ethnography in social research.
Paper and question: Paper I, Q2(b)
Approach: Define ethnography (Malinowski’s fieldwork tradition), bring out its significance point by point with world and Indian village studies, then note its limits and the reflexive turn before concluding.
Ethnography is the study of a group’s way of life from within, through prolonged fieldwork, participant observation, informal interviews and field notes, producing a holistic written account. Bronisław Malinowski’s Trobriand fieldwork (Argonauts of the Western Pacific, 1922) made it the core method of anthropology, and the Chicago School carried it into urban sociology.
Significance: first, it grasps ‘the native’s point of view’, as Malinowski put it, rather than imposing the researcher’s categories. Second, it is holistic, linking kinship, economy, religion and politics, as Srinivas’s The Remembered Village (1976) did for Rampura. Third, it records behaviour in natural settings and so exposes the gap between ideal norms and actual practice; Srinivas’s ‘field view’ of caste corrected the ‘book view’ drawn from texts.
Fourth, it generates concepts and hypotheses: dominant caste, Sanskritisation and Marriott’s universalisation and parochialisation (Kishan Garhi) emerged from village ethnography. Fifth, it gives voice to marginal groups; Whyte’s Street Corner Society (1943) and Verrier Elwin’s tribal ethnographies showed the internal order of groups outsiders saw as disorganised. Sixth, Béteille’s Sripuram study (Caste, Class and Power, 1965) and Kathleen Gough’s Kumbapettai showed how caste, class and power were changing on the ground.
Seventh, it adapts to new settings: digital ethnography now studies online communities, WhatsApp groups and platform work.
Limitations: it is time-consuming, small in scale and hard to replicate; the researcher may ‘go native’ or be misled, as Berreman’s Behind Many Masks (1962) showed. Clifford and Marcus’s Writing Culture (1986) argued that ethnographies are partial, authored texts shaped by power, which led to greater reflexivity.
Ethnography therefore remains indispensable for understanding meaning and process, especially in a diverse society like India, and gains further strength when combined with survey data.
Example 5 (UPSC 2018, 10 marks): Distinguish between quantitative and qualitative techniques of data collection with suitable examples from Indian society.
Paper and question: Paper I, Q5(d)
Approach: Distinguish the two sets of techniques on a few clear criteria (nature of data, tools, sample, strengths), each with an Indian example, and close by noting their complementarity.
Quantitative techniques collect numerical, standardised data to measure and compare; qualitative techniques collect words, observations and narratives to understand meanings.
Flow chart: 2 × 2 contrast: Quantitative = structured schedule, large random sample, high reliability; Qualitative = observation or in-depth interview, small purposive sample, high validity.
Tools: quantitative work uses structured questionnaires, schedules, attitude scales and official records; the Census of India and NFHS-5 (2019–21) use enumerator-filled schedules across lakhs of households. Qualitative work uses participant observation, unstructured interviews, focus groups and life histories, as in Srinivas’s fieldwork in Rampura.
Sample and generalisation: quantitative surveys like PLFS use stratified multi-stage random samples to estimate national rates; qualitative studies use small purposive or snowball samples, such as interviews with manual scavengers or bonded labourers.
Researcher role and output: the quantitative researcher stays detached and produces tables and correlations, for example caste-wise literacy; the qualitative researcher builds rapport and produces thick description, for example Dalit women’s experience of humiliation.
Strengths: the first gives reliability and policy-ready figures; the second gives validity and depth. In practice Indian studies of caste or gender combine both.
Example 6 (UPSC 2018, 10 marks): Explain with examples, the explanatory and exploratory designs of social research.
Paper and question: Paper I, Q6(c)
Approach: Define research design, explain exploratory and explanatory designs (Selltiz and colleagues’ classification) with their purpose, method and an Indian example each, and show how they connect.
A research design is the plan that links a research question to data collection and analysis. Selltiz, Jahoda, Deutsch and Cook (Research Methods in Social Relations, 1959) classified designs as exploratory (formulative), descriptive and hypothesis-testing (explanatory or experimental).
Exploratory design is used when a topic is new or little understood. Its aim is to gain familiarity, clarify concepts and formulate hypotheses, not to test them. It is flexible and uses literature review, interviews with experienced persons, case studies and observation. Example: early studies of app-based delivery workers in Indian cities explored their working conditions before structured surveys.
Explanatory design seeks cause-and-effect relationships between variables. It states a hypothesis, defines independent and dependent variables, controls other factors and uses surveys or experiments. Durkheim’s Suicide (1897) explained suicide rates by social integration. In India, one may test whether women’s schooling raises age at marriage using NFHS-5 data, controlling for caste and wealth.
Flow chart: Exploratory (questions, concepts, hypotheses) → Descriptive (how much, how widespread) → Explanatory (why: testing causes).
The two are stages of one cycle: exploration yields hypotheses that explanation tests, and puzzling results call for fresh exploration.
Example 7 (UPSC 2017, 10 marks): Examine epistemological foundations of qualitative methods of social research.
Paper and question: Paper I, Q3(c)
Approach: Explain the ontological and epistemological assumptions behind qualitative methods (Dilthey, Weber, Schutz, interactionism, ethnomethodology, social construction), contrast with positivism, and show the Indian application.
Epistemology concerns how we can know social reality. Qualitative methods rest on interpretivism, which holds that human action is meaningful and must be understood, not merely measured as positivism assumes.
Wilhelm Dilthey distinguished the human sciences, which seek understanding, from the natural sciences, which seek explanation. Weber built on this: sociology interprets social action through Verstehen, grasping the subjective meaning actors attach to action. Schutz’s phenomenology argued that people act on taken-for-granted common-sense knowledge, which the researcher must uncover. Mead and Blumer held that meanings arise and change in interaction, so the researcher must study them in natural settings. Garfinkel’s ethnomethodology studied how members produce everyday order, and Berger and Luckmann (1966) saw reality itself as socially constructed.
Hence knowledge is inductive, contextual and co-produced with participants, and the researcher must be reflexive about his or her position. In India, Srinivas’s ‘field view’ of caste and Berreman’s Sirkanda fieldwork reflect these foundations.
Positivists criticise this as subjective and unverifiable, which is why interpretivists stress validity, triangulation and transparency.
Example 8 (UPSC 2016, 10 marks): Analyze the importance of qualitative method in social research.
Paper and question: Paper I, Q1(c)
Approach: Define qualitative method and its interpretive base, analyse its importance in four or five points with world and Indian studies, and add a brief limitation for balance.
Qualitative method studies social life through observation, in-depth interviews, life histories and documents, aiming at Weber’s Verstehen, the understanding of meanings actors give to their actions.
Importance: first, it captures the actor’s viewpoint and context, giving high validity. Second, it reveals the gap between norms and practice; Srinivas’s ‘field view’ of caste in Rampura corrected text-based views. Third, it studies sensitive or hidden groups, such as Dalit experiences of untouchability or Goffman’s mental patients in Asylums (1961). Fourth, it generates new concepts and hypotheses, such as Sanskritisation and dominant caste, which surveys later test. Fifth, it explains processes behind statistics: why girls drop out of school or why caste persists in urban marriages.
It also suits exploratory research on new phenomena such as platform work or online communities.
Its small samples and low reliability limit generalisation, so its importance is greatest when it is combined with quantitative data.
2. Techniques of Data Collection
Example 9 (UPSC 2024, 20 marks): How do you view and assess the increasing trend of digital ethnography and use of visual culture in sociological research?
Paper and question: Paper I, Q3(a)
Approach: Define digital ethnography and visual methods with their pioneers (Hine, Boellstorff, Miller, Pink, Rose), explain why the trend is growing, then assess its gains and problems with Indian examples, ending with a balanced view.
Digital ethnography extends participant observation to online spaces such as social media, WhatsApp groups and platform work. Christine Hine’s Virtual Ethnography (2000) and Tom Boellstorff’s study of the virtual world Second Life (2008) established it. Visual methods use photographs, films, videos and memes as data or as tools of research; Sarah Pink and Gillian Rose developed visual ethnography and visual methodologies.
Why the trend is growing: social life itself has moved online. India’s cheap mobile data and smartphones have made WhatsApp, YouTube and Instagram everyday spaces of caste, religion, politics, romance and work.
Gains: first, access to dispersed or hidden groups such as LGBTQ communities or gig workers. Second, naturally occurring data: posts, comments and videos show how identities are performed, extending Goffman’s presentation of self. Third, visual data capture what words miss: Dalit and Adivasi creators on YouTube and Instagram assert identity through music and dress, and the farmers’ protest of 2020–21 used social media to frame its cause. Fourth, the ‘Why We Post’ project led by Daniel Miller included a study of a town in Tamil Nadu, showing that social media use is shaped by local caste, gender and family norms.
Problems: first, representativeness: the digital divide excludes many rural, poor and older people, and NFHS-5 (2019–21) found far fewer women than men had ever used the internet. Second, ethics: informed consent in public groups is unclear, anonymity is hard when posts are searchable, and the Digital Personal Data Protection Act, 2023 raises questions of personal data. Third, authenticity: online selves are curated and algorithms decide what the researcher sees.
Flow chart: Offline life moves online → new field sites (feeds, groups, videos) → richer access and visual data → but issues of sampling, consent and authenticity → combine online and offline fieldwork.
Hence digital and visual ethnography is a valuable extension of fieldwork, best combined with offline observation and governed by clear ethical rules.
Example 10 (UPSC 2023, 10 marks): What are the ethical issues that a researcher faces in making use of participant observation as a method of collecting data? Explain.
Paper and question: Paper I, Q6(c)
Approach: Define participant observation, then explain the main ethical issues one by one (consent and covert research, harm, confidentiality, going native, power and reporting) with classic and Indian examples, and close with safeguards.
Participant observation means living in a group and sharing its life to study it from within; because it involves close personal relationships, it raises sharper ethical issues than surveys.
Informed consent and deception: in covert observation the group does not know it is being studied; Laud Humphreys’ Tearoom Trade (1970) was condemned for deceiving subjects and tracing their homes. Harm and confidentiality: published accounts may expose people to stigma, police action or community anger; village studies in India have identified real persons even when names were changed.
Exploitation of trust: rapport, gifts and friendship can make respondents reveal more than they intended. Going native and partisanship: the observer may take sides in caste or factional conflict, as Berreman’s experience in Sirkanda showed. Illegal acts: observing crime, violence or untouchability practices creates a dilemma between confidentiality and duty to report.
Safeguards include overt research where possible, consent, anonymity, honest reporting and ethical review under professional codes such as those of the British Sociological Association and the American Sociological Association.
Example 11 (UPSC 2022, 10 marks): The difference between information and data in social science is subtle. Comment.
Paper and question: Paper I, Q1(c)
Approach: Define data and information, explain the subtle difference (processing, context, interpretation) with Indian examples, and note the interpretivist point that both are socially constructed.
Data are raw, unorganised facts or observations recorded by the researcher, such as responses in a schedule, field notes or counts. Information is data that has been processed, organised and interpreted so that it has meaning for a purpose.
The difference is subtle because the same item can be either, depending on processing and context. Individual Census 2011 returns on age and sex are data; the sex ratio of 943 females per 1,000 males, compared across states and decades, is information that signals son preference. Similarly, NCRB case counts become information about crimes against women only when related to population and reporting practices.
Russell Ackoff’s data-information-knowledge-wisdom hierarchy (1989) describes this chain: data become information through organisation and knowledge through theory.
Interpretivists add that even ‘raw’ data are not neutral: Cicourel and Atkinson showed that official statistics are shaped by the definitions and decisions of those who record them. So the researcher must examine how data were produced before treating them as information.
Example 12 (UPSC 2022, 10 marks): Suggest measures to minimize the influence of the researcher in the process of collecting data through focus group discussion.
Paper and question: Paper I, Q3(c)
Approach: Define focus group discussion (Merton’s focused interview), identify how the researcher can influence data, then suggest measures stage by stage (design, moderation, analysis) with an Indian example.
A focus group discussion is a guided discussion among about 6 to 12 participants on a topic, developed from Robert Merton’s focused interview (Merton and Kendall, 1946). The moderator’s questions, body language, identity and reactions can shape what participants say, producing moderator bias and social desirability effects.
Design stage: form homogeneous groups so that participants speak freely; choose a moderator whose language, gender and social background do not intimidate them, for example a woman moderator for an FGD with rural women on menstrual hygiene; prepare a neutral, pre-tested discussion guide with open questions.
During discussion: set ground rules, avoid leading questions and approving nods, do not give one’s own opinions, encourage quiet members and restrain dominant ones. A separate note-taker and recording reduce selective memory.
Analysis stage: code transcripts systematically, use more than one coder, keep a reflexive diary on one’s own caste, class and gender, and triangulate findings with surveys or individual interviews. These steps cannot remove influence entirely but make it visible and controlled.
Example 13 (UPSC 2021, 10 marks): Discuss the challenges involved in collecting data through census method.
Paper and question: Paper I, Q1(c)
Approach: Define the census method, then discuss its challenges under logistical, methodological and political heads using the Indian Census (2011, the postponed 2021 round and Census 2027), and conclude briefly.
The census method collects data from every unit of a population rather than a sample. The decennial Census of India, conducted since 1872 and synchronously since 1881, is the world’s largest such exercise.
Logistical challenges: enormous cost, time and manpower (lakhs of enumerators), training them to apply definitions uniformly, and reaching remote areas. The 2021 round was postponed because of COVID-19; Census 2027 has the reference date 1 March 2027 (1 October 2026 for snow-bound areas) and uses mobile apps and self-enumeration, raising issues of data security.
Methodological challenges: under-coverage of the homeless, migrants and nomadic groups; age heaping and misreporting; respondent fatigue with long schedules; and limited depth, since a census can ask only simple questions.
Social and political challenges: returns on religion, mother tongue and caste are sensitive; caste was last fully enumerated in 1931 and the SECC 2011 caste data were never fully released, and Census 2027 is to include caste enumeration. Hence the census gives unmatched coverage but needs sample surveys for depth.
Example 14 (UPSC 2020, 10 marks): Analyse the strengths and weaknesses of social survey method in social research.
Paper and question: Paper I, Q6(c)
Approach: Define the social survey with early examples, then analyse strengths and weaknesses in two balanced blocks with Indian surveys (NSS, NFHS, PLFS) and critics (Cicourel), ending with a short judgement.
A social survey collects standardised information from a large number of respondents, usually a sample, through questionnaires, schedules or structured interviews. Charles Booth’s survey of London poverty (1886–1903) and Seebohm Rowntree’s study of York (1899) were early examples; in India the National Sample Survey has run since 1950.
Strengths: wide coverage and representativeness with probability samples, so findings can be generalised, as with NFHS-5 (2019–21) or PLFS on employment; high reliability because questions are standardised and can be repeated; comparison across caste, region and time; and direct use in policy.
Weaknesses: it captures what people say, not what they do; answers may be shaped by social desirability, such as under-reporting dowry or untouchability; the researcher’s categories may not fit respondents’ meanings, lowering validity; non-response and interviewer effects of caste or gender distort results. Cicourel and other interpretivists argue that survey data are constructed by the instrument itself.
Thus the survey is indispensable for breadth, but it gains validity when supported by qualitative methods.
Example 15 (UPSC 2016, 20 marks): "Participant observation is the most effective tool for collecting facts." Comment.
Paper and question: Paper I, Q4(b)
Approach: Explain participant observation and its claim to effectiveness with classic and Indian studies, then critically weigh its limits (observer effect, bias, ethics, generalisation), and conclude that effectiveness depends on the research question.
Participant observation is a technique in which the researcher takes part in the daily life of a group over a long period, observing and recording behaviour in its natural setting. It was made central by Malinowski’s Trobriand fieldwork and the Chicago School, and it underlies interpretive sociology’s aim of Verstehen.
Why it is considered most effective: first, it observes what people do, not only what they say, closing the gap that surveys leave. Second, it captures meanings and context; Whyte’s Street Corner Society (1943) found an organised social world in a Boston slum, and Goffman’s Asylums (1961) revealed the inmate’s view of the total institution. Third, in India, Srinivas’s stay in Rampura produced the concepts of dominant caste and Sanskritisation, and Béteille’s Sripuram study showed how caste, class and power were separating.
Limits: first, the observer effect: people change when watched, as the Hawthorne studies (1924–32) suggested. Second, selective perception and ‘going native’ reduce objectivity; Berreman found that Sirkanda villagers showed him different faces depending on his interpreter’s caste. Third, findings from one village or group cannot be generalised and are hard to replicate, so reliability is low. Fourth, it is slow, costly and limited by the researcher’s gender, caste or language. Fifth, covert observation raises ethical problems, as in Humphreys’ Tearoom Trade (1970). Finally, it cannot study the past or large-scale patterns such as national fertility trends, for which the Census or NFHS are needed.
Hence participant observation is the most effective tool for collecting facts about meanings, interaction and hidden practices, but not for every question; facts about distribution and trends need surveys and records. Triangulation with other methods gives the fullest picture.
Example 16 (UPSC 2014, 10 marks): In what way biographies could be used to study social life?
Paper and question: Paper I, Q1(d)
Approach: Define the biographical or life-history method (Thomas and Znaniecki, Mills), show how biographies reveal social life with Indian examples such as Dalit autobiographies, and note limits.
Biographies, autobiographies and life histories are personal documents that trace an individual’s life over time. C. Wright Mills’ sociological imagination (1959) is the ability to grasp the intersection of biography and history, which is why personal lives illuminate social structure.
Uses: first, they show how social change is experienced; Thomas and Znaniecki’s The Polish Peasant in Europe and America (1918–20) used letters and a life history to study migration and disorganisation.
Second, they give voice to the marginalised: Dalit autobiographies such as Omprakash Valmiki’s Joothan (1997) and Bama’s Karukku (1992) reveal the lived humiliation of caste that statistics cannot capture. Third, they trace careers, mobility and identity formation, such as first-generation learners or migrant workers. Fourth, they generate hypotheses for wider study, and Oscar Lewis’s family life histories in The Children of Sánchez (1961) shaped debates on poverty.
Limits: memory is selective, accounts may be self-justifying, and one life may not represent a group, so biographies are best checked against other sources.
Example 17 (UPSC 2014, 20 marks): Which research technique would be most suitable for the study of consumer behaviour and its social correlates? Explain.
Paper and question: Paper I, Q2(a)
Approach: State that consumer behaviour has economic, social and cultural correlates (Veblen, Bourdieu), argue for a mixed-method design with a stratified survey as backbone plus qualitative techniques, explain each with Indian examples, and justify the choice.
Consumer behaviour is not only an economic choice; sociologists see it as shaped by class, caste, gender, age, region and status. Thorstein Veblen’s idea of conspicuous consumption (The Theory of the Leisure Class, 1899) and Pierre Bourdieu’s Distinction (1979), which linked taste to class and cultural capital, show that consumption marks social position. Studying it therefore needs both measurement of patterns and understanding of meanings.
The backbone: a sample survey. To find how consumption varies with social correlates, a stratified random sample of households across income, caste, rural-urban location and region, with a structured schedule on spending, brands and purchase decisions, allows cross-tabulation and testing of hypotheses such as ‘education raises spending on health and schooling’. The Household Consumption Expenditure Survey 2022–23 shows the value of such data. Bourdieu himself combined a large survey with interviews.
Qualitative techniques for meaning: in-depth interviews and focus groups reveal why people buy, for example why weddings involve heavy spending on gold and display, or how aspirational middle-class families choose English-medium schools; Leela Fernandes’ India’s New Middle Class (2006) discussed consumption as a marker of new middle-class identity. Participant observation in malls, weekly haats and kirana shops shows actual behaviour rather than reported behaviour. Content analysis of advertisements shows how gender and status are sold.
Flow chart: Exploratory interviews and FGDs → questionnaire design → stratified household survey → statistical correlates → follow-up interviews and observation → explanation.
Digital data: online purchase records and social media trends now add large-scale behavioural data, though with problems of privacy and representativeness.
Hence no single technique suffices: a mixed-method design with a representative survey for social correlates and qualitative techniques for meanings is most suitable, giving both reliability and validity.
3. Variables, Sampling, Hypothesis, Reliability and Validity
Example 18 (UPSC 2025, 10 marks): What is a variable in social research? What are their different types? Elaborate.
Paper and question: Paper I, Q1(c)
Approach: Define a variable as the measurable form of a concept, then elaborate its types by causal role and by level of measurement, each with an Indian example.
A variable is a characteristic that can take different values across people, groups or time. It is the measurable form of an abstract concept, obtained through operationalisation: ‘social status’ becomes years of schooling or occupational rank.
By causal role: the independent variable is the presumed cause (mother’s education) and the dependent variable the presumed effect (child’s immunisation); an intervening variable links them (awareness of health services); an extraneous or confounding variable affects both and can create a spurious relationship (household wealth); a moderating variable changes the strength of a relationship (rural or urban residence); a control variable is held constant to isolate the effect.
By level of measurement: nominal (caste, religion), ordinal (ranked class categories), interval (attitude scale scores) and ratio (income, age). Variables may also be discrete, such as number of children, or continuous, such as height.
Durkheim used religion and marital status as indicators of integration in Suicide, and NFHS-5 operationalises women’s empowerment through decision-making and bank account ownership. Correct classification decides which statistical tests a researcher can use.
Example 19 (UPSC 2025, 10 marks): What do you mean by reliability? Discuss the importance of reliability in social science research.
Paper and question: Paper I, Q2(c)
Approach: Define reliability with its main types, then discuss its importance in social science research with Indian survey examples, and note that reliability alone does not ensure validity.
Reliability is the consistency of a measure: the same tool, used again under similar conditions or by different researchers, should give the same results. Its forms are test-retest reliability (over time), inter-rater reliability (between observers) and internal consistency (between items of a scale, measured by Cronbach’s alpha, 1951).
Importance: first, it makes research replicable, so that findings can be checked by others, a core requirement of science stressed by positivists from Durkheim to Lazarsfeld. Second, it allows comparison across groups and over time; NFHS rounds can track child marriage or anaemia only because the same standardised questions are asked each time. Third, it reduces random error from vague questions or untrained interviewers, which matters in India where enumerators of different languages and castes work across diverse regions.
However, a measure can be reliable but invalid: counting only registered complaints gives a consistent but misleading measure of domestic violence.
Hence reliability is a necessary but not sufficient condition for good research and must be combined with validity.
Example 20 (UPSC 2025, 10 marks): What is hypothesis? Critically evaluate the significance of hypothesis in social research.
Paper and question: Paper I, Q3(c)
Approach: Define hypothesis (Goode and Hatt) with an Indian example, explain its significance, then critically evaluate it with the views of Popper, grounded theorists and interpretivists, ending with a balanced judgement.
A hypothesis is a tentative statement of the relationship between two or more variables; Goode and Hatt (Methods in Social Research, 1952) define it as a proposition that can be put to a test to determine its validity. Example: ‘the higher a woman’s education, the later her age at marriage’, testable with NFHS-5 data.
Significance: it gives direction and focus to research, decides which data to collect, links theory with evidence, and allows findings to accumulate into theory, as in Durkheim’s testing of the integration hypothesis in Suicide. Karl Popper stressed that scientific hypotheses must be falsifiable.
Critical evaluation: a rigid hypothesis may close off discovery; Glaser and Strauss’s grounded theory (1967) argued for building theory from data, and exploratory or ethnographic studies, such as Srinivas’s Rampura work, often began without one. Interpretivists add that meanings cannot always be reduced to variables, and a hypothesis may introduce the researcher’s bias.
Thus hypotheses are essential for explanatory research but not mandatory for exploratory work.
Example 21 (UPSC 2025, 20 marks): What is sampling in the context of social research? Discuss different forms of sampling with their relative advantages and disadvantages.
Paper and question: Paper I, Q7(a)
Approach: Define sampling and its key terms, then discuss probability and non-probability forms one by one with their advantages and disadvantages and Indian examples (NSS, PLFS, NFHS, snowball studies), ending with how to choose.
Sampling is the selection of a part of a population (universe) to study it and draw conclusions about the whole. Key terms are the sampling frame (the list from which units are drawn), sampling unit, sample size and sampling error.
Probability sampling gives every unit a known, non-zero chance of selection. Simple random sampling is unbiased and allows estimation of sampling error, but needs a complete frame and may miss small groups. Systematic sampling (every nth unit after a random start) is easy, but periodic patterns in the list can bias it. Stratified sampling divides the population into strata such as caste or region and samples each, ensuring representation of minorities and greater precision, but needs prior information. Cluster and multi-stage sampling select villages or urban blocks first and then households; it is cheap for large, dispersed populations but has higher sampling error. India’s NSS and PLFS use stratified multi-stage designs, and NFHS-5 (2019–21) covered about 6.37 lakh households this way.
Non-probability sampling does not give known chances. Convenience sampling is quick but biased. Quota sampling fills fixed numbers per category, such as gender and caste, but selection within quotas is the interviewer’s choice. Purposive sampling selects informed or typical cases, useful in village studies, but depends on judgement. Snowball sampling reaches hidden groups such as bonded labourers or manual scavengers through referrals, but networks bias it. None permits statistical generalisation.
Flow chart: Research aim → generalisation needed? → yes: probability (random, systematic, stratified, cluster) / no or no frame: non-probability (convenience, quota, purposive, snowball).
A classic warning is the 1936 Literary Digest poll, whose huge but biased sample from telephone and car owners wrongly predicted Roosevelt’s defeat. The choice thus depends on the research aim, frame and resources: probability samples for representative surveys, non-probability samples for exploratory work.
Example 22 (UPSC 2023, 10 marks): What are variables? How do they facilitate research?
Paper and question: Paper I, Q2(c)
Approach: Define variables and operationalisation briefly, then show the ways variables facilitate research (precision, hypothesis testing, causal analysis, comparison) with Indian examples, adding a short interpretivist caution.
Variables are measurable characteristics that vary across units, such as caste, income, age at marriage or literacy. They translate abstract concepts into observable indicators through operationalisation; for example, NFHS-5 measures women’s empowerment through decision-making, bank account and mobile phone ownership.
How they facilitate research: first, they make concepts precise and measurable, so that different researchers mean the same thing. Second, they allow hypotheses to be stated and tested, such as ‘landholding size is related to political influence in the village’, an idea linked to Srinivas’s dominant caste. Third, the distinction between independent, dependent, intervening and confounding variables enables causal analysis; Lazarsfeld’s elaboration model tests whether a relationship survives controls. Fourth, they permit comparison across groups and time, for example SC, ST and other households in IHDS rounds.
Durkheim’s Suicide treated religion, marital status and political crisis as variables to explain suicide rates.
Interpretivists caution that meanings such as honour or humiliation resist reduction to variables, so variables are best combined with qualitative insight.
Example 23 (UPSC 2022, 20 marks): Explain the different types of non-probability sampling techniques. Bring out the conditions of their usage with appropriate examples.
Paper and question: Paper I, Q2(b)
Approach: Define non-probability sampling and when it is used, then explain each type (convenience, purposive, quota, snowball, theoretical) with its conditions of use and an Indian example, and close with its limits.
Non-probability sampling selects units without giving each a known chance of selection. It is used when no sampling frame exists, when the population is hidden or small, when the study is exploratory or qualitative, or when time and money are limited. It sacrifices statistical generalisation for access and depth.
Convenience (accidental) sampling takes whoever is easily available, such as students in one college or commuters at a railway station. It suits pilot studies and pre-testing a questionnaire, but not claims about a population.
Purposive (judgement) sampling selects cases the researcher judges typical or information-rich. It suits case studies and village ethnography; Srinivas chose Rampura as a multi-caste village where he could study caste relations, and researchers studying panchayats may deliberately choose villages with women sarpanches.
Quota sampling fixes numbers for categories, such as gender, caste and age, in proportion to the population, and the interviewer fills them. It suits quick opinion and market surveys where categories are known but no list is available, though choice within each quota remains biased.
Snowball sampling begins with a few respondents who refer others. It suits hidden or stigmatised groups without lists, such as bonded labourers, manual scavengers, sex workers, transgender communities or migrant construction workers. Its weakness is that it follows networks and misses isolated members.
Theoretical sampling, proposed by Glaser and Strauss (1967) in grounded theory, selects new cases as the emerging theory requires, until no new categories appear (saturation).
Flow chart: No frame or hidden group → snowball; known categories, no list → quota; need typical or rich cases → purposive; pilot or quick check → convenience; building theory → theoretical.
These techniques cannot estimate sampling error or support statistical generalisation, so findings should be presented as indicative and, where possible, cross-checked with probability-based data such as NSS or NFHS.
Example 24 (UPSC 2022, 10 marks): What is reliability? Explain the different tests available to social science researcher to establish reliability.
Paper and question: Paper I, Q4(c)
Approach: Define reliability, then explain the tests of reliability one by one (test-retest, parallel forms, split-half, internal consistency, inter-rater) with brief Indian illustrations.
Reliability is the consistency or stability of a measuring instrument: it should yield the same results when repeated under similar conditions. It is a precondition for validity but does not guarantee it.
Test-retest method: the same tool is given to the same respondents after an interval and the two sets of scores are correlated; for example, re-surveying a sample of households on caste attitudes after a month. Its weakness is that memory or real change may affect the second round. Parallel or alternate forms: two equivalent versions of a questionnaire are used and their results compared, which avoids memory effects.
Split-half method: the items of a scale are divided into two halves and their scores correlated. Internal consistency: Cronbach’s alpha (1951) measures how well all items of a scale, such as a Likert scale of gender attitudes, hang together. Inter-rater reliability: agreement between different observers or coders, measured by statistics such as Cohen’s kappa.
Large Indian surveys such as NFHS and PLFS strengthen reliability through standardised schedules, trained enumerators and back-checks.
Example 25 (UPSC 2020, 10 marks): Discuss the importance and sources of hypothesis in social research.
Paper and question: Paper I, Q5(b)
Approach: Define hypothesis (Goode and Hatt), discuss its importance, then list its sources following Goode and Hatt with sociological and Indian examples.
A hypothesis is a testable statement of a relationship between variables; Goode and Hatt (1952) call it a proposition that can be put to a test to determine its validity.
Importance: it gives direction to research and prevents aimless data collection; it identifies the variables and the data required; it links theory with empirical evidence; it permits verification or falsification, which Popper saw as the mark of science; and tested hypotheses build theory, as Merton’s middle-range theories encouraged.
Sources (as classified by Goode and Hatt): first, general culture, such as the common belief that education weakens caste in marriage; second, scientific theory, such as Durkheim’s integration thesis applied to farmer suicides; third, analogies from other fields or societies, such as testing Sanskritisation among tribes; fourth, personal experience and observation, such as a researcher noticing that SHG membership seems to change women’s say at home. Previous research and its unanswered questions are a further source.
A good hypothesis must be clear, specific, testable and related to theory.
Example 26 (UPSC 2019, 10 marks): Explain the probability sampling strategies with examples.
Paper and question: Paper I, Q1(e)
Approach: Define probability sampling, then explain simple random, systematic, stratified and cluster or multi-stage strategies, each with an Indian example and a merit or limit.
Probability sampling gives every unit of the population a known, non-zero chance of selection, which removes selection bias and allows generalisation.
Simple random sampling: each unit has an equal chance, by lottery or random numbers; for example, 200 students drawn from a university’s enrolment list. It needs a complete sampling frame.
Systematic sampling: every nth unit after a random start, such as every tenth household in a village voter list; simple, but biased if the list has a periodic pattern. Stratified sampling: the population is divided into strata, such as SC, ST, OBC and others or rural and urban, and random samples are drawn from each, ensuring small groups are represented.
Cluster and multi-stage sampling: groups such as villages or urban blocks are selected first and households within them later; India’s NSS, PLFS and NFHS use stratified multi-stage designs because no national list of individuals exists. It is cheaper but has higher sampling error.
The choice depends on the frame, the diversity of the population and resources.
Example 27 (UPSC 2017, 10 marks): Illustrate with example the significance of variables in sociological research.
Paper and question: Paper I, Q1(c)
Approach: Define variables and their types briefly, then illustrate their significance through one worked Indian example (education and age at marriage) and Durkheim’s Suicide.
A variable is a measurable attribute that takes different values, such as caste, income or years of schooling. Variables are classified as independent (cause), dependent (effect), intervening and confounding.
Illustration: suppose a researcher asks whether women’s education delays marriage in India. ‘Women’s education’ (years of schooling) is the independent variable and ‘age at marriage’ the dependent variable. NFHS-5 (2019–21) shows that 23.3 percent of women aged 20–24 married before 18. Household wealth and caste are possible confounding variables, since richer families both educate daughters longer and marry them later; aspirations for employment may act as an intervening variable. Only by controlling the confounders can the researcher claim an effect of education.
Significance: variables turn concepts into measurable form, allow hypotheses to be stated and tested, enable causal analysis and comparison across groups and time, and guide sampling and statistical tools. Durkheim’s Suicide showed this by relating suicide rates to religion and family as indicators of integration.
However, meanings such as family honour need qualitative study alongside variables.
Example 28 (UPSC 2017, 10 marks): How can one resolve the issue of reliability and validity in the context of sociological research on inequality?
Paper and question: Paper I, Q4(c)
Approach: Explain why reliability and validity are especially difficult in research on inequality (measuring caste, class, poverty, discrimination), then suggest ways to resolve them with Indian examples such as MPI and Thorat and Attewell’s study.
Reliability is the consistency of a measure and validity its accuracy in capturing what it claims to measure. Research on inequality faces both problems because income, caste and discrimination are sensitive, multidimensional and often hidden: respondents under-report income or deny untouchability, and a single indicator can mislead.
Resolving validity: use multiple indicators; NITI Aayog’s multidimensional poverty index (14.96 percent poor in 2019–21) captures health, education and living standards that an income line misses. Measure behaviour, not only attitudes: Thorat and Attewell’s 2007 study sent matched job applications with upper-caste, Dalit and Muslim names to private firms and found that Dalit and Muslim applicants received fewer calls, revealing discrimination that surveys would miss. Triangulate surveys with ethnography, as Untouchability in Rural India (2006) did.
Resolving reliability: standardised, pre-tested schedules, trained interviewers, matching interviewers’ identity where possible, and repeated panels such as IHDS (2004–05, 2011–12).
Combining both gives findings on inequality that are consistent as well as true.
Example 29 (UPSC 2016, 10 marks): "Hypothesis is a statement of the relationship between two or more variables." Elucidate by giving example of poverty and illiteracy.
Paper and question: Paper I, Q3(c)
Approach: Explain the statement (Goode and Hatt’s idea of a testable proposition between variables), then elucidate it with the poverty–illiteracy example: variables, operationalisation, directional and null forms, testing with Indian data, and the problem of two-way causation.
A hypothesis links two or more variables in a testable form; Goode and Hatt describe it as a proposition that can be tested to determine its validity.
Example: ‘The higher the level of household poverty, the higher the rate of illiteracy.’ Poverty is the independent variable, operationalised through consumption expenditure or deprivation indicators; illiteracy is the dependent variable, measured by the Census definition of a literate person (aged seven and above who can read and write with understanding in any language). The null hypothesis states no relationship between them.
Testing: the hypothesis can be checked with state and district data. Census 2011 recorded literacy of about 94 percent in Kerala and about 62 percent in Bihar, while NITI Aayog’s MPI (2019–21) found about 0.55 percent poor in Kerala and about 34 percent in Bihar, supporting the hypothesis.
Yet correlation is not causation: illiteracy also causes poverty, and caste, gender and region act as confounding variables, which must be controlled before accepting the hypothesis.
Example 30 (UPSC 2015, 10 marks): What are variables? Discuss their role in experimental research.
Paper and question: Paper I, Q1(c)
Approach: Define variables and their types, then discuss their role in experimental research (manipulation, measurement, control, randomisation) with the Hawthorne studies and Indian field experiments.
Variables are measurable characteristics that take different values. In research they are classified as independent (cause), dependent (effect), intervening and extraneous or confounding.
Role in experimental research: an experiment tests cause and effect by deliberately changing the independent variable and measuring the change in the dependent variable, while holding extraneous variables constant. Subjects are randomly assigned to an experimental group, which receives the treatment, and a control group, which does not; randomisation spreads confounding variables equally, so the difference can be attributed to the treatment.
The Hawthorne studies (Western Electric, 1924–32) showed that an unplanned extraneous variable, the workers’ awareness of being observed, changed output. In India, randomised evaluations of remedial teaching in schools by Abhijit Banerjee, Esther Duflo and colleagues treated the teaching programme as the independent variable and learning scores as the dependent variable, while Thorat and Attewell (2007) varied only the caste or religious name on matched job applications.
Sociologists note that full control is rarely possible in social life, and experiments raise ethical and external validity problems.
Example 31 (UPSC 2015, 20 marks): Why is random sampling said to have more reliability and validity in research?
Paper and question: Paper I, Q3(a)
Approach: Define random sampling, explain why it raises reliability and validity (removal of selection bias, representativeness, estimation of error, replicability) with Indian survey examples, then qualify the claim with its limits and conclude.
Random sampling is a probability method in which every unit of the population has a known, usually equal, chance of selection. Reliability refers to consistency of results on repetition, and validity to the accuracy of conclusions, especially whether findings from the sample hold for the population (external validity).
Why it raises validity: first, chance rather than the researcher’s judgement decides who is selected, so conscious and unconscious selection bias is removed; a researcher choosing ‘typical’ villages may favour accessible roadside ones. Second, a random sample tends to mirror the population’s composition by caste, class and gender, so conclusions can be generalised. Third, probability theory allows the sampling error and confidence intervals to be calculated, so the precision of an estimate is known.
Why it raises reliability: the selection procedure is explicit and can be repeated by other researchers, and repeated random samples from the same population give results that cluster around the true value. This is why India’s NSS, PLFS and NFHS-5 (2019–21) use stratified multi-stage random designs.
Flow chart: Random selection → no selection bias → representative sample → measurable sampling error → generalisable (valid) and repeatable (reliable) findings.
The contrast is shown by the 1936 Literary Digest poll, whose huge non-random sample of telephone and car owners wrongly predicted Roosevelt’s defeat, while George Gallup’s smaller scientific sample predicted his victory.
Limits: random sampling needs a complete sampling frame, which is often missing for migrants or the homeless; non-response can reintroduce bias; small groups may be missed unless the sample is stratified; and it ensures only sampling validity, not measurement validity, since a poorly framed question remains invalid however good the sample. Hence random sampling is the best foundation for reliable and valid generalisation, but it must be combined with sound tools and careful fieldwork.
Mains points
- Definitions carry marks: define hypothesis (Goode and Hatt), triangulation (Denzin), content analysis (Berelson) or reliability and validity precisely before discussing them.
- Most questions ask for types plus strengths and limitations; a 2 × 2 table or a short flow chart (exploratory → descriptive → explanatory, or concept → variable → indicator) saves words and impresses examiners.
- Link every technique to its philosophy: positivism with surveys, reliability and representativeness; interpretivism with observation, validity and meaning.
- Indian examples are expected in every answer: Census 2011 and Census 2027, NFHS-5 (2019–21), PLFS and NSS sampling, IHDS panels, village studies of Srinivas, Dube, Béteille and Berreman, and Thorat and Attewell’s job-application study.
- End with a balanced judgement, usually methodological pluralism or mixed methods chosen according to the research question, and mention ethics (informed consent, privacy under the DPDP Act, 2023) where relevant.
Did you know?
- The 1936 Literary Digest poll asked over two million people and still predicted the wrong US president, while George Gallup’s far smaller but better-drawn sample got it right: in sampling, how you choose matters more than how many you choose.
Sociology Optional: All chapters
- Exam Pattern, Syllabus and Strategy
- Sociology: The Discipline
- Sociology as Science
- Research Methods and Analysis
- Sociological Thinkers: Marx and Durkheim
- Sociological Thinkers: Max Weber
- Sociological Thinkers: Parsons, Merton and Mead
- Stratification and Mobility
- Works and Economic Life
- Politics and Society
- Religion and Society
- Systems of Kinship
- Social Change in Modern Society
- Perspectives on the Study of Indian Society
- Impact of Colonial Rule on Indian Society
- Rural and Agrarian Social Structure
- Caste System
- Tribal Communities in India
- Social Classes in India
- Kinship, Family and Religion in India
- Visions of Social Change in India
- Rural and Agrarian Transformation in India
- Industrialisation and Urbanisation in India
- Politics and Society in India
- Social Movements in Modern India
- Population Dynamics
- Challenges of Social Transformation